Introduction
Over the past few years, cancer therapy has been
subject to continuous improvement. The effects of established
cytotoxic agents that have an irreversible lethal effect on rapidly
dividing cells (1) can be visualized
by various methods and are typically monitored by imaging response
criteria (e.g., RECIST) after a period of several weeks. For novel
anti-neoplastic agents, which are directed to specific targets of
the tumour lifecycle (2) and which
have a predominantly cytostatic activity, metabolic methods of
imaging are increasingly used for early response evaluation in
addition.
Crucial aspects of the tumour lifecycle that allow
for tumour growth, invasion and metastasis, are, among others,
based on angiogenesis and hypoxia (3,4). The
induction of new vessels ensures the tumour's supply with nutrients
and oxygen as well as the elimination of its metabolic waste
products (5). This knowledge has led
to the development of therapeutic agents that affect the tumour
vasculature, either by having an anti-angiogenic effect [e.g.,
anti-vascular endothelial growth factor (VEGF) or
anti-VEGF-receptor antibodies or small tyrosine kinase inhibitors]
(6,7),
or by actively destroying tumour vessels, as is the case with
vascular disrupting agents (VDA). A third group, the vascular
targeting agents (VTA), carries anti-tumour compounds by means of a
vasculature-targeting moiety (e.g., antibodies and peptides) into
the tumour vasculature (8).
VTA can also carry thrombogenic proteins that
activate blood coagulation within tumour vessels with subsequent
thrombosis and tumour vascular infarction (9). One of these pro-coagulatory proteins is
a soluble form of the human tissue factor (TF), also called
thromboplastin or factor III. TF is a transmembrane glycoprotein
that initiates the coagulation cascade by serving as the cell
surface receptor for factor VIIa (10); it is the main initiator of coagulation
in vivo (11). TF without its
transmembrane domain is called truncated TF (tTF) and only has a
marginal thrombogenic effect (12).
By fusing the tTF protein, e.g., to antibodies that are directed
against various tumour vessel markers and by targeting it to the
proximity of tumour vessel endothelium, its original coagulation
activity is partly restored (13,14).
However, when linking the RGD binding motif for integrins to the
N-terminus of the tTF protein, the resultant fusion protein only
induces thrombosis in small and medium sized tumour vessels
(15).
Molecules, which are primarily expressed on tumour
endothelial cells and can hence be used as targets for the peptide
sequences RGD (GRGDSP) and NGR (GNGRAHA), encompass several
receptors and integrins, e.g., αvβ3 and aminopeptidase N (CD13)
(16,17). In previous animal experiments it could
be shown that tTF proteins, which are C-terminally fused to the RGD
or NGR sequence, are capable of initiating tumour vessel thrombosis
resulting in an inhibition of tumour growth (9,12,18).
However, since VTA, such as tTF-NGR, have entered
early clinical trials in oncology, a detailed understanding of the
exact pharmacokinetics and pharmacodynamics of tTF-NGR, as well as
an investigation of its early image-based biological effects are
very important. In a recent study, the therapeutic effect of
tTF-NGR could already be visualized by using single photon emission
computed tomography (SPECT), contrast-enhanced ultrasonography
(CEUS), fluorescence reflectance imaging (FRI), and ultrasmall
superparamagnetic iron oxide magnetic resonance imaging (USPIO-MRI)
four to eight hours after treatment initiation (12,19,20).
Gadofosveset (MS-325) represents a ‘blood pool’ MR contrast agent
that is approved by the Food and Drug Administration (FDA) and
clinically available, and which can be used for MR-angiography
(MRA) and dynamic contrast-enhanced MRI (DCE-MRI) (21).
The aim of the animal study reported here was to
evaluate the diagnostic potential of DCE-MRI with regard to the
early in vivo visualization of the mechanism of action of
tTF-NGR. Considering the ongoing clinical application of tTF-NGR,
DCE-MRI promises to serve as a simple, quick and well-tolerated
imaging biomarker for prompt monitoring of the therapeutic response
of malignant tumours to anti-vascular treatment in humans.
Materials and methods
Cell culture and tumour xenograft
model
This study on animals was performed in agreement
with government regulations (Deutsches Tierschutzgesetz §8 Abs. 2)
and specifically approved in form of a project license. The
protocol was approved by the local committee on the ethics of
animal experiments at the LANUV (Landesamt für Natur, Umwelt und
Verbraucherschutz) of North Rhine-Westphalia (permit no./project
licence: 84-02.04.2012.A247). Athymic CD-1 nude mice for tumour
cell transplantation were purchased from Charles River Laboratories
(Sulzfeld, Germany) and acclimated to our animal-experiment
facility for at least one week before any experimentation. Mice
were maintained in individually ventilated cages (IVC) on a 12:12 h
light:dark cycle in a low-stress environment (22°C, 50% humidity,
low noise) and given food and water ad libitum. All MR experiments
were performed under isoflurane inhalation (FORENE®,
2–2.5%; Abbott GmbH & Co. KG, Wiesbaden, Germany), together
with 0.5–1 l/min O2 ventilation; all efforts were made
to minimize suffering.
In this study, we used the human glioblastoma cell
line U87 MG [American Type Culture Collection (ATCC); HTB-14;
Manassas, VA, USA]. The U87 cell line was cultured in MEM medium
supplemented with 10% fetal calf serum (FCS), pyruvate (2 mM) and
non-essential amino acids (2%). Cells were grown routinely in a
monolayer culture at 37°C in a 5% CO2 humidified
atmosphere. U87 cells (2×10⁶) were inoculated
subcutaneously (s.c.) in the anterior right flank of athymic female
CD-1 nude mice and allowed to grow until the tumour xenotransplants
reached a maximum volume of approximately 800–1,000
mm3.
Recently, it has been reported that the cell line
U87 MG is not representing the original glioblastoma cell line
established in 1968 at the University of Uppsala. As described by
Allen et al (22) and the
International Cell Line Authentication Committee (ICLAC), it is a
bona fide glioblastoma cell line whose origin is unknown.
Nevertheless, this misidentification issue is unlikely to affect
the outcomes of our study. The fact that the used cell line,
although it is not the original one, clearly has been identified as
a cancer/tumour cell line is thus fully consistent with our aim to
demonstrate the feasibility to evaluate the initial tumour vessel
infarction induced by the tTF-NGR protein by real-time MRI
monitoring.
MRI
Image acquisition was performed on a clinical 3.0
Tesla whole body MR system (Achieva; Philips Healthcare, Best, The
Netherlands) using a dedicated small animal solenoid coil with a
diameter of 40 mm (Philips Research Europe, Hamburg, Germany),
which was positioned upon the MR scanner's patient table. The
solenoid coil comprised a heating system in order to keep the body
temperature of the mice constant during the MR examination.
Although our institution is also in the possession of a 9.4 T MRI
scanner for small animals, we decided to conduct the study on a
clinical 3.0 T scanner in order to acquire data that can be easily
transferred to a clinical setting, respectively to human
beings.
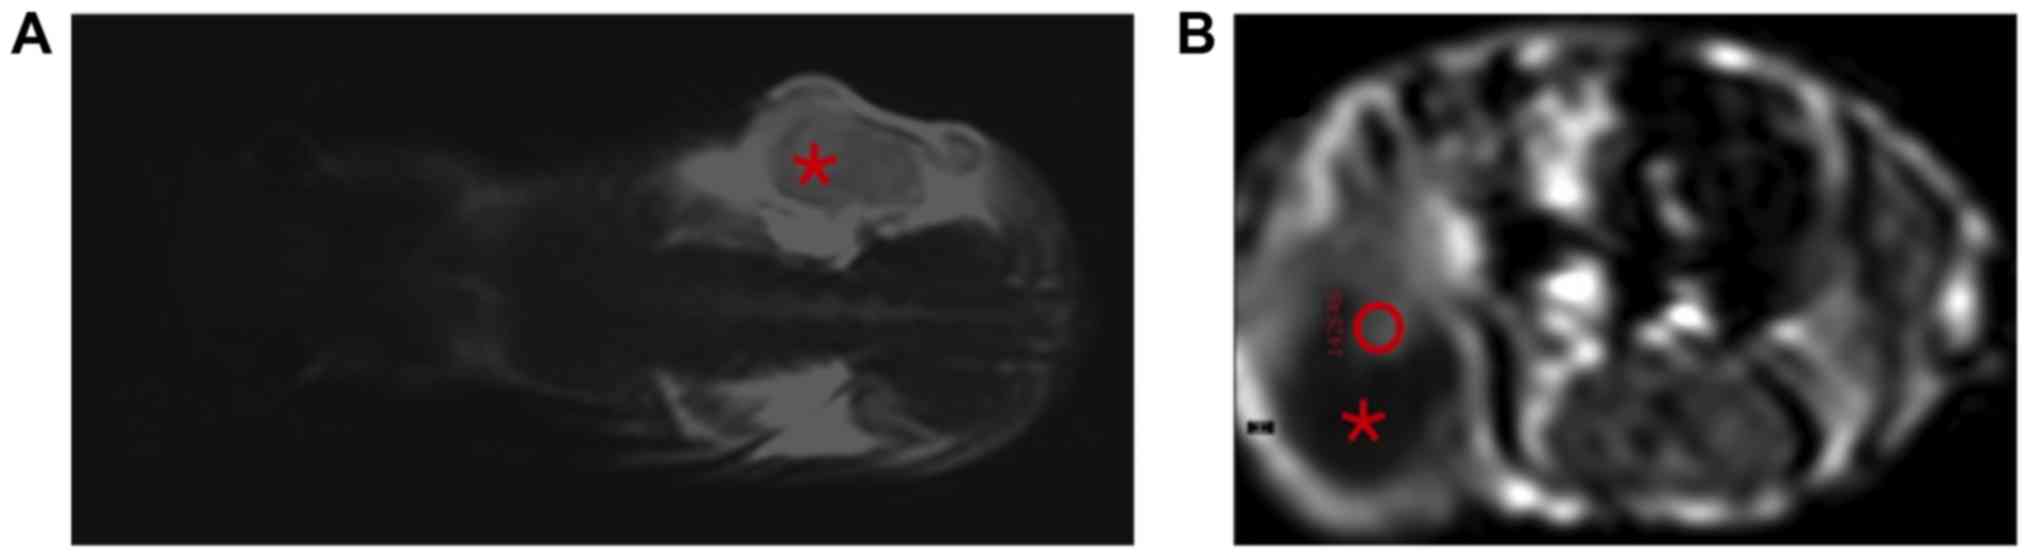
First, a T2-weighted turbo spin echo (TSE) sequence
was acquired in coronal sections for the purpose of anatomical
orientation (Fig. 1A). Subsequently,
a dynamic T1-weighted turbo field echo (TFE) sequence was conducted
in transversal sections (TE: 2.3 msec; TR: 10 msec; NSA: 1; slice
thickness: 2 mm; slice gap: 0.4 mm; flip angle: 15°; dynamic
phases: 250; dynamic phase time: 7.3 s, resulting in a total scan
time of 30:25 min). The T1w TFE sequence included preparation
pulses for signal stabilization, which had not been displayed for
data analysis.
Tumour treatment
Cloning, expression and purification of the tTF-NGR
protein were described in detail earlier (9,12,16,23). The
fusion protein tTF-NGR was diluted in phosphate-buffered saline
(PBS) and injected intravenously (i.v.) via a tail vein catheter at
a dose of 1 mg/kg body weight (BW) within the MR imaging trials. In
the course of the above-mentioned T1-weighted DCE-MRI sequence, 150
µl of gadofosveset (0.25 mmol/ml), a gadolinium-based ‘blood pool’
contrast agent (MS-325), were injected i.v. via a tail vein
catheter. After the first pass and once a ‘steady’ maximum contrast
intensity inside the tumour was obtained, appr. 150 µl of tTF-NGR
(1 mg/kg BW) were injected i.v. via a second tail vein catheter
(controls received saline solution (NaCl) instead), and the
contrast behaviour of the tumour was observed over the initial
period of 30 min.
Within the long-term anti-tumour therapy approach,
U87-tumour bearing nude mice were treated systemically by
intraperitoneal (i.p.) application of tTF-NGR (1 mg/kg BW; n=8)
every second day; the control group received 0.9% saline
accordingly (n=6).
Animal study population
A total of 40 tumour-bearing nude mice were included
in the MRI study; 16 animals were treated with tTF-NGR and 18 mice
served as controls. Six animals did not contribute to the analyses
due to technical difficulties, the impossibility of establishing
venous access and administering contrast agent and/or tTF-NGR/NaCl,
or the animal's death, respectively. During the imaging studies,
the animals were anaesthetized by isoflurane inhalation
(FORENE®, 2–2.5%), together with 0.5–1 l/min
O2 ventilation.
In order to avoid a bias, which is caused by unique
characteristics of the individual mice, four of the animals, which
originally served as controls, were subsequently (two days later)
used for an additional image acquisition procedure, however then
treated with tTF-NGR. This approach enabled the observation of the
changes in tumour perfusion following anti-vascular treatment
within the same individual as an internal validation of our
results.
Analysis of the contrast agent
dynamics
Once the acquisition of the MR sequences was
completed, the tumour perfusion was analysed by using the software
implemented on the MR scanner (IntelliSpace; Philips Healthcare).
First of all, the particular slice was chosen, in which the
contrast enhancement of the tumour was the most intensive
representing an index region of viable tumour tissue with
noticeable angiogenesis. In most cases, only a small part of the
tumours showed an enhancement, while the major part of the tumours
was non-enhancing and necrotic. This is caused by the rapid growth
of U87 tumour cells that results in an occasionally inhomogeneous
tumour texture. Then, a region of interest (ROI) was placed
manually within the contrast-enhancing part of the tumour
(exemplarily demonstrated in Fig.
1B). This approach is based on the subjective, individual
decision of the investigator, but as mentioned above, it seems to
be the best strategy concerning these inhomogeneous tumours in
these small animals.
In this way, the individual signal intensity values
of this ROI (dimensionless) were acquired over the course of the
dynamic MR sequence using IntelliSpace software. Time intensity
curves of the acquired 250 dynamic phases (every 7.3 sec) were
automatically plotted and corresponding quantitative values were
exported (see also the statistical analysis below). The AUC
describes the area under the concentration-time-curve of a
pharmaceutical (i.e., contrast agent) in the blood. The area is
typically computed starting at the time the contrast agent is
administered and ending when the concentration of the
pharmaceutical in the blood is negligible. The concentration is
measured at different time points and the trapezoidal rule is used
to estimate the AUC.
Statistical analysis
Intensity was defined as the brightness of the
murine tumours in the course of the dynamic T1-weighted TFE
sequence. The signal intensity (SI) values were displayed by the MR
system as dimensionless maps and exported in the form of a table.
SI was measured in each animal every 7.3 sec (repeated
measurements), which defines time points 0 (0 sec) to 250,
resulting in 1,825 sec (30 min and 25 sec) total duration of the
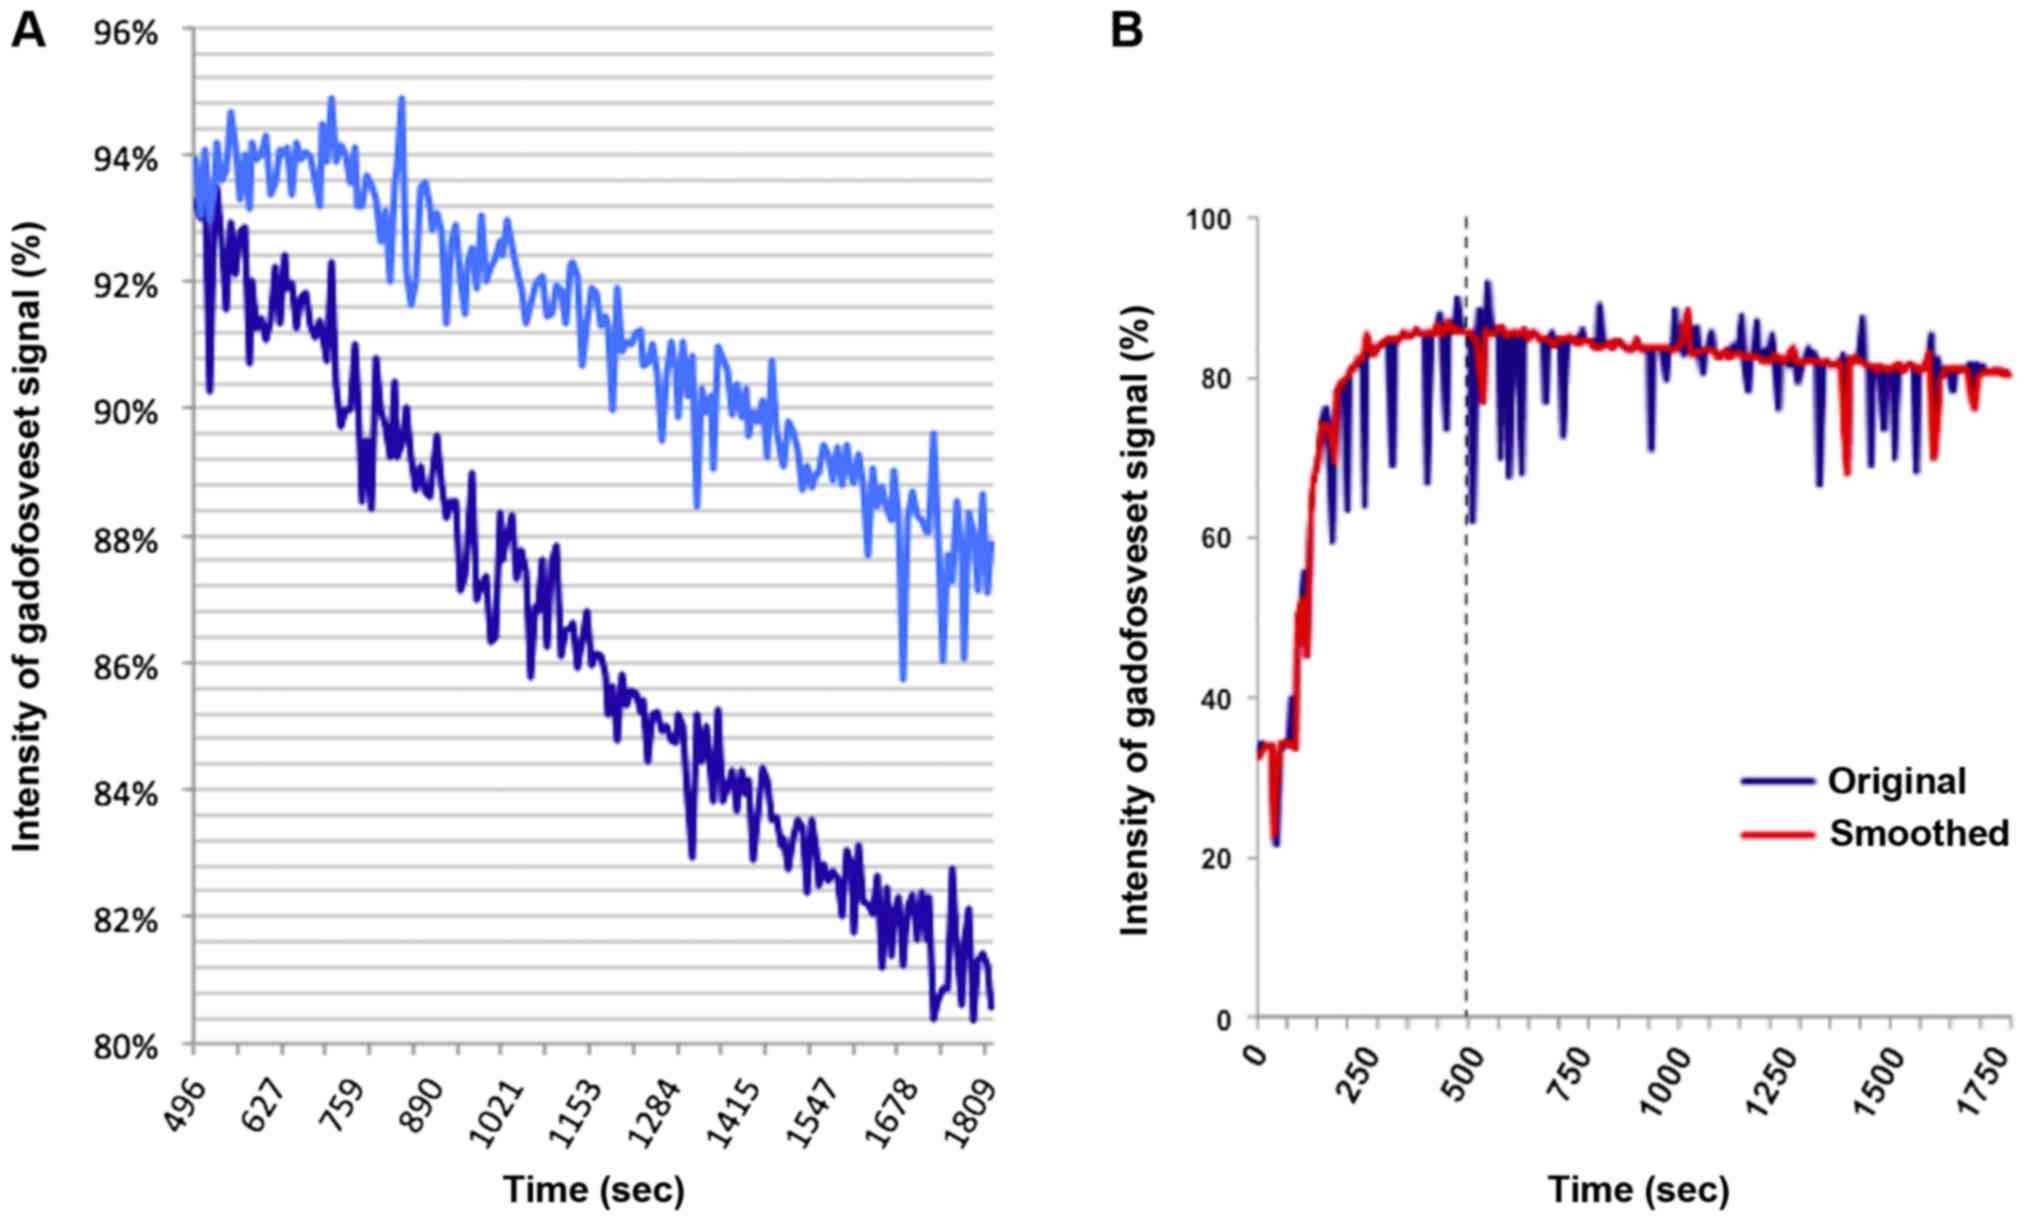
scan. The period from the beginning of the MR sequence
(administration of gadofosveset, time point 0 sec) until the
‘steady’ maximum intensity of the contrast agent after
approximately 496 sec (MR measurement point 68) was disregarded due
to the fact that the first pass effect was not of interest in view
of the therapeutic response in case of our actually proposed MR
technique. Statistical analyses comprised the subsequent dynamic
MR-sequence period starting at time point 69 with the injection of
tTF-NGR or saline, respectively, and ending at time point 250
(=1,825 sec) as exemplarily illustrated in Fig. 2A.
To verify the validity of the results and
experimental design, two different ways of statistical analyses
were performed. In a first approach, analyses of slope differences
of signal intensities like average decrease of intensity between
the tTF-NGR and the control group were calculated. This
investigation was done by computing the percentage change of the
signal intensity of the MR sequence curves at every time point in
correlation to the maximum enhancement at time point 69 (injection
of tTF-NGR or saline, respectively). In order to analyse the
relation between time, group, and intensity trend, a linear mixed
model with interaction terms was fitted. An AR1-covariance
structure was assumed for the random effects, the corresponding
significance level was 0.05; any other P-values are considered as
explorative. No adjustment for multiple testing was performed, the
local significance level is set to 0.05, P-values ≤0.05 correspond
to detected effects. Statistical analyses were performed using SPSS
software (IBM corporation, Armonk, NY, USA).
In another approach, the area under the curve (AUC)
for the different time periods was computed and compared in detail.
For each mouse, the observed SI values were normalized at the time
point where tTF-NGR (or NaCl, respectively) was injected. This
yields 34 normalized intensity curves, 16 for the tTF-NGR group and
18 for the control group, all having an equal intensity at time
point 69. The AUC from the injection (time point 69) of tTF-NGR or
saline, respectively, until the end of the observation period,
i.e., the MR sequence, was computed for each animal. Subsequently,
the average AUC of the group of mice, which was treated with
tTF-NGR, was compared to the average AUC of the control group using
a one-sided t-test. The significance level was set to 0.05, hence
P-values ≤0.05 correspond to detected effects.
In order to overcome the difficulty that the ROI
inside the tumours were exposed to breathing artefacts during the
relatively long MR sequence, the intensity curves had to be
smoothed (Fig. 2B). Therefore,
the relative increases jt in intensity from time point
t to time point t+1 (‘jumps’) were computed via
jt=it/it-1−1 (where it denotes the
intensity at time t). Then, the intensity values were
replaced in case two consecutive jumps in opposite direction,
larger than a given threshold α, were found. This means in exact
terms: The intensity values of time t were replaced, if: i)
|jt| > α and |jt-1| > α; ii) sign(jt) ≠
sign(jt-1); and iii) the intensity of t-1 was not
replaced.
Intensities were replaced by linear interpolation,
i.e. replaced intensity of time t was set to (it+1 +
it-1)/2. Results were computed using different thresholds:
α=1, 2 and 3%, respectively. The robustness of the obtained results
was verified by i) relaxing the assumption of using 500 sec (8.3
min) as a starting point by instead using 9 and 10 min,
respectively (both for normalization and as the AUC starting
point); ii) relaxing the assumption of using 30 min as the end
point by instead using 10, 15 and 20 min, respectively; iii)
computing the AUC from the time of maximum signal intensity to the
end of the observation period (again normalizing at the respective
maximum point and furthermore correcting for the time period over
which the AUC is computed by an appropriate scaling factor); and
iv) relaxing the assumption of equal variances by using a t-test
based on unequal variances. Statistical analyses were performed
using Excel (Microsoft Corporation, Redmond, WA, USA), the reported
results are based on normalized intensities.
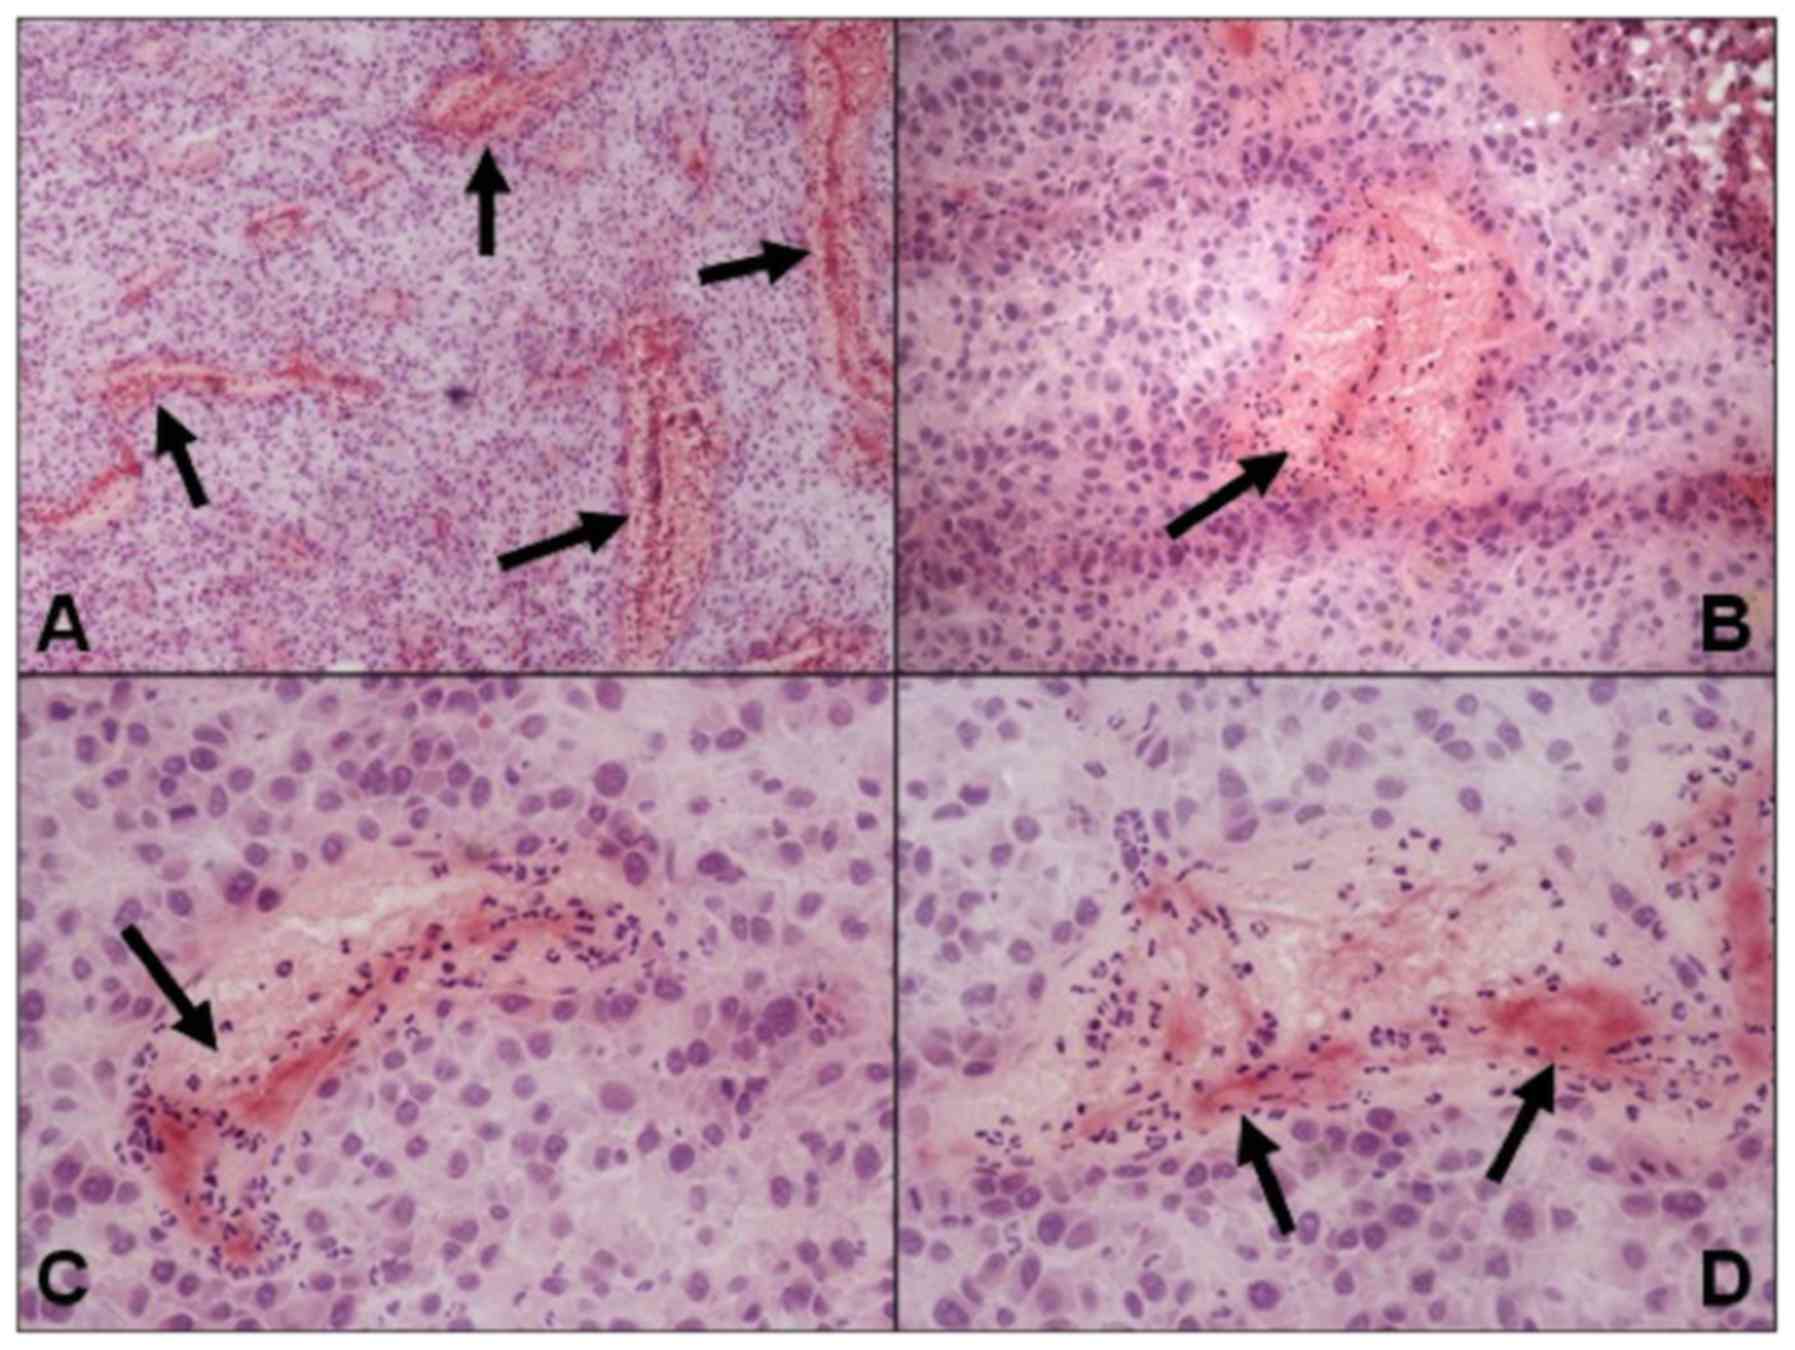
Histology
Histological analyses of U87-xenograft tumour
tissues were performed with cryo-conserved tissues according to
standard protocols. Briefly, tissues were embedded in Tissue-TEK
O.C.T. (Sakura, Alphen aan den Rijn, The Netherlands), snap-frozen
in liquid nitrogen, and stored at −85°C. Frozen samples were cut to
5 µm sections and transferred onto glass slides. For identification
of thrombosis, haematoxylin and eosin (H&E)-stained sections
were examined using conventional light microscopy for signs of
intratumoral thrombosis, vascular pooling and disruption, and
intratumoral haemorrhage.
Results
Contrast behaviour
After i.v. administration of gadofosveset, all
tumours (both in the treated animals and in the controls) showed an
intensive contrast enhancement within their perfused, non-necrotic
parts; the contrast agent was delivered approximately 70 sec after
the beginning of the sequence, and the ‘steady’ maximum intensity
was usually reached after approximately 400 sec, at the latest at
time point 68–69 (496–500 sec; see Fig.
2A). Saline or tTF-NGR (1 mg/kg bw), respectively, was
administered i.v. as soon as the maximum intensity of the contrast
agent was reached, approximately 500 sec after the scan was
started. The numerous spikes of the measured intensity curves are
caused by the respiration movements of the mice's bodies during the
relatively long MR sequence. In order to optimize the statistical
analyses, these breathing artefacts could mostly be eliminated by
the above described smoothing method (Fig. 2B), making the results more robust and
ensuring that outliers do not bias the results.
The intensity curves of the gadofosveset signal
within the contrast-enhancing parts of the control xenotransplants
show a lesser blood pool-contrast agent wash-out compared to the
tTF-NGR-treated tumours, as exemplarily demonstrated in Fig. 2A. Especially the stronger decrease of
the contrast intensity directly after tTF-NGR treatment initiation
in comparison to the controls can be interpreted as a positive
therapeutic effect in terms of thrombosis of tumour vessels leading
to decreased tumour blood perfusion.
Analysis of slope differences of
signal intensity curves
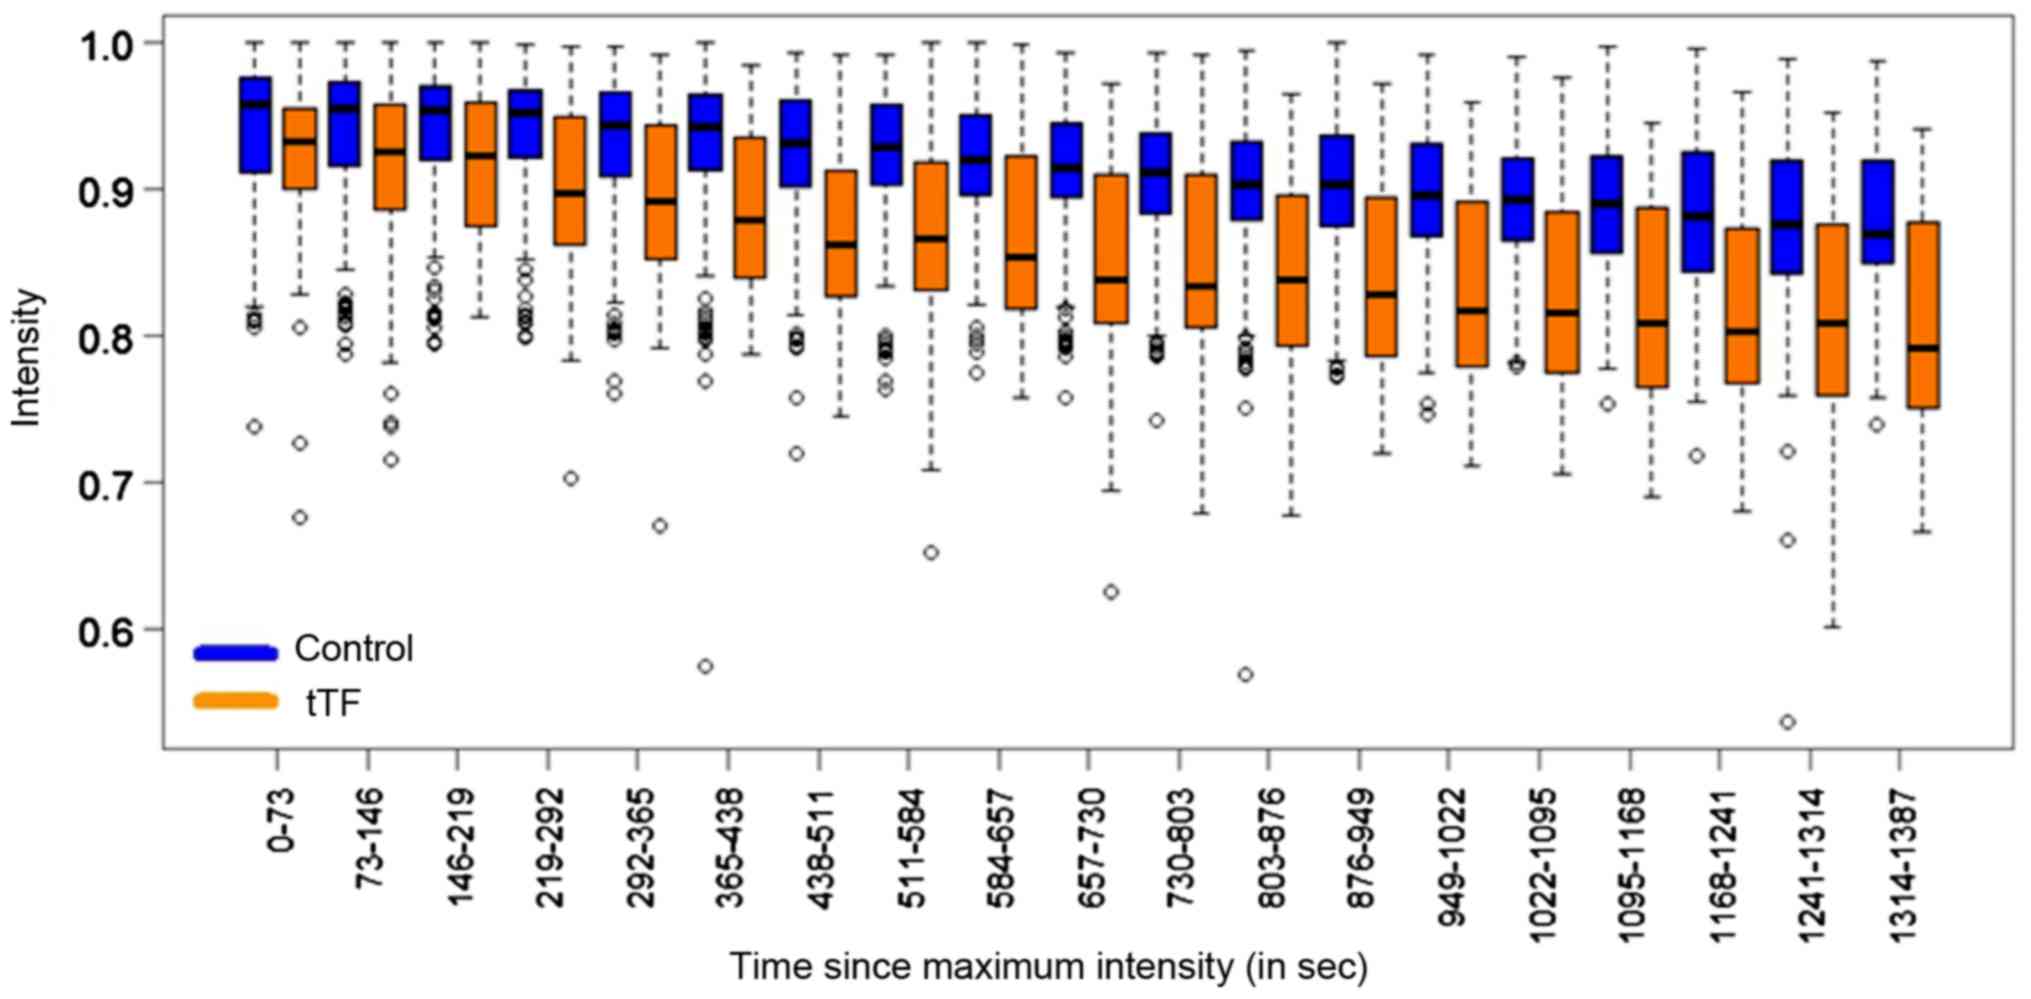
The investigation of the slope difference of signal
intensities between the control group and the tTF-NGR group
revealed an average decrease of intensity in the control group of
−0.00005250 per second (P<0.001, 95% CI: −0.00006705,
−0.00003794; Table I). In the group
of animals that received tTF-NGR, we determined a stronger average
decrease of intensity (−0.00009362 per second). This means that in
the tTF-NGR group, the average decrease of intensity is-0.00004112
per second greater than in the control group (P<0.001, 95% CI:
−0.00006705, −0.00003794). The differences of the intensities
between the control and the tTF-NGR group are displayed as a
boxplot illustration in Fig. 3.
 | Table I.Mixed model analysis, group and time
vs. intensity trend.a |
Table I.
Mixed model analysis, group and time
vs. intensity trend.a
| Parameter | Estimate | 95% confidence
interval | P-value |
|---|
| Intercept | 0.94651377 |
0.93527749–0.95775005 | <0.001 |
| Intensity decrease
in time/sec (control group): βtime | −0.00005250 | −0.06705,
−0.03794 | <0.001 |
| Additional group
effect (tTF-NGR): βtTF | −0.02049422 | −0.03687377,
−0.00411468 | 0.014 |
| Additional
intensity decrease/sec (tTF-NGR): βtime
tTF | −0.00004112 | −0.06233,
−0.01991 | <0.001 |
Thus, the contrast intensity within the tumours
exhibited a noticeably stronger initial decrease after treating the
mice with a therapeutic dose of tTF-NGR compared to the mice that
received NaCl only (−0.00009362 per second (tTF-NGR) vs.
−0.00005250 per second (control)). This corresponds to a 5.67%
additional wash-out effect of the tTF-NGR treated group (12.95%
decrease in contrast intensity between the start and the end of the
dynamic MRI course) compared to the control group (only 7.28%
decrease in contrast intensity). This effect is most likely
attributable to the therapeutic thrombogenic effect of tTF-NGR
within the tumour neovascularization and the consecutive reduction
of the tumour perfusion.
Analysis of AUC values of signal
intensity curves
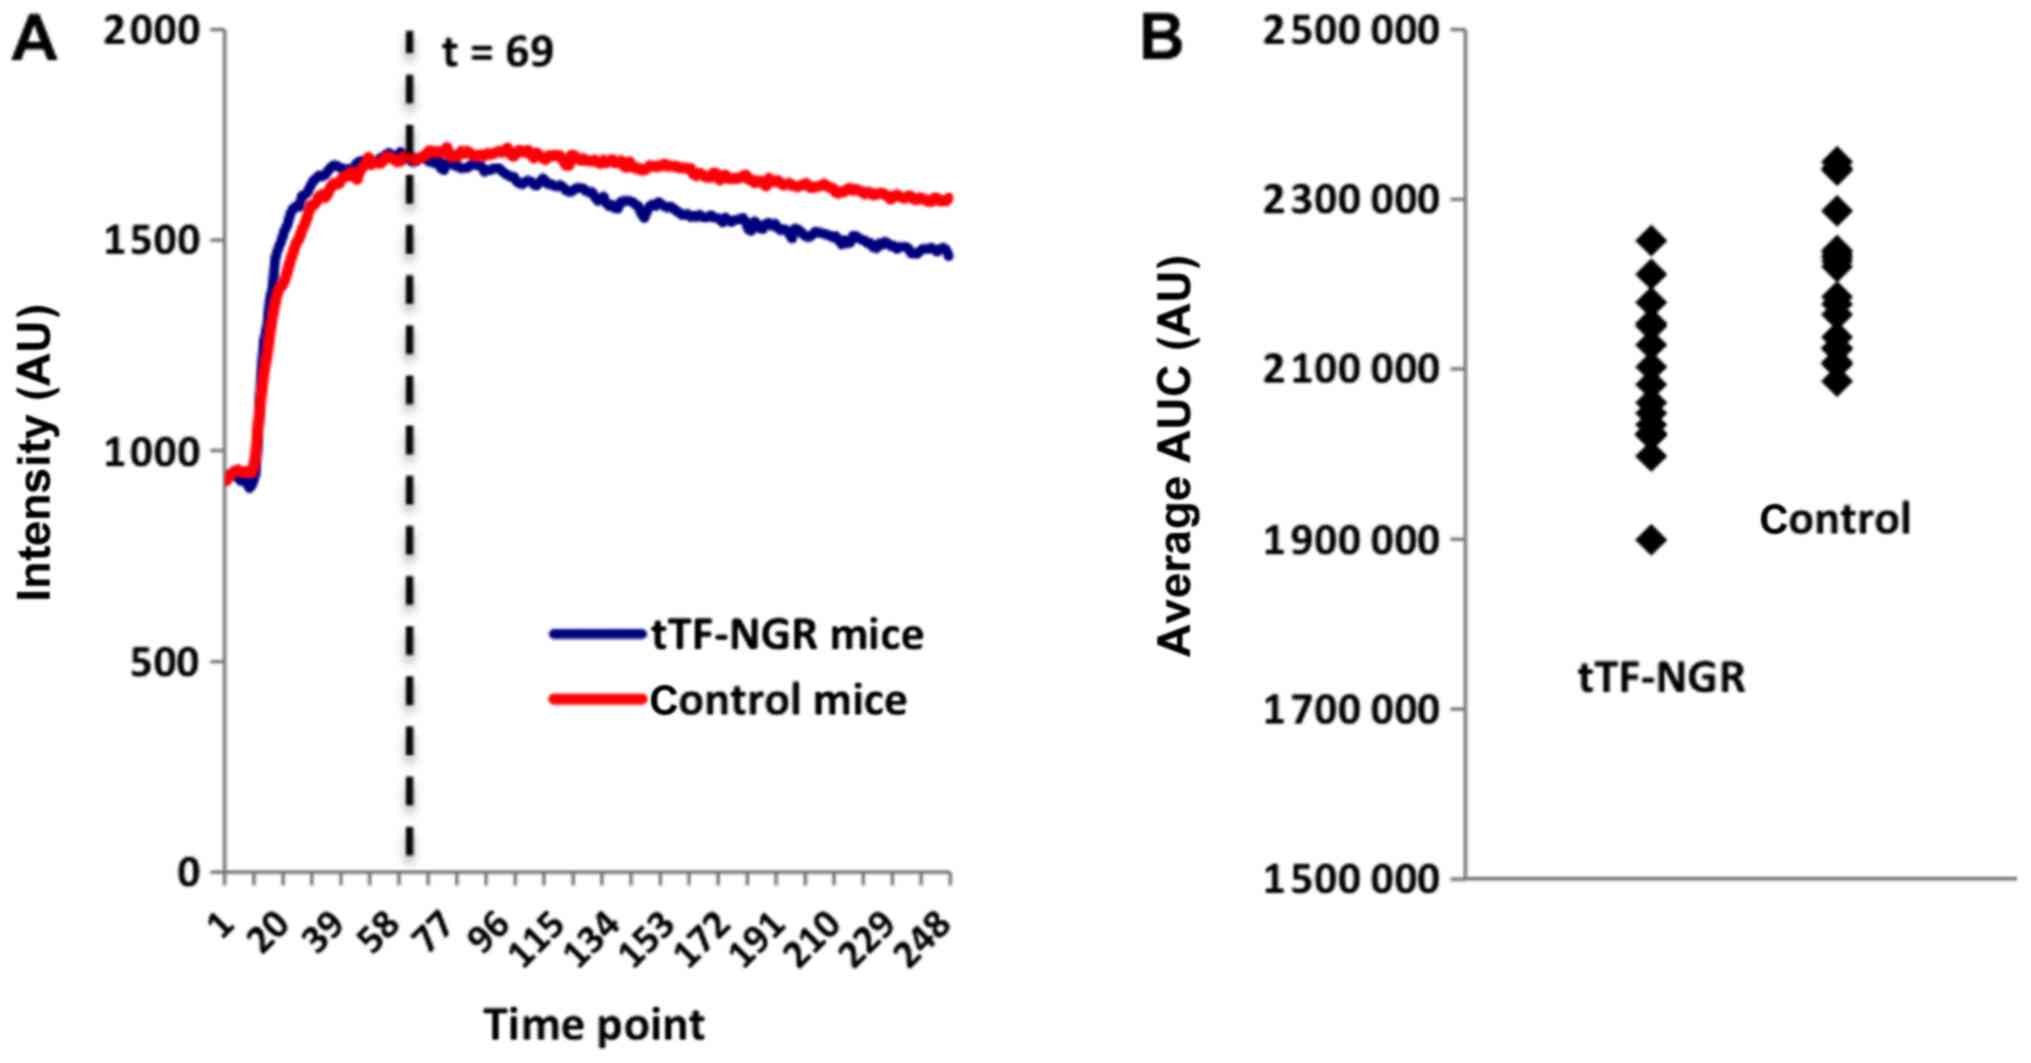
Within the more detailed statistical approach, in
which the AUC for the different time periods was normalized and
smoothed, the intensity curve of the control animals clearly shows
a ‘steady state’ of the blood-pool contrast agent with only a minor
decrease, which means that the i.v. application of NaCl does not
have a noticeable effect on the tumours' perfusion (Fig. 4A, red curve). In case of the animals
that were treated with tTF-NGR, the intensity curve shows a
significantly stronger decrease, i.e., the contrast agent is
eliminated from the tumours more quickly (Fig. 4A, blue curve).
Table II displays the
results of the t-tests for each of the above-mentioned time periods
(see chapter ‘statistical analysis’) for the threshold α=1%. The
main analysis, being the AUC from the time point where tTF-NGR/NaCl
was injected (starting point 8.3 min) until the end of the MR
sequence (first line in Table II),
shows significantly different average AUC values between the two
groups at a confidence level of 95% (Fig.
4B).
| Table II.Results of the Student's t-tests in
the different AUC.b |
Table II.
Results of the Student's t-tests in
the different AUC.b
| Scenario | Average AUC | Difference |
|
|---|
|
|
|
|
|---|
| Normalized,
min | AUC from time,
min | AUC to time,
min | tTF-NGR | Control | Absolute | Relative (%) |
P-valuea |
|---|
| 8.3 | 8.3 | 30 | 2,085,311 | 2,203,500 | 118,190 | 5.7 | 0.0002 |
|
|
| 20 | 1,137,358 | 1,184,841 |
47,483 | 4.2 | 0.0001 |
|
|
| 15 | 664,323 |
683,336 |
19,013 | 2.9 | 0.0003 |
|
|
| 10 | 171,830 |
174,408 |
2,578 | 1.5 | 0.0024 |
| 9 | 9 | 30 | 2,028,616 | 2,095,892 |
67,276 | 3.3 | 0.0398 |
|
|
| 20 | 1,072,341 | 1,092,977 |
20,636 | 1.9 | 0.0997 |
|
|
| 15 | 595,217 |
599,203 |
3,986 | 0.7 | 0.2969 |
|
|
| 10 | 98,617 |
98,094 |
−522 | −0.5 | 0.2732 |
| 10 | 10 | 30 | 1,947,814 | 2,016,251 |
68,437 | 3.5 | 0.0031 |
|
|
| 20 | 989,080 | 1,010,287 |
21,207 | 2.1 | 0.0054 |
|
|
| 15 | 510,565 |
515,004 |
4,439 | 0.9 | 0.0669 |
| Max intensity | Max intensity | 30 | 2,086,301 | 2,207,055 | 120,755 | 5.8 | 0.0009 |
Computing the AUC for shorter intervals, i.e., until
20, 15 and 10 min after the injection of the contrast agent, yields
similar results, except for the 10 min case, in which the
difference is not significantly different from 0. This, however,
represents a time period of only 1.7 min (from the time
tTF-NGR/NaCl was injected). As shown in Table II, the longer the time period
considered, the more pronounced the difference between the
respective average AUC values. Using the time point of the maximum
signal intensity as a starting point for the calculation of the AUC
again yields significantly different AUC averages at a confidence
level of 95%.
Table III shows the
P-values of the relevant t-tests for both unsmoothed and smoothed
curves, based on different thresholds (α=1, 2 and 3%,
respectively). While in Table II
only a smoothing threshold of α=1% was applied, Table III shows the respective results for
different smoothing thresholds and thus provides evidence of the
statistical robustness of the results obtained for α=1%. In fact,
for the main scenario (AUC starting at the time point where
tTF-NGR/NaCl was injected) the differences between the AUC of the
treated and the control mice are more pronounced using smoothed
curves. As shown by Table III, the
results are robust with respect to different values of the
smoothing threshold α (for α=2% the relative difference was 5.2%,
for α=3% 5.1%, and for the unsmoothed curves 4.9%, respectively).
Taken together, the average AUC values of the intensity curves of
the two groups (tTF-NGR vs. control) supply evidence to differ
significantly in most cases.
| Table III.P-values of the relevant Student's
t-tests.b |
Table III.
P-values of the relevant Student's
t-tests.b
| Scenario |
P-valuea |
|---|
|
|
|---|
| Normalized,
min | AUC from time,
min | AUC to time,
min | Unsmoothed | Smoothed α=1% | Smoothed α=2% | Smoothed α=3% |
|---|
| 8.3 | 8.3 | 30 | 0.0005 | 0.0002 | 0.0003 | 0.0004 |
|
|
| 20 | 0.0004 | 0.0001 | 0.0002 | 0.0002 |
|
|
| 15 | 0.0013 | 0.0003 | 0.0006 | 0.0006 |
|
|
| 10 | 0.1219 | 0.0024 | 0.0054 | 0.0081 |
| 9 | 9 | 30 | 0.0429 | 0.0398 | 0.0359 | 0.0643 |
|
|
| 20 | 0.0881 | 0.0997 | 0.0853 | 0.1326 |
|
|
| 15 | 0.1581 | 0.2969 | 0.2327 | 0.2830 |
|
|
| 10 | 0.3525 | 0.2732 | 0.3688 | 0.3404 |
| 10 | 10 | 30 | 0.0019 | 0.0031 | 0.0079 | 0.0052 |
|
|
| 20 | 0.0023 | 0.0054 | 0.0167 | 0.0082 |
|
|
| 15 | 0.0229 | 0.0669 | 0.2070 | 0.1114 |
| Max intensity | Max intensity | 30 | 0.0050 | 0.0009 | 0.0032 | 0.0030 |
As additional evidence, we used four mice first as
controls before they were treated with tTF-NGR in order to
eliminate inter-individual differences between the various animals.
Except for one animal (mouse no. 86), the AUC was greater in case
the mice received NaCl (Table IV).
The results of the smoothed intensity curves of the
contrast-enhancing parts of the tumours that were first treated
with NaCl and later with tTF-NGR show a minor decrease, but this
decrease is clearly greater following the treatment with tTF-NGR
(data not shown). Nevertheless, this approach enabled the
observation of the changes in tumour perfusion following
anti-vascular treatment within the same individual as an internal
validation of our results and thus the mode of action of the
tTF-NGR therapy.
| Table IV.Intra-individual differences in the
AUC.a |
Table IV.
Intra-individual differences in the
AUC.a
|
| AUC | Difference |
|---|
|
|
|
|
|---|
| Mouse | tTF-NGR | Control | Absolute | Relative (%) |
|---|
| no. 86 | 2,858,121 | 2,854,763 | −3
358 | −0.1 |
| no. 89 | 2,716,574 | 2,877,707 | 161,133 | 5.9 |
| no. 90 | 2,805,003 | 2,963,184 | 158,181 | 5.6 |
| no. 2219 | 2,751,362 | 2,822,809 |
71,447 | 2.6 |
Anti-tumour effects of the tTF-NGR
therapy
The aim of this study was to prove for the potential
of the gadofosveset-based real-time DCE-MRI in imaging the
initial therapeutic effect of the anti-vascular tTF-NGR
approach, which has been described in various tumour models
(9,12,16,19,23).
Because of this, no direct correlation of the in vivo
imaging data with tumour histology has been performed. However,
representative photographs of tTF-NGR-treated and
gadofosveset-imaged U87-tumour slides show extensive blood pooling
with subsequent vascular disruption due to thrombosis of blood
vessels (Fig. 5) while control
tumours exhibit no thrombosis (data not shown).
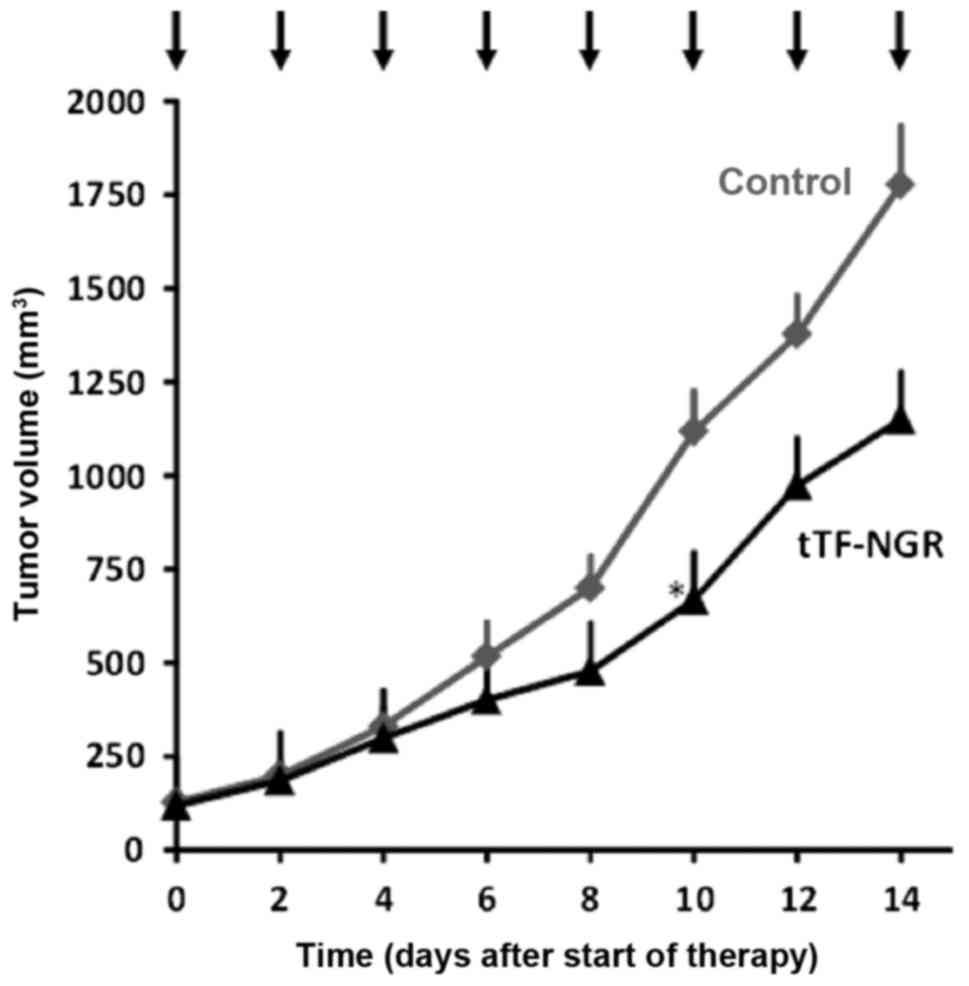
In order to also test for the long-term
therapeutic effect of tTF-NGR on U87 glioblastoma,
xenotransplant-bearing CD-1 nude mice were systematically treated
with tTF-NGR every second day for two weeks. Tumour growth was
significantly reduced by i.p. application of tTF-NGR compared to
the saline control group (Fig.
6).
Discussion
tTF-NGR is an innovative VTA that has been shown to
be effective in experimental cancer treatment, as it induces
thrombosis in tumour vessels and thereby leads to an inhibition of
tumour growth (9,12,16,18,19,23–25;
Figs. 5 and 6). The therapeutic effect of tTF-NGR has
already been visualized by different radiological and nuclear
medicine procedures four to eight hours after VTA therapy
initiation (18), but the clinically
applicable in vivo-visualization of its initial
effectiveness in real-time by gadofosveset-enhanced MRI has been
pending so far. The real-time visualization and early assessment of
the therapeutic effectiveness of tTF-NGR by means of an imaging
procedure that can be easily transferred to humans is particularly
essential with regard to its clinical implementation, since an
objective and fast imaging biomarker for monitoring the
thrombogenic effects of tTF-NGR, i.e., the therapeutic response of
malignant diseases, is indispensable for an adequate cancer
treatment regimen (26). Furthermore,
potential non-responders could be timely identified.
The histopathological, i.e.,
ex-vivo-measurement of vessel density is a reference
standard in order to determine the vascularization rate of a
tumour. But since this method has the disadvantage of invasiveness,
dynamic contrast-enhanced MRI (DCE-MRI) is the imaging modality
most frequently used in preclinical and clinical studies to assess
the effect of VTA and VDA (27,28). In
this manner, the anti-vascular effect can be monitored
non-invasively by using different kinetic parameters (e.g.,
Ktrans) (29). However,
both a robust measurement of the vascular input function (VIF) and
the T1-mapping for adequate pharmacokinetic modelling are not
standardized yet and are beyond that extremely challenging in
mice.
In the present animal study, we investigated the
mere contrast intensity within the tumours using a ‘blood pool’
contrast agent in a dynamic T1-weighted TFE-sequence, a potentially
simple and robust parameter in DCE-MRI, due to the fact that
kinetic parameters for the analysis of the vessel permeability
(such as Ktrans) could not be used for ‘blood pool’
contrast agents, which represent an intravascular distribution
without relevant vessel leakage. The underlying assumption is that
viable tumour parts demonstrate an intense ‘steady’ contrast
enhancement following the i.v. administration of a ‘blood pool’
contrast agent (gadofosveset), while effective tTF-NGR treatment
results in a clear reduction of the tumour's perfusion and
therefore its contrast enhancement.
Gadofosveset (MS-325) represents an FDA approved
‘blood pool’ contrast agent that was previously marketed as
Vasovist® (Bayer Schering Pharma AG, Berlin, Germany),
but which is presently not available anymore. Likewise,
gadofosveset trisodium (ABLAVAR®; Lantheus Medical
Imaging, Inc., North Billerica, MA, USA) was recently withdrawn by
its manufacturer due to poor sales, besides it is no longer
authorized in the EU. Nevertheless, other i.v. contrast agents such
as gadobenate dimeglumine (MultiHance®; Bracco Imaging
GmbH, Konstanz, Germany), which has a comparatively high protein
binding and therefore shows characteristics of ‘blood pool’
contrast agents, may possibly be used as contrast agent for
real-time MRI of the tumour response to anti-vascular drugs. This
possibility should be subject to future research, even though in
the EU, MultiHance® is currently only approved for MR
imaging of the liver (30).
ABLAVAR® and Vasovist® are ‘blood pool’
contrast agents demonstrating a contrast behaviour that is
analogous to the behaviour of long circulating USPIO. The potential
of USPIO in terms of the visualization of the therapeutic effect of
anti-vascular substances has already been shown (31), but USPIO are presently not clinically
approved for imaging in humans.
The aim of this study was to examine the potential
of gadofosveset-based real-time DCE-MRI in evaluating the initial
mechanism of action (MOA) of anti-vascular tTF-NGR. By
investigation of the slope difference of signal intensities, we
could show that the contrast intensity within the tumours, measured
only for approximately 23 min following the application of tTF-NGR
or control vehicle, respectively, reflecting the initial short-time
effect of tTF-NGR, exhibited a statistically significantly stronger
decrease when treating the mice with a therapeutic dose of tTF-NGR
compared to the mice that received NaCl only. This corresponds to a
5.67% additional wash-out effect of the tTF-NGR-treated group:
12.95% decrease in contrast intensity between the start and the end
of the 1,387-sec dynamic MRI course compared to the control group
with only 7.28% decrease in contrast intensity. The main analysis
of the differences between the AUC of the treated and the control
mice from the time point where tTF-NGR/NaCl was injected (starting
point 8.3 min) until the end of the MR sequence (see first line in
Table II) shows significantly
different average AUC values between the two groups at a confidence
level of 95%, and the results are more pronounced using smoothed
curves (Fig. 4B).
In summary, both statistical evaluations prove for
the thrombogenic effect of tTF-NGR within the tumour
neovascularization directly leading to a haemorrhagic infarction of
the tumour tissue (Fig. 5) and
simultaneously a reduced tumour perfusion. As we measured only for
approximately 23 min following the application of tTF-NGR or
control vehicle, respectively, our measurements only reflect the
initial short-time effect of tTF-NGR, which as the curves
separated, became bigger over time. Our finding concerning the MOA
of tTF-NGR is also substantiated by the fact that we were able to
show these differences in the behaviour of the contrast intensity
within one and the same animals following sham and tTF-NGR therapy,
respectively, which eliminates possibly existing inter-individual
differences between various animals. The fact that the mice in the
control group also showed a minor decrease in contrast intensity is
related to the physiological renal elimination of the contrast
agent. Both the quantification of the amount of vascular infarction
induced by tTF-NGR and the characterization of its maximum are
beyond the scope of this MR evaluation study, since we could only
observe the effect over a short initial time course. In MR imaging
performed earlier with USPIO and 4–8 h after application of
tTF-NGR, we have observed a considerably larger decrease of the
vascular volume fraction inside the tumours treated with tTF-NGR in
comparison to saline controls (12,19).
Further desirable investigations beyond the scope of
this study are the comparison of DCE-MRI with additional MR
sequences such as diffusion-weighted imaging (DWI), as this method
allows for an early quantification of the changes within the tumour
tissue (cellularity, oedema and microperfusion) following VTA
treatment (31,32), the absolute quantification of the
T1/R1 relaxation by modern T1 mapping, and the correlation of our
MRI results with the actual histopathological changes within the
tumours following tTF-NGR treatment. In addition, other sequences,
e.g., giving tTF-NGR for vessel occlusion before gadofosveset and
subsequently measuring block of contrast tumour uptake might be
interesting to study for clinical application. Indeed, we have
started a phase I trial with tTF-NGR applied as an one-hour
infusion via a central venous line in late stage cancer patients
and we plan to perform randomised phase II trials with the
combination chemotherapy +/- tTF-NGR (24). These trials will be guided by repeated
MR examinations to assess for blood flow decrease in tumour signal
lesions envisaging us to transfer the gadofosveset-enhanced DCE-MRI
as real-time assessment of the therapeutic effectiveness of tTF-NGR
in order to monitor its thrombogenic effects, to identify potential
non-responders etc. at an early stage of the tTF-NGR therapy.
In summary, we have shown that dynamic
gadofosveset-enhanced MRI enables an early in vivo
visualization of the MOA of anti-vascular drugs in malignant
tumours in real-time. In respect of the clinical use of tTF-NGR,
gadofosveset-enhanced DCE-MRI should be further studied as a
simple, quick and non-invasive imaging technique for monitoring the
therapeutic response and an easy-to-handle surrogate biomarker for
the treatment surveillance in individuals.
Acknowledgements
Not applicable.
Funding
The present study was supported by grants from the
Deutsche Krebshilfe (grant no. DKH 110886), the
Else-Kröner-Fresenius-Stiftung (grant no. 2013_A284), the Deutsche
Forschungsgemeinschaft (grant no. Cluster of Excellence EXC
1003-Cells in Motion), the Sybille-Hahne-Stiftung, and the
Innovative Medizinische Forschung (IMF, Münster).
Availability of data and materials
The datasets used and/or analysed during the current
study are available from the corresponding author on reasonable
request.
Authors' contributions
AH performed the MRI scans, collected and
interpreted the data and wrote the manuscript. TP, RM, WB and CB
designed the study. RK and MB performed the statistical analyses.
WH critically reviewed the manuscript for important intellectual
content, made substantial contributions to the study's conception
and enabled the realisation of the MR experiments and the
collaboration between the Departments of Radiology and Oncology. CS
designed the study, was responsible for the care and treatment of
the animals, and collected and interpreted the data. All authors
read and approved the final manuscript.
Ethics approval and consent to
participate
The present study on animals was performed in
agreement with German regulations (Tierschutzgesetz §8 Abs.
2) and specifically approved in the form of a project license.
The protocol was approved by the local committee on the Ethics of
Animal Experiments at the LANUV (Landesamt für Natur, Umwelt und
Verbraucherschutz) of North Rhine-Westphalia (permit no./project
license: 84–02.04.2012.A247).
Patient consent for publication
Not applicable.
Competing interests
The authors declare that they have no competing
interests.
References
|
1
|
Gwyther SJ and Schwartz LH: How to assess
anti-tumour efficacy by imaging techniques. Eur J Cancer. 44:39–45.
2008. View Article : Google Scholar : PubMed/NCBI
|
|
2
|
Contractor KB and Aboagye EO: Monitoring
predominantly cytostatic treatment response with 18F-FDG PET. J
Nucl Med. 50 Suppl 1:97S–105S. 2009. View Article : Google Scholar : PubMed/NCBI
|
|
3
|
de Bazelaire C, Alsop DC, George D,
Pedrosa I, Wang Y, Michaelson MD and Rofsky NM: Magnetic resonance
imaging-measured blood flow change after antiangiogenic therapy
with PTK787/ZK 222584 correlates with clinical outcome in
metastatic renal cell carcinoma. Clin Cancer Res. 14:5548–5554.
2008. View Article : Google Scholar : PubMed/NCBI
|
|
4
|
Padhani AR, Krohn KA, Lewis JS and Alber
M: Imaging oxygenation of human tumours. Eur Radiol. 17:861–872.
2007. View Article : Google Scholar : PubMed/NCBI
|
|
5
|
Carmetliet P: Mechanisms of angiogenesis
and arteriogenesis. Nat Med. 6:389–395. 2000. View Article : Google Scholar : PubMed/NCBI
|
|
6
|
Kerbel RS: Antiangiogenic therapy: A
universal chemosensitization strategy for cancer? Science.
312:1171–1175. 2006. View Article : Google Scholar : PubMed/NCBI
|
|
7
|
Murphy DA, Makonnen S, Lassoued W, Feldman
MD, Carter C and Lee WM: Inhibition of tumor endothelial ERK
activation, angiogenesis, and tumor growth by sorafenib
(BAY43-9006). Am J Pathol. 169:1875–1885. 2006. View Article : Google Scholar : PubMed/NCBI
|
|
8
|
Thorpe PE: Vascular targeting agents as
cancer therapeutics. Clin Cancer Res. 10:415–427. 2004. View Article : Google Scholar : PubMed/NCBI
|
|
9
|
Kessler T, Schwöppe C, Liersch R,
Schliemann C, Hintelmann H, Bieker R, Berdel WE and Mesters RM:
Generation of fusion proteins for selective occlusion of tumor
vessels. Curr Drug Discov Technol. 5:1–8. 2008. View Article : Google Scholar : PubMed/NCBI
|
|
10
|
Samad F and Ruf W: Inflammation, obesity,
and thrombosis. Blood. 122:3415–3422. 2013. View Article : Google Scholar : PubMed/NCBI
|
|
11
|
Eisenreich A: Regulation of vascular
function on posttranscriptional level. Thrombosis. 2013:9487652013.
View Article : Google Scholar : PubMed/NCBI
|
|
12
|
Bieker R, Kessler T, Schwöppe C, Padró T,
Persigehl T, Bremer C, Dreischalück J, Kolkmeyer A, Heindel W,
Mesters RM and Berdel WE: Infarction of tumor vessels by
NGR-peptide directed targeting of tissue factor. Experimental
results and first-in-man experience. Blood. 113:5019–5027. 2009.
View Article : Google Scholar : PubMed/NCBI
|
|
13
|
Nilsson F, Kosmehl H, Zardi L and Neri D:
Targeted delivery of tissue factor to the ED-B domain of
fibronectin, a marker of angiogenesis, mediates the infarction of
solid tumors in mice. Cancer Res. 61:711–716. 2001.PubMed/NCBI
|
|
14
|
Liu C, Huang H and Doñate F:
Prostate-specific membrane antigen directed selective thrombotic
infarction of tumors. Cancer Res. 62:5470–5475. 2002.PubMed/NCBI
|
|
15
|
Hu P, Yan J, Sharifi J, Bai T, Khawli LA
and Epstein AL: Comparison of three different targeted tissue
factor fusion proteins for inducing tumor vessel thrombosis. Cancer
Res. 63:5046–5053. 2003.PubMed/NCBI
|
|
16
|
Schwöppe C, Kessler T, Persigehl T,
Liersch R, Hintelmann H, Dreischalück J, Ring J, Bremer C, Heindel
W, Mesters RM and Berdel WE: Tissue-factor proteins induce
occlusion of tumor vessels. Thromb Res. 125 Suppl 2:S143–S150.
2010. View Article : Google Scholar : PubMed/NCBI
|
|
17
|
Pasqualini R, Koivunen E, Kain R,
Lahdenranta J, Sakamoto M, Stryhn A, Ashmun RA, Shapiro LH, Arap W
and Ruoslahti E: Aminopeptidase N is a receptor for tumor-homing
peptides and a target for inhibiting angiogenesis. Cancer Res.
60:722–727. 2000.PubMed/NCBI
|
|
18
|
Kessler T, Bieker R, Padró T, Schwöppe C,
Persigehl T, Bremer C, Kreuter M, Berdel WE and Mesters RM:
Inhibition of tumor growth by RGD peptide-directed delivery of
truncated tissue factor to the tumor vasculature. Clin Cancer Res.
11:6317–6324. 2005. View Article : Google Scholar : PubMed/NCBI
|
|
19
|
Persigehl T, Ring J, Bremer C, Heindel W,
Holtmeier R, Stypmann J, Claesener M, Hermann S, Schäfers M, Zerbst
C, et al: Non-invasive monitoring of tumor-vessel infarction by
retargeted truncated tissue factor tTF-NGR using multi-modal
imaging. Angiogenesis. 17:235–246. 2014. View Article : Google Scholar : PubMed/NCBI
|
|
20
|
Persigehl T, Matuszewski L, Kessler T,
Wall A, Meier N, Ebert W, Berdel WE, Heindel W, Mesters R and
Bremer C: Prediction of antiangiogenic treatment efficacy by iron
oxide enhanced parametric magnetic resonance imaging. Invest
Radiol. 42:791–796. 2007. View Article : Google Scholar : PubMed/NCBI
|
|
21
|
Sabach AS, Bruno M, Kim D, Mulholland T,
Lee L, Kaura S and Lim RP: Gadofosveset trisodium: Abdominal and
peripheral vascular applications. AJR Am J Roentgenol.
200:1378–1386. 2013. View Article : Google Scholar : PubMed/NCBI
|
|
22
|
Allen M, Bjerke M, Edlund H, Nelander S
and Westermark B: Origin of the U87MG glioma cell line: Good news
and bad news. Sci Transl Med. 8:354re32016. View Article : Google Scholar : PubMed/NCBI
|
|
23
|
Schwöppe C, Zerbst C, Fröhlich M,
Schliemann C, Kessler T, Liersch R, Overkamp L, Holtmeier R,
Stypmann J, Dreiling A, et al: Anticancer therapy by tumor vessel
infarction with polyethylene glycol conjugated retargeted tissue
factor. J Med Chem. 56:2337–2347. 2013. View Article : Google Scholar : PubMed/NCBI
|
|
24
|
Persigehl T, Bieker R, Matuszewski L, Wall
A, Kessler T, Kooijman H, Meier N, Ebert W, Berdel WE, Heindel W,
et al: Antiangiogenic tumor treatment: Early noninvasive monitoring
with USPIO-enhanced MR imaging in mice. Radiology. 244:449–456.
2007. View Article : Google Scholar : PubMed/NCBI
|
|
25
|
Stucke-Ring J, Ronnacker J, Brand C,
Höltke C, Schliemann C, Kessler T, Schmidt LH, Harrach S, Mantke V,
Hintelmann H, et al: Combinatorial effects of doxorubicin and
retargeted tissue factor tTF-NGR by intratumoral entrapment of
doxorubicin and proapoptotic increase of tumor vascular infarction.
Oncotarget. 7:82458–82472. 2016. View Article : Google Scholar : PubMed/NCBI
|
|
26
|
Höink AJ, Heindel W and Buerke B:
Radiological evaluation of the therapeutic response of malignant
diseases: Status quo, innovative developments and requirements for
radiology. Rofo. 186:927–936. 2014. View Article : Google Scholar : PubMed/NCBI
|
|
27
|
Zweifel M and Padhani AR: Perfusion MRI in
the early clinical development of antivascular drugs: Decorations
or decision making tools? Eur J Nucl Med Mol Imaging. 37 (Suppl
1):S164–S182. 2010. View Article : Google Scholar : PubMed/NCBI
|
|
28
|
Salmon BA, Salmon HW and Siemann DW:
Monitoring the treatment efficacy of the vascular disrupting agent
CA4P. Eur J Cancer. 43:1622–1629. 2007. View Article : Google Scholar : PubMed/NCBI
|
|
29
|
Kim KW, Lee JM, Jeon YS, Lee IJ, Choi Y,
Park J, Kiefer B, Kim C, Han JK and Choi BI: Vascular disrupting
effect of CKD-516: Preclinical study using DCE-MRI. Invest New
Drugs. 31:1097–1106. 2013. View Article : Google Scholar : PubMed/NCBI
|
|
30
|
European Medicines Agency: EMA's final
opinion confirms restrictions on use of linear gadolinium agents in
body scans. http://www.ema.europa.eu/ema/index.jsp?curl=pages/news_and_events/news/2017/07/news_detail_002780.jsp&mid=WC0b01ac058004d5c1Jul.
21. 2017
|
|
31
|
Rezai P, Pisaneschi MJ, Feng C and Yaghmai
V: A radiologist's guide to treatment response criteria in
oncologic imaging: Functional, molecular, and disease-specific
imaging biomarkers. AJR Am J Roentgenol. 201:246–256. 2013.
View Article : Google Scholar : PubMed/NCBI
|
|
32
|
Thoeny HC and Ross BD: Predicting and
monitoring cancer treatment response with diffusion-weighted MRI. J
Magn Reson Imaging. 32:2–16. 2010. View Article : Google Scholar : PubMed/NCBI
|