Introduction
Esophageal cancer (EC) is the fifth most commonly
diagnosed type of cancer and the fourth most common cause of
cancer-associated mortality in China (1). Half of the newly diagnosed cases of
esophageal squamous cell carcinoma (ESCC) every year occur in
China. High incidence and mortality rates of ESCC have been
reported in certain areas, including the Taizhou region in eastern
China, the Taihang Mountains region in north-central China and
Chaoshan district in Guangdong province (2,3). The
highest risk factors for oral cancer and EC are tobacco smoke and
high alcohol consumption, which jointly account for ~90% of all
cases (4). Most patients with EC are
diagnosed in middle or advanced stages, and despite recent clinical
advances in EC treatment, the 5-year survival rate is <10%
(5). Existing therapies include
chemotherapy and radiotherapy, which display limited effectiveness,
essentially due to the high incidence of metastasis (1). It is therefore crucial to determine the
key factors that regulate EC metastasis in order to determine novel
antitumor targets and extend the survival of patients with EC.
Forkhead-box (FOX) A (FOXA) functions as a
transcription factor in numerous biological and pathological
processes (6). The FOXA family
includes three members, FOXA1, FOXA2 and FOXA3, which contain a
highly conserved winged-helix forkhead DNA-binding domain that is
involved in transcriptional regulation and DNA repair (7). All FOXA members contain overlapping
patterns of expression in certain organs derived from the embryonic
endoderm, including liver, stomach and intestine (6), and are involved in the establishment of
developmental competence for these tissues (8,9).
Previous studies that used FOXA1- or FOXA2-specific knockout mice
reported that FOXA1 and FOXA2 can compensate for the function of
one another in a cell type-specific manner (10,11).
Additional studies demonstrated that FOXA1 and FOXA2 present
overlapping roles in development and differentiation (12,13).
However, whether FOXA3 has similar compensatory roles for the
function of other FOXA members remains unknown.
FOXA members can modify the transcription factors
network, and modulate metaplasia and neoplasia of endoderm-derived
tissues in adults (14–16). Previous studies have reported that
FOXA1 is strongly associated with tumor progression, particularly
metastasis in various types of cancer (17,18).
Furthermore, FOXA2 can promote tumor growth and metastasis
(19,20). In EC, genomic location analysis
revealed that a restriction on FOXA transcriptional activation is
progressively lost during progression of Barrett's esophagus toward
adenocarcinoma (21). In addition,
it has been reported that FOXA1 is overexpressed and associated
with extensive lymph node metastasis in EC (22,23), and
that FOXA2 is upregulated in Barrett's metaplasia, dysplasia and
adenocarcinoma (24). However, to
the best of our knowledge, the expression and potential functions
of FOXA3 in EC have not yet been identified.
The present study aimed to determine the potential
roles of FOXA3 in EC progression. To do so, the expression levels
of FOXA3 were evaluated in EC tumor tissues. Subsequently, the
association between FOXA3 expression levels and clinical
characteristics of patients with EC was determined. In vitro
and in vivo experiments were also performed to evaluate the
effects of FOXA3 on EC, and to highlight the potential FOXA3
mechanisms of action in the regulation of EC progression.
Materials and methods
Patients and specimens
Tumor specimens, including 96 pairs of EC tissues
and adjacent nontumor tissues, were obtained from patients with EC
who underwent surgical resection without preoperative treatment and
without other tumors between April 2004 and May 2008 at the
Department of General Surgery, The First Affiliated Hospital Wannan
Medical College (Wuhu, China). All samples were checked manually by
a pathologist to confirm the tumor type and purity. Histological
analysis of tumors confirmed that patients had EC. Patients
included in the study had SCC, undifferentiated carcinoma or
Siewert type I esophagogastric junctional adenocarcinoma. The
clinicopathological and baseline demographic characteristics of
patients were retrospectively collected and comprised age, sex,
tumor size, tumor site and tumor stage. Tumor stages were
histologically classified according to the seventh edition of the
American Joint Committee on Cancer tumor-node-metastasis (TNM)
classification (25). Overall
survival (OS) was calculated from the date of surgery to the date
of death or the last follow-up. Follow-up was terminated in
December 2011. The study was approved by the Research Medical
Ethics Committee of Wannan Medical College (Wuhu, China) and was
carried out in accordance with approved guidelines. All patients
provided written informed consent for the use of clinical
specimens. All fresh specimens were fixed with 4% formalin at 4°C
overnight.
Immunohistochemistry (IHC)
IHC was performed on formalin-fixed
paraffin-embedded surgical specimens. Tissue sections were
incubated at 60°C for 6 h, deparaffinized in xylene, and rehydrated
in a descending gradient of ethanol. Endogenous peroxidase activity
was quenched with 3% hydrogen peroxide at room temperature for 10
min. Following antigen retrieval through incubation with citrate
buffer in a microwave oven at 95°C for 10 min, sections were
incubated with anti-FOXA3 antibody (1:300, cat. no. ab238112;
Abcam, Cambridge, UK) at 4°C overnight. Tissue sections were then
treated with Primary Antibody Amplifier Quanto for 10 min at room
temperature and horseradish peroxidase (HRP) Polymer Quanto for 10
min at room temperature (Thermo Fisher Scientific, Inc., Waltham,
MA, USA). Sections were visualized using a Nikon Eclipse Ti-s
microscope (Nikon Corporation, Tokyo, Japan) after staining with
3′-diaminobenzidine for 2 min and counterstaining with hematoxylin
for 5 min at room temperature. Immunostaining intensity was
evaluated by two independent pathologists without knowledge of the
clinicopathological data. The staining intensity was sorted as
follows: 0 (negative), 1 (weak), 2 (moderate) and 3 (strong).
According to the extent of staining, the staining area was scored
as 0, 1, 2, 3 or 4 when it contained <5, 5–25, 26–50, 51–75 or
>75% positively stained cells, respectively. The IHC score was
processed by multiplying the staining intensity with the staining
area, which yielded a result ranging from 0 to 12.
Cell lines
The human EC cell lines EC109 and EC9706 were
obtained from the Shanghai Institutes for Biological Sciences
(Shanghai, China). All cells were cultured in Dulbecco's modified
Eagle's medium (DMEM; Sigma-Aldrich; Merck KGaA, Darmstadt,
Germany) supplemented with 10% fetal bovine serum (FBS; Gibco;
Thermo Fisher Scientific, Inc.) and cultured at 37°C in a
humidified incubator containing 5% CO2. To generate
EC9706-luc cells that stably express luciferase, EC9706 cells at
80% confluence in a 10-cm dish were transfected with 10 µg
pcDNA3.1/Luc (0.01 µg/µl; plasmid 32904; Addgene, Inc., Cambridge,
MA, USA) in Lipofectamine® (Invitrogen; Thermo Fisher
Scientific, Inc.) and serum-free medium at 37°C for 18–72 h, and
treated with 400 mg/l G418 (Sigma-Aldrich; Merck KGaA) in 10%
FBS-supplemented DMEM. Culture media containing G418 was refreshed
every week. After 3 weeks of G418 selection, isolated colonies were
further purified by limiting dilution cloning, and single clones
were maintained in DMEM with 200 mg/l G418.
Reverse transcription-quantitative
polymerase chain reaction (RT-qPCR)
Total RNA was isolated from cells and tissue samples
using TRIzol® reagent (Invitrogen; Thermo Fisher
Scientific, Inc.). RNA was reverse transcribed using the
PrimeScript RT reagent kit (cat. no. RR037; Takara Biotechnology
Co., Ltd., Dalian, China) according to the manufacturer's protocol,
and then processed for qPCR using SYBR Premix Ex Taq (cat. no.
RR390; Takara Biotechnology Co., Ltd.) according to the
manufacturer's protocol. Briefly, the qPCR reaction mixture was
preheated to 95°C for 10 sec, followed by 35 cycles consisting of
95°C for 15 sec, 65°C for 30 sec and 72°C for 30 sec. GAPDH was
used as an internal control. FOXA1, FOXA2, FOXA3 and GAPDH primers
were designed as follows: FOXA1, forward
5′-GCAATACTCGCCTTACGGCT-3′, reverse 5′-TACACACCTTGGTAGTACGCC-3′;
FOXA2, forward 5′-GGAGCAGCTACTATGCAGAGC-3′, reverse
5′-CGTGTTCATGCCGTTCATCC-3′; FOXA3, forward
5′-GAGATGCCGAAGGGGTATCG-3′, reverse 5′-TGATTCTCCCGGTAGTAAGGG-3′;
and GAPDH, forward 5′-GAGTCAACGGATTTGGTCGT-3′ and reverse
5′-TTGATTTTGGAGGGATCTCG-3′. The relative expression levels were
calculated and normalized using the 2−ΔΔCq method
(26).
Western blotting
Proteins were extracted from tissues or cells using
Tissue or Cell Total Protein Extraction kit (Sangon Biotech Co.,
Ltd., Shanghai, China), and quantified using the Pierce
Bicinchoninic Acid Protein Assay kit (Thermo Fisher Scientific,
Inc.). Subsequently, 50 ng total protein was separated by 10%
SDS-PAGE and transferred onto polyvinylidene fluoride membranes.
Membranes were blocked with 3% bovine serum albumin (Sigma-Aldrich;
Merck KGaA) in PBS for 1 h at room temperature, and then incubated
with primary antibodies against FOXA3 (1:1,000, cat. no. ab108454;
Abcam), E-cadherin (1:1,000, cat. no. 20874; ProteinTech Group,
Inc., Chicago, IL, USA), N-cadherin (1:1,000, cat. no. 22018;
ProteinTech Group, Inc.), Snail (1:1,000, cat. no. ab53519; Abcam),
Twist (1:1,000, cat. no. 25465; ProteinTech Group, Inc.), FOXA1
(1:1,000, cat. no. 20411; ProteinTech Group, Inc.), FOXA2 (1:1,000,
cat. no. 22474; ProteinTech Group, Inc.) and GAPDH (1:3,000, cat.
no. 60004; ProteinTech Group, Inc.) at 4°C overnight. Subsequently,
membranes were incubated with HRP-conjugated secondary antibodies
(1:2,000, cat. nos. 705-035-003, 115-035-003 and 111-035-003;
Jackson ImmunoResearch Laboratories, Inc., West Grove, PA, USA) at
room temperature for 2 h. Enhanced chemiluminescence reagent
(Pierce™ ECL Western Blotting Substrate; Thermo Fisher Scientific,
Inc.) and a chemiluminescence imager (Tanon 4800; Tanon Science and
Technology Co., Ltd., Shanghai, China) was used to detect the
signal on the membrane. The intensity of the bands was analyzed
using Quantity One Version 4.62 software (Bio-Rad Laboratories,
Inc., Hercules, CA, USA).
Small interfering (si)RNA and
overexpression
The targeting sequence for FOXA3 siRNA was
5′-GACGCGCCCTACAACTTCAA-3′. The coding sequences of FOXA1 and FOXA2
were constructed into p3×Flag-CMV7 (Sigma-Aldrich; Merck KGaA).
Transfection of siRNA and overexpression plasmids into EC cells was
carried out using Lipofectamine® 2000 (Invitrogen;
Thermo Fisher Scientific, Inc.) according to the manufacturer's
protocol. Briefly, cells were plated 24 h prior to transfection,
and transfection was performed once cells reached 80% confluence.
Overexpression plasmids (10 µg for cells in a 10-cm dish, 0.01
µg/µl) or siRNA (10 µg for cells in a 10-cm dish, 0.01 µg/µl) were
mixed with Lipofectamine® and serum-free medium at room
temperature for 20 min. Subsequently, the mixture was added to the
culture medium and incubated with the cells for 18–72 h under cell
culture conditions. For the overexpression experiments,
p3×Flag-CMV7 vectors were used as a control. For knockdown assays,
scrambled control (5′-GCTCGACAGCCCTAACCTAA-3′; Invitrogen; Thermo
Fisher Scientific, Inc.) was used.
Wound healing assay
Cells (1×10⁶/ml) were seeded in 6-well
plates and allowed to attach. Subsequently, a wound was generated
with a 10-µl pipette tip and cells were washed three times with PBS
and incubated with 2 ml complete medium. The migration status was
observed under Nikon Eclipse Ti-s microscope (Nikon Corporation) at
0, 12 and 24 h from the same point of view. The wound healing rate
was measured with ImageJ version 1.42q software (National
Institutes of Health, Bethesda, MD, USA).
Transwell assays
Transwell migration and invasion assays were
performed in 12-well Transwell plates (pore size, 8 µm) according
to the manufacturer's protocol (Corning Inc., Corning, NY, USA).
For the invasion assay only, the Transwell lower chamber was coated
with BD Matrigel™ Basement Membrane Matrix (BD Biosciences, San
Jose, CA, USA). Cells (1×10⁵) in serum-free medium were
seeded into the Transwell upper chamber, whereas the lower chamber
was filled with culture medium containing 20% FBS, which served as
a chemoattractant. The cell migratory and invasive capacities were
evaluated at 24 and 48 h, respectively. Uninvaded cells on the
upper chamber were wiped off from the surface of the membrane by
gentle rubbing, and invaded cells on the lower surface of the
membrane were fixed with 4% paraformaldehyde for 10 min and stained
with 0.1% crystal violet for 5 min at room temperature. The number
of invasive and migratory cells was counted under Nikon Eclipse
Ti-s microscope (Nikon Corporation) in five randomly selected
fields.
Animal study
Male Balb/c nude mice (age, 4–6 weeks; weight, 15–20
g; housing conditions: 26°C, 50% humidity, 10/14-h light/dark
cycle, free access to sufficient sterile food and water) were
purchased from the Shanghai Laboratory Animal Center of the Chinese
Academy Sciences (Shanghai, China) and were housed in a separate
pathogen-free room. Animal care and experiments were approved by
the Research Medical Ethics Committee of Wannan Medical College,
and were performed in strict accordance with the approved
guidelines. All mice were randomized in a controlled fashion
(n=6/group). For the lung metastasis model, transfected EC9706-Luc
cells were suspended in precooled PBS (1×10⁶ cells/mouse
in 100 µl PBS) and were injected through the tail vein. All mice
were monitored for bioluminescence every week with IVIS200 imaging
(Xenogen; Caliper Life Sciences, Hopkinton, MA, USA) following
intraperitoneal administration of 200 µl luciferin (15 mg/ml;
Promega Corporation, Madison, WI, USA). The luciferase signal
intensity was calculated by region of interest analysis.
Statistical analysis
Patients were grouped according to the results of
the receiver operating characteristic (ROC) analyses obtained from
IHC data. An IHC score of 6 was determined as the ideal cutoff to
divide patients into the low FOXA3 expression group (score, 0–6;
n=70) and high FOXA3 expression group (score, 7–12; n=20). The
association between FOXA3 expression and clinicopathological
characteristics of patients with EC was evaluated using
χ2 test. Pearson correlation coefficients were
calculated to analyze the correlation between FOXA3 and FOXA1 or
FOXA2 expression levels in The Cancer Genome Atlas (TCGA)
Esophageal Carcinoma datasets (https://portal.gdc.cancer.gov/projects/TCGA-ESCA)
(27). Survival curves were
constructed with the Kaplan-Meier method and compared using the
log-rank test. Univariate and multivariate analyses were performed
using Cox regression; the statistically significant characteristics
in the univariate analysis were used to perform multivariate
analysis. For comparisons between tumor and tumor-adjacent tissues,
data from GSE6059 (https://www.ncbi.nlm.nih.gov/geo/query/acc.cgi?acc=GSE6059)
(28), GSE13898 (https://www.ncbi.nlm.nih.gov/geo/query/acc.cgi?acc=GSE13898)
(29) and Oncomine (https://www.oncomine.org) (30) datasets, and the IHC results were
used. For comparisons between the control and siRNA-transfected
groups, an unpaired Student's t-test was used. To compare FOXA3
expression in tumor and adjacent nontumor tissues following IHC
analysis, a paired Student's t-test was used. For comparisons among
multiple groups, One-way analysis of variance followed by Scheffe
post hoc test was used. All statistical tests were two-tailed and
P<0.05 was considered to indicate a statistically significant
difference. Data were analyzed using SPSS version 22.0 software
(IBM Corp., Armonk, NY USA) and the R software version 3.2.2 (R
Foundation for Statistical Computing, Vienna, Austria).
Results
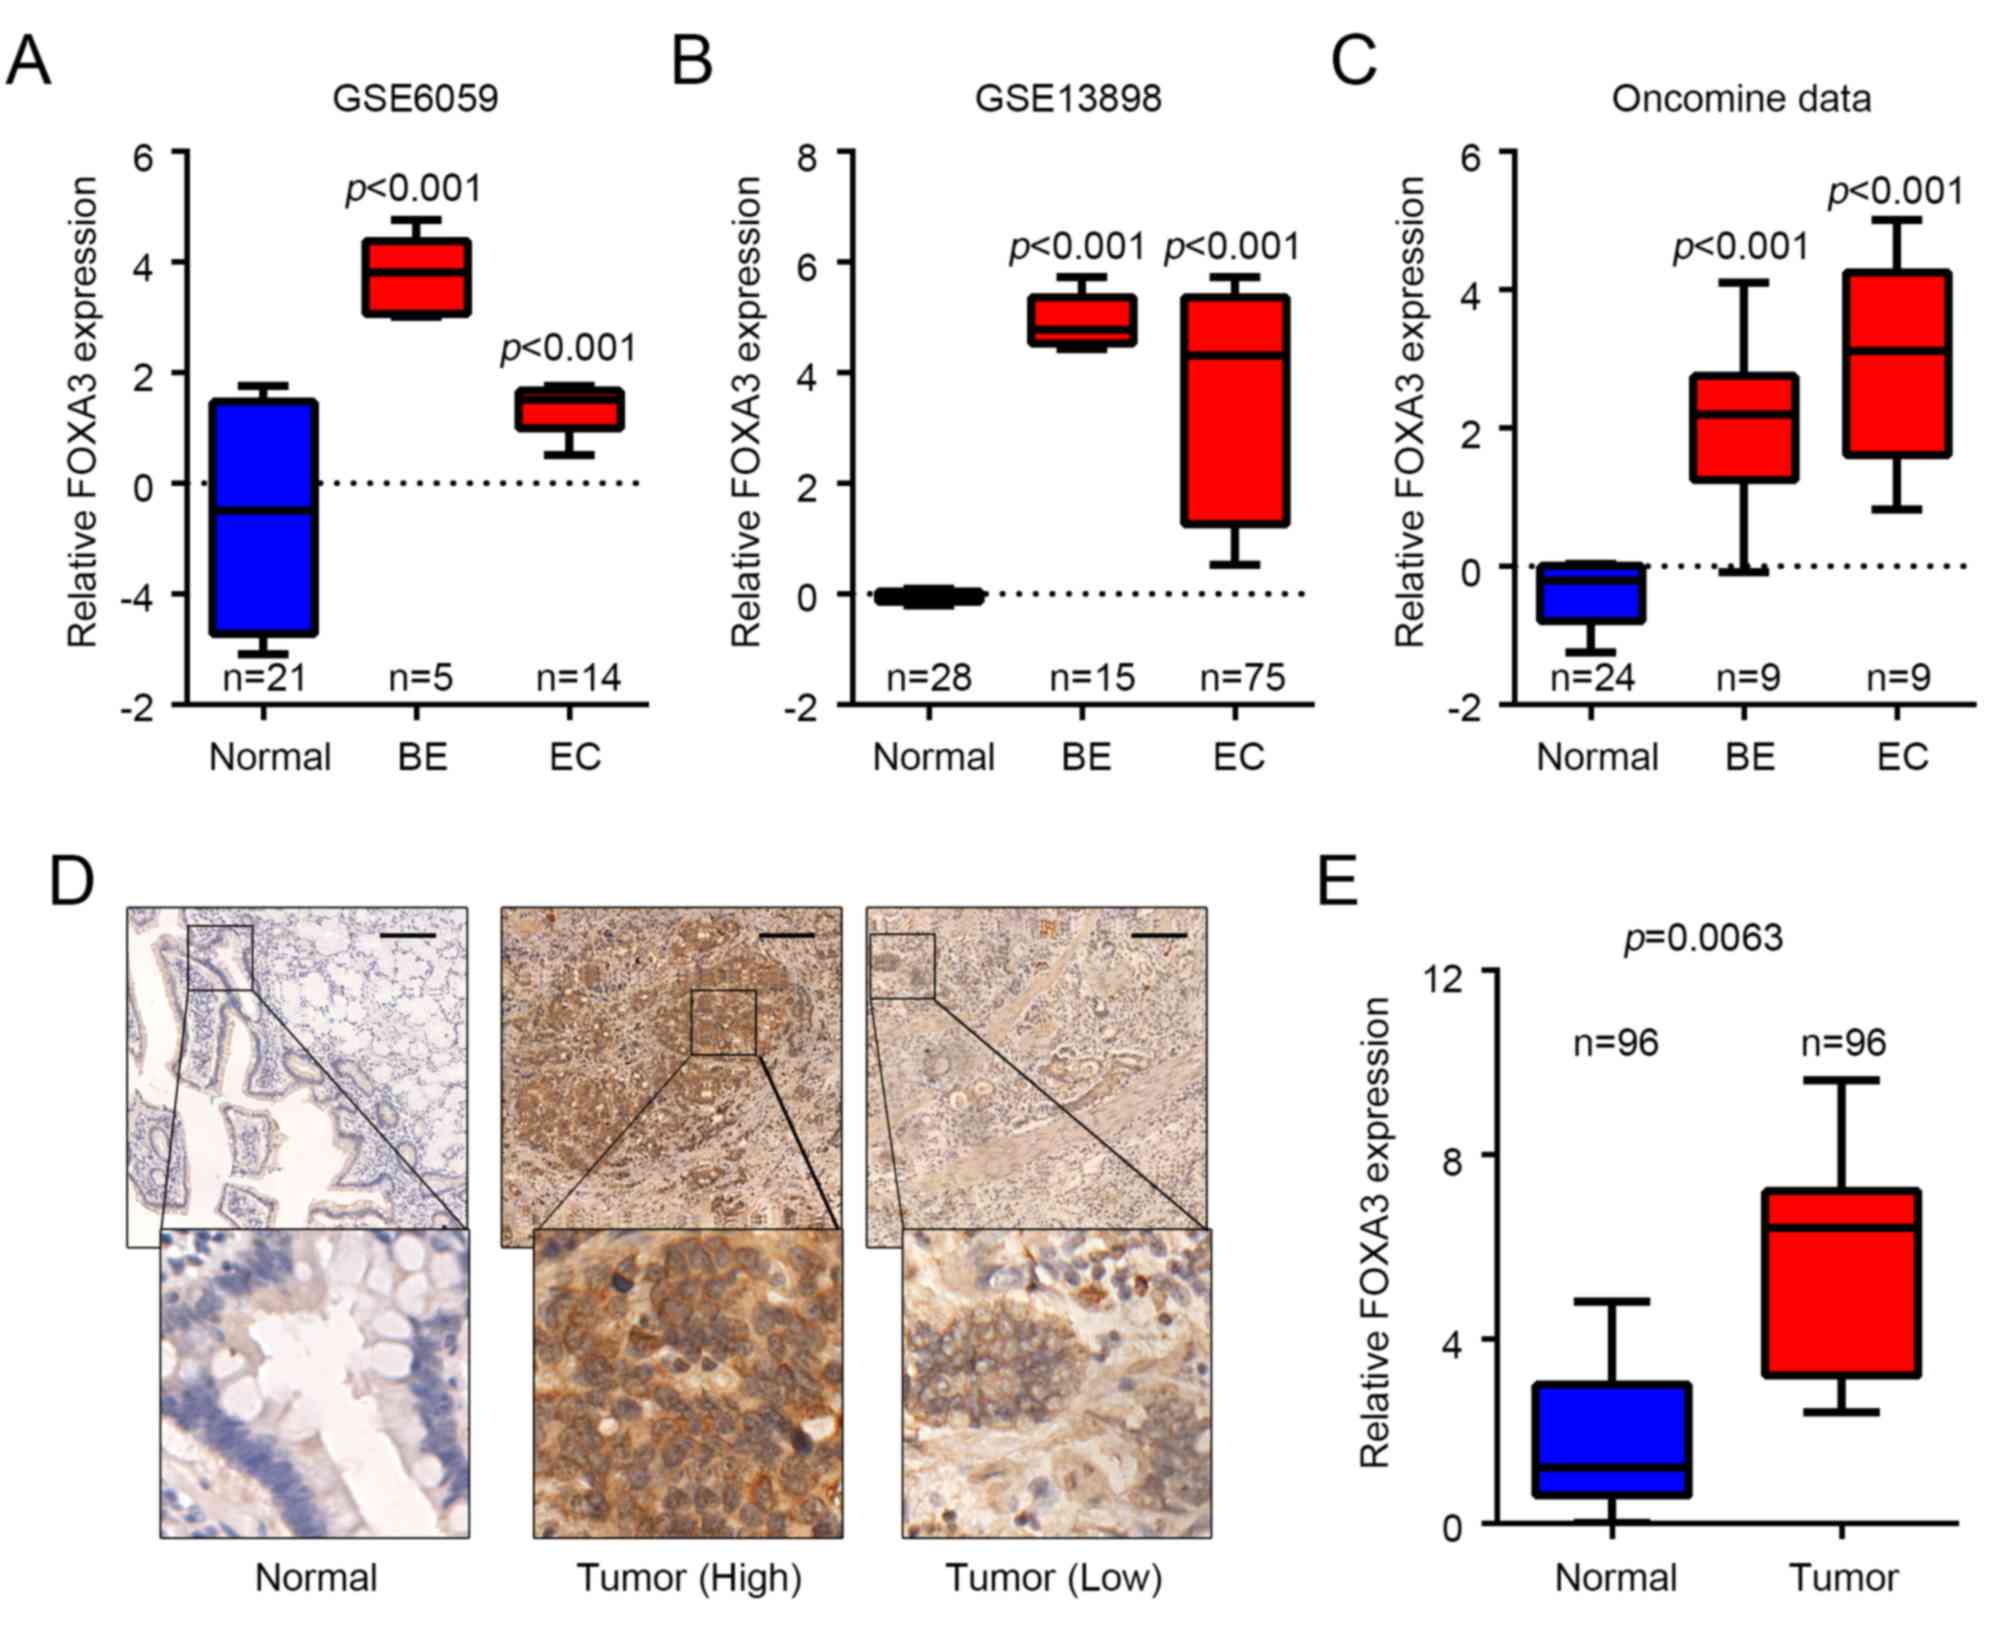
FOXA3 is upregulated in EC
To determine whether FOXA3 was involved in EC
progression, FOXA3 expression levels were analyzed in EC and
adjacent normal tissues obtained from various public datasets. The
results demonstrated that FOXA3 was significantly upregulated in EC
tissues from GSE6059 [fold change (FC)=4.234, P<0.001] (28), GSE13898 (FC=12.373, P<0.001)
(29) and ‘oncomine’ (FC=8.368,
P<0.001) (30) datasets compared
with in adjacent healthy tissues (Fig.
1A-C). The results also reported that FOXA3 expression was
significantly upregulated in metaplasia tissues from Barrett's
esophagus cases; FC=23.863, P<0.001; FC=32.219, P<0.001; and
FC=4.490, P<0.001 for GSE6059, GSE13898 and ‘oncomine’ datasets,
respectively, compared with in adjacent healthy tissues (Fig. 1A-C). These data suggested that FOXA3
may be involved in EC progression and in tumorigenesis. FOXA3
protein levels were also determined in 96 pairs of EC and adjacent
nontumor tissues by IHC. The results demonstrated that, although
FOXA3 was present in both types of tissue, FOXA3 protein expression
was upregulated in EC samples compared with in nontumor tissues
(P=0.0126; Fig. 1D and E).
FOXA3 upregulation is associated with
tumor invasion and can be used as an independent prognostic marker
in patients with EC
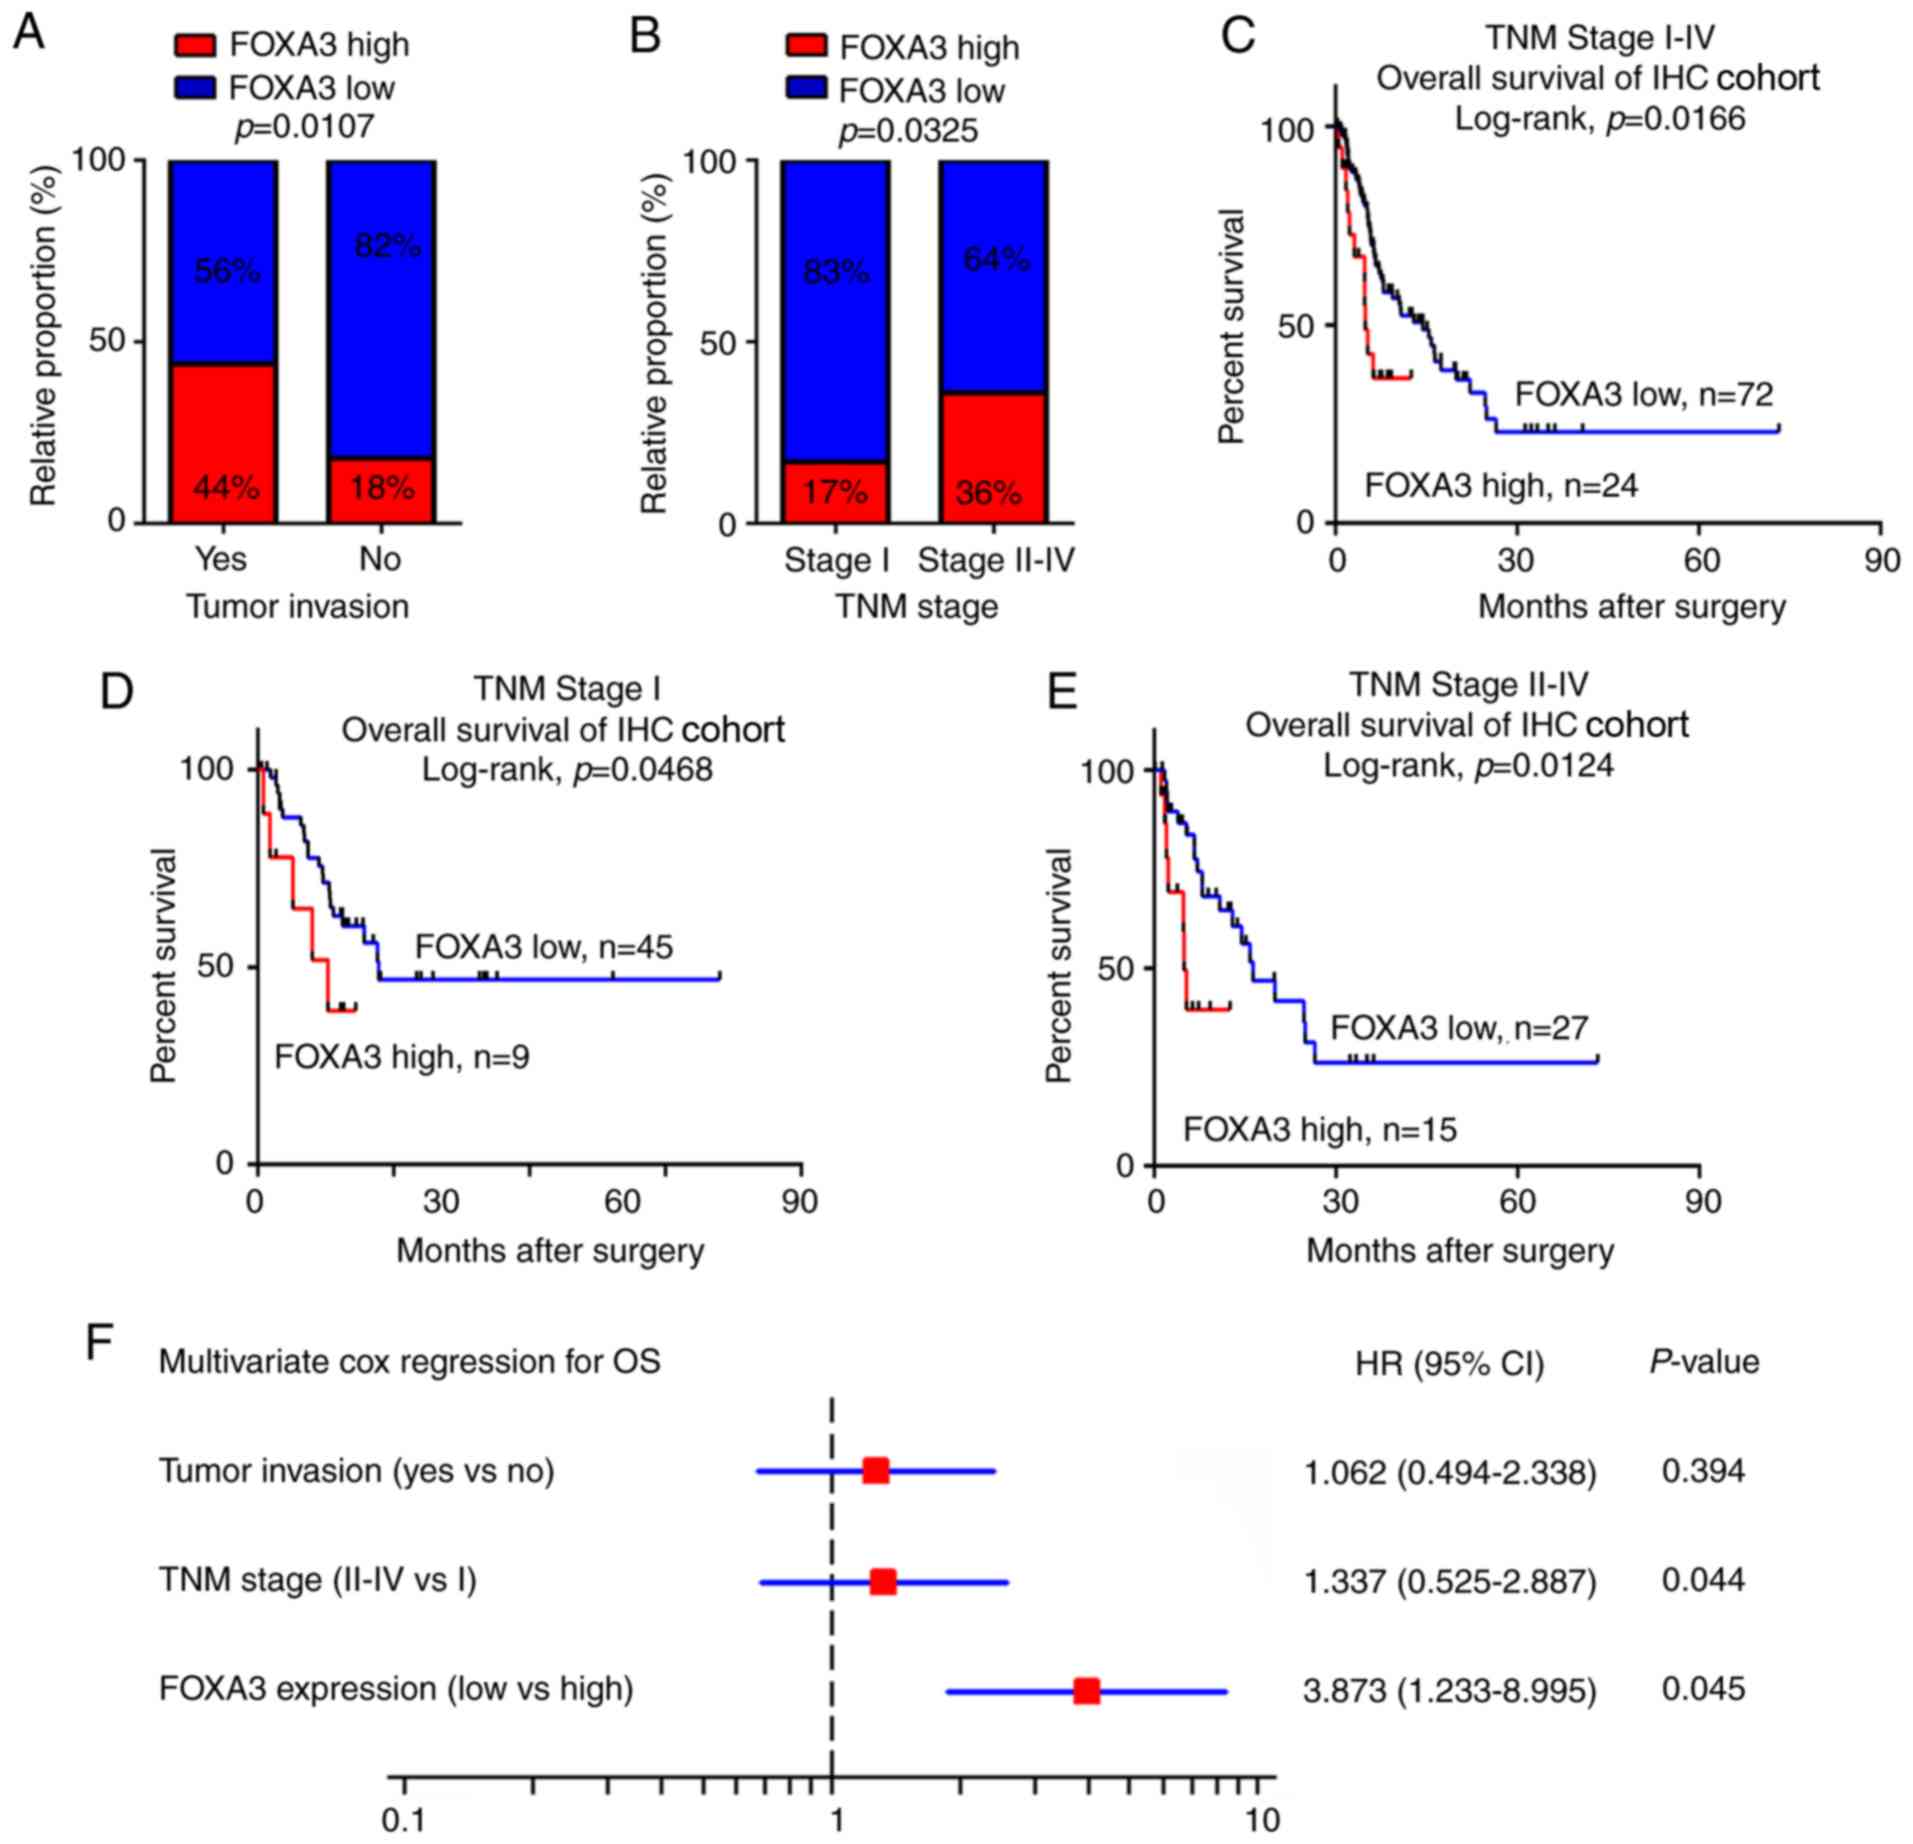
To evaluate the potential roles of FOXA3 in EC, the
association between FOXA3 expression levels obtained from IHC assay
and clinicopathological characteristics of patients with EC were
calculated. The results revealed that FOXA3 upregulation was
significantly associated with tumor invasion (P=0.0107) and
advanced TNM stage (P=0.0325; Fig. 2A
and B; Table I). In addition,
patients in the high FOXA3 expression group presented a poorer OS
compared with patients in the low FOXA3 expression group (P=0.0166;
Fig. 2C).
 | Table I.Associations between FOXA3 expression
levels and clinicopathological characteristics of patients with
esophageal cancer. |
Table I.
Associations between FOXA3 expression
levels and clinicopathological characteristics of patients with
esophageal cancer.
|
|
| FOXA3
expression |
|
|---|
|
|
|
|
|
|---|
|
|
| High | Low |
|
|---|
|
|
|
|
|
|
|---|
| Variables | N | N (%) | N (%) | P-value |
|---|
| Age (years) |
|
|
| 0.345779 |
|
<60 | 48 | 14 (29) | 34 (71) |
|
|
≥60 | 48 | 10 (21) | 38 (79) |
|
| Sex |
|
|
| 0.118824 |
|
Male | 57 | 11 (19) | 46 (81) |
|
|
Female | 39 | 13 (33) | 26 (67) |
|
| Tumor size
(cm) |
|
|
| 0.555604 |
| ≤5 | 47 | 13 (28) | 34 (72) |
|
|
>5 | 49 | 11 (22) | 38 (78) |
|
| Nodal
metastasis |
|
|
| 0.155855 |
|
Yes | 52 | 16 (31) | 36 (69) |
|
| No | 44 | 8
(18) | 36 (82) |
|
| Tumor invasion |
|
|
| 0.010738 |
|
Yes | 25 | 11 (44) | 14 (56) |
|
| No | 71 | 13 (18) | 58 (82) |
|
| Distant
metastasis |
|
|
| 0.063399 |
|
Yes | 5 | 3
(60) | 2
(40) |
|
| No | 91 | 21 (23) | 70 (77) |
|
| TNM stage |
|
|
| 0.032509 |
| I | 54 | 9
(17) | 45 (83) |
|
|
II–IV | 42 | 15 (36) | 27 (64) |
|
To further evaluate the efficiency of FOXA3
expression at distinguishing patients according to their TNM
stages, patients were divided into early (stage I) and advanced
(stages II–IV) groups. The results demonstrated that in both
groups, FOXA3 levels could significantly predict patient outcomes
(Fig. 2D and E). These data
suggested that FOXA3 expression may be associated with the OS of
patients with EC.
Univariate Cox analysis was used to identify the
prognostic value of clinicopathological characteristics for OS in
patients with EC. The results demonstrated that tumor invasion,
distant metastasis, TNM stage and FOXA3 expression (P=0.011, 0.003,
0.024 and 0.035, respectively; Table
II) represented risk factors that were positively associated
with patient OS. Further adjustment of covariate factors using
multivariate Cox analysis identified TNM stage (P=0.044) and
upregulated FOXA3 (P=0.045) as additional independent risk factors
for EC (Fig. 2F). These data
suggested that FOXA3 upregulation may be an independent factor that
could predict poor prognosis in patients with EC.
| Table II.Univariate and multivariate Cox
analyses of FOXA3 and clinicopathological characteristics of
patients with esophageal cancer. |
Table II.
Univariate and multivariate Cox
analyses of FOXA3 and clinicopathological characteristics of
patients with esophageal cancer.
|
| Univariate
analysis | Multivariate
analysis |
|---|
|
|
|
|
|---|
| Variables | HR (95% CI) | P-value | HR (95% CI) | P-value |
|---|
| Age (years) |
|
|
|
|
| ≤60 vs.
>60 | 0.68
(0.30–1.37) | 0.085 |
| NS |
| Sex |
|
|
|
|
| Male
vs. female | 1.44
(0.49–5.36) | 0.144 |
| NS |
| Tumor size
(cm) |
|
|
|
|
| ≤5 vs.
>5 | 2.67
(1.25–5.03) | 0.077 |
| NS |
| Nodal
metastasis |
|
|
|
|
| Yes vs.
no | 2.56
(0.69–5.21) | 0.055 |
| NS |
| Tumor invasion |
|
|
|
|
| Yes vs.
no | 1.06
(0.49–2.34) | 0.011a |
| NS |
| Distant
metastasis |
|
|
|
|
| Yes vs.
no | 1.97
(0.89–5.64) | 0.003a |
| NS |
| TNM stage |
|
|
|
|
| I vs.
II–IV | 1.34
(0.12–0.88) | 0.024a |
| 0.044a |
| FOXA3
expression | 3.87
(1.23–8.99) | 0.035a | 3.11
(1.57–7.66) |
|
| Low vs.
high | 3.87
(1.23–8.99) |
|
| 0.045a |
FOXA3 promotes migration and invasion
of EC cells
Since FOXA3 upregulation was significantly
associated with tumor invasion in EC tissue (Fig. 2A), it was hypothesized that FOXA3 may
be able to regulate metastasis in EC. To verify this hypothesis
in vitro, EC109 and EC9706 cell lines were knocked-down for
FOXA3, prior to measuring their migratory and invasive abilities.
Knockdown efficiency was determined by RT-qPCR and western blotting
(Fig. 3A and B). The results
demonstrated that the migratory ability of EC cells following FOXA3
knockdown was significantly reduced according to the wound healing
and Transwell migration assays (P<0.0001; Fig. 3C and D, respectively). Transwell
invasion data further demonstrated that FOXA3 knockdown
significantly inhibited the invasive ability of EC109 and EC9706
cell lines (P<0.0001; Fig.
3E).
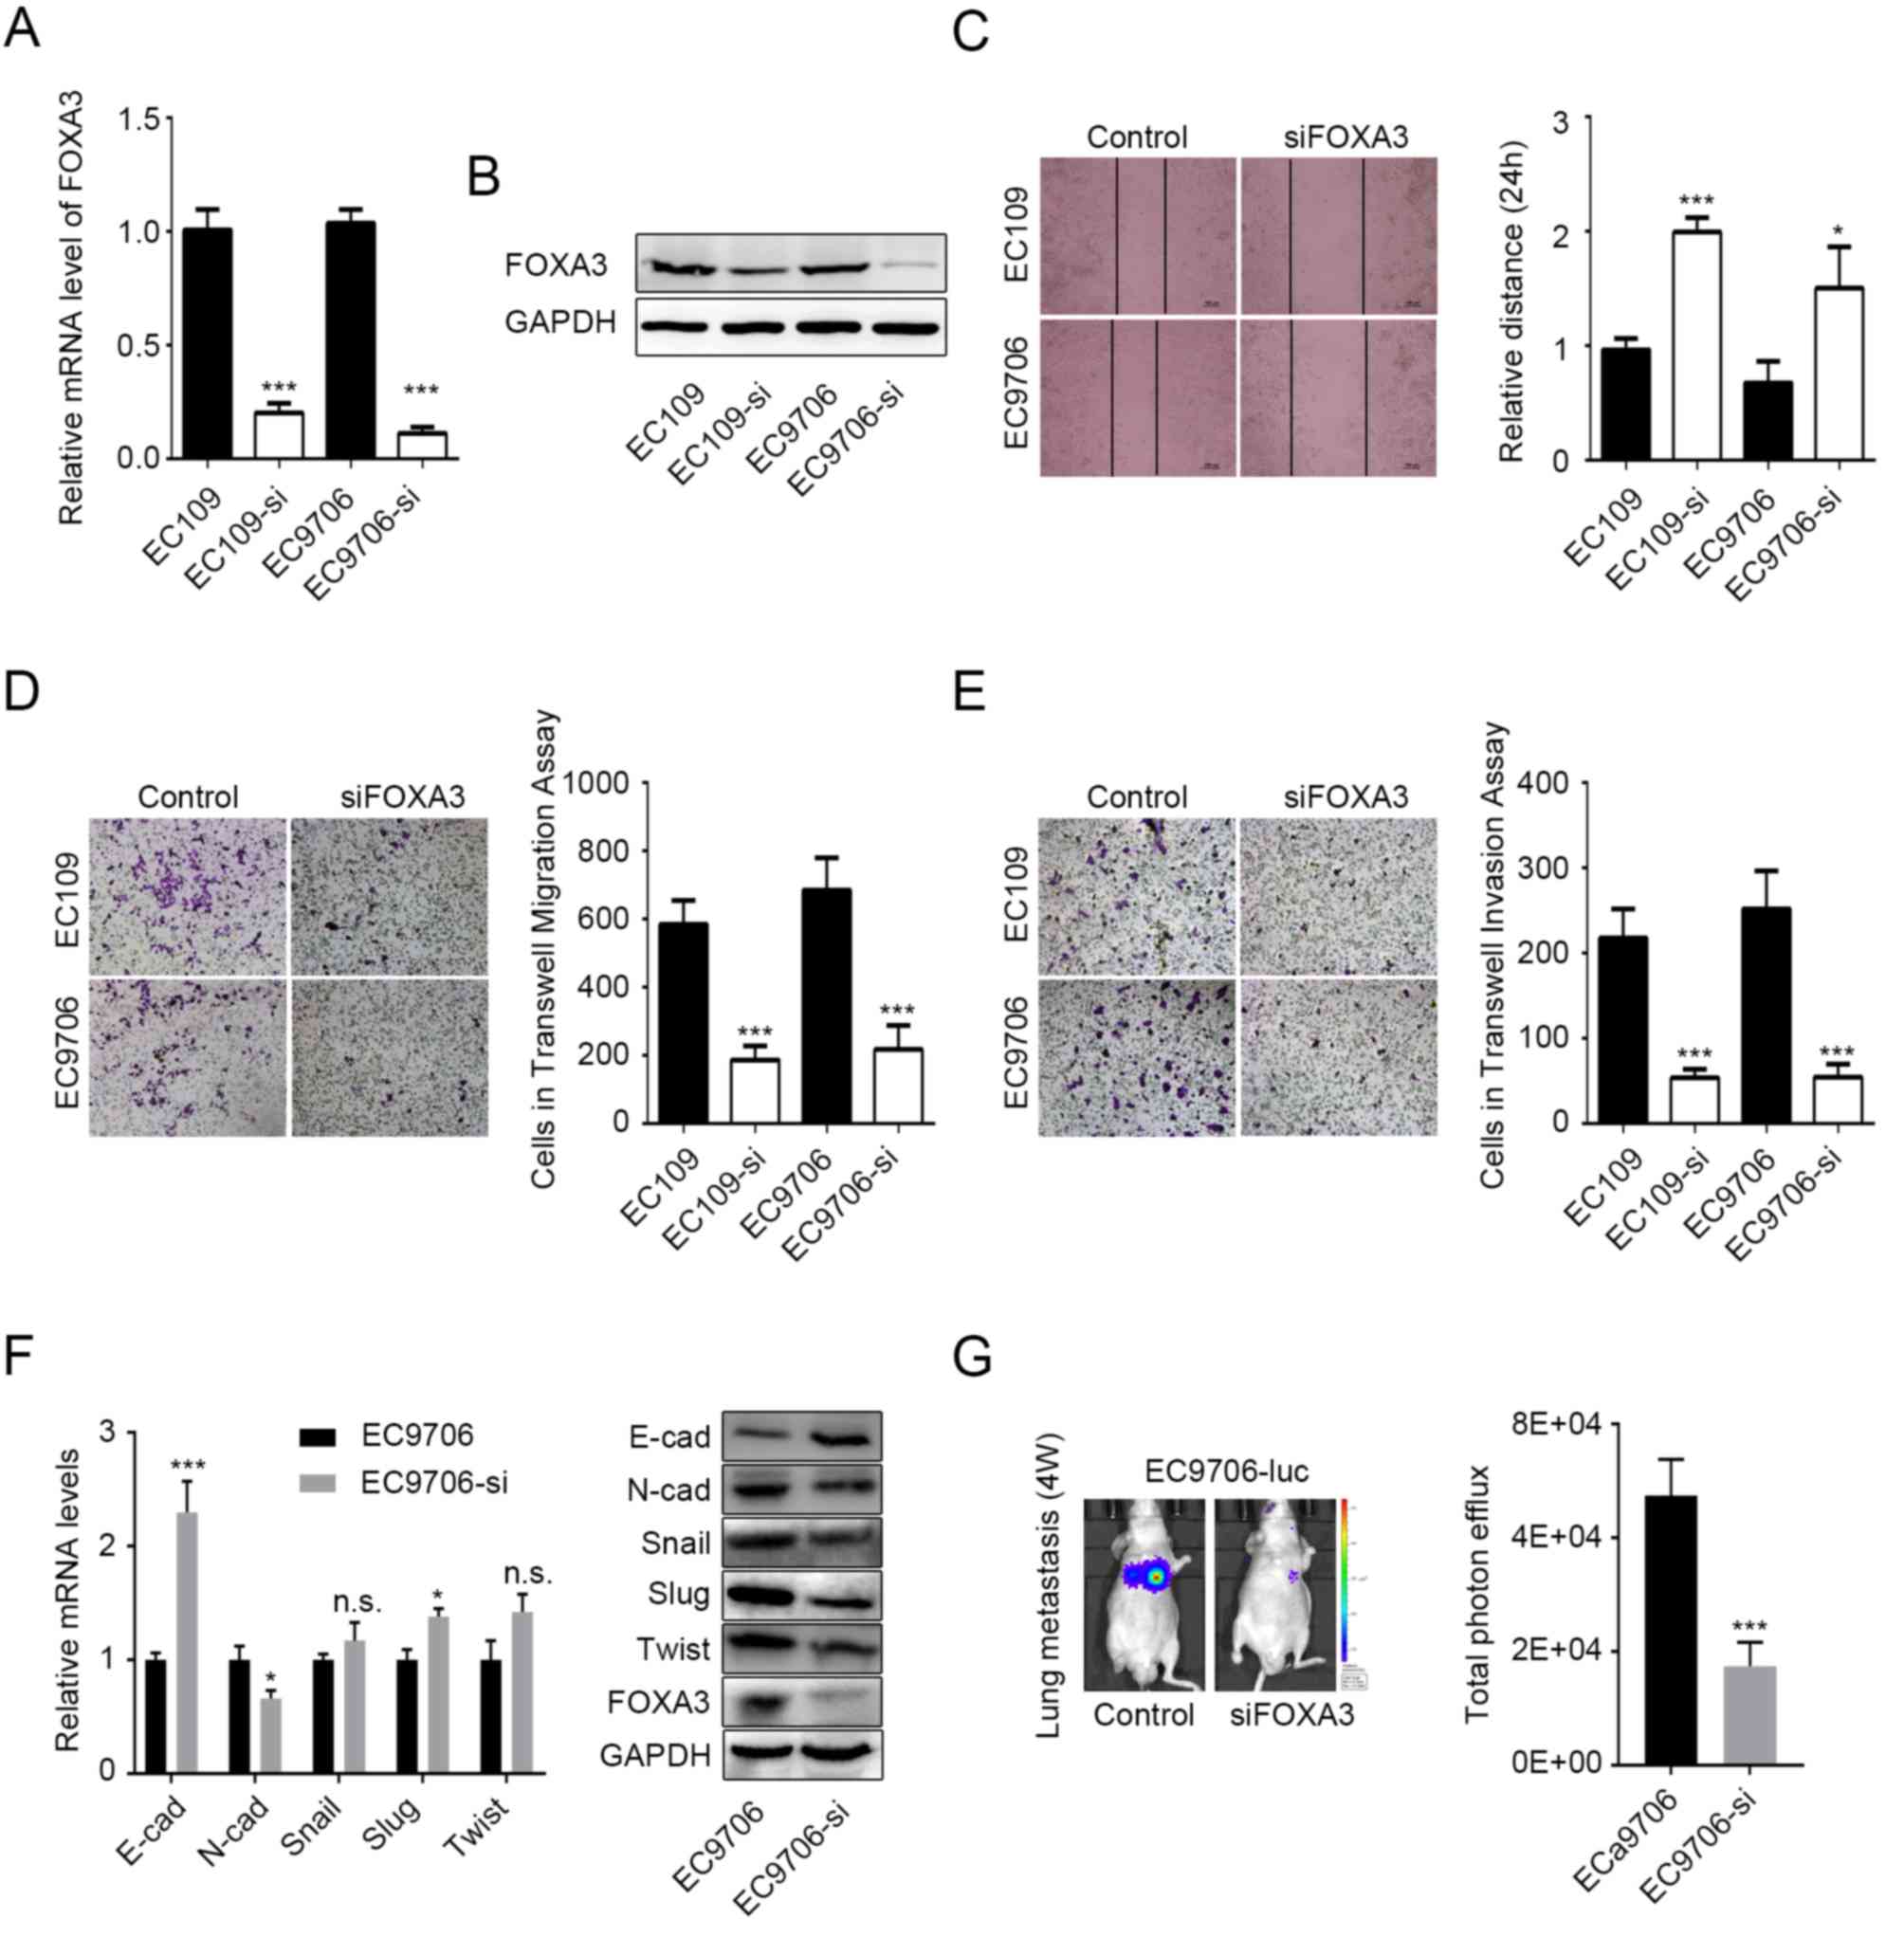 | Figure 3.FOXA3 promotes migration and invasion
of EC cells. FOXA3 knockdown efficiency in EC109 and EC9706 cells
determined by (A) RT-qPCR and (B) western blotting. (C) Migratory
ability of EC cells following FOXA3 knockdown determined by wound
healing assay. Representative images (10× magnification) and
statistical data are presented. (D and E) Migratory and invasive
abilities of EC cells following FOXA3 knockdown determined by
Transwell assay. Representative (20× magnification) and statistical
data are presented. (F) mRNA (left) and protein (right) expression
levels of the EMT-associated markers E-cad, N-cad, Snail, Slug, and
Twist in EC9706 cells following FOXA3 knockdown. (G) Metastatic
ability of EC cells following FOXA3 knockdown in vivo.
Representative and statistical data are presented. All experiments
were repeated at least three times. *P<0.05, ***P<0.001.
E-cad, E-cadherin; FOXA3, forkhead-box A3; N-cad, N-cadherin; NS,
not significant; si, small interfering; Slug, snail family
transcriptional repressor 2; Twist, twist family bHLH transcription
factor. |
N-cadherin and E-cadherin protein expression levels
were decreased and increased, respectively, in EC9706 cells
following FOXA3 knockdown (Fig. 3F).
In addition, N-cadherin and E-cadherin mRNA expression levels were
significantly decreased and increased, respectively, in EC9706
cells following FOXA3 knockdown (Fig.
3F). These results suggested that FOXA3 may regulate the
epithelial-mesenchymal transition (EMT) in EC cells. However,
although the protein levels of Snail, snail family transcriptional
repressor 2 and twist family bHLH transcription factor were
decreased following FOXA3 knockdown, no decrease in their mRNA
expression levels was observed (Fig.
3F), which suggested that FOXA3 may regulate EMT through other
processes.
The effects of FOXA3 on metastasis were also
evaluated in vivo using EC9706-luc cells. The results
demonstrated that FOXA3 knockdown significantly reduced lung
metastasis originating from EC cells (Fig. 3G). Taken together, these data
suggested that FOXA3 may regulate the metastatic potential of EC
cells.
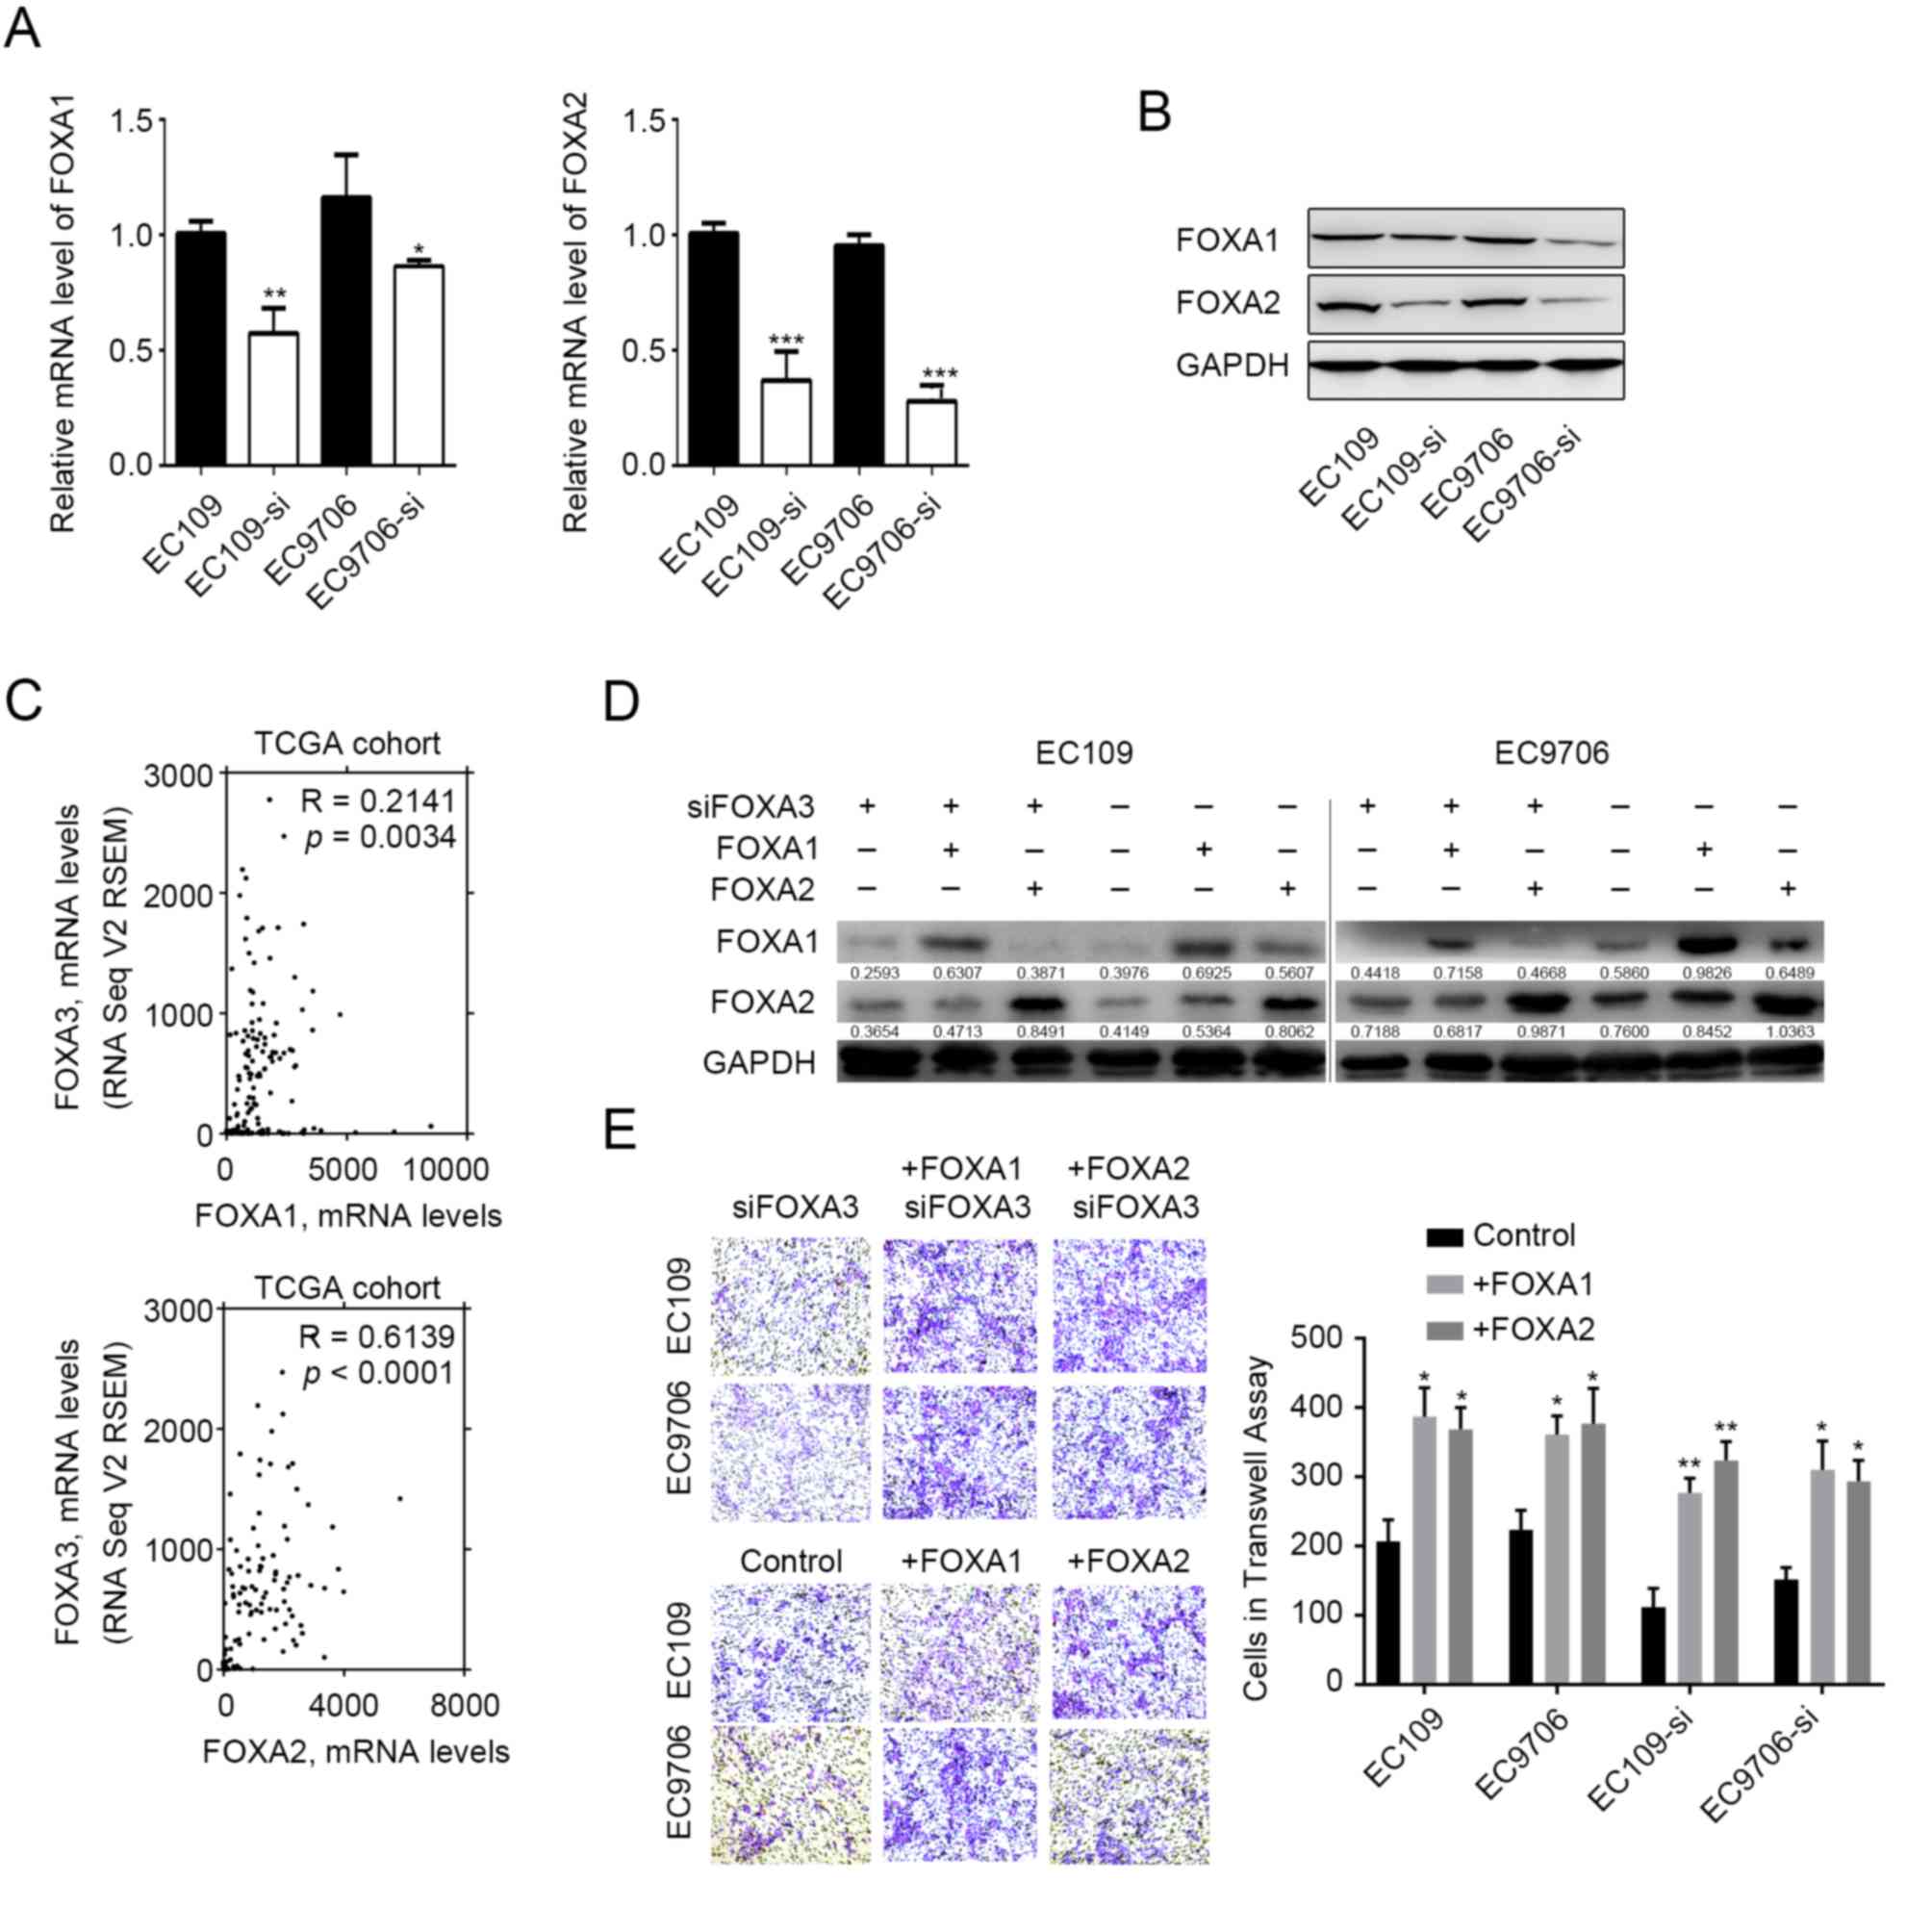
FOXA3 regulates the expression of
other FOXA proteins
FOXA1 and FOXA2 are capable of regulating EC
metastasis (17–20), and previous studies have reported
that they can functionally compensate for each other (10–13). The
present study therefore evaluated whether FOXA3 could compensate
for FOXA1 and FOXA2 functions. The results demonstrated that the
mRNA and protein expression levels of FOXA1 and FOXA2 were
decreased in EC109 and EC9706 cells following FOXA3 knockdown
(Fig. 4A and B). In addition,
correlation analysis involving TCGA datasets revealed that FOXA3
expressions was positively correlated with FOXA1 (R=0.2141,
P=0.0034) and FOXA2 (R=0.6139, P<0.0001) expression levels in EC
tumor tissues (Fig. 4C). These data
demonstrated that various FOXA members presented similar expression
patterns in EC tissues, which suggested that FOXA3 may be capable
of regulating their expression. Subsequently, the present study
induced overexpression of FOXA2 or FOXA1 in FOXA3-knocked-down EC
cells (Fig. 4D). The results
demonstrated that FOXA2 overexpression was capable of compensating
for FOXA3 loss of function and promoted tumor invasion (Fig. 4E). FOXA1 overexpression also
compensated for the effects of FOXA3 knockdown (Fig. 4E).
Discussion
Clinicopathological characteristics, including tumor
stage, nodal status and resection margin are generally used to
determine prognosis and survival of patients with cancer (31). These characteristics can be
determined according to the TNM classification system. However, due
to large tumor heterogeneity, the efficiency of the TNM system is
limited in EC (32). Novel
diagnostic and prognostic tools are therefore required to improve
patient survival and clinical treatment efficacy. The results from
the present study suggested that FOXA3 may be used as an
independent prognostic marker and as a potential invasiveness
marker in patients with EC.
Similar to other FOXA members, FOXA3, which is also
known as hepatocyte nuclear factor 3γ, serves certain roles in the
development of endoderm tissues, particularly the liver and
pancreas (33). The roles of FOXA1
and FOXA2 in cancer have been extensively investigated; however, to
the best of our knowledge, only one study has reported that FOXA3
mRNA expression is increased in mouse liver tumors (34). Despite the lack of research on FOXA3
expression in human cancer, some studies have reported that
abnormal expression of FOXA3 is observed in the metaplasia of
various types of tissue (35,36). For
example, FOXA3 is upregulated in airway goblet cells of patients
with asthma and chronic obstructive pulmonary disease (37). In addition, FOXA3 expression is
significantly correlated with chloride channel accessory 1, which
is associated with smoke-induced mucin synthesis and further mucous
metaplasia (38). These studies
suggested that FOXA3 might be involved in cancer development.
Furthermore, it has been reported that increased FOXA3 expression
modulates age-associated metabolic disorder (39), which suggested that FOXA3 might serve
a role in tumorigenesis, since senescence and cancer are closely
associated. The results from the present study reported that FOXA3
was upregulated in Barrett's esophagus compared with in normal
tissues, which further suggested that FOXA3 may serve certain roles
in EC initiation. To the best of our knowledge, the present study
was the first to quantify FOXA3 upregulation in EC tissues, and to
demonstrate that FOXA3 was positively associated with metastasis
and OS of patients with EC. These cancer-promoting effects of FOXA3
on EC progression may be similar to those of other FOXA members,
although their functions present certain differences. For example,
FOXA1 promotes lymph node metastasis (23), whereas FOXA3 has no significant
effect on nodal metastasis. Notably, during definitive endoderm
formation, FOXA3 is activated after other FOXA members, and might
work differently than FOXA1 and FOXA2 (38–40).
Furthermore, although the present study suggested that upregulated
FOXA2 may compensate for decreased FOXA3 functions, it has also
been reported that FOXA3 competes with FOXA2 for DNA binding in
metaplasia and thus confers distinct functions by reducing FOXA2
activity (36). These studies,
combined with results from the present study, suggested that,
although similar expression levels of FOXA members were observed in
EC tissues, switching FOXA3 and FOXA2 activation may be critical
for regulating the metastatic inclination of EC cells toward
lymphatic or hematogenous vessels. Furthermore, distinguishing the
roles of FOXA2 and FOXA3 in EC progression may aid in the
development of a more precise definition of invasive EC and
treatment strategy for this pathology. The roles of FOXA3 and FOXA2
in EC remain poorly understand and require further
investigation.
In conclusion, the results from the present study
suggested that FOXA3 upregulation in EC may be considered as an
independent prognostic factor, and that FOXA3 may regulate the
migratory and invasive abilities of EC cells. In addition, FOXA3
modulated expression of other FOXA members, and FOXA2 upregulation
compensated for the functions of FOXA3 in tumor invasion. Future
studies will focus on the mechanisms underlying the roles of FOXA3
and its potential applications in the treatment of EC.
Acknowledgements
Not applicable.
Funding
The present study was supported by the National
Natural Science Foundation of China (grant no. 31870352), the
Foundation for Key Project of Natural Science Research Education
Department of Anhui Province (grant no. KJ2017A249) and the major
Project of Education Department in Anhui (grant nos. KJ2016A725 and
SK2018A0190).
Availability of data and materials
The datasets used and/or analyzed during the current
study are available from the corresponding author on reasonable
request.
Authors' contributions
BC performed all of the experiments. BC, JY and LL
performed tissue analysis. BC and FZ carried out data analysis and
interpretation; BC and ES carried out statistical analysis. FD and
XT collected clinical data. BC wrote the manuscript, conceived the
idea and designed the experiments. All authors read and approved
the final manuscript.
Ethics approval and consent to
participate
The study and animal experiments were approved by
the Research Medical Ethics Committee of Wannan Medical College and
were carried out in accordance with the ethical guidelines of the
Declaration of Helsinki. All patients provided written informed
consent.
Patient consent for publication
All patients provided written informed consent.
Competing interests
The authors declare that they have no competing
interests.
References
|
1
|
Chen W, He Y, Zheng R, Zhang S, Zeng H,
Zou X and He J: Esophageal cancer incidence and mortality in China,
2009. J Thorac Dis. 5:19–26. 2013.PubMed/NCBI
|
|
2
|
Cook MB, Chow WH and Devesa SS:
Oesophageal cancer incidence in the United States by race, sex, and
histologic type, 1977–2005. Br J Cancer. 101:855–859. 2009.
View Article : Google Scholar : PubMed/NCBI
|
|
3
|
Ferlay J, Shin HR, Bray F, Forman D,
Mathers C and Parkin DM: Estimates of worldwide burden of cancer in
2008: GLOBOCAN 2008. Int J Cancer. 127:2893–2917. 2010. View Article : Google Scholar : PubMed/NCBI
|
|
4
|
Xu XC: Risk factors and gene expression in
esophageal cancer. Methods Mol Biol. 471:335–360. 2009. View Article : Google Scholar : PubMed/NCBI
|
|
5
|
Paulson TG and Reid BJ: Focus on Barrett's
esophagus and esophageal adenocarcinoma. Cancer Cell. 6:11–16.
2004. View Article : Google Scholar : PubMed/NCBI
|
|
6
|
Besnard V, Wert SE, Hull WM and Whitsett
JA: Immunohistochemical localization of Foxa1 and Foxa2 in mouse
embryos and adult tissues. Gene Expr Patterns. 5:193–208. 2004.
View Article : Google Scholar : PubMed/NCBI
|
|
7
|
Kaestner KH, Hiemisch H, Luckow B and
Schütz G: The HNF-3 gene family of transcription factors in mice:
Gene structure, cDNA sequence, and mRNA distribution. Genomics.
20:377–385. 1994. View Article : Google Scholar : PubMed/NCBI
|
|
8
|
Kaestner KH: The making of the liver:
Developmental competence in foregut endoderm and induction of the
hepatogenic program. Cell Cycle. 4:1146–1148. 2005. View Article : Google Scholar : PubMed/NCBI
|
|
9
|
Zaret K: Developmental competence of the
gut endoderm: Genetic potentiation by GATA and HNF3/fork head
proteins. Dev Biol. 209:1–10. 1999. View Article : Google Scholar : PubMed/NCBI
|
|
10
|
Augello MA, Hickey TE and Knudsen KE:
FOXA1: Master of steroid receptor function in cancer. EMBO J.
30:3885–3894. 2011. View Article : Google Scholar : PubMed/NCBI
|
|
11
|
Gao N, Le Lay J, Qin W, Doliba N, Schug J,
Fox AJ, Smirnova O, Matschinsky FM and Kaestner KH: Foxa1 and Foxa2
maintain the metabolic and secretory features of the mature
beta-cell. Mol Endocrinol. 24:1594–1604. 2010. View Article : Google Scholar : PubMed/NCBI
|
|
12
|
Ferri AL, Lin W, Mavromatakis YE, Wang JC,
Sasaki H, Whitsett JA and Ang SL: Foxa1 and Foxa2 regulate multiple
phases of midbrain dopaminergic neuron development in a
dosage-dependent manner. Development. 134:2761–2769. 2007.
View Article : Google Scholar : PubMed/NCBI
|
|
13
|
Mavromatakis YE, Lin W, Metzakopian E,
Ferri AL, Yan CH, Sasaki H, Whisett J and Ang SL: Foxa1 and Foxa2
positively and negatively regulate Shh signalling to specify
ventral midbrain progenitor identity. Mech Dev. 128:90–103. 2011.
View Article : Google Scholar : PubMed/NCBI
|
|
14
|
Carroll JS, Liu XS, Brodsky AS, Li W,
Meyer CA, Szary AJ, Eeckhoute J, Shao W, Hestermann EV, Geistlinger
TR, et al: Chromosome-wide mapping of estrogen receptor binding
reveals long-range regulation requiring the forkhead protein FoxA1.
Cell. 122:33–43. 2005. View Article : Google Scholar : PubMed/NCBI
|
|
15
|
Gao N, White P and Kaestner KH:
Establishment of intestinal identity and epithelial-mesenchymal
signaling by Cdx2. Dev Cell. 16:588–599. 2009. View Article : Google Scholar : PubMed/NCBI
|
|
16
|
Slack JM: Metaplasia and
transdifferentiation: From pure biology to the clinic. Nat Rev Mol
Cell Biol. 8:369–378. 2007. View
Article : Google Scholar : PubMed/NCBI
|
|
17
|
Robbins CM, Tembe WA, Baker A, Sinari S,
Moses TY, Beckstrom-Sternberg S, Beckstrom-Sternberg J, Barrett M,
Long J, Chinnaiyan A, et al: Copy number and targeted mutational
analysis reveals novel somatic events in metastatic prostate
tumors. Genome Res. 21:47–55. 2011. View Article : Google Scholar : PubMed/NCBI
|
|
18
|
Jain RK, Mehta RJ, Nakshatri H, Idrees MT
and Badve SS: High-level expression of forkhead-box protein A1 in
metastatic prostate cancer. Histopathology. 58:766–772. 2011.
View Article : Google Scholar : PubMed/NCBI
|
|
19
|
Salem M, O'Brien JA, Bernaudo S, Shawer H,
Ye G, Brkić J, Amleh A, Vanderhyden BC, Refky B, Yang BB, et al:
miRNA-590-3p promotes ovarian cancer growth and metastasis via a
novel FOXA2-versican pathway. Cancer Res. 78:4175–4190. 2018.
View Article : Google Scholar : PubMed/NCBI
|
|
20
|
Wang B, Liu G, Ding L, Zhao J and Lu Y:
FOXA2 promotes the proliferation, migration and invasion, and
epithelial mesenchymal transition in colon cancer. Exp Ther Med.
16:133–140. 2018.PubMed/NCBI
|
|
21
|
Watts JA, Zhang C, Klein-Szanto AJ,
Kormish JD, Fu J, Zhang MQ and Zaret KS: Study of FoxA pioneer
factor at silent genes reveals Rfx-repressed enhancer at Cdx2 and a
potential indicator of esophageal adenocarcinoma development. PLoS
Genet. 7:e10022772011. View Article : Google Scholar : PubMed/NCBI
|
|
22
|
Lin L, Miller CT, Contreras JI, Prescott
MS, Dagenais SL, Wu R, Yee J, Orringer MB, Misek DE, Hanash SM, et
al: The hepatocyte nuclear factor 3 alpha gene, HNF3alpha (FOXA1),
on chromosome band 14q13 is amplified and overexpressed in
esophageal and lung adenocarcinomas. Cancer Res. 62:5273–5279.
2002.PubMed/NCBI
|
|
23
|
Sano M, Aoyagi K, Takahashi H, Kawamura T,
Mabuchi T, Igaki H, Tachimori Y, Kato H, Ochiai A, Honda H, et al:
Forkhead box A1 transcriptional pathway in KRT7-expressing
esophageal squamous cell carcinomas with extensive lymph node
metastasis. Int J Oncol. 36:321–330. 2010.PubMed/NCBI
|
|
24
|
Wang DH, Tiwari A, Kim ME, Clemons NJ,
Regmi NL, Hodges WA, Berman DM, Montgomery EA, Watkins DN, Zhang X,
et al: Hedgehog signaling regulates FOXA2 in esophageal
embryogenesis and Barrett's metaplasia. J Clin Invest.
124:3767–3780. 2014. View
Article : Google Scholar : PubMed/NCBI
|
|
25
|
Edge SB, Byrd DR, Compton CC, et al: AJCC
Cancer Staging Manual. (7th). (New York). Springer. 2010.
|
|
26
|
Livak KJ and Schmittgen TD: Analysis of
relative gene expression data using real-time quantitative PCR and
the 2(-Delta Delta C(T)) method. Methods. 25:402–408. 2001.
View Article : Google Scholar : PubMed/NCBI
|
|
27
|
Gao J, Aksoy BA, Dogrusoz U, Dresdner G,
Gross B, Sumer SO, Sun Y, Jacobsen A, Sinha R, Larsson E, et al:
Integrative analysis of complex cancer genomics and clinical
profiles using the cBioPortal. Sci Signal. 6:pl12013. View Article : Google Scholar : PubMed/NCBI
|
|
28
|
Hao Y, Triadafilopoulos G, Sahbaie P,
Young HS, Omary MB and Lowe AW: Gene expression profiling reveals
stromal genes expressed in common between Barrett's esophagus and
adenocarcinoma. Gastroenterology. 131:925–933. 2006. View Article : Google Scholar : PubMed/NCBI
|
|
29
|
Kim SM, Park YY, Park ES, Cho JY, Izzo JG,
Zhang D, Kim SB, Lee JH, Bhutani MS, Swisher SG, et al: Prognostic
biomarkers for esophageal adenocarcinoma identified by analysis of
tumor transcriptome. PLoS One. 5:e150742010. View Article : Google Scholar : PubMed/NCBI
|
|
30
|
Wang S, Zhan M, Yin J, Abraham JM, Mori Y,
Sato F, Xu Y, Olaru A, Berki AT, Li H, et al: Transcriptional
profiling suggests that Barrett's metaplasia is an early
intermediate stage in esophageal adenocarcinogenesis. Oncogene.
25:3346–3356. 2006. View Article : Google Scholar : PubMed/NCBI
|
|
31
|
Liu YP, Ma L, Wang SJ, Chen YN, Wu GX, Han
M and Wang XL: Prognostic value of lymph node metastases and lymph
node ratio in esophageal squamous cell carcinoma. Eur J Surg Oncol.
36:155–159. 2010. View Article : Google Scholar : PubMed/NCBI
|
|
32
|
Yazbeck R, Jaenisch SE and Watson DI: From
blood to breath: New horizons for esophageal cancer biomarkers.
World J Gastroenterol. 22:10077–10083. 2016. View Article : Google Scholar : PubMed/NCBI
|
|
33
|
Duncan SA, Navas MA, Dufort D, Rossant J
and Stoffel M: Regulation of a transcription factor network
required for differentiation and metabolism. Science. 281:692–695.
1998. View Article : Google Scholar : PubMed/NCBI
|
|
34
|
Kalkuhl A, Kaestner K, Buchmann A and
Schwarz M: Expression of hepatocyte-enriched nuclear transcription
factors in mouse liver tumours. Carcinogenesis. 17:609–612. 1996.
View Article : Google Scholar : PubMed/NCBI
|
|
35
|
Chen G, Korfhagen TR, Karp CL, Impey S, Xu
Y, Randell SH, Kitzmiller J, Maeda Y, Haitchi HM, Sridharan A, et
al: Foxa3 induces goblet cell metaplasia and inhibits innate
antiviral immunity. Am J Respir Crit Care Med. 189:301–313. 2014.
View Article : Google Scholar : PubMed/NCBI
|
|
36
|
Park SW, Verhaeghe C, Nguyenvu LT, Barbeau
R, Eisley CJ, Nakagami Y, Huang X, Woodruff PG, Fahy JV and Erle
DJ: Distinct roles of FOXA2 and FOXA3 in allergic airway disease
and asthma. Am J Respir Crit Care Med. 180:603–610. 2009.
View Article : Google Scholar : PubMed/NCBI
|
|
37
|
Ma X, Xu L, Gavrilova O and Mueller E:
Role of forkhead box protein A3 in age-associated metabolic
decline. Proc Natl Acad Sci USA. 111:14289–14294. 2014. View Article : Google Scholar : PubMed/NCBI
|
|
38
|
Shen W, Scearce LM, Brestelli JE, Sund NJ
and Kaestner KH: Foxa3 (hepatocyte nuclear factor 3gamma) is
required for the regulation of hepatic GLUT2 expression and the
maintenance of glucose homeostasis during a prolonged fast. J Biol
Chem. 276:42812–42817. 2001. View Article : Google Scholar : PubMed/NCBI
|
|
39
|
Ang SL, Wierda A, Wong D, Stevens KA,
Cascio S, Rossant J and Zaret KS: The formation and maintenance of
the definitive endoderm lineage in the mouse: involvement of
HNF3/forkhead proteins. Development. 119:1301–1315. 1993.PubMed/NCBI
|
|
40
|
Monaghan AP, Kaestner KH, Grau E and
Schütz G: Postimplantation expression patterns indicate a role for
the mouse forkhead/HNF-3 alpha, beta and gamma genes in
determination of the definitive endoderm, chordamesoderm and
neuroectoderm. Development. 119:567–578. 1993.PubMed/NCBI
|