Introduction
Gastric cancer (GC) is a common cancer and the
second leading cause of cancer mortalities worldwide (1). GC is a multifactorial disease that
involves oncogene activation and tumor suppressor gene inactivation
(2). The majority of patients are at
stage III and IV when diagnosed and the 5-year survival rate is as
low as 5% (3). Gene mutations may
affect the proliferation, invasion and metastasis of cancer cells
and the prognosis of patients with GC (4–6), and
elucidating the pathways involved in these mutations may improve
the diagnosis, treatment and prognosis of GC.
Radiotherapy serves an important role in the
treatment of various types of cancer and the National Comprehensive
Cancer Network guidelines recommend adjuvant chemoradiotherapy as a
standard treatment for postoperative patients with GC (7). Advances in radiotherapy protocols and
precise radiotherapy techniques have improved the efficacy of
radiotherapy (8). However, the
efficacy can vary for certain patients with similar pathologies and
radiotherapy regimens, and radiotherapy is highly toxic to normal
tissues (9). Therefore, the
identification of genes involved in radiation sensitivity may
improve patient outcomes.
In the context of radiation therapy, E3 ubiquitin
ligase has been revealed to sensitize tumor cells to radiation, and
is thought to be involved in the regulation of apoptosis, the cell
cycle and DNA damage repair (10,11).
Tripartite motif containing 36 (TRIM36) has unique E3 ubiquitin
ligase activity and serves an important role in transcriptional
regulation, cell proliferation, apoptosis and regulation of the p53
signaling pathway (12,13). p53 inactivation may significantly
modulate the sensitivity of tumor cells to radiation and
chemotherapeutic drugs (14,15). Conventional radiotherapy may cause
DNA damage and activation of the DNA damage response, resulting in
the expression of the p53 gene (16,17). DNA
repair is a regulatory mechanism to overcome cell damage and avoid
genomic instability (18). TRIM36
serves a key role in regulating the stability and function of the
p53 protein and may therefore affect the efficacy of radiotherapy
(19).
In the present study, The Cancer Genome Atlas (TCGA;
cancergenome.nih.gov; updated September
2017) database was used to summarize the clinicopathological
features that affect the prognosis of patients with GC. TRIM36 mRNA
expression levels were used to divide the patients into different
groups and cross-validation was performed to analyze the
association between TRIM36 status and the prognosis of patients
with GC receiving radiotherapy.
Materials and methods
Clinicopathological and RNA-sequencing
data
Clinical information and TRIM36 mRNA sequencing data
of patients with GC were downloaded from TCGA using the
TCGA-Assembler tool on R software (version 3.4.0; www.r-project.org). The data disposal process was as
follows: The clinical data were merged to obtain the patient
survival information, patients without a survival time or survival
outcome were excluded and the data were subsequently merged with
other clinical data to obtain a complete clinical document;
duplicated individuals were removed; the final 371 patients were
included in the statistical analysis. Clinicopathological data
included survival time, sex, age at illness and mortality,
histology type, Tumor-Node-Metastasis (TNM) stage and grade,
residual tumor and chemotherapy and radiotherapy received.
Radiosensitivity gene TRIM36
groups
The 371 samples were divided into the test group and
the validation group. The test group and the validation group were
further divided into high-expression and low-expression subgroups
according to the median level of TRIM36 in the test group. Each
group of stage III and IV patients was combined to investigate the
association between TRIM36 expression status and
radiosensitivity.
Statistical analysis
The digital database of clinicopathological
information and TRIM36 expression status of the 371 patients was
established using R software. The TRIM36 status below the median
was defined as ‘0’ and TRIM36 at or above the median was defined as
‘1’. The association between TRIM36 expression and clinicopathology
was examined using the Chi-squared test. Kaplan-Meier survival
analysis was performed to determine the radiotherapy factor for OS
and a log-rank test was used to compare the radiotherapy and
non-radiotherapy groups. Univariate Cox proportional hazards
regression was used to evaluate the effect of a single factor. To
control confounding variables, multivariate Cox proportional
hazards regression models were generated with the significant
clinicopathological factors. Statistical analyses were performed
using the packages ‘survival’ and ‘rms’ packages in R software.
P<0.05 was considered to indicate a statistically significant
difference. All of the statistical analyses were performed twice to
ensure accuracy.
Results
Patients and tumor
characteristics
The mean patient age was 65 years (range, 30–90
years). Univariate analysis revealed that TNM-stage (P=0.001),
T-stage (P=0.007), N-stage (P=0.001), tumor grade (P=0.001),
residual tumor (P=0.001), targeted therapy (P=0.018) and
radiotherapy (P=0.001) were statistically significant for the
overall survival (OS) rate in all patients. Multivariate analysis
revealed that residual tumor (P=0.003) and radiotherapy (P=0.005)
served important roles in GC outcome in all patients. TRIM36
expression status was not associated with the OS rate in the three
groups (Table I).
 | Table I.Clinical characteristics in the test,
validation and all patients groups. |
Table I.
Clinical characteristics in the test,
validation and all patients groups.
|
| Test group
(n=185) | Validation group
(n=186) | All patients
(n=371) |
|---|
|
|
|
|
|
|---|
|
| Univariate
analysis | Multivariate
analysis | Univariate
analysis | Multivariate
analysis | Univariate
analysis | Multivariate
analysis |
|---|
|
|
|
|
|
|
|
|
|---|
| Characteristic | HR | P-value | HR | P-value | HR | P-value | HR | P-value | HR | P-value | HR | P-value |
|---|
| Sex |
|
|
|
|
|
|
|
|
|
|
|
|
|
Male | 1.578
(0.893–2.787) | 0.116 | 1.458
(0.755–2.815) | 0.260 | 1.066
(0.679–1.673) | 0.780 | 1.515
(0.873–2.628) | 0.140 | 1.243
(0.882–1.752) | 0.214 | 1.521
(0.999–2.315) | 0.051 |
|
Female | 1 |
| 1 |
| 1 |
| 1 |
| 1 |
| 1 |
|
| Age (years) |
|
|
|
|
|
|
|
|
|
|
|
|
|
>60 | 1.420
(0.862–2.338) | 0.168 | 1.491
(0.797–2.791) | 0.210 | 1.358
(0.793–2.327) | 0.265 | 1.534
(0.769–3.061) | 0.224 | 1.407
(0.979–2.024) | 0.065 | 1.332
(0.849–2.089) | 0.212 |
|
≤60 | 1 |
| 1 |
| 1 |
| 1 |
| 1 |
| 1 |
|
| Histology |
|
|
|
|
|
|
|
|
|
|
|
|
|
MT+DT+ST | 0.413
(0.201–0.847) | 0.016 | 0.461
(0.181–1.171) | 0.103 | 1.768
(0.907–3.447) | 0.093 | 1.659
(0.600–4.524) | 0.331 | 0.878
(0.543–1.417) | 0.594 | 1.057
(0.578–1.932) | 0.858 |
|
NOS | 0.830
(0.475–1.450) | 0.511 | 0.978
(0471–2.032) | 0.953 | 1.646
(0.897–3.021) | 0.107 | 1.514
(0.700–3.217) | 0.291 | 1.172
(0.779–1.765) | 0.446 | 1.128
(0.695–1.832) | 0.625 |
|
PT+TT | 1 |
| 1 |
| 1 |
| 1 |
| 1 |
| 1 |
|
| TNM-stage |
|
|
|
|
|
|
|
|
|
|
|
|
| II | 1.482
(0.592–3.713) | 0.401 | 0.460
(0.111–1.896) | 0.282 | 1.723
(0.634–4.687) | 0.286 | 1.377
(0.283–6.703) | 0.690 | 1.586
(0.807–3.117) | 0.181 | 1.110
(0.349–3.531) | 0.859 |
|
III | 2.158
(0.896–5.196) | 0.086 | 0.419
(0.066–2.635) | 0.353 | 2.773
(1.096–7.017) | 0.031 | 2.680
(0.297–24.14) | 0.379 | 2.448
(1.297–4.622) | 0.006 | 0.967
(0.103–8.918) | 0.969 |
| IV | 3.390
(1.200–9.575) | 0.021 | 0.274
(0.037–2.015) | 0.203 | 4.025
(1.372–11.80) | 0.011 | 2.925
(0.145–58.96) | 0.484 | 3.636
(1.729–7.646) | 0.001 | 1.215
(0.067–22.05) | 0.895 |
| I | 1 |
| 1 |
| 1 |
| 1 |
| 1 |
| 1 |
|
| T-stage |
|
|
|
|
|
|
|
|
|
|
|
|
| T3 | 2.154
(1.105–4.200) | 0.024 | 2.808
(1.011–7.796) | 0.047 | 1.467
(0.813–2.647) | 0.203 | 0.546
(0.204–1.465) | 0.230 | 1.756
(1.133–2.273) | 0.012 | 1.559
(0.778–3.128) | 0.210 |
| T4 | 2.413
(1.147–5.074) | 0.020 | 3.052
(0.935–9.956) | 0.064 | 1.574
(0.635–2.937) | 0.154 | 0.551
(0.182–1.668) | 0.292 | 1.917
(1.192–3.083) | 0.007 | 1.756
(0.801–3.847) | 0.159 |
|
T1-T2 | 1 |
| 1 |
| 1 |
| 1 |
| 1 |
| 1 |
|
| N-stage |
|
|
|
|
|
|
|
|
|
|
|
|
| N1 |
1.562(0.834–2.926) | 0.164 | 2.853
(1.088–7.478) | 0.033 | 1.900
(0.945–3.823) | 0.072 | 1.078
(0.304–3.817) | 0.906 | 1.694
(1.063–2.697) | 0.027 | 1.635
(0.775–3.452) | 0.197 |
| N2 | 1.051
(0.481–2.298) | 0.900 | 1.580
(0.433–5.769) | 0.488 | 2.418
(1.163–5.025) | 0.017 | 1.295
(0.284–5.902) | 0.738 | 1.640
(0.975–2.758) | 0.062 | 1.908
(0.738–4.926) | 0.182 |
| N3 | 2.421
(1.266–4.629) | 0.008 | 3.985
(1.088–14.59) | 0.036 | 3.039
(1.508–6.125) | 0.002 | 1.358
(0.307–5.988) | 0.686 | 2.652
(1.654–4.250) | 0.001 | 2.777
(1.074–7.179) | 0.035 |
| N0 | 1 |
| 1 |
| 1 |
| 1 |
| 1 |
| 1 |
|
| M-stage |
|
|
|
|
|
|
|
|
|
|
|
|
| M1 | 2.563
(1.223–5.880) | 0.014 | 0.774
(0.183–3.269) | 0.728 | 1.315
(0.692–2.499) | 0.403 | 0.791
(0.095–6.575) | 0.829 | 1.836
(0.991–3.401) | 0.054 | 0.403
(0.123–1.316) | 0.132 |
| M0 | 1 |
| 1 |
| 1 |
| 1 |
| 1 |
| 1 |
|
| Tumor-grade |
|
|
|
|
|
|
|
|
|
|
|
|
| G3 | 1.168
(0.713–1.916) | 0.536 | 1.212
(0.621–2.363) | 0.573 | 1.702
(1.059–2.738) | 0.028 | 1.524
(0.773–3.000) | 0.223 | 1.344
(1.136–1.591) | 0.001 | 1.090
(0.490–2.420) | 0.833 |
|
G1-G2 | 1 |
| 1 |
| 1 |
| 1 |
| 1 |
| 1 |
|
| Residual |
|
|
|
|
|
|
|
|
|
|
|
|
| R1 | 3.091
(1.318–7.251) | 0.009 | 4.843
(1.543–15.17) | 0.007 | 1.000
(0.311–7.251) | 0.991 | 0.878
(0.234–3.291) | 0.848 | 1.786
(0.902–3.539) | 0.096 | 2.017
(0.934–4.355) | 0.074 |
| R2 | 10.27
(5.185–20.34) | 0.001 | 8.025
(2.801–22.99) | 0.001 | 3.727
(1.695–8.196) | 0.001 | 3.491
(0.721–16.89) | 0.120 | 6.180
(3.096–12.34) | 0.001 | 4.517
(1.659–12.29) | 0.003 |
| R0 | 1 |
| 1 |
| 1 |
| 1 |
| 1 |
| 1 |
|
| Targeted
therapy |
|
|
|
|
|
|
|
|
|
|
|
|
|
Yes | 0.545
(0.335–0.886) | 0.014 | 0.557
(0.279–1.112) | 0.097 | 0.810
(0.517–1.271) | 0.361 | 1.017
(0.520–1.989) | 0.959 | 0.672
(0.484–0.933) | 0.018 | 0.863
(0.547–1.362) | 0.527 |
| No | 1 |
| 1 |
| 1 |
| 1 |
| 1 |
| 1 |
|
| Radiotherapy |
|
|
|
|
|
|
|
|
|
|
|
|
|
Yes | 0.377
(0.186–0.765) | 0.007 | 0.541
(0.212–1.324) | 0.178 | 0.429
(0.230–0.810) | 0.008 | 0.401
(0.163–0.988) | 0.047 | 0.405
(0.253–0.646) | 0.001 | 0.408
(0.217–0.765) | 0.005 |
| No | 1 |
| 1 |
| 1 |
| 1 |
| 1 |
| 1 |
|
| TRIM36
expression |
|
|
|
|
|
|
|
|
|
|
|
|
|
High | 0.815
(0.512–1.299) | 0.390 | 1.234
(0.691–2.204) | 0.476 | 0.753
(0.468–1.213) | 0.244 | 0.939
(0.520–1.696) | 0.837 | 0.761
(0.553–1.048) | 0.095 | 0.828
(0.565–1.215) | 0.335 |
|
Low | 1 |
| 1 |
| 1 |
| 1 |
| 1 |
| 1 |
|
Association between TRIM36 expression
and clinicopathological parameters
Analysis of the association between TRIM36 status
and other clinical factors was performed using the Chi-squared test
(Table II). The expression status
of TRIM36 was independent of histology (P=0.951), TNM-stage
(P=0.750), distant metastasis (P=0.723) and tumor grade (P=0.811).
The expression of genes associated with prognosis in patients with
a tumor is often associated with clinicopathological factors
(20–22). However, in the current study TRIM36
expression status was not associated with clinical and pathological
factors.
| Table II.Association between TRIM36 expression
and clinicopathological features of patients with gastric
cancer. |
Table II.
Association between TRIM36 expression
and clinicopathological features of patients with gastric
cancer.
|
| TRIM36 expression
status |
|
|
|---|
|
|
|
|
|
|---|
| Feature | High | Low | χ2
value | P-value |
|---|
| Sex |
|
| 0.032 | 0.858 |
|
Female | 64 | 66 |
|
|
|
Male | 121 | 120 |
|
|
| Age (years) |
|
| 0.166 | 0.784 |
|
≤60 | 59 | 56 |
|
|
|
>60 | 124 | 129 |
|
|
| Histology |
|
|
|
|
|
PT+TT | 40 | 42 | 0.101 | 0.951 |
|
DT+ST+MT | 40 | 47 |
|
|
|
NOS | 82 | 94 |
|
|
| TNM-stage |
|
| 0.101 | 0.750 |
|
I–II | 87 | 84 |
|
|
|
III–IV | 91 | 94 |
|
|
| T-stage |
|
| 0.103 | 0.748 |
|
T1-T2 | 51 | 48 |
|
|
|
T3-T4 | 133 | 135 |
|
|
| N-stage |
|
| 0.940 | 0.332 |
|
N0-N1 | 113 | 104 |
|
|
|
N2-N3 | 67 | 76 |
|
|
| M-stage |
|
| 0.125 | 0.723 |
| M0 | 170 | 169 |
|
|
| M1 | 15 | 17 |
|
|
| Tumor grade |
|
| 0.057 | 0.811 |
|
G1-G2 | 72 | 69 |
|
|
| G3 | 110 | 111 |
|
|
| Residual |
|
| 0.001 | 0.972 |
| R0 | 156 | 154 |
|
|
|
R1-R2 | 17 | 17 |
|
|
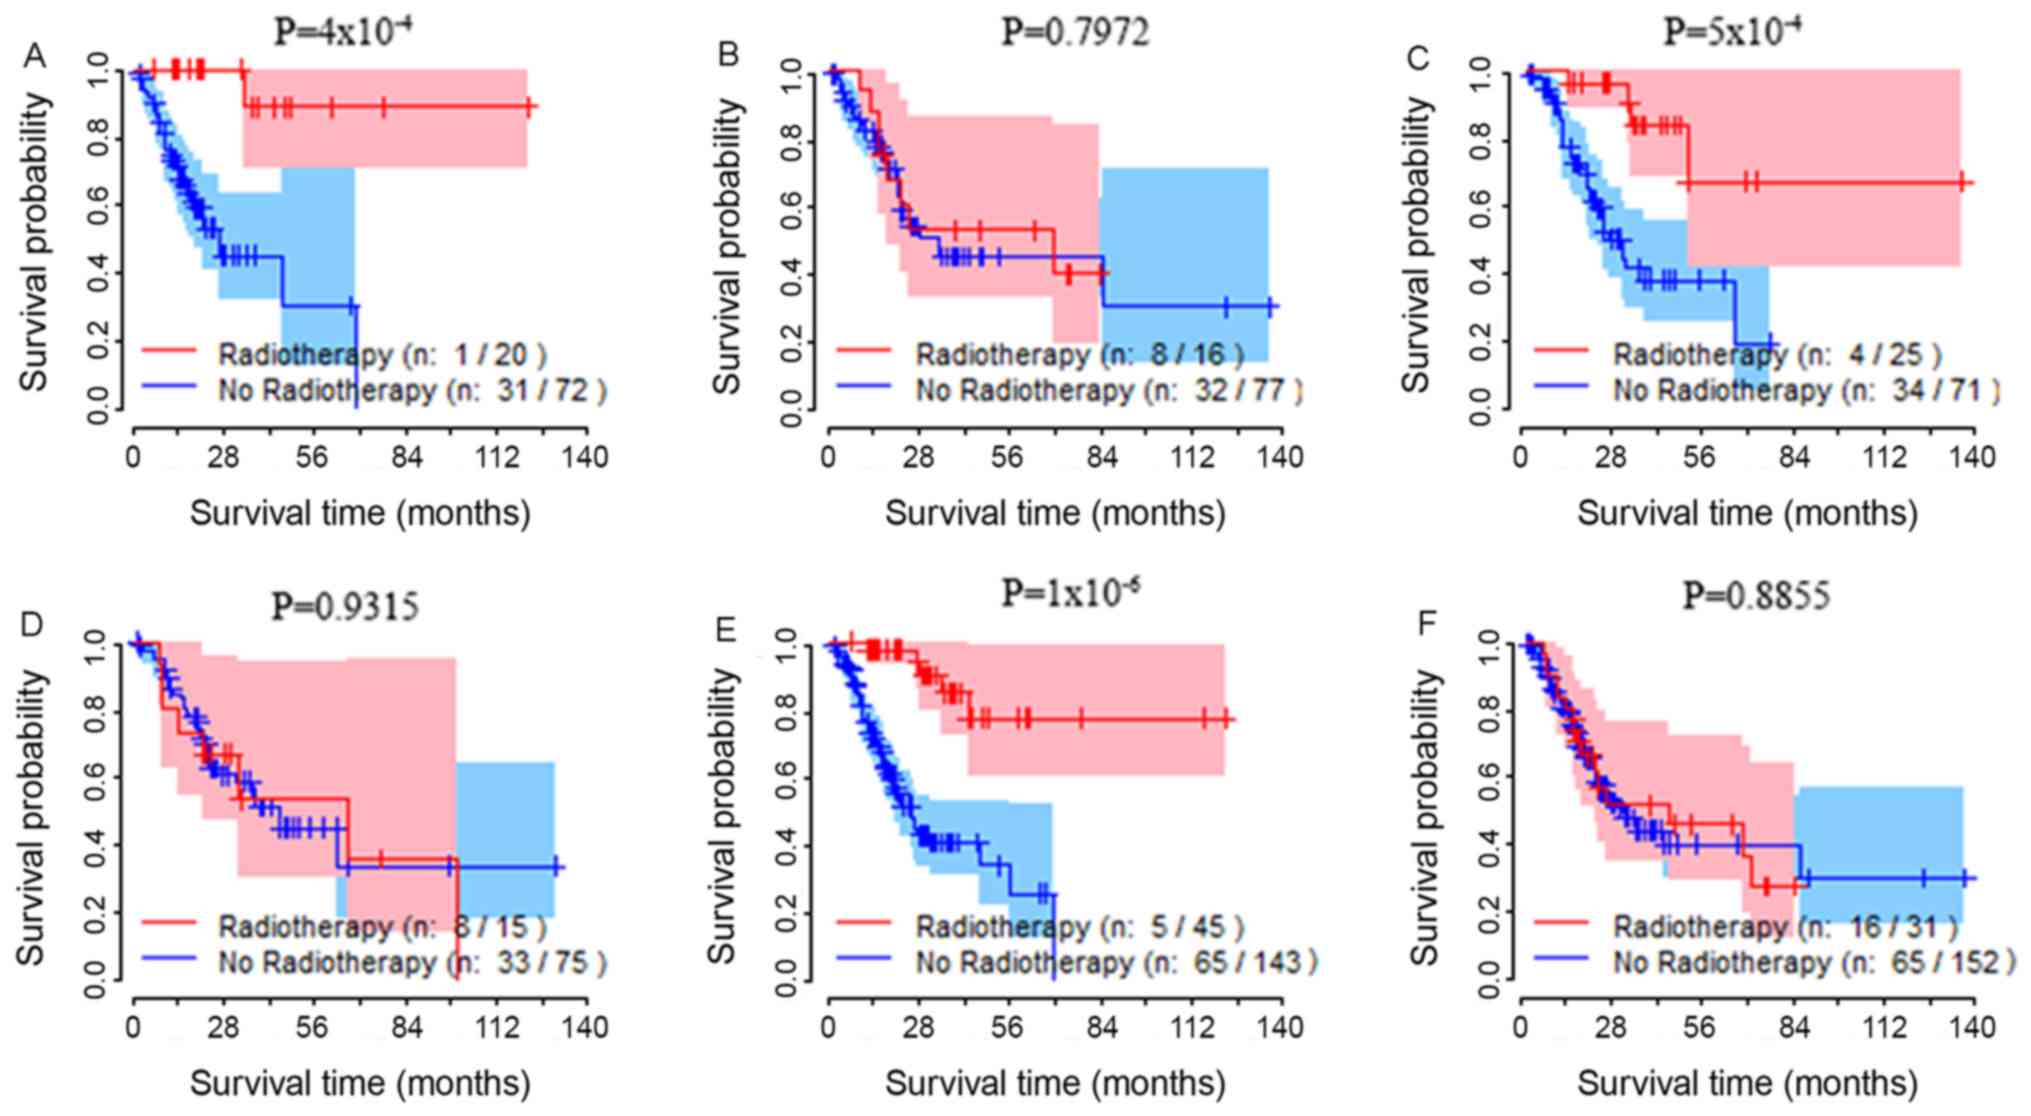
Analysis of TRIM36 gene expression in
the test group
The total number of samples was divided into test
and validation groups. Survival rate analysis was performed in the
test group. Based on the median value of TRIM36 expression in the
test group, the group was divided into high- and low-expression
subgroups. In the high TRIM36 expression subgroup, the OS rate of
patients treated with radiotherapy was significantly increased
compared with patients who did not receive radiotherapy (Fig. 1A). The OS rate was not associated
with whether patients had received radiotherapy in the low
expression subgroup (Fig. 1B).
Multivariate Cox proportional hazard regression
models for the test group of patients were generated according to
the following clinicopathological characteristics: Sex, age,
histological type, TNM-stage, tumor grade, residual tumor, positive
lymph nodes and targeted therapy. The multivariate Cox proportional
hazard regression analysis (Table
III) revealed that while the OS rate of patients with GC
receiving radiotherapy in the high-expression subgroup was
increased [hazard ratio (HR), 0.095; 95% confidence interval (CI),
0.012–0.748; P=0.025], there was no difference in the OS rate in
the low-expression subgroup (P=0.643).
| Table III.Association between RT and overall
survival rate in tripartite motif containing 36 high and low
expression subgroups. |
Table III.
Association between RT and overall
survival rate in tripartite motif containing 36 high and low
expression subgroups.
| A, Test group |
|---|
|
|---|
|
|
| Univariate analysis
(RT vs. no RT) | Multivariate
analysis (RT vs. no RT) |
|---|
|
|
|
|
|
|---|
| Expression
level | Number of
patients | HR | P-value | HR | P-value |
|---|
| High | 92 | 0.062
(0.008–0.462) | 0.007 | 0.095
(0.012–0.748) | 0.025 |
| Low | 93 | 0.902
(0.411–1.981) | 0.797 | 0.786
(0.283–2.183) | 0.643 |
|
| B, Validation
group |
|
|
|
| Univariate
analysis (RT vs. no RT) | Multivariate
analysis (RT vs. no RT) |
|
|
|
|
|
| Expression
level | Number of
patients | HR | P-value | HR | P-value |
|
| High | 96 | 0.190
(0.067–0.540) | 0.002 | 0.075
(0.020–0.276) | <0.001 |
| Low | 90 | 1.035
(0.467–2.294) | 0.931 | 0.804
(0.304–2.127) | 0.661 |
|
| C, All
patients |
|
|
|
| Univariate
analysis (RT vs. no RT) | Multivariate
analysis (RT vs. no RT) |
|
|
|
|
|
| Expression
level | Number of
patients | HR | P-value | HR | P-value |
|
| High | 188 | 0.133
(0.053–0.334) | <0.001 | 0.094
(0.030–0.296) | <0.001 |
| Low | 183 | 0.959
(0.549–1.674) | 0.884 | 1.079
(0.421–1.725) | 0.658 |
Analysis of TRIM36 expression in the
validation group
The same statistical analysis as described for the
test group was performed in the validation group. The results
suggested that radiotherapy was associated with increased OS in the
high TRIM36 expression subgroup (Fig.
1C). No difference in the OS rate between patients with GC
receiving radiotherapy and those not receiving radiotherapy was
observed in the low TRIM36 expression subgroup (Fig. 1D). Multivariate Cox proportional
hazard regression analysis (Table
III) revealed that patients with GC that received radiotherapy
displayed improved OS rates when compared with patients with GC
that did not receive radiotherapy in the high expression group (HR,
0.075; 95% CI, 0.020–0.276; P<0.001). However, in the low
expression subgroup, the OS rate of patients with GC that received
radiotherapy was not different compared with patients with GC that
did not receive radiotherapy (P=0.661).
Analysis of TRIM36 expression in all
patients
The 371 samples were divided into high and low
expression subgroups according to the median expression level of
TRIM36 in the test group. Univariate analysis revealed that
patients with high expression that received radiotherapy had a
lower risk of mortality (Fig. 1E)
compared with those that did not receive radiotherapy, and that
radiotherapy did not affect mortality in the low expression
subgroup (Fig. 1F). Multivariate
analysis revealed that there was no difference in OS rates in
patients that received radiotherapy compared with those that did
not receive radiotherapy in the low expression subgroup (P=0.658;
Table III). However, the OS rate
of patients that received radiotherapy was significantly improved
when compared with those that did not receive chemotherapy in the
high expression subgroup (HR, 0.094; 95% CI, 0.030–0.296;
P<0.001). Univariate and multivariate analysis revealed that
radiotherapy significantly increased the OS rate of patients with
high expression of TRIM36 compared with patients with low
expression.
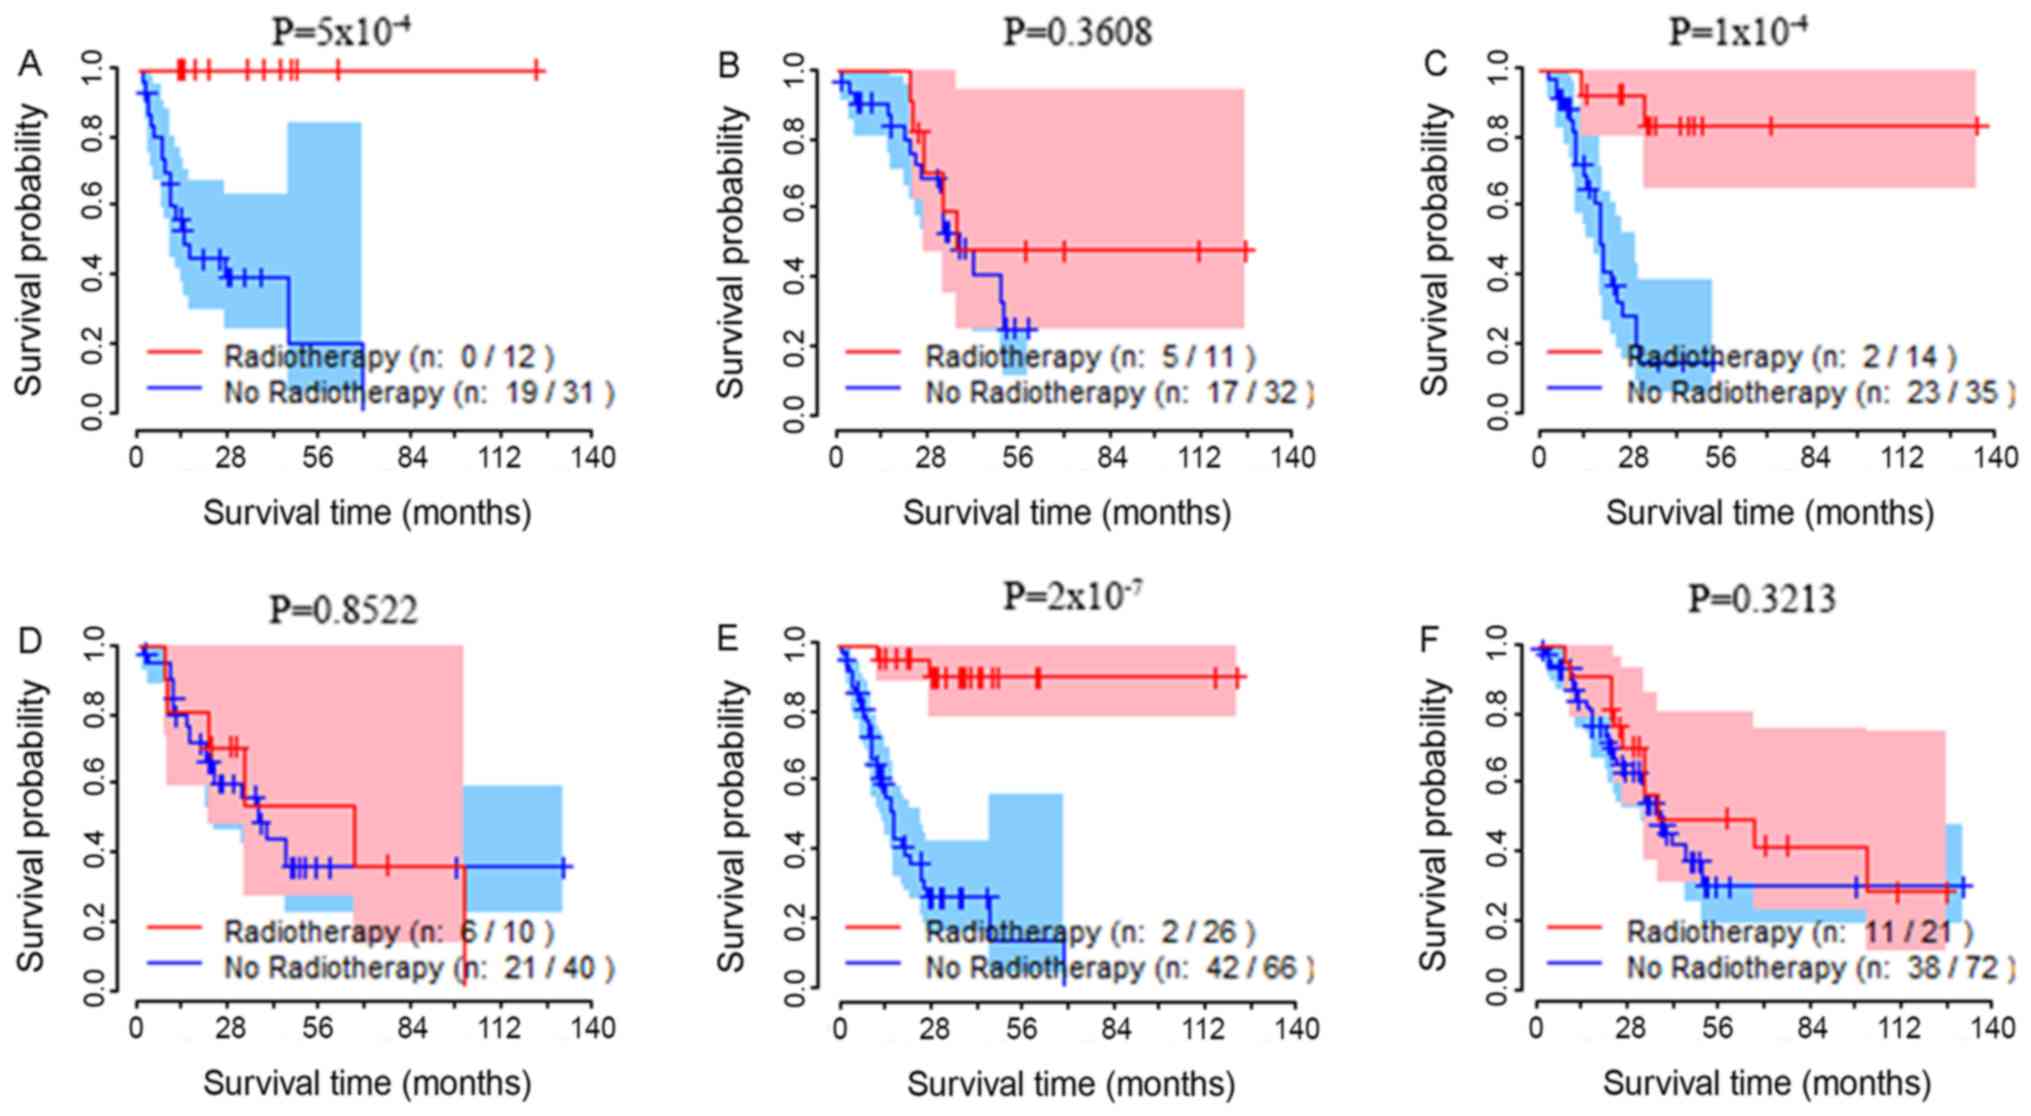
Association between tumor stage,
TRIM36 status, radiotherapy and OS rate
Patients with TNM-stage I, II, III and IV cancer
were analyzed separately. Patients with stage III and IV cancer
were grouped together, due to the small sample size of patients
with stage IV cancer. According to the aforementioned statistical
methods, for each subgroup analysis, survival analysis revealed
that patients presenting with stage III/IV, a high TRIM36
expression level and had received radiotherapy had significantly
increased OS rates compared with patients with a high expression
level that did not receive radiotherapy. The survival curves of the
test group, the validation group and the total sample group are
presented in Fig. 2A, C and E,
respectively. In the test, validation and total sample groups,
there was no difference in the OS rates of patients with stage
III/IV that had low TRIM36 expression and had received radiotherapy
compared to those that did not receive radiotherapy (Fig. 2B, D and F).
Discussion
Personalized radiotherapy an important factor in the
development of radiology (23). In
the present study, the OS rate of patients with high TRIM36
expression receiving radiotherapy was increased compared with
patients with low TRIM36 expression receiving radiotherapy. This
suggested that the TRIM36 gene may be a useful prognostic biomarker
for patients with GC receiving radiotherapy. To the best of the
authors' knowledge, the current study is the first to establish an
association between radiosensitivity and TRIM36 expression status
in patients with GC.
The American Joint Committee on Cancer staging
system is a widely used clinical prognostic indicator for malignant
tumors (24). In the current study,
an association between high TRIM36 expression and sensitivity to
radiotherapy was established. The majority of patients receiving
postoperative radiotherapy for GC were patients with TNM-stage III
and IV. To avoid interference of TNM-stage on OS, patients with
III–IV cancer in the three groups were analyzed separately.
Survival analysis was performed on high and low TRIM36 expression
subgroups with and without radiotherapy in patients with stage
III/IV GC. The OS rate of patients with stage III/IV GC that had
high TRIM36 expression was increased in those that received
radiotherapy compared with those who did not receive radiotherapy.
This suggested that TRIM36 may be involved in radiotherapy
sensitivity in GC.
Gene expression in tumor tissues is usually
associated with clinicopathological factors (20–22). The
overexpression of programmed death-ligand 1 was beneficial in
patients with breast carcinoma that received radiotherapy and the
expression status was affected by intrinsic subtypes (20). Previous studies have reported that
high expression levels of chromosomal maintenance 1 (CRM1) or
cyclin dependent kinase 5 (CDK5) in GC lead to increased OS rates
when compared with low expression levels. The expression level of
CRM1 was associated with lymph node metastasis and the TNM-stage,
and CDK5 expression levels were associated with sex and Lauren's
classification (21). In the present
study, TRIM36 expression levels were an independent factor,
suggesting that TRIM36 may be a radiosensitivity gene signature in
GC radiotherapy.
E3 ubiquitin ligases are divided into two major
groups: The homologous to the E6-AP carboxyl terminus family and
the really interesting new gene finger-containing protein family
(25). The latter is the larger
group and binds to E2 ubiquitin ligase to promote ubiquitination
(26–28). Studies have revealed that E3
ubiquitin ligases may be involved in the occurrence of GC, and that
they are highly expressed in malignant gastric tumors (4,29). E3
ubiquitin ligase is an oncogene that is highly expressed in
patients with GC with a poor prognosis (29). However, studies have shown that E3
ubiquitin ligase may have a tumor suppressor function in GC
(30,31) as E3 ubiquitin ligase is often
deregulated during the development of GC. The specific mechanism
and role of E3 ubiquitin ligase in the treatment of GC requires
further study.
The p53 signaling pathway is a central regulator of
cell proliferation that directly regulates the transcription of
genes involved in the cell cycle and DNA repair (32–34). The
primary mechanism of p53 signaling in the repair of cellular DNA is
ubiquitination (35). The E3
ubiquitin ligase is a negative regulator of p53 and mainly exerts
its effects via degradation of p53 and inhibition of the
transcriptional target of p53 (10,11). It
can be speculated that high expression of TRIM36 may enhance
sensitivity to radiotherapy by inhibiting the p53 signaling pathway
via its own unique E3 ubiquitin ligase structure. The extracellular
signal-regulated kinase (ERK) signaling pathway regulates cell
proliferation, differentiation and survival, and mediates and
amplifies signals during tumor invasion and metastasis (36). Previous studies have demonstrated
that the extracellular signal-regulated kinase (ERK) signaling
pathway is associated with tumor radiation resistance (37,38). In
addition, previous studies have indicated that TRIM36 serves an
inhibitory effect on the ERK signaling pathway in prostate cancer
(39). Based on these studies,
TRIM36 may increase radiosensitivity by inhibiting the ERK
signaling pathway in GC.
Radiosensitivity of the tumor is linked to the
immune response, and radiation itself is considered to be
immunosuppressive (40,41). The TRIM family is involved in
immunity and carcinogenesis in cellular processes. TRIM36 may serve
an important role in the process of radiation immunity by inducing
cancer cells to undergo apoptosis. TRIM proteins have been studied
in numerous types of cancer, and TRIM overexpression has been
observed in GC. However, the molecular mechanism linking TRIM
overexpression and GC pathology remains unclear. A previous study
suggested that the TRIM25 gene enhanced cell migration and invasion
by activating the transforming growth factor β pathway in GC, and
that overexpression of TRIM25 resulted in poor outcomes (42). TRIM44 and TRIM59 are also associated
with GC, and a high expression was associated with poor outcome
(22,43). Previous research has demonstrated
that TRIM59 promotes gastric tumorigenesis through suppression of
downstream signals of p53 (43). The
results obtained from these studies suggested that high expression
of TRIM resulted in poor GC prognosis. However, the current study
revealed that the expression of TRIM36 is not associated with the
prognosis of GC; however, high expression may be associated with
improved OS rates of patients receiving radiotherapy. Based on the
results obtained in the current study, TRIM36 may be associated
with the radiosensitivity in GC. However, the biological pathways
involved remain to be explored.
The current study has certain limitations. First, a
sample size of 371 is relatively small. However, this limitation
was partially overcome using a cross-validation strategy to
investigate the association between TRIM36 expression and
radiosensitivity. Second, TRIM36 is located on chromosome 5q22.3,
which frequently contains DNA alterations in tumor (44). The mRNA level of TRIM36 may not
accurately represent the expression of the TRIM36 gene. Therefore,
using the median mRNA expression level of TRIM36 to divide groups
could cause a bias. Finally, potential bias could arise from
variation in the follow-up information obtained from TCGA due to
the retrospective nature of the TCGA cohort.
In conclusion, the current study demonstrated the
potential predictive and prognostic value of TRIM36 expression
status in a TCGA dataset of patients with GC that received
radiotherapy. However, further studies are required to validate the
predictive value of this potential biomarker. High TRIM36
expression levels were associated with improved clinical prognosis
in patients with GC receiving radiotherapy, possibly through the
downregulation of the p53 signaling pathway. The results obtained
in the current study provide novel insights into the treatment of
GC, any may be particularly useful for clinical trials determining
radiation resistance and sensitivity in patients.
Acknowledgements
Not applicable.
Funding
This work was supported in part by the National
Natural Science Foundation of China (grant nos. 81773541 and
81573253), Jiangsu Provincial Key Project in Research and
Development of Advanced Clinical Technique (BL2018657), Key
Investigation and Development Program of China (2016YFC0904700 and
2016YFC0904702) and the Jiangsu Provincial Medical Youth Talent
Project of Invigorating Health Care through Science Technology and
Education (grant no. QNRC2016733).
Availability of data and materials
The datasets generated and analyzed during the
current study are available in The Cancer Genome Atlas repository
(http://cancergenome.nih.gov/).
Authors' contributions
ZM, JZ, ZT, TC and ZZ conceived and designed the
study. ZM, TC and ZZ drafted the manuscript. TC and ZZ collected
data for the manuscript from the TCGA database. ZM, TC and ZZ
drafted the manuscript. HZ, LA and LX performed the statistical
analysis. All authors read and approved the final manuscript.
Ethics approval and consent to
participate
Not applicable.
Patient consent for publication
Not applicable.
Competing interests
The authors declare that they have no competing
interests.
References
|
1
|
Van Cutsem E, Sagaert X, Topal B,
Haustermans K and Prenen H: Gastric cancer. Lancet. 388:2654–2664.
2016. View Article : Google Scholar : PubMed/NCBI
|
|
2
|
Chen CN, Lin JJ, Chen JJ, Lee PH, Yang CY,
Kuo ML, Chang KJ and Hsieh FJ: Gene expression profile predicts
patient survival of gastric cancer after surgical resection. J
Clin. Oncol. 23:7286–7295. 2005.
|
|
3
|
Jiang C, Chen X, Alattar M, Wei J and Liu
H: MicroRNAs in tumorigenesis, metastasis, diagnosis and prognosis
of gastric cancer. Cancer Gene Ther. 22:291–301. 2015. View Article : Google Scholar : PubMed/NCBI
|
|
4
|
Bai J, Zhou Y, Chen G, Zeng J, Ding J, Tan
Y, Zhou J and Li G: Overexpression of Cullin1 is associated with
poor prognosis of patients with gastric cancer. Hum Pathol.
42:375–383. 2011. View Article : Google Scholar : PubMed/NCBI
|
|
5
|
Wang S, Wu X, Zhang J, Chen Y, Xu J, Xia
X, He S, Qiang F, Li A, Shu Y, et al: CHIP functions as a novel
suppressor of tumour angiogenesis with prognostic significance in
human gastric cancer. Gut. 62:496–508. 2013. View Article : Google Scholar : PubMed/NCBI
|
|
6
|
Deng J, Liang H, Ying G, Zhang R, Wang B,
Yu J, Fan D and Hao X: Methylation of CpG sites in RNF180 DNA
promoter prediction poor survival of gastric cancer. Oncotarget.
5:3173–3183. 2014. View Article : Google Scholar : PubMed/NCBI
|
|
7
|
National Comprehensive Cancer Network
(NCCN), . NCCN clinical practice guidelines in oncology (NCCN
guidelines). Gastric cancer. 2016.http://www.nccn.org/professionals/physician_gls/f_guidelines_nojava.asp
|
|
8
|
Bhide SA and Nutting CM: Recent advances
in radiotherapy. BMC Med. 8:252010. View Article : Google Scholar : PubMed/NCBI
|
|
9
|
Dahele M, Skinner M, Schultz B, Cardoso M,
Bell C and Ung YC: Adjuvant radiotherapy for gastric cancer: A
dosimetric comparison of 3-dimensional conformal radiotherapy,
tomotherapy and conventional intensity modulated radiotherapy
treatment plans. Med Dosim. 35:115–121. 2010. View Article : Google Scholar : PubMed/NCBI
|
|
10
|
Kurokawa M, Kim J, Geradts J, Matsuura K,
Liu L, Ran X, Xia W, Ribar TJ, Henao R, Dewhirst MW, et al: A
network of substrates of the E3 ubiquitin ligases MDM2 and HUWE1
control apoptosis independently of p53. Sci Signal. 6:ra322013.
View Article : Google Scholar : PubMed/NCBI
|
|
11
|
Sane S and Rezvani K: Essential roles of
E3 ubiquitin ligases in p53 regulation. Int J Mol Sci. 18(pii):
E4422017. View Article : Google Scholar : PubMed/NCBI
|
|
12
|
Reymond A, Meroni G, Fantozzi A, Merla G,
Cairo S, Luzi L, Riganelli D, Zanaria E, Messali S, Cainarca S, et
al: The tripartite motif family identifies cell compartments. EMBO
J. 20:2140–2151. 2001. View Article : Google Scholar : PubMed/NCBI
|
|
13
|
Gushchina LV, Kwiatkowski TA, Bhattacharya
S and Weisleder NL: Conserved structural and functional aspects of
the tripartite motif gene family point towards therapeutic
applications in multiple diseases. Pharmacol Ther. 185:12–25. 2018.
View Article : Google Scholar : PubMed/NCBI
|
|
14
|
Sereno M, De Castro J, Cejas P,
Garcia-Cabezas MA, Belda C, Casado E, Feliu J, Gómez C, López M and
Barón MG: Expression profile as predictor of relapse after adjuvant
treatment in gastric cancer. J Gastrointest Cancer. 43:181–189.
2012. View Article : Google Scholar : PubMed/NCBI
|
|
15
|
Hamada M, Fujiwara T, Hizuta A, Gochi A,
Naomoto Y, Takakura N, Takahashi K, Roth JA, Tanaka N and Orita K:
The p53 gene is a potent determinant of chemosensitivity and
radiosensitivity in gastric and colorectal cancers. J Cancer Res
Clin Oncol. 122:360–365. 1996. View Article : Google Scholar : PubMed/NCBI
|
|
16
|
Dai Y and Grant S: New insights into
checkpoint kinase 1 in the DNA damage response signaling network.
Clin Cancer Res. 16:376–383. 2010. View Article : Google Scholar : PubMed/NCBI
|
|
17
|
Fei P and El-Deiry WS: P53 and radiation
responses. Oncogene. 22:5774–5783. 2003. View Article : Google Scholar : PubMed/NCBI
|
|
18
|
Zhou BB and Elledge SJ: The DNA damage
response: Putting checkpoints in perspective. Nature. 408:433–439.
2000. View
Article : Google Scholar : PubMed/NCBI
|
|
19
|
Picksley SM and Lane DP: The p53-mdm2
autoregulatory feedback loop: A paradigm for the regulation of
growth control by p53? Bioessays. 15:689–690. 1993. View Article : Google Scholar : PubMed/NCBI
|
|
20
|
Jang BS and Kim IA: A radiosensitivity
gene signature and PD-L1 status predict clinical outcome of
patients with invasive breast carcinoma in the cancer genome atlas
(TCGA) dataset. Radiother Oncol. 124:403–410. 2017. View Article : Google Scholar : PubMed/NCBI
|
|
21
|
Sun YQ, Xie JW, Xie HT, Chen PC, Zhang XL,
Zheng CH, Li P, Wang JB, Lin JX, Cao LL, et al: Expression of CRM1
and CDK5 shows high prognostic accuracy for gastric cancer. World J
Gastroenterol. 23:2012–2022. 2017. View Article : Google Scholar : PubMed/NCBI
|
|
22
|
Kashimoto K, Komatsu S, Ichikawa D, Arita
T, Konishi H, Nagata H, Takeshita H, Nishimura Y, Hirajima S,
Kawaguchi T, et al: Overexpression of TRIM44 contributes to
malignant outcome in gastric carcinoma. Cancer Sci. 103:2021–2026.
2012. View Article : Google Scholar : PubMed/NCBI
|
|
23
|
Hirst DG and Robson T: Molecular biology:
The key to personalised treatment in radiation oncology? Br J
Radiol. 83:723–728. 2010. View Article : Google Scholar : PubMed/NCBI
|
|
24
|
Sobin LH, Gospodarowicz MK and Wittekind:
UICC TNM. Classification of malignant tumours. (7th). Wiley &
Liss. (New York). 2009.
|
|
25
|
Deshaies RJ and Joazeiro CA: RING domain
E3 ubiquitin ligases. Annu Rev Biochem. 78:399–434. 2009.
View Article : Google Scholar : PubMed/NCBI
|
|
26
|
Aravind L and Koonin EV: The U box is a
modified RING finger - a common domain in ubiquitination. Curr
Biol. 10:R132–R134. 2000. View Article : Google Scholar : PubMed/NCBI
|
|
27
|
Rohde JR, Breitkreutz A, Chenal A,
Sansonetti PJ and Parsot C: Type III secretion effectors of the
IpaH family are E3 ubiquitin ligases. Cell Host Microbe. 1:77–83.
2007. View Article : Google Scholar : PubMed/NCBI
|
|
28
|
Qiu J, Sheedlo MJ, Yu K, Tan Y, Nakayasu
ES, Das C, Liu X and Luo ZQ: Ubiquitination independent of E1 and
E2 enzymes by bacterial effectors. Nature. 533:120–124. 2016.
View Article : Google Scholar : PubMed/NCBI
|
|
29
|
Hou YC and Deng JY: Role of E3 ubiquitin
ligases in gastric cancer. World J Gastroenterol. 21:786–793. 2015.
View Article : Google Scholar : PubMed/NCBI
|
|
30
|
Milne AN, Leguit R, Corver WE, Morsink FH,
Polak M, de Leng WW, Carvalho R and Offerhaus GJ: Loss of
CDC4/FBXW7 in gastric carcinoma. Cell Oncol. 32:347–359.
2010.PubMed/NCBI
|
|
31
|
Calcagno DQ, Freitas VM, Leal MF, de Souza
CR, Demachki S, Montenegro R, Assumpção PP, Khayat AS, Smith Mde A,
dos Santos AK and Burbano RR: MYC, FBXW7 and TP53 copy number
variation and expression in gastric cancer. BMC Gastroenterol.
13:1412013. View Article : Google Scholar : PubMed/NCBI
|
|
32
|
Burdelya LG, Komarova EA, Hill JE, Browder
T, Tararova ND, Mavrakis L, DiCorleto PE, Folkman J and Gudkov AV:
Inhibition of p53 response in tumor stroma improves efficacy of
anticancer treatment by increasing antiangiogenic effects of
chemotherapy and radiotherapy in mice. Cancer Res. 66:9356–9361.
2006. View Article : Google Scholar : PubMed/NCBI
|
|
33
|
Lewanski CR and Gullick WJ: Radiotherapy
and cellular signalling. Lancet Oncol. 2:366–370. 2001. View Article : Google Scholar : PubMed/NCBI
|
|
34
|
Caratozzolo MF, Micale L, Turturo MG,
Cornacchia S, Fusco C, Marzano F, Augello B, D'Erchia AM, Guerrini
L, Pesole G, et al: TRIM8 modulates p53 activity to dictate cell
cycle arrest. Cell Cycle. 11:511–523. 2012. View Article : Google Scholar : PubMed/NCBI
|
|
35
|
Hock AK and Vousden KH: The role of
ubiquitin modification in the regulation of p53. Biochim Biophys
Acta. 1843:137–149. 2014. View Article : Google Scholar : PubMed/NCBI
|
|
36
|
Liu F, Yang X, Geng M and Huang M:
Targeting ERK, an Achilles' Heel of the MAPK pathway, in cancer
therapy. Acta Pharm Sin B. 8:552–562. 2018. View Article : Google Scholar : PubMed/NCBI
|
|
37
|
Martins-Neves SR, Cleton-Jansen AM and
Gomes CMF: Therapy-induced enrichment of cancer stem-like cells in
solid human tumors: Where do we stand? Pharmacol Res. 137:193–204.
2018. View Article : Google Scholar : PubMed/NCBI
|
|
38
|
Song Q, Jiang S, Zhang X, Pan C, Lu C,
Peng J and Li Q: Radiosensitivity of human ovarian cancer cells is
enhanced by pseudolaric acid B due to the inhibition of the
Ras/Raf/ERK signaling pathway. Exp Ther Med. 15:685–690.
2018.PubMed/NCBI
|
|
39
|
Liang C, Wang S, Qin C, Bao M, Cheng G,
Liu B, Shao P, Lv Q, Song N, Hua L, et al: TRIM36, a novel
androgen-responsive gene, enhances anti-androgen efficacy against
prostate cancer by inhibiting MAPK/ERK signaling pathways. Cell
Death Dis. 9:1552018. View Article : Google Scholar : PubMed/NCBI
|
|
40
|
Sharabi AB, Lim M, DeWeese TL and Drake
CG: Radiation and checkpoint blockade immunotherapy:
Radiosensitisation and potential mechanisms of synergy. Lancet
Oncol. 16:e498–e509. 2015. View Article : Google Scholar : PubMed/NCBI
|
|
41
|
Twyman-Saint Victor C, Rech AJ, Maity A,
Rengan R, Pauken KE, Stelekati E, Benci JL, Xu B, Dada H, Odorizzi
PM, et al: Radiation and dual checkpoint blockade activate
non-redundant immune mechanisms in cancer. Nature. 520:373–377.
2015. View Article : Google Scholar : PubMed/NCBI
|
|
42
|
Zhu Z, Wang Y, Zhang C, Yu S, Zhu Q, Hou K
and Yan B: TRIM25 blockade by RNA interference inhibited migration
and invasion of gastric cancer cells through TGF-β signaling. Sci
Rep. 6:190702016. View Article : Google Scholar : PubMed/NCBI
|
|
43
|
Zhou Z, Ji Z, Wang Y, Li J, Cao H, Zhu HH
and Gao WQ: TRIM59 is up-regulated in gastric tumors, promoting
ubiquitination and degradation of p53. Gastroenterology.
147:1043–1054. 2014. View Article : Google Scholar : PubMed/NCBI
|
|
44
|
Balint I, Müller A, Nagy A and Kovacs G:
Cloning and characterisation of the RBCC728/TRIM36 zinc-binding
protein from the tumor suppressor gene region at chromosome 5q22.3.
Gene. 332:45–50. 2004. View Article : Google Scholar : PubMed/NCBI
|