Introduction
Neuroblastomas are common pediatric extracranial
tumors of neural crest origin that account for 10% of cancer cases
in children and ~15% of cancer-associated mortalities in children
(1–6). Clinical features of neuroblastoma
include heterogeneity, high malignancy and metastasis (7,8). Common
therapeutic methods include surgery, radiotherapy and chemotherapy,
and novel methods include immunotherapy and differentiation
therapy; however, the treatment of neuroblastoma remains
unsatisfactory and the prognosis is poor (9). Therefore, an increasing number of
studies have aimed to identify feasible biotherapies and drug
targets (10).
TP53BP2 is a member of the apoptosis-stimulating
protein of p53 (ASPP) family, which can regulate p53-dependent
apoptosis (11). A number of studies
have indicated that TP53BP2 is overexpressed in various tumor
types, and is a critical factor in tumorigenesis and development
(12,13). TP53BP2 inhibits squamous cell
carcinoma by regulating p63 (14).
In breast cancer, overexpression of TP53BP2 is often associated
with a poor prognosis, and TP53BP2 can interact with
microRNA-548d-3p to regulate proliferation and apoptosis (15). In gastric cancer, the expression of
TP53BP2 is associated with tumor stage (16). Survival data from R2 genomic analyses
in the present study indicate that TP53BP2 may be associated with
the prognosis of patients with neuroblastoma; however, to the best
of our knowledge, the role and molecular mechanisms of TP53BP2 in
neuroblastoma have not been reported. Therefore, the aim of the
present study was to investigate the mechanism of TP53BP2 in
neuroblastoma and provide a theoretical basis for clinical
treatment.
Autophagy is an evolutionally conserved mechanism
that can degrade organelles, proteins, macromolecules and ribosomes
via lysosomes, which is critical for the maintenance of
intracellular stability and stress responses (17). There are four types of autophagy,
including macroautophagy (also termed autophagy), selective
autophagy, microautophagy and chapter-one-mediated autophagy
(18–20). Autophagy consists of several key
steps, including initiation, nucleation, expansion and maturation
of autophagosomes. A number of autophagy-related (ATG) genes
participate in autophagy (21–23).
Previously, autophagy has been reported to be associated with
pathological and disease processes, including infectious diseases,
autoimmune diseases, myopathy, neurodegenerative diseases and
cancer (21,24,25). The
present study demonstrated that TP53BP2 can regulate proliferation
and autophagy of neuroblastoma cells. Knockdown of TP53BP2
inhibited cell proliferation and increased the expression level of
LC3 II (also termed LC3B). LC3 I is the precursor of LC3 II; LC3 I
is activated when autophagy occurs and induces the production of
LC3 II, which promotes autophagy (26). In summary, the results of the present
study revealed that TP53BP2 may be used as a prognostic marker for
neuroblastoma and may regulate the proliferation of neuroblastoma
cells.
Materials and methods
Cell culture
The human neuroblastoma cell lines SK-N-AS,
BE(2)C, SK-N-DZ, SK-N-F1 and SHEP1
were obtained from the American Type Culture Collection (ATCC;
Manassas, VA, USA). The BE(2)C cells
were cultured in a 1:1 mixture of Dulbecco's modified Eagle's
medium (DMEM) and Ham's nutrient mixture F12 (DMEM/F12; Thermo
Fisher Scientific, Inc., Waltham, MA, USA) with 10% fetal bovine
serum (FBS; Thermo Fisher Scientific, Inc.) and 1%
penicillin/streptomycin (P/S). SK-N-AS, SK-N-DZ, SK-N-F1 and SHEP1
cells were cultured in DMEM (Thermo Fisher Scientific, Inc.) with
10% FBS and 1% P/S. The 293FT cell line (ATCC) was cultured with
DMEM (Gibco; Thermo Fisher Scientific, Inc.) containing 1%
glutamine, glycine and pyruvate. All cells were incubated at 37°C
in an incubator with 5% CO2.
Lentiviral infection
TP53BP2 short hairpin (shRNA) and green fluorescent
protein (GFP) shRNA were purchased from BGI (Shanghai, China). The
sequences of TP53BP2 shRNA (shTP53BP2) were as follows:
shTP53BP2-1# forward,
5′-CACCGCAGAATGCCAAGCTACAACACGAATGTTGTAGCTTGGCATTCTGC-3′ and
reverse, 5′-AAAAGCAGAATGCCAAGCTACAACATTCGTGTTGTAGCTTGGCATTCTGC-3′;
and shTP53BP2-2# forward,
5′-CACCGCTGCAGTAGGTCCCTATATCCGAAGATATAGGGACCTACTGCAGC-3′ and
reverse, 5′-AAAAGCTGCAGTAGGTCCCTATATCTTCGGATATAGGGACCTACTGCAGC-3′.
The PLKO.1 vector (Thermo Fisher Scientific, Inc.) was digested
using AgeI and BamHI, and the annealed human TP53BP2 shRNA was
inserted into the PLKO.1 vector using T4 ligase. Subsequently, the
vector was transformed and monoclonal clones were selected for
sequencing. The plasmids were extracted using a plasmid extracted
kit (Tiangen Biotech Co., Ltd., Beijing, China). Lentiviruses were
generated by co-transfecting the 293FT cell line with the packaging
plasmids pLP1, pLP2 and pLP/VSVG (all from Invitrogen; Thermo
Fisher Scientific, Inc.) and the shRNA plasmids.
Lipofectamine® 2000 (Invitrogen; Thermo Fisher
Scientific, Inc.) was used for all transfections, according to the
manufacturer's protocol. After 48 h, virus-containing media were
harvested. BE(2)C and SK-N-DZ cells
were plated at a density of 5×10⁵ cells in 100 mm plates
and cultured for 24 h. Subsequently, the virus-containing media
were mixed with 4 µg/ml Polybrene (Invitrogen; Thermo Fisher
Scientific, Inc.) and used for cell infection. At 24 h after
infection, the medium was removed and cells were cultured with 2
mg/ml puromycin for 2 days. The cells were then selected for
subsequent experiments.
Cell proliferation assay
MTT assays were used to investigate cell
proliferation. Briefly, ~1,000 cells were seeded in 96-well plates
with 200 µl DMEM/F12. After 24 h of culture, 20 µl MTT was added to
each well and the cells were incubated for 4 h. Dimethylsulfoxide
was added to the wells to dissolve the purple formazan crystals.
After 10 min on a shaking table, the absorbance was determined at
560 nm using a microplate reader daily for 7 days. All experiments
were performed independently in triplicate.
5-Bromo-2-deoxyuridine (BrdU) staining
assay
For BrdU immunofluorescence staining, BE(2)C and SK-N-DZ cells were cultured in
24-well plates and incubated with 10 µg/ml BrdU for 45 min at 37°C.
The cells were then washed with PBS three times and fixed for 20
min with 4% paraformaldehyde (PFA) at room temperature.
Subsequently, the cells were exposed to 0.3% Triton X-100 for 5
min, treated with 1 mol/l HCl and blocked for 1 h with 10% goat
serum (Thermo Fisher Scientific, Inc.) diluted with PBS at room
temperature. The cells were then incubated with a monoclonal rat
primary antibody against BrdU (1:200; catalog no. ab6326; Abcam,
Cambridge, UK) for 1 h at room temperature and with Alexa
Fluor® 594 goat anti-rat immunoglobulin G (IgG)
secondary antibody (1:400; catalog no. A-21211; Invitrogen; Thermo
Fisher Scientific, Inc.) for 1 h at room temperature. DAPI (300 nM)
was used for nuclear staining for 15 min at room temperature. A
Nikon 80i fluorescence microscope (Nikon Corporation, Tokyo, Japan)
was used to observe the number of stained cells (magnification,
×200). Images of ten randomly selected microscopic fields were
captured.
Soft agar assay
Soft agar assays were used to determine cell
tumorigenicity. In total, 800 BE(2)C
and SK-N-DZ cells were mixed with 0.3% Noble agar in DMEM/F12 and
then plated in 6-well plates containing a solidified bottom layer
of 0.6% Noble agar in growth medium. Following solidification, the
plates were transferred to a 37°C incubator with 5% CO2.
After 4 weeks, colonies were stained with MTT (1 µg/ml) for 30 min
at 37°C and images were captured using a light microscope
(magnification, ×200).
Reverse transcription-quantitative
polymerase chain reaction (RT-qPCR)
RT-qPCR was used to determine the expression of
mRNA. According to the manufacturer's protocol, 1 ml
TRIzol® (Takara Bio, Inc., Otsu, Japan) was added to
each group (shGFP-, shTP53BP2-1#- and shTP53BP2-2#-transfected
cells, and untransfected cells), and the cells were then harvested
and extracted for total RNA purification. The mRNA was
reverse-transcribed into cDNA using Moloney murine leukemia virus
reverse transcriptase (Promega Corporation, Madison, WI, USA). The
mRNA expression levels of TP53BP2, ATG3, ATG5 and ATG7 were
determined using the SYBR Green PCR Master mix (Takara Bio, Inc.)
using qPCR. The qPCRs were performed in triplicate using the
OneStep plus7500 RT-PCR system (Bio-Rad Laboratories, Inc.,
Hercules, CA, USA). The amplification conditions were as follows:
95°C for 10 min, 95°C for 15 sec, 60°C for 30 sec and 35 cycles of
30 sec at 72°C. The following primer sequences were used: GAPDH
forward, 5′-ACGGATTTGGTCGTATTGGG-3′ and reverse,
5′-TCCTGGAAGATGGTGATGGG-3′; TP53BP2 forward,
5′-AGTCAGTTCCTTGTGGAGCC-3′ and reverse, 5′-CCGCAGAAACACCTGTGAAC-3′;
ATG3 forward, 5′-TTGGCTATGATGAGCAACGG-3′ and reverse,
5′-CCCCTCCTTCTGCAACAGTCT-3′; ATG5 forward,
5′-TCAGCTCTTCCTTGGAACATCA-3′ and reverse,
5′-CCCATCCAGAGTTGCTTGTGA-3′; and ATG7 forward,
5′-TTTGCTTCCGTGACCGTACC-3′ and reverse,
5′-CTTTTCCCATCCAACTGCTTTA-3′. The data were analysed using the
2−ΔΔCq method (27).
GAPDH was used as the control.
Western blot assay
SK-N-AS, BE(2)C,
SK-N-DZ, SK-N-F1 and SHEP1 cells were digested with trypsin and
washed twice with PBS. Cells were harvested and suspended in 1%
radioimmunoprecipitation assay lysis buffer (Beyotime Institute of
Biotechnology, Haimen, China). Protein concentrations were measured
using a Bicinchoninic Acid protein assay kit (Beyotime Institute of
Biotechnology). Total protein (50 µg) was separated using SDS-PAGE
(30% gel) and then the proteins were transferred onto
polyvinylidene difluoride membranes. Following blocking for 2 h
with 5% goat serum (diluted with PBS) at room temperature, the
membranes were incubated overnight at 4°C with the following
primary antibodies: Anti-TP53BP2 (1:1,000, catalog no. ab181377;
Abcam), anti-LC3 II (1:1,000; catalog no. ab48394; Abcam) and
anti-tubulin (1:5,000; catalog no. ab7291; Abcam). The membranes
were than incubated at room temperature for 2 h with horseradish
peroxidase-conjugated anti-mouse IgG secondary antibody (1:10,000;
catalog no. 04-18-06) or horseradish peroxidase-conjugated rabbit
anti-goat IgG secondary antibody (1:10,000; catalog no. 14-13-06;
both from KPL, Inc., Gaithersburg, MD, USA). Proteins were
visualized using BeyoECL Plus reagent (Beyotime Institute of
Biotechnology). Western blot data were quantified with Gel-Pro
Analyzer 4 software (Media Cybernetics, Inc., Rockville, MD,
USA).
Immunofluorescence assay
The expression of LC3 II was detected using
immunofluorescence. In total, ~2×10⁴ cells were seeded
into 24-well plates, washed three times with PBS and fixed for 20
min with 4% PFA at room temperature. PBS with 1% Triton X-100 was
then added for 20 min. Following three washes with PBS, the cells
were blocked for 1 h with 4% goat serum (diluted with PBS) at room
temperature. The cells were then incubated with a rabbit monoclonal
antibody against LC3 II (1:100; catalog no. ab48394; Abcam) at 4°C
overnight. Alexa Fluor® 488 goat anti-rat IgG secondary
antibody (1:400; Invitrogen; catalog no. O-6382; Thermo Fisher
Scientific, Inc.) was then added for 2 h at room temperature in the
dark. DAPI (300 nM) was used for nuclear staining for 15 min at
room temperature. Images of ten randomly selected microscopic
fields were captured using a confocal microscope (magnification,
×2,000).
Patient data analysis
Patient data and gene expression datasets were
obtained from the R2: Microarray analysis and visualization
platform (http://hgserver1.amc.nl/cgi-bin/r2/main.cgi), which
contains data from the ‘Tumour Neuroblastoma public Versteeg’,
‘Tumour Neuroblastoma-SEQC’ and ‘Tumour Neuroblastoma-Kocak’
datasets (28). These datasets
contain mRNA expression data and no protein expression data. The
Versteeg dataset contains 88 cases of neuroblastoma with tumor
grade and gene variation. All prognosis analyses were performed
with R2, and all data and P-values from a log-rank test were
downloaded. Kaplan-Meier analysis was performed and the resulting
survival curves were generated using GraphPad Prism 6.0 software
(GraphPad Software, Inc., La Jolla, CA, USA). All cut-off values
for generating high and low expression groups were determined using
the online R2 database algorithm.
Statistical analysis
All data were analyzed using SPSS software (version
20.0; IBM Corp., Armonk, NY, USA). Quantitative data are presented
as the mean ± standard deviation. One-way analysis of variance
followed by Fisher's least significant difference test was used to
assess significant differences. P<0.05 was considered to
indicate a statistically significant difference.
Results
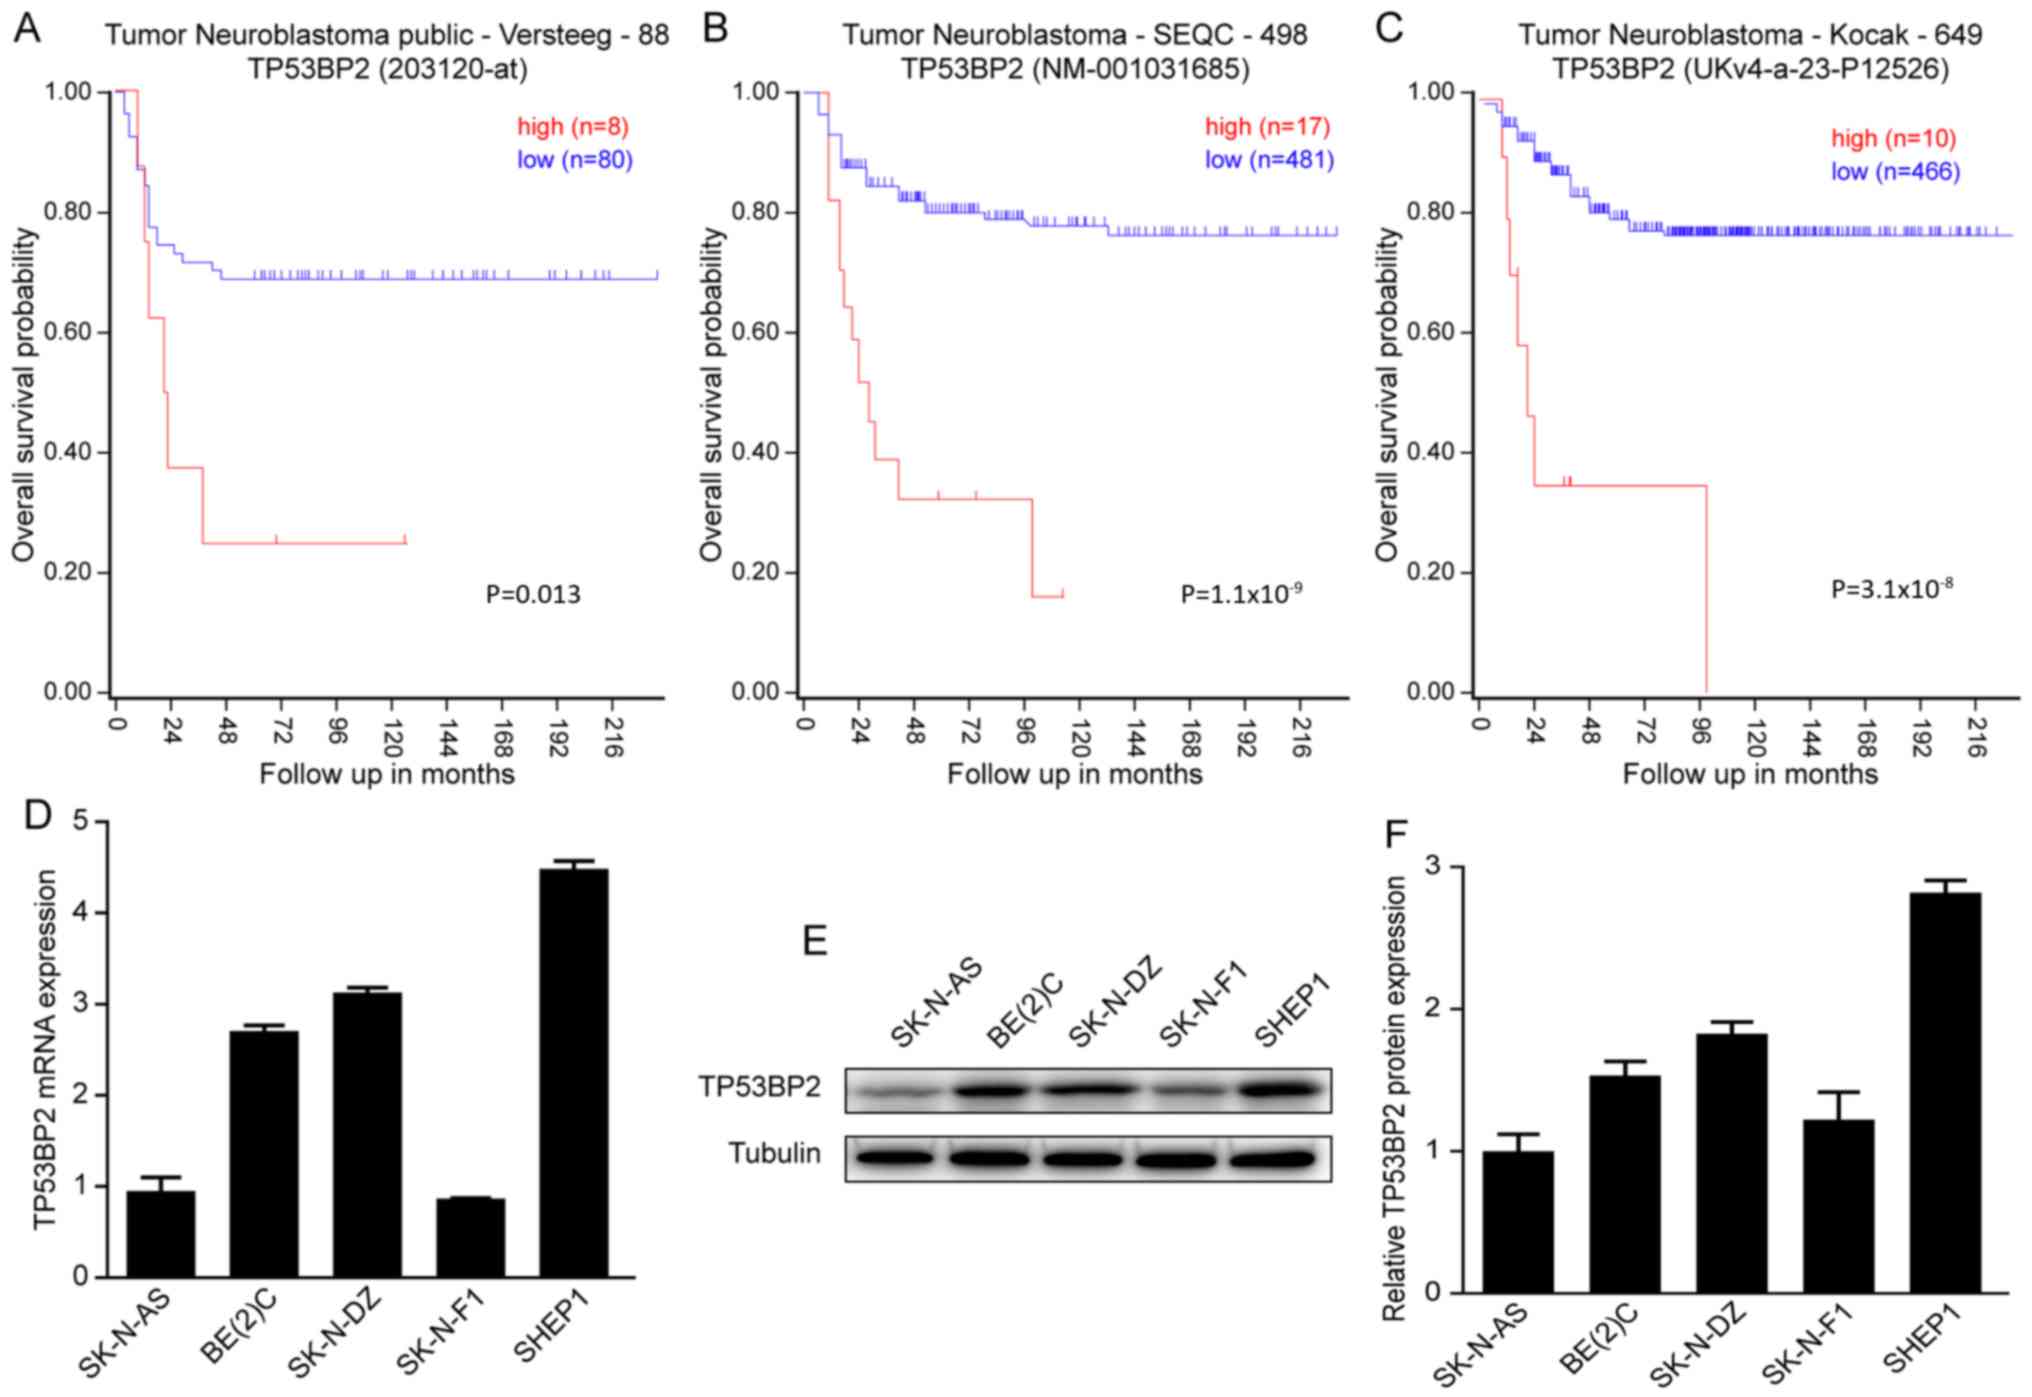
Increased expression of TP53BP2 is
associated with poor prognosis of patients with neuroblastoma
To investigate whether TP53BP2 can be used as a
prognostic indicator of neuroblastoma. A Kaplan-Meier analysis of
progression-free survival for the Versteeg data indicated that an
increased expression level of TP53BP2 is associated with a poor
prognosis and a low expression level of TP53BP2 is associated with
improved overall survival (Fig. 1A).
Similar results were observed for the SEQC and Kocak data (Fig. 1B and C). In summary, all data
indicated that an increased expression level of TP53BP2 is
associated with a poor prognosis for patients with
neuroblastoma.
Subsequently, RT-qPCR and western blot assays were
performed to determine the expression of TP53BP2 in the
neuroblastoma cell lines SK-N-AS, BE(2)-C, SK-N-DZ, SK-N-F1 and SHEP1. It was
identified that TP53BP2 was expressed in all five cell lines
(Fig. 1D and E). The aim of these
experiments was to illustrate the involvement of TP53BP2 in the
tumorigenesis of neuroblastoma (29).
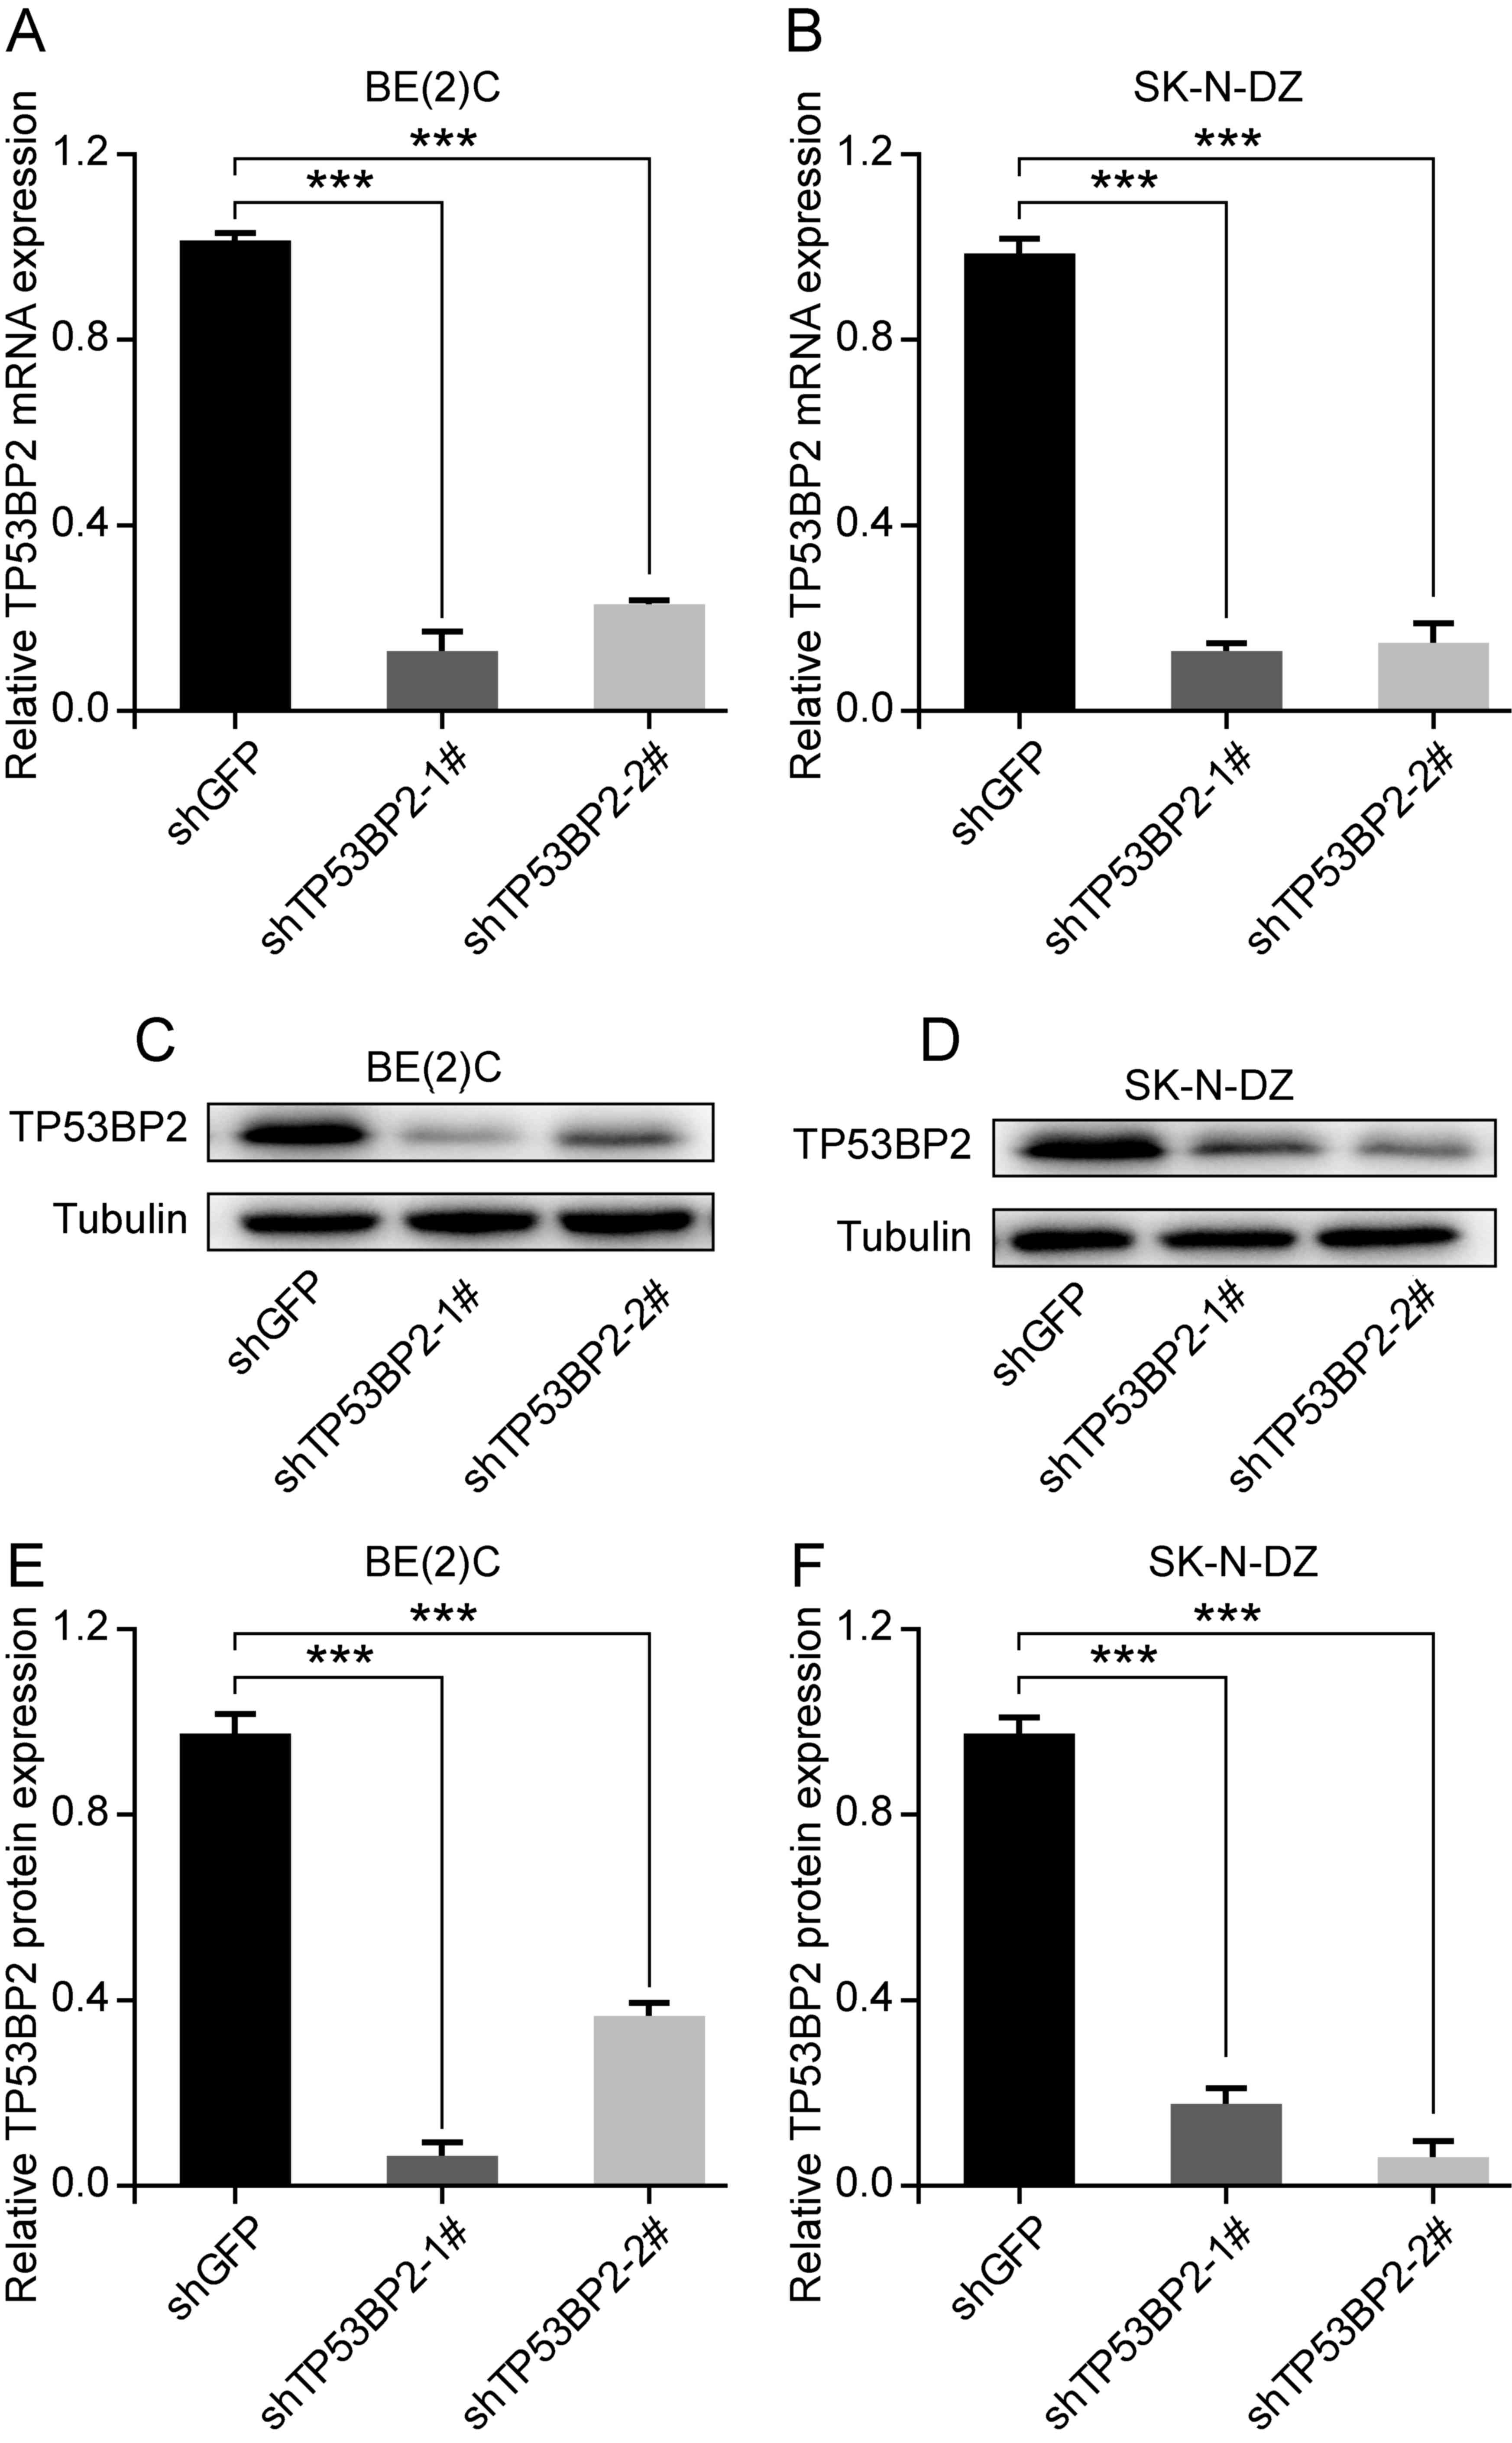
Downregulation of TP53BP2 inhibits the
proliferation of neuroblastoma cells
To investigate the role of TP53BP2 in cell
proliferation, the human neuroblastoma cell lines BE(2)C and SK-N-DZ were selected. Lentivirus
vectors containing shTP53BP2 were successfully constructed and
shGFP was used as a control (30,31).
Through screening, stable TP53BP2-knockdown cells were established.
Western blot and RT-qPCR analysis revealed that TP53BP2 was
significantly downregulated in the transfected cells compared with
in the controls (Fig. 2A-D).
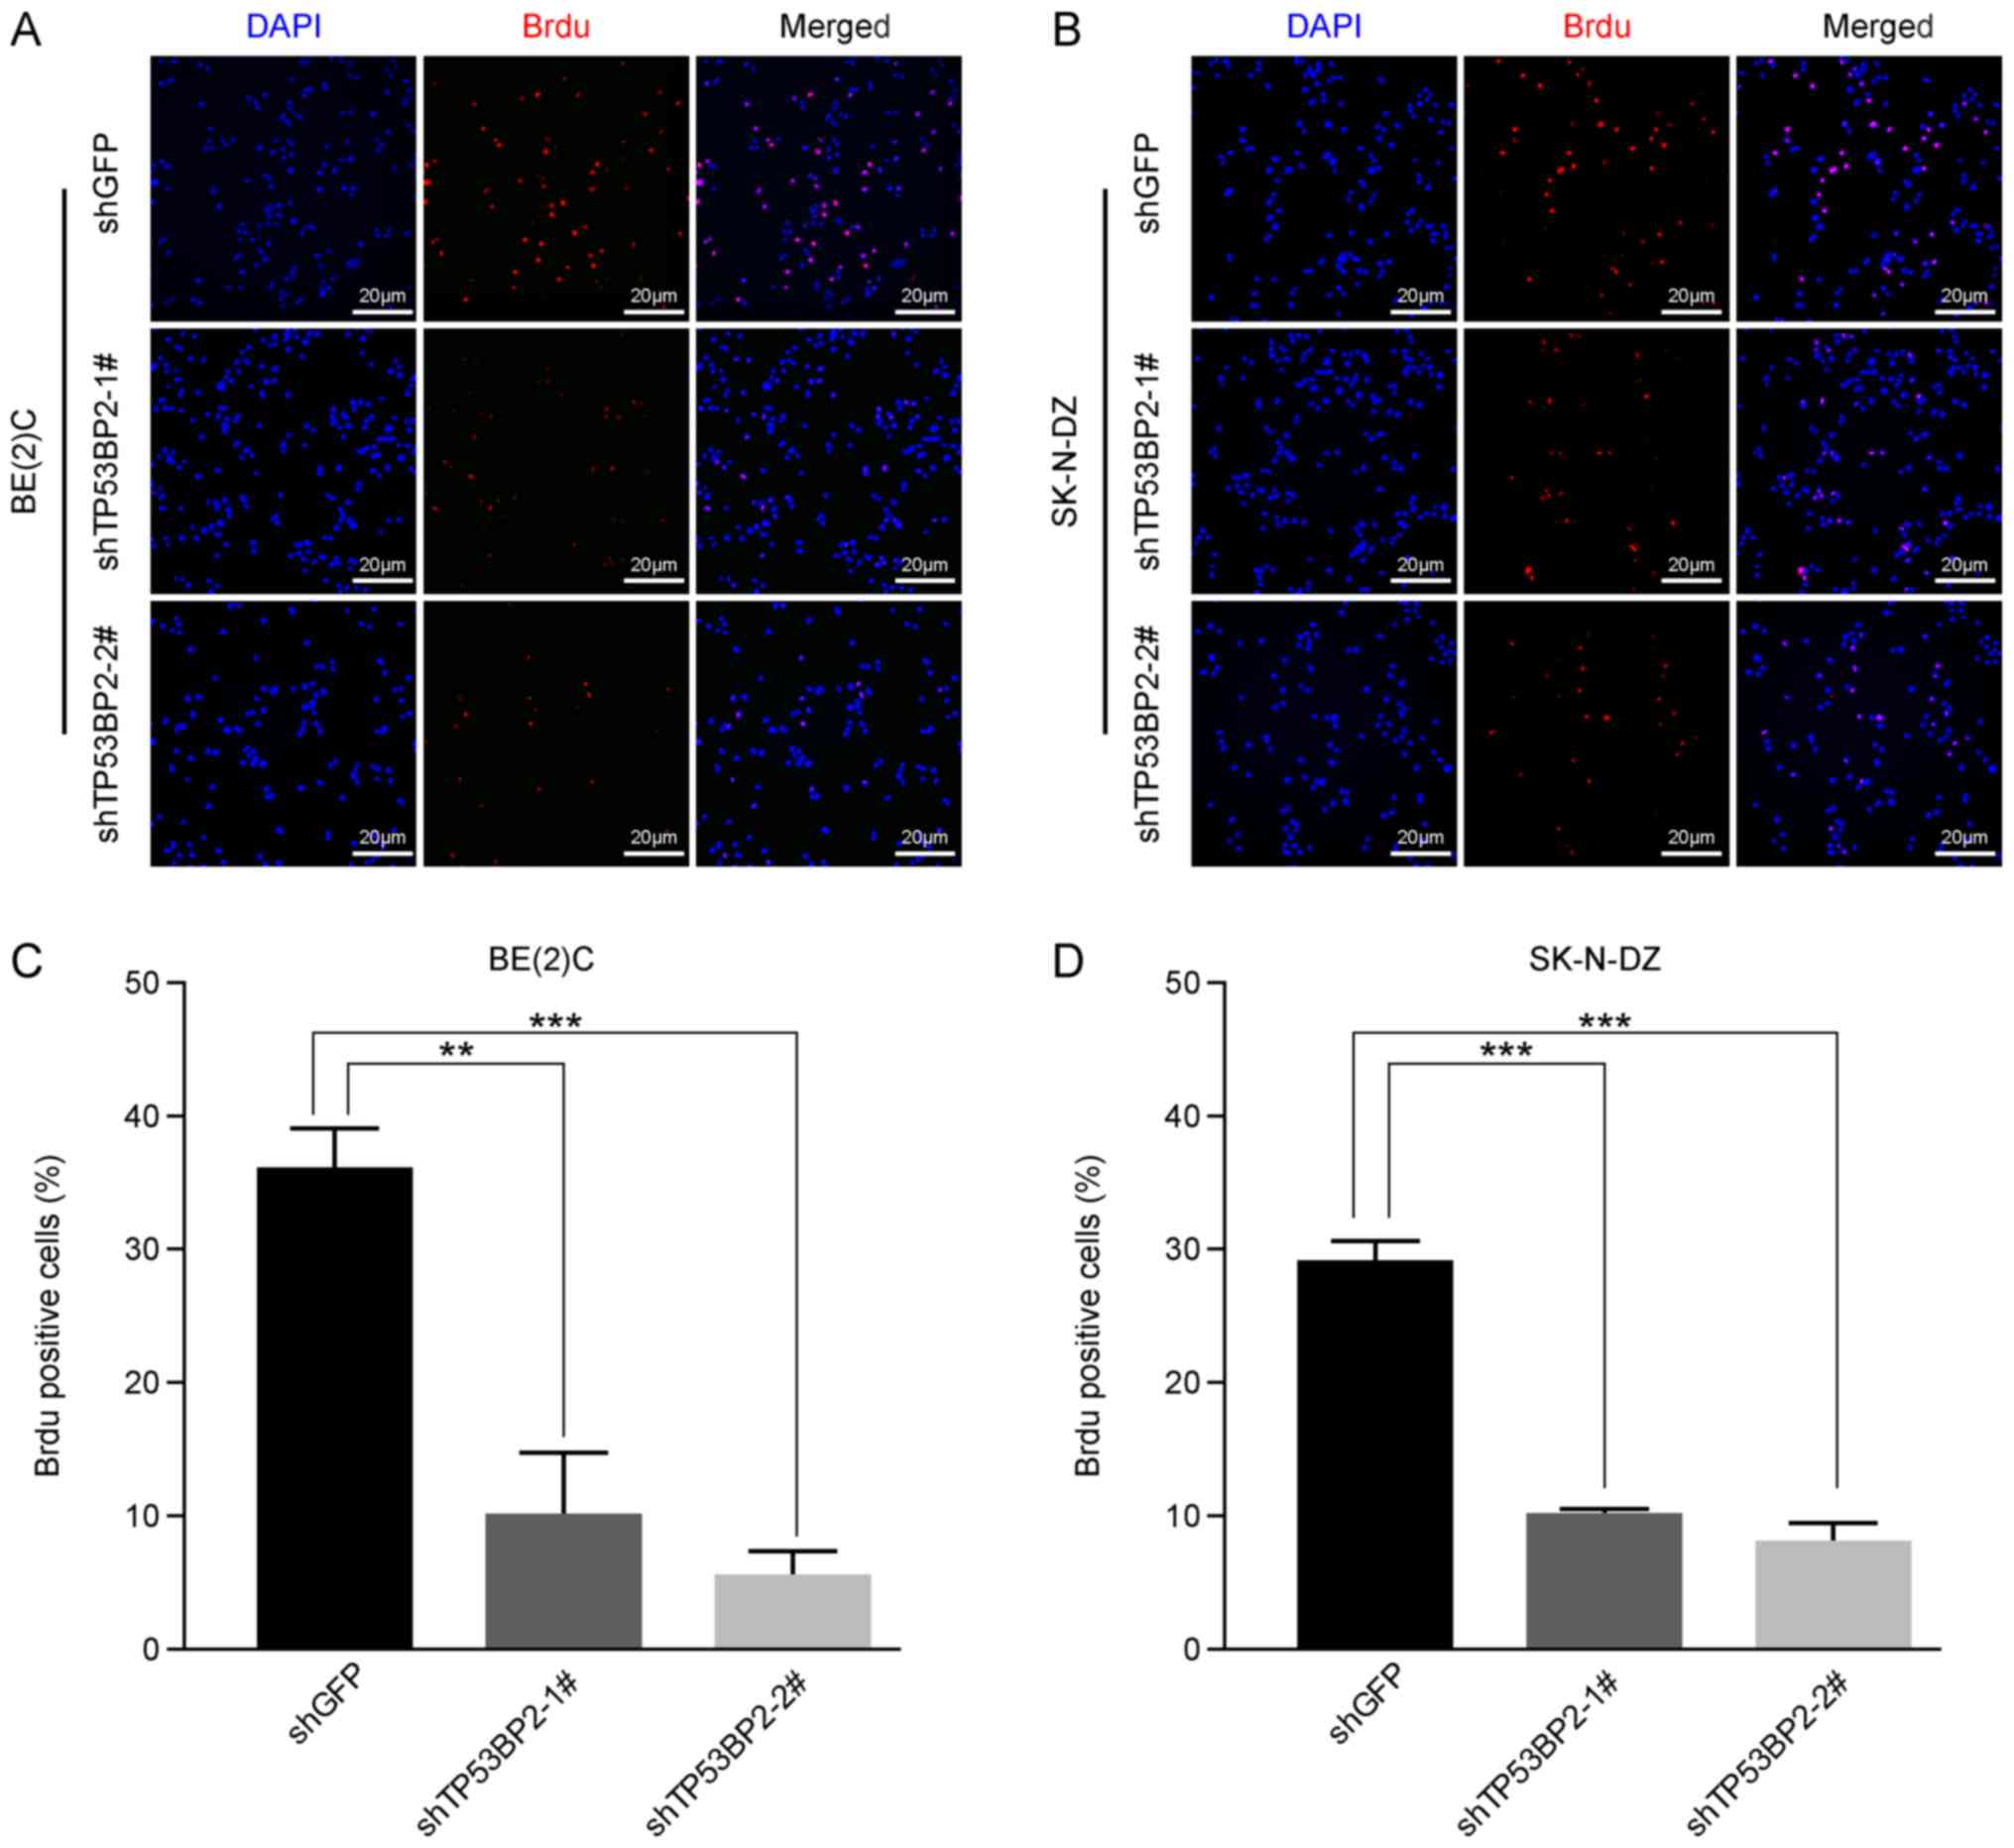
Subsequently, immunofluorescence staining using a BrdU label in
BE(2)C and SK-N-DZ cells confirmed
that cell proliferation was significantly inhibited in the
TP53BP2-knockdown cells compared with in the controls for the two
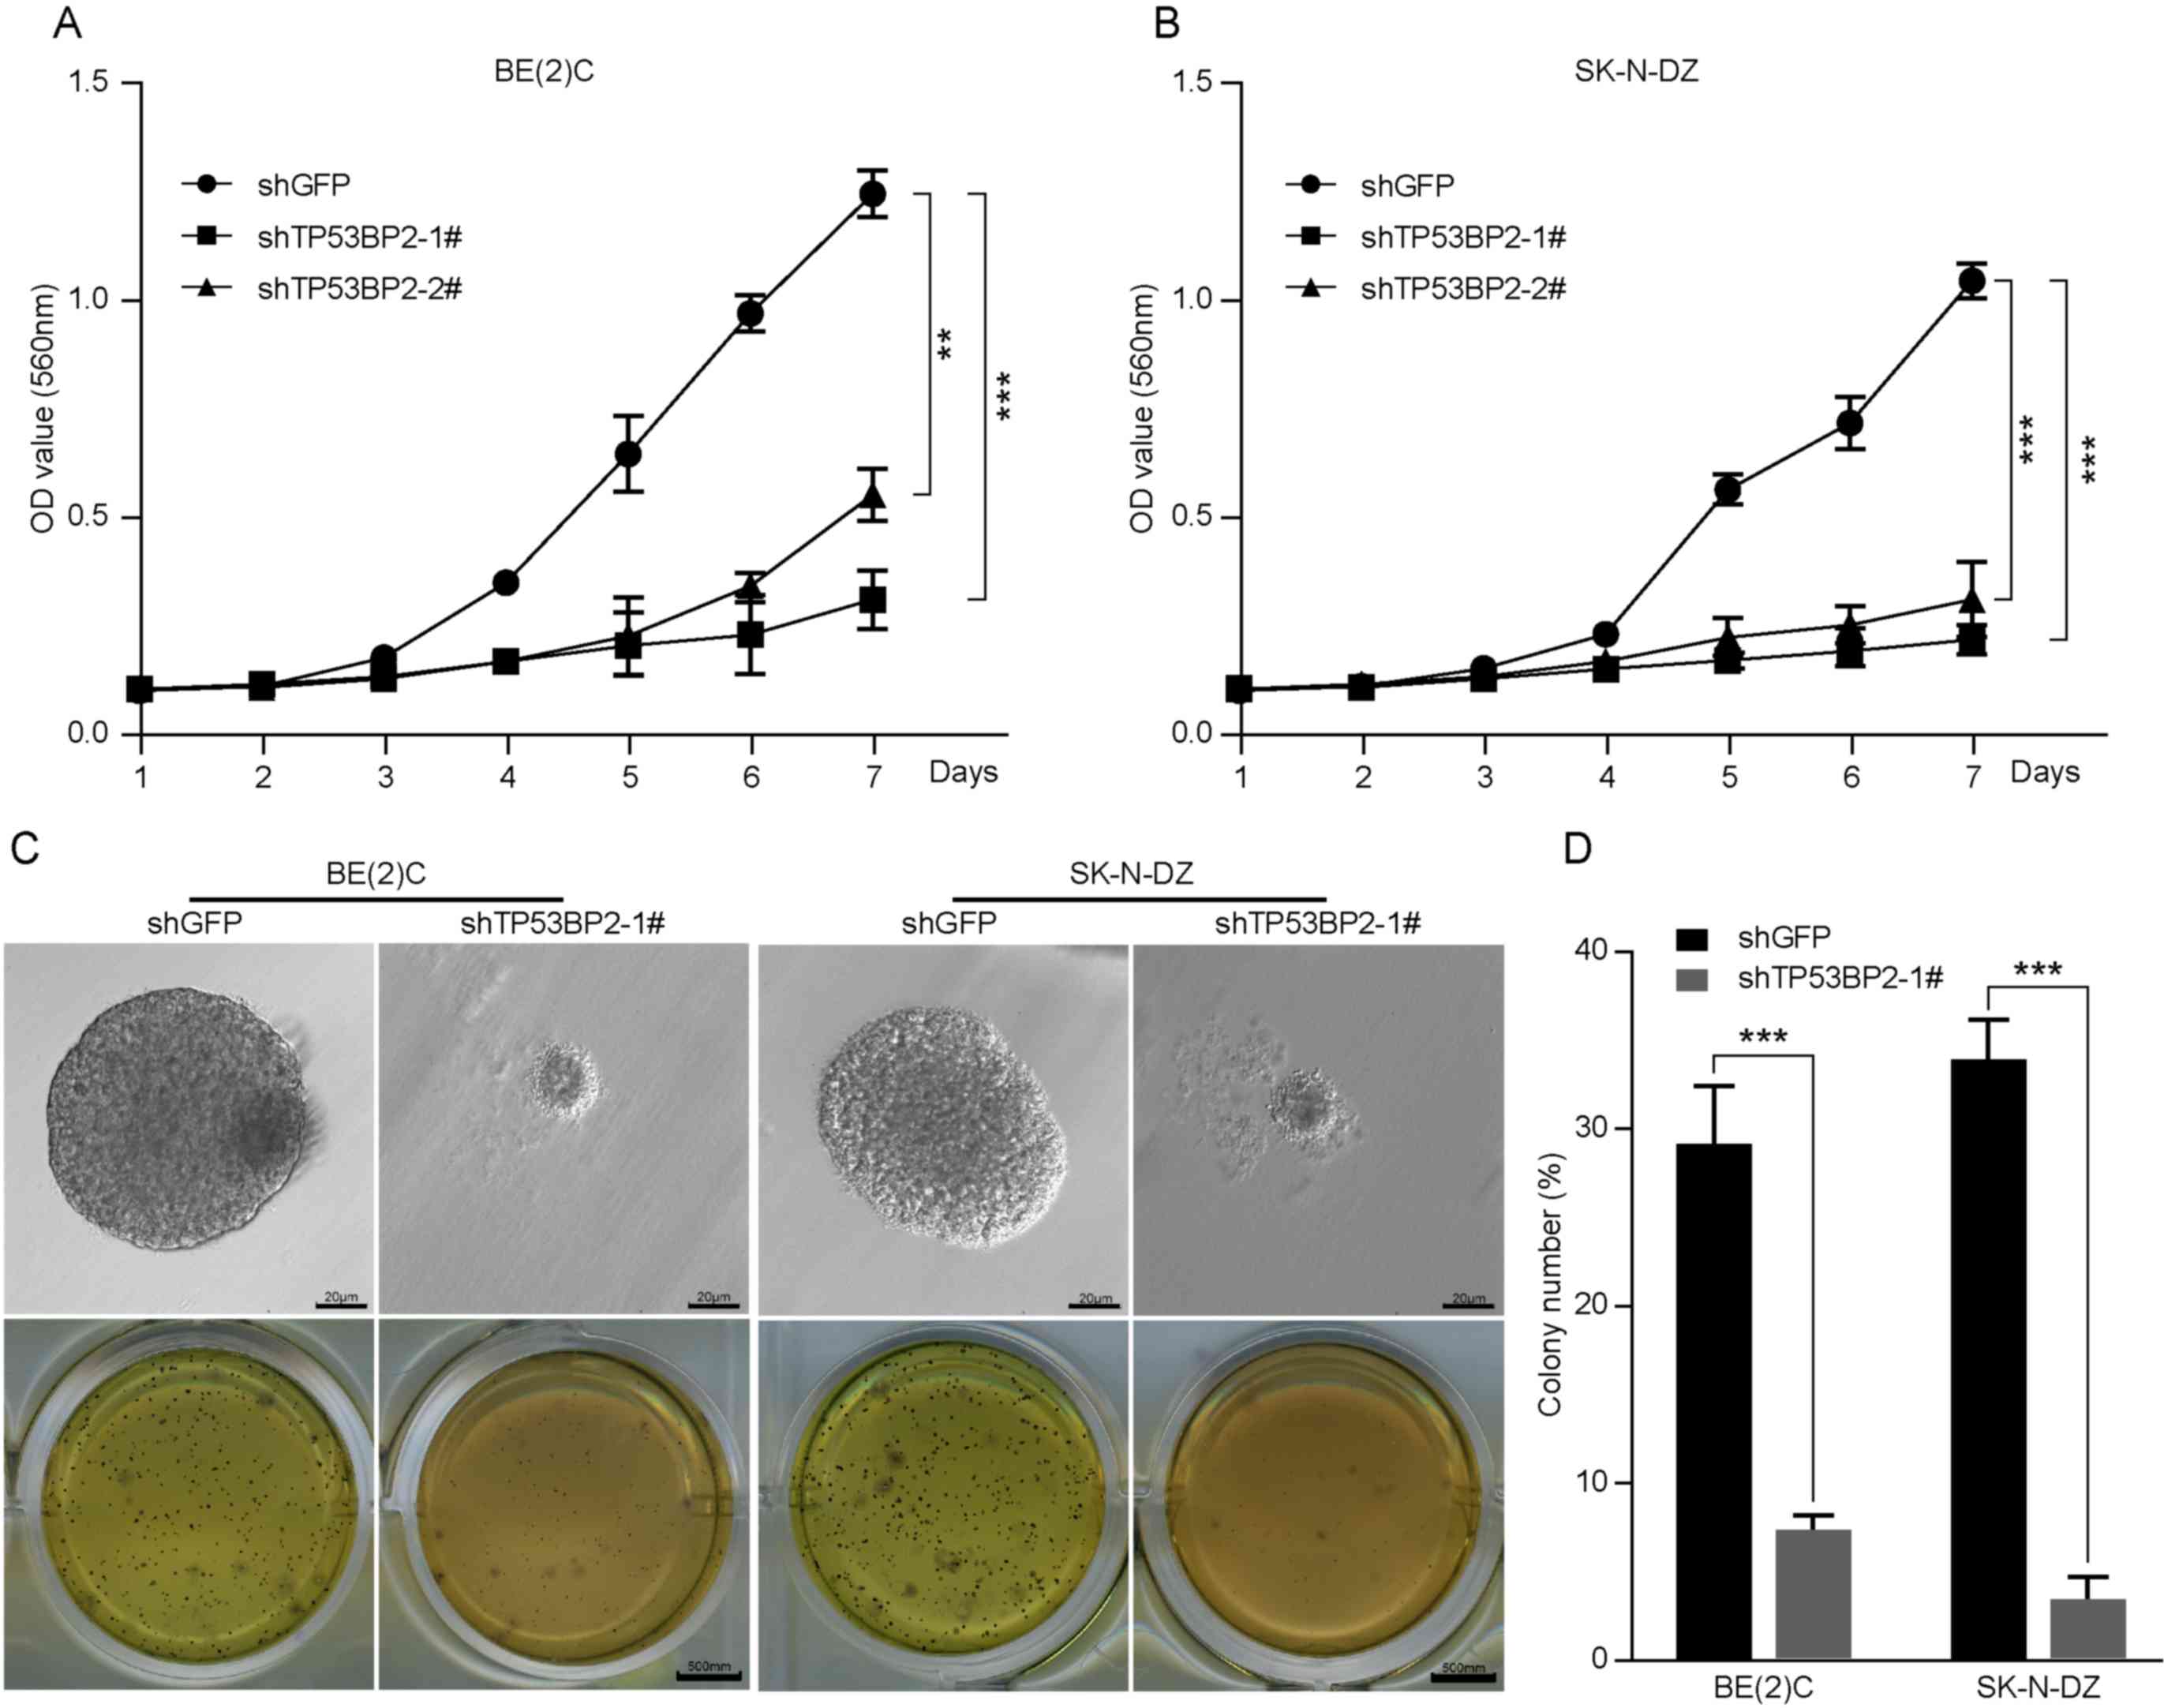
cell lines (Fig. 3). Furthermore,
MTT assays demonstrated that downregulation of TP53BP2
significantly decreased cell proliferation (Fig. 4A and B). These results indicate that
TP53BP2 is essential for the proliferation of neuroblastoma
cells.
Inhibition of TP53BP2 suppresses
neuroblastoma cell colony formation in vitro
In numerous studies, a soft agar assay has been used
as a human tumor stem-cell assay to investigate the ability of
individual cancer cells to proliferate and form colonies (32). As presented in Fig. 4C and D, the role of TP53BP2 in
neuroblastoma tumorigenesis was examined, which revealed that the
colonies were smaller and significantly fewer in number for the
TP53BP2-knockdown cells compared with for the controls (Fig. 4C and D). These results indicate that
TP53BP2 can suppress neuroblastoma cell colony formation in
vitro.
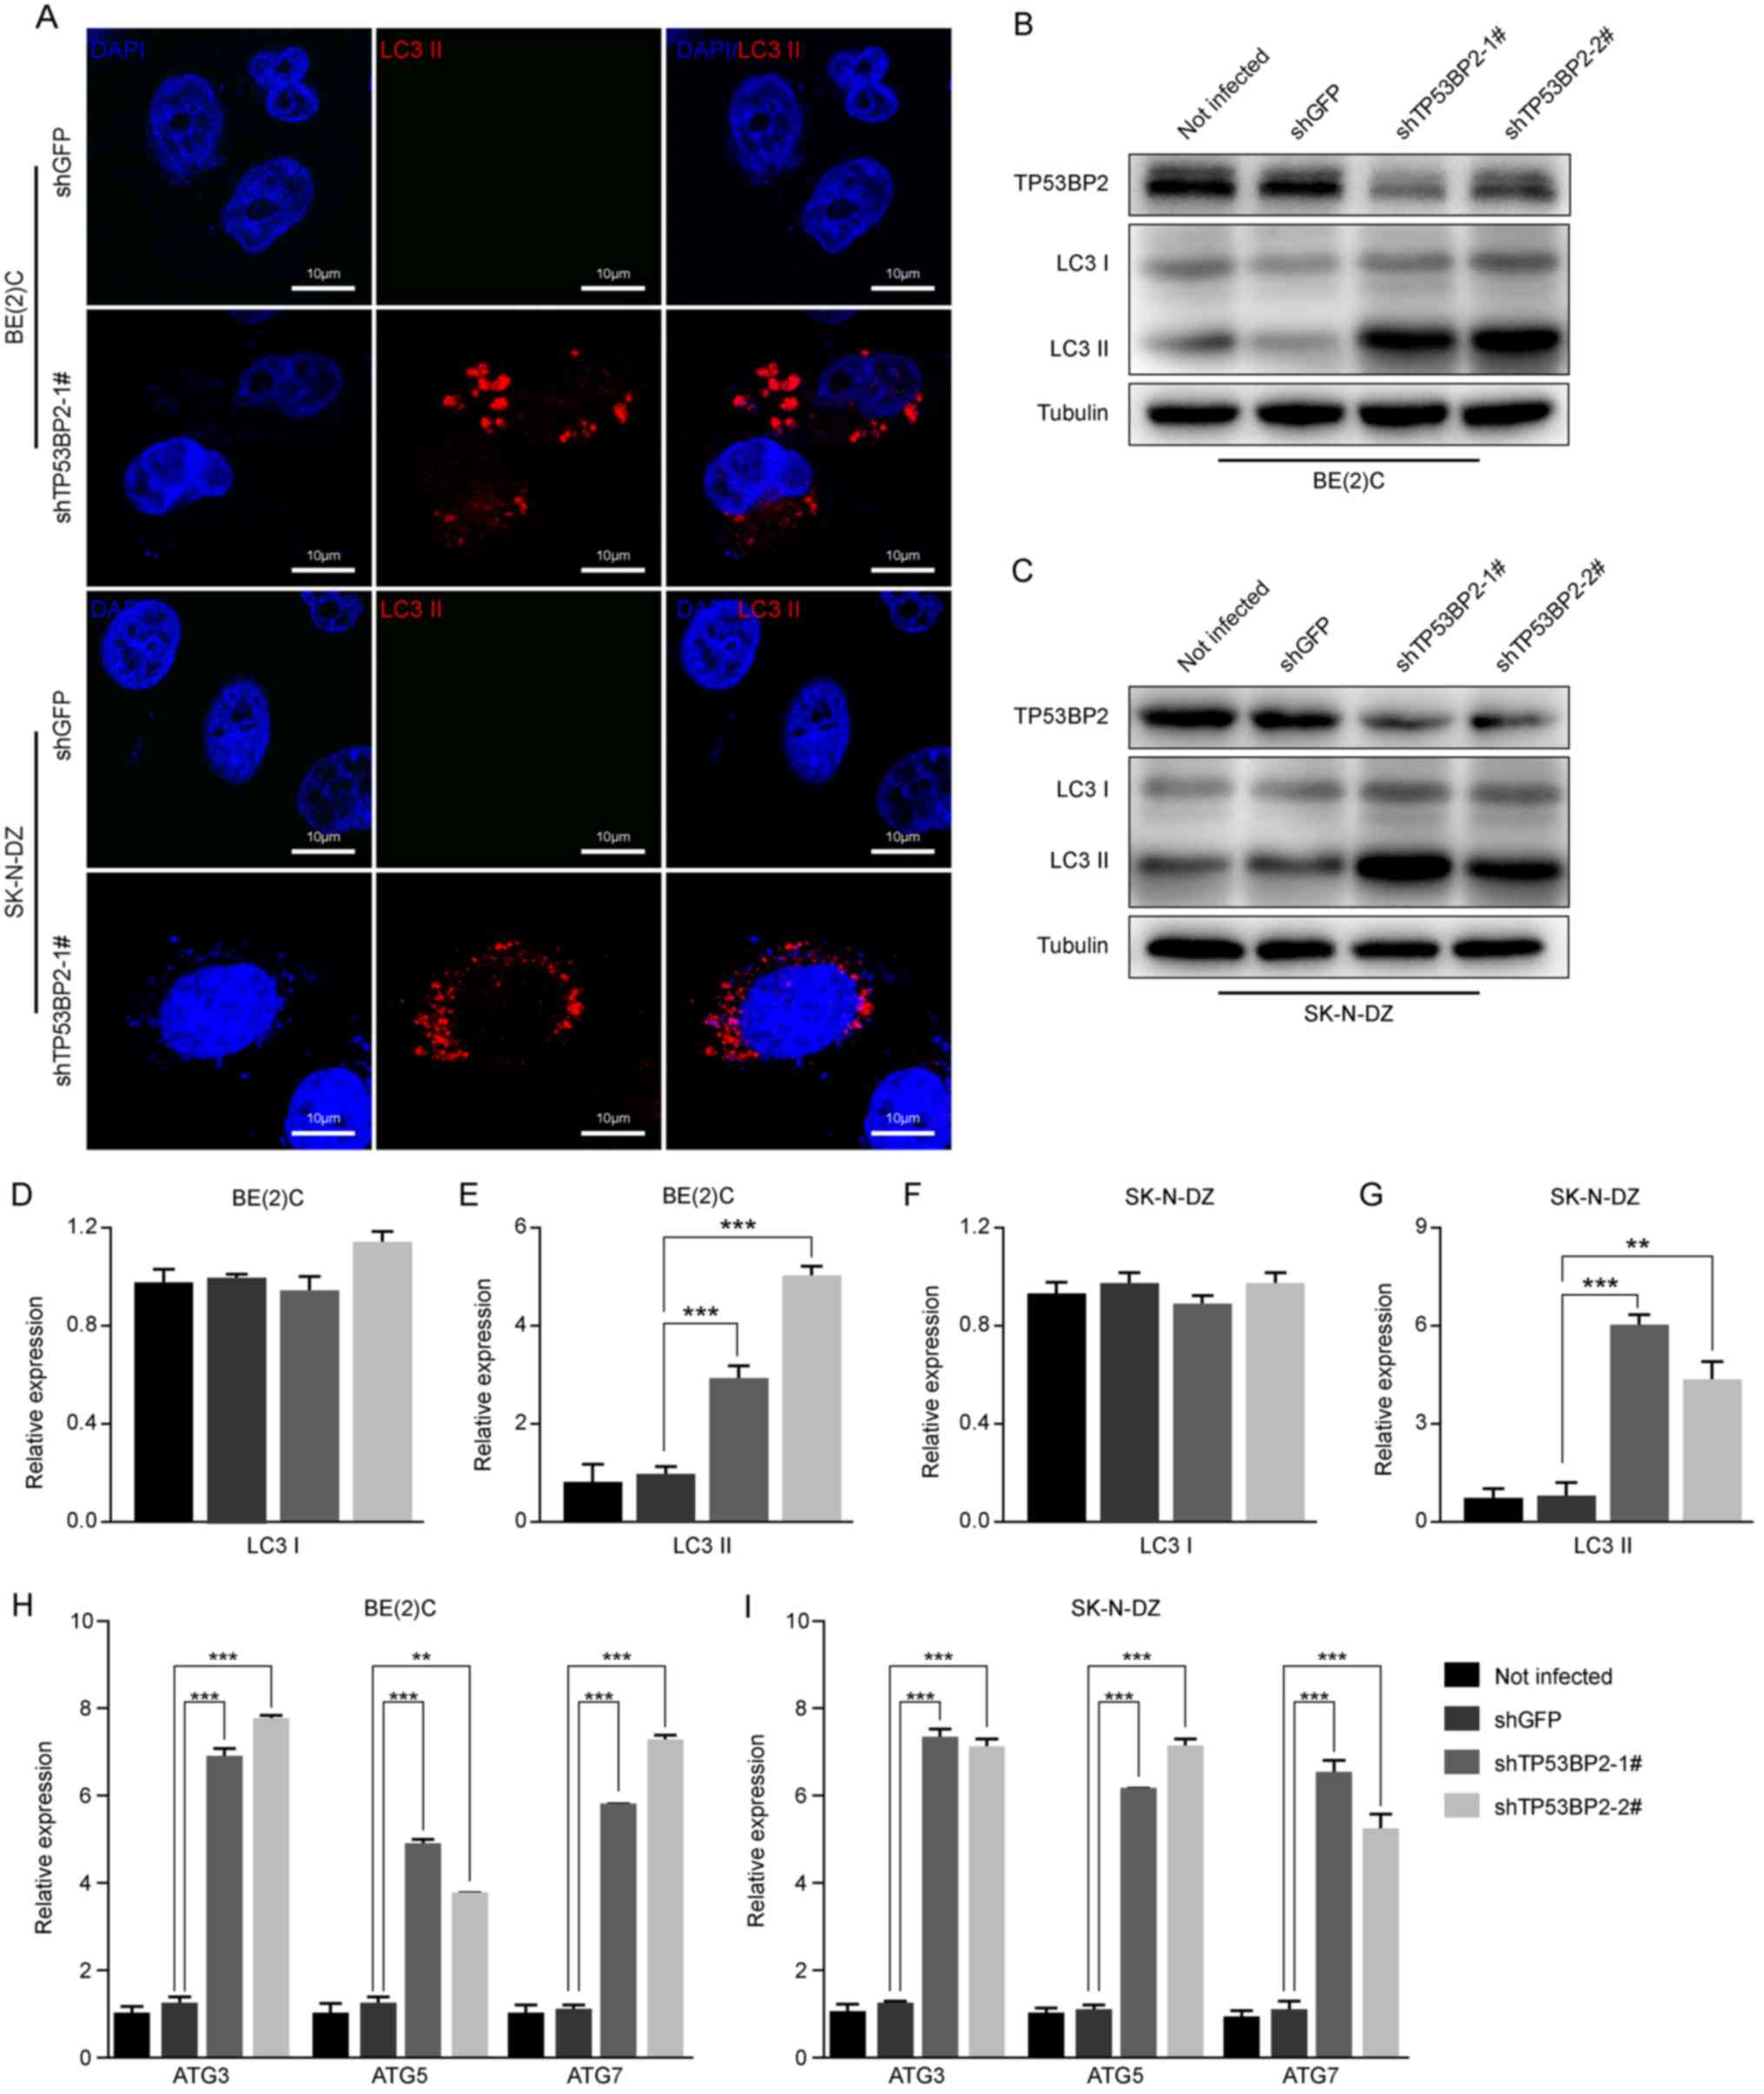
Inhibition of TP53BP2 induces
neuroblastoma cell autophagy
Immunofluorescence assays were performed to detect
the expression of LC3 II, which is a marker of autophagy (33). The results revealed that LC3 II
expression increased markedly in the TP53BP2-knockdown cells
compared with the controls (Fig.
5A). Furthermore, the expression levels of LC3B proteins in
TP53BP2-knockdown and shGFP neuroblastoma cells were detected using
western blot analysis. It was identified that the expression level
of LC3 II was significantly increased in the TP53BP2-knockdown
cells compared with in the controls (Fig. 5B-G). To confirm the occurrence of
autophagy, RT-qPCR analysis revealed that the expression levels of
ATG3, ATG5 and ATG7 were significantly upregulated in
TP53BP2-knockdown cells (Fig. 5H and
I). These results indicate that the inhibition of TP53BP2
upregulates the expression of LC3 II and ATG proteins. This
suggests that the downregulation of TP53BP2 promotes the
upregulation of LC3 II and induces autophagy.
Discussion
TP53BP2, also termed ASPP2, is a member of the ASPP
family and cooperates with p53 to repress tumor growth (34). Previous studies have reported that
TP53BP2 serves a critical role in the tumorigenesis of different
cancer types (12,13). TP53BP2 has been identified to be
associated with susceptibility to gastric cancer (16). Furthermore, it has been demonstrated
that TP53BP2 serves an important role in epithelial plasticity,
which suppresses tumor metastasis (35). Previously, it has been reported that
TP53BP2 is regulated by signal transducer and activator of
transcription 1 to form part of the signaling pathway that
suppresses tumors (36). In breast
cancer, proliferation is inhibited and apoptosis is induced
following knockdown of TP53BP2 (15). However, to the best of our knowledge,
the role of TP53BP2 in neuroblastoma remains unknown. Therefore,
the aim of the present study was to elucidate the role of TP53BP2
in neuroblastoma cells.
The results of the present study identified that the
expression level of TP53BP2 was associated with the prognosis of
patients with neuroblastoma. An increased expression level of
TP53BP2 was identified to be associated with a worse prognosis.
Furthermore, TP53BP2 was revealed to be expressed in all five
neuroblastoma cell lines investigated, which suggests that TP53BP2
may be involved in the development of neuroblastoma. Subsequently,
the effect of TP53BP2 knockdown on the proliferation of
neuroblastoma cells was investigated. The results indicated that
the proliferation of neuroblastoma cells was inhibited when TP53BP2
was downregulated. In addition, BrdU assays confirmed an inhibition
of proliferation following TP53BP2 knockdown. Furthermore, the
results of the present study indicated that a downregulation of
TP53BP2 suppresses the colony-formation capability of neuroblastoma
cells in vitro. Notably, it was identified that a
downregulation of TP53BP2 induces autophagy; indicated by an
increased level of LC3 II (37–39).
Subsequently, using western blot and RT-PCR analysis, the
expression levels of autophagy-associated proteins, including LC3
II and ATG, were identified to increase following knockdown of
TP53BP2.
In conclusion, the results of the present study
indicated that TP53BP2 can regulate the proliferation and autophagy
of neuroblastoma cells. However, the specific regulatory mechanisms
of TP53BP2 were not determined and require further investigation.
Another limitation of the present study was the absence of data
regarding solid tumors, as there may be differences between
neuroblastoma cell lines and tumors. In summary, TP53BP2 may
prevent autophagy and promote the proliferation of
neuroblastoma.
Acknowledgements
Not applicable.
Funding
The present study was supported by the Wei Planning
Commission Traditional Chinese Medicine Project of Chongqing (grant
no. zy201602100), the Science and Technology Research Projects of
Chongqing Education Commission (grant nos. KJ1725391, KJQN201802702
and KJQN201802704) and the Natural Science Research Projects of
Chongqing Three Gorges Medical College (grant no. 2016×mpxz04).
Availability of data and materials
All data generated or analyzed during this study are
included in this published article.
Authors' contributions
YP performed the majority of the experiments and
wrote the manuscript. LP participated in the cell experiments and
statistical analysis. YZ assisted with the immunoblot assays and
immunofluorescence staining. GL designed the study and helped to
revise the manuscript. All authors read and approved the manuscript
and agree to be accountable for all aspects of the research in
ensuring that the accuracy or integrity of any part of the work are
appropriately investigated and resolved.
Ethics approval and consent to
participate
Not applicable.
Patient consent for publication
Not applicable.
Competing interests
The authors declare that they have no competing
interests.
References
|
1
|
Li T, Cui ZB, Ke XX, Tan J, Li FF, Li T,
Wang XW and Cui HJ: Essential role for p53 and caspase-9 in DNA
damaging drug-induced apoptosis in neuroblastoma IMR32 cells. DNA
Cell Biol. 30:1045–1050. 2011. View Article : Google Scholar : PubMed/NCBI
|
|
2
|
Li T, Wang L, Ke XX, Gong XY, Wan JH, Hao
XW, Xu M, Xiang Z, Cui ZB and Cui H: DNA-damaging drug-induced
apoptosis sensitized by N-myc in neuroblastoma cells. Cell Biol
Int. 36:331–337. 2012. View Article : Google Scholar : PubMed/NCBI
|
|
3
|
Askin FB and Perlman EJ: Neuroblastoma and
peripheral neuroectodermal tumors. Am J Clin Pathol. 109 (4 Suppl
1):S23–S30. 1998.PubMed/NCBI
|
|
4
|
Shah S and Ravindranath Y: Neuroblastoma.
Indian J Pediatr. 65:691–705. 1998. View Article : Google Scholar : PubMed/NCBI
|
|
5
|
Bessho F: Incidence of neuroblastoma.
Lancet. 353:701999. View Article : Google Scholar : PubMed/NCBI
|
|
6
|
Sridhar S, Al-Moallem B, Kamal H, Terrile
M and Stallings RL: New insights into the genetics of
neuroblastoma. Mol Diagn Ther. 17:63–69. 2013. View Article : Google Scholar : PubMed/NCBI
|
|
7
|
Beckwith JB and Martin RF: Observations on
the histopathology of neuroblastomas. J Pediatr Surg. 3:106–110.
1968. View Article : Google Scholar : PubMed/NCBI
|
|
8
|
Zhu S, Yan X, Xiang Z, Ding HF and Cui H:
Leflunomide reduces proliferation and induces apoptosis in
neuroblastoma cells in vitro and in vivo. PLoS One. 8:e715552013.
View Article : Google Scholar : PubMed/NCBI
|
|
9
|
Cheung NK and Dyer MA: Neuroblastoma:
Developmental biology, cancer genomics and immunotherapy. Nat Rev
Cancer. 13:397–411. 2013. View
Article : Google Scholar : PubMed/NCBI
|
|
10
|
Morgenstern DA, Baruchel S and Irwin MS:
Current and future strategies for relapsed neuroblastoma:
Challenges on the road to precision therapy. J Pediatr Hematol
Oncol. 35:337–347. 2013. View Article : Google Scholar : PubMed/NCBI
|
|
11
|
Liu K, Shi Y, Guo X, Wang S, Ouyang Y, Hao
M, Liu D, Qiao L, Li N, Zheng J and Chen D: CHOP mediates
ASPP2-induced autophagic apoptosis in hepatoma cells by releasing
Beclin-1 from Bcl-2 and inducing nuclear translocation of Bcl-2.
Cell Death Dis. 5:e13232014. View Article : Google Scholar : PubMed/NCBI
|
|
12
|
Ma L, Chen ZM, Li XY, Wang XJ, Shou JX and
Fu XD: Nucleostemin and ASPP2 expression is correlated with
pituitary adenoma proliferation. Oncol Lett. 6:1313–1318. 2013.
View Article : Google Scholar : PubMed/NCBI
|
|
13
|
Vives V, Slee EA and Lu X: ASPP2: A gene
that controls life and death in vivo. Cell Cycle. 5:2187–2190.
2006. View Article : Google Scholar : PubMed/NCBI
|
|
14
|
Tordella L, Koch S, Salter V, Pagotto A,
Doondeea JB, Feller SM, Ratnayaka I, Zhong S, Goldin RD, Lozano G,
et al: ASPP2 suppresses squamous cell carcinoma via
RelA/p65-mediated repression of p63. Proc Natl Acad Sci USA.
110:17969–17974. 2013. View Article : Google Scholar : PubMed/NCBI
|
|
15
|
Song Q, Song J, Wang Q, Ma Y, Sun N, Ma J,
Chen Q, Xia G, Huo Y, Yang L and Li B: MiR-548d-3p/TP53BP2 axis
regulates the proliferation and apoptosis of breast cancer cells.
Cancer Med. 5:315–324. 2016. View
Article : Google Scholar : PubMed/NCBI
|
|
16
|
Ju H, Lee KA, Yang M, Kim HJ, Kang CP,
Sohn TS, Rhee JC, Kang C and Kim JW: TP53BP2 locus is associated
with gastric cancer susceptibility. Int J Cancer. 117:957–960.
2005. View Article : Google Scholar : PubMed/NCBI
|
|
17
|
Berardi DE, Campodónico PB, Díaz Bessone
MI, Urtreger AJ and Todaro LB: Autophagy: Friend or foe in breast
cancer development, progression, and treatment. Int J Breast
Cancer. 2011:5950922011. View Article : Google Scholar : PubMed/NCBI
|
|
18
|
Fimia GM, Kroemer G and Piacentini M:
Molecular mechanisms of selective autophagy. Cell Death Differ.
20:1–2. 2013. View Article : Google Scholar : PubMed/NCBI
|
|
19
|
Klionsky DJ: Autophagy: From phenomenology
to molecular understanding in less than a decade. Nat Rev Mol Cell
Biol. 8:931–937. 2007. View
Article : Google Scholar : PubMed/NCBI
|
|
20
|
Mehrpour M, Esclatine A, Beau I and
Codogno P: Overview of macroautophagy regulation in mammalian
cells. Cell Res. 20:748–762. 2010. View Article : Google Scholar : PubMed/NCBI
|
|
21
|
Rubinsztein DC, Codogno P and Levine B:
Autophagy modulation as a potential therapeutic target for diverse
diseases. Nat Rev Drug Discov. 11:709–730. 2012. View Article : Google Scholar : PubMed/NCBI
|
|
22
|
Mizushima N and Komatsu M: Autophagy:
Renovation of cells and tissues. Cell. 147:728–741. 2011.
View Article : Google Scholar : PubMed/NCBI
|
|
23
|
Wirawan E, Vanden Berghe T, Lippens S,
Agostinis P and Vandenabeele P: Autophagy: For better or for worse.
Cell Res. 22:43–61. 2012. View Article : Google Scholar : PubMed/NCBI
|
|
24
|
Levine B, Mizushima N and Virgin HW:
Autophagy in immunity and inflammation. Nature. 469:323–335. 2011.
View Article : Google Scholar : PubMed/NCBI
|
|
25
|
Towers CG and Thorburn A: Therapeutic
targeting of autophagy. EBioMedicine. 14:15–23. 2016. View Article : Google Scholar : PubMed/NCBI
|
|
26
|
Han X, Liu JX and Li XZ: Salvianolic acid
B inhibits autophagy and protects starving cardiac myocytes. Acta
Pharmacol Sin. 32:38–44. 2011. View Article : Google Scholar : PubMed/NCBI
|
|
27
|
Livak KJ and Schmittgen TD: Analysis of
relative gene expression data using real-time quantitative PCR and
the 2(−Delta Delta C(T)) method. Methods. 25:402–408. 2001.
View Article : Google Scholar : PubMed/NCBI
|
|
28
|
Molenaar JJ, Koster J, Zwijnenburg DA, van
Sluis P, Valentijn LJ, van der Ploeg I, Hamdi M, van Nes J,
Westerman BA, van Arkel J, et al: Sequencing of neuroblastoma
identifies chromothripsis and defects in neuritogenesis genes.
Nature. 483:589–593. 2012. View Article : Google Scholar : PubMed/NCBI
|
|
29
|
Yang R, Wu Y, Zou J, Zhou J, Wang M, Hao X
and Cui H: The Hippo transducer TAZ promotes cell proliferation and
tumor formation of glioblastoma cells through EGFR pathway.
Oncotarget. 7:36255–36265. 2016.PubMed/NCBI
|
|
30
|
Zhang D, Wang F, Pang Y, Ke XX, Zhu S,
Zhao E, Zhang K, Chen L and Cui H: Down-regulation of CHERP
inhibits neuroblastoma cell proliferation and induces apoptosis
through ER stress induction. Oncotarget. 8:80956–80970.
2017.PubMed/NCBI
|
|
31
|
Yang L, Huang M, Tan J, Hou J, He J, Wang
F, Cui H and Yi L: Transcriptional co-activator with PDZ-binding
motif overexpression promotes cell proliferation and
transcriptional co-activator with PDZ-binding motif deficiency
induces cell cycle arrest in neuroblastoma. Oncol Lett.
13:4295–4301. 2017. View Article : Google Scholar : PubMed/NCBI
|
|
32
|
Agrez MV, Kovach JS and Lieber MM: Cell
aggregates in the soft agar ‘human tumour stem-cell assay’. Br J
Cancer. 46:880–887. 1982. View Article : Google Scholar : PubMed/NCBI
|
|
33
|
Ke XX, Zhang D, Zhu S, Xia Q, Xiang Z and
Cui H: Inhibition of H3K9 methyltransferase G9a repressed cell
proliferation and induced autophagy in neuroblastoma cells. PLoS
One. 9:e1069622014. View Article : Google Scholar : PubMed/NCBI
|
|
34
|
Vives V, Su J, Zhong S, Ratnayaka I, Slee
E, Goldin R and Lu X: ASPP2 is a haploinsufficient tumor suppressor
that cooperates with p53 to suppress tumor growth. Genes Dev.
20:1262–1267. 2006. View Article : Google Scholar : PubMed/NCBI
|
|
35
|
Wang Y, Bu F, Royer C, Serres S, Larkin
JR, Soto MS, Sibson NR, Salter V, Fritzsche F, Turnquist C, et al:
ASPP2 controls epithelial plasticity and inhibits metastasis
through β-catenin-dependent regulation of ZEB1. Nat Cell Biol.
16:1092–1104. 2014. View
Article : Google Scholar : PubMed/NCBI
|
|
36
|
Turnquist C, Wang Y, Severson DT, Zhong S,
Sun B, Ma J, Constaninescu SN, Ansorge O, Stolp HB, Molnár Z, et
al: STAT1-induced ASPP2 transcription identifies a link between
neuroinflammation, cell polarity, and tumor suppression. Proc Natl
Acad Sci USA. 111:9834–9839. 2014. View Article : Google Scholar : PubMed/NCBI
|
|
37
|
Mai S, Muster B, Bereiter-Hahn J and
Jendrach M: Autophagy proteins LC3B, ATG5 and ATG12 participate in
quality control after mitochondrial damage and influence lifespan.
Autophagy. 8:47–62. 2012. View Article : Google Scholar : PubMed/NCBI
|
|
38
|
Hale AN, Ledbetter DJ, Gawriluk TR and
Rucker EB III: Autophagy: Regulation and role in development.
Autophagy. 9:951–972. 2013. View Article : Google Scholar : PubMed/NCBI
|
|
39
|
Zhao H, Yang M, Zhao J, Wang J, Zhang Y
and Zhang Q: High expression of LC3B is associated with progression
and poor outcome in triple-negative breast cancer. Med Oncol.
30:4752013. View Article : Google Scholar : PubMed/NCBI
|