Introduction
Tribbles-related protein 3 (TRB3, also known as
NIPK, SKIP3) is a mammalian homologue of the Drosophila
Tribbles gene, and this gene has been identified as an
inhibitor of mitosis that regulates cell proliferation, migration
and morphogenesis during development (1–3). Among
tribbles homologues TRB1, TRB2 and TRB3, TRB3 is the most recently
defined family of pseudokinases that contain a serine/threonine
kinase catalytic domain but lack an ATP binding site or one of the
conserved catalytic motifs essential for kinase activity (4). The interacting partners of TRB3 range
from transcription factors, ubiquitin ligase, bone morphogenetic
protein (BMP) type II receptor to members of the mitogen-activated
protein kinase (MAPK) and phosphoinositide 3-kinase (PI3K)
signaling pathways. By interacting with these proteins, it
coordinates crucial cellular processes, including glucose/lipid
metabolism, apoptosis, adipocyte differentiation, cell stress and
regulation of collagen expression (5–9). We
previously demonstrated that TRB3 is induced by C/EBP homologous
protein (CHOP) and activating transcription factor 4 (ATF4) to
regulate their function and endoplasmic reticulum (ER)
stress-induced cell death (10) and
that TRB3 also regulates the stability of cell division cycle 25A
(Cdc25A), an essential activator of cyclin- dependent kinases
(CDKs) (11).
Recent studies indicate that the three mammalian
tribbles homologues are crucial modulators of tumorigenesis. For
instance, both TRB1 and TRB2 are involved in myeloid leukemogenesis
(12,13). TRB3 is highly expressed in a wide
range of human carcinoma cell lines and in several types of human
carcinomas (4,14). However, a precise role of TRB3 in
tumorigenesis remains unknown. The aim of the present study was to
examine whether the introduction of the human TRB3 gene into
mouse mammary tumor cells affects in vitro/in vivo
growth and chromosomal stability during cell division of tumor
cells.
Materials and methods
Cell culture
The human embryonic kidney cell line 293 purchased
from the American Type Culture Collection (ATCC, Manassas, VA, USA)
and the human hepatocellular carcinoma cell line HepG2 were
cultured in Dulbecco’s modified Eagle’s medium (DMEM; Wako Pure
Chemical Industries, Ltd., Osaka, Japan) supplemented with 10%
fetal bovine serum (FBS; Life Technologies, Inc., Rockville, MD,
USA) in a humidified incubator with 5% CO2 at 37°C. The
murine mammary tumor cell line Cl66M2 (M2) was generously provided
by Dr Rakesh K. Singh (University of Nebraska Medical Center,
Omaha, NE, USA) (18) and cultured
in DMEM supplemented with 5% FBS in a humidified incubator with 5%
CO2 at 37°C.
Construction of the expression
vector
The TRB3 flag-tagged expression vector was
constructed by ligating the full length human TRB3 cDNA into
BamHI and XhoI restriction sites of pcDNA3.1-Hygro
(Life Technologies, Inc.) (9). The
construct was verified by sequencing.
Preparation of a cell line that stably
expresses the TRB3 gene
The expression vector pcDNA3.1-Hygro-flag-human TRB3
was transfected into Cl66M2 cells using Lipofectamine 2000 reagent
(Life Technologies, Inc.). This cell line was termed M2TRB3. After
transfection, the clone of the cells stably expressing M2TRB3 was
selected by a limiting-dilution method in culture media
supplemented with hygromycin. The cells transfected with the empty
vector were also prepared as the control (M2mock). In M2TRB3 and
M2mock cells, the levels of mRNA and protein expression were
confirmed by reverse transcription-polymerase chain reaction
(RT-PCR) and western blot assays.
In vitro cell proliferation assay
These assays were performed as described previously
by us (15). Two murine mammary
tumor cell lines M2TRB3 and M2mock were plated into 6-well 35-mm
diameter culture plates (1.0×10⁴ cells/well) in DMEM
containing 10% FBS. Cells were starved in DMEM containing 0.5% FBS
for 48 h. After starvation, the culture media were removed and
cells were grown in DMEM containing 10% FBS for the indicated time
course (0–72 h). The cells were washed twice with
phosphate-buffered saline (PBS), harvested, resuspended in 1 ml PBS
and the number of cells was determined using a hemocytometer
Burker-Turk (Erma Inc., Tokyo, Japan). Each assay was repeated more
than three times to confirm the results. The number of cells was
plotted on a time-response curve as indicated in the figures.
Tumor xenograft assay
Male four-week-old BALB/cSlc-nu/nu mice obtained
from Japan SLC, Inc. (Shizuoka Japan) were used. M2, M2TRB3 and
M2mock cells (1.0×10⁶/200 μl) were subcutaneously
inoculated into the right lower flank of the mice. Tumor diameters
(mm) and body weight (g) were recorded twice weekly. The tumor
volume (mm3) was calculated by the formula: Volume = L ×
D × H × π/6, where L is the length, D is the depth, and H is the
height. At 35 days after inoculation, all mice were euthanized and
complete autopsies were performed. Animal experiments were
conducted in accordance to the regulations specified by the
Institutional Animal Use and Care Committee of Nagoya City
University.
Immunohistochemistry and measurement of
proliferating cell nuclear antigen (PCNA) labeling index
These assays were performed using an established
method as described previously by us (16). Paraffin sections (3-μm) were
prepared to include tumors resected from the lower flank of each
mouse. These sections were treated in 3% H2O2
for 10 min to block the endogenous peroxidase activity. For antigen
retrieval, the sections were brought to boiling in 0.1 M citrate
buffer, pH 6.0. Sections were incubated with a primary antibody of
PCNA (1:500 dilution) (sc-56; Santa Cruz Biotechnology, Inc., Santa
Cruz, CA, USA) at room temperature for 60 min. After incubation
with the secondary antibody, sections were then stained using an
ABC kit (Vector Laboratories, Inc., Burlingame, CA, USA) according
to the manufacturer’s instructions. The PCNA labeling index was
determined by calculating the ratio of PCNA-positive nuclei/total
number of nuclei counted. Ten high power fields (x400) per tumor
were examined, and >300 cells were counted in each tumor. In
M2TRB3 and M2mock tumors, the longest diameter of the nucleus was
determined by image analysis using Olympus DP70 system (Olympus
Corp., Tokyo, Japan). Four high power fields (x400) per tumor were
examined and more than 100 nuclei were counted in each tumor.
Flow cytometric analysis
These assays were performed as previously described
(16). M2TRB3 and M2mock cells
(7.5×10⁴ cells/plate) were plated onto 9-cm culture
dishes in DMEM plus 10% FBS and grown to yield 50–60% confluence.
To synchronize cells at the G0/G1 phase, they were starved by
culturing in DMEM plus 0.5% FBS for 48 h. After starvation, cells
were then growth in DMEM plus 10% FBS for 72 h. Adherent cells were
washed twice with PBS, fixed with 5 ml 70% ethanol, centrifuged,
resuspended in 400 μl PBS containing 2 mg/ml RNase (Nacalai Tesque,
Inc., Kyoto, Japan), and stained with 400 μl of 0.1 mg/ml propidium
iodide (Sigma-Aldrich, St. Louis, MO, USA) in the dark for 30 min
or overnight. The cell suspension was filtered through a 60-μm
nylon filter (Ikemoto Scientific Technology Co., Ltd., Tokyo).
Samples of 10,000–20,000 cells were then analyzed for cell cycle
phase distribution and ploidy status using a FACSCalibur™
instrument, and the data were analyzed with the CellQuest computer
program (both from Becton-Dickinson, Franklin lakes, NJ, USA) as
described in a previous study (16). Cells were harvested just after
starvation (0 h) and 72 h after starvation as described in Table I and Fig. 5. Each assay was repeated more than
three times to confirm the results.
 | Table IDistribution and rate (%) of ploidy in
the M2TRB3 and M2mock cell lines. |
Table I
Distribution and rate (%) of ploidy in
the M2TRB3 and M2mock cell lines.
| | Time (h) after
starvation |
|---|
| |
|
|---|
| Cell line | Ploidy | 0 h | 72 h |
|---|
| M2mock | 2N |
12.1±0.3a |
16.6±0.1b |
| M2TRB3 | 2N | 0.0±0.0 | 0.0±0.0 |
| M2mock | 4N | 37.0±0.1 |
38.5±0.2b |
| M2TRB3 | 4N | 41.6±2.5 | 57.5±0.5 |
| M2mock | 8N |
6.0±0.1a |
3.5±0.0b |
| M2TRB3 | 8N | 25.3±1.8 | 16.2±0.3 |
RT-PCR assays
These assays were conducted using previously
established procedures (16). Total
RNA was extracted from each cell line grown in 9-cm culture dishes
using Isogen (Nippon Gene, Toyama, Japan). The reaction mixture
contained 4 μg of total RNA, 1 μl of 10 mM dNTP, 1 μl of random
primers (both from Life Technologies, Inc.) and 7 μl of distilled
water. The reaction mixture was incubated at 65°C (5 min) for
denaturation, chilled on ice for 1 min and 4 μl of 5X RT buffer
(Life Technologies, Inc.), 1 μl of 0.1 M dithiothreitol (DTT), 1 μl
of the RNaseOut and 1 μl of Superscript® III Reverse
Transcriptase (both from Life Technologies, Inc.) were added. After
the addition of these reagents, the reaction mixture was incubated
at 50°C (60 min) for random primer annealing and 70°C (15 min) for
cDNA preparation. One microliter of the reaction mixture was then
used for PCR. The primer sequences used in this study were as
follows: human TRB3-specific primer set, hTRB3F
(5′-CAAGTCGCTCTGAAGGTTCC-3′) and hTRB3R
(5′-CCATCCTACTCTGGCAAAGC-3′), mouse TRB3-specific primer set,
mTRB3F (5′-CAAGTCGCTCT GAAGGTTCC-3′) and mTRB3R (5′-CCATCCTACTC
TGGCAAAGC-3′), respectively.
β-actin-specific DNA fragments from the same RNA
samples were amplified and served as internal controls. Primers
actinF (5′-CCGTAAAGACCTCTATGCCAACA-3′) and actinR
(5′-CGGACTCATCGTACTCCTGCTT-3′) were used for amplification of
β-actin. PCR was conducted for 26–30 cycles in an iCycler (Bio-Rad
Laboratories, Inc., Hercules, CA, USA). Each amplification cycle
consisted of 0.5 min at 94°C for denaturation, 0.5 min at 60°C for
primer annealing, and 1 min at 72°C for extension. After PCR
amplification, the DNA fragments were stained with ethidium bromide
and analyzed by 2% agarose gel electrophoresis. The results were
confirmed by repeating the experiments.
Western blot assays
These assays were conducted according to previously
established procedures (17). The
cells were lysed in radioimmunoprecipitation assay (RIPA) buffer
[50 mM Tris-HCl (pH 8.0), 150 mM NaCl, 0.1% sodium dodecyl sulfate
(SDS), 0.5% deoxycholate, and 1% Triton X-100]. The lysates were
subjected to SDS-polyacrylamide gel electrophoresis (PAGE) (12.5%),
transferred onto a polyvinylidene difluoride (PVDF) membrane
(Immobilon P; Millipore Corp., Bedford, MA, USA) and probed with
the antibodies. The primary antibodies used in the present study
were anti-β-actin monoclonal antibody (AC-15) (Sigma-Aldrich),
anti-cyclin B1 monoclonal antibody (sc-245) (Santa Cruz
Biotechnology Inc.), anti-Cdc2 monoclonal antibody (sc-54),
anti-Cdk2 polyclonal antibody (sc-163), anti-Cdk4 polyclonal
antibody (sc-260), anti-TRB3 polyclonal antibody (sc-34211),
anti-cyclin D1 monoclonal antibody (556470; Becton-Dickinson), and
anti-Flag monoclonal antibody (018-22381) (Wako Pure Chemical
Industries, Ltd.). The immunoreactive proteins were visualized
using ImmunoStar Zeta (Wako Pure Chemical Industries, Ltd.) and
light emission was quantified with Light Capture (ATTO Corp.,
Tokyo, Japan). Each assay was repeated more than three times to
confirm the results.
Statistical analysis
Differences in the number of cells, tumor volume,
PCNA labeling index, and rate of DNA ploidy between cell lines or
tumor origins were analyzed by the Student’s or Welch’s t-test. A
value of P<0.05 was considered to indicate a statistically
significant result.
Results
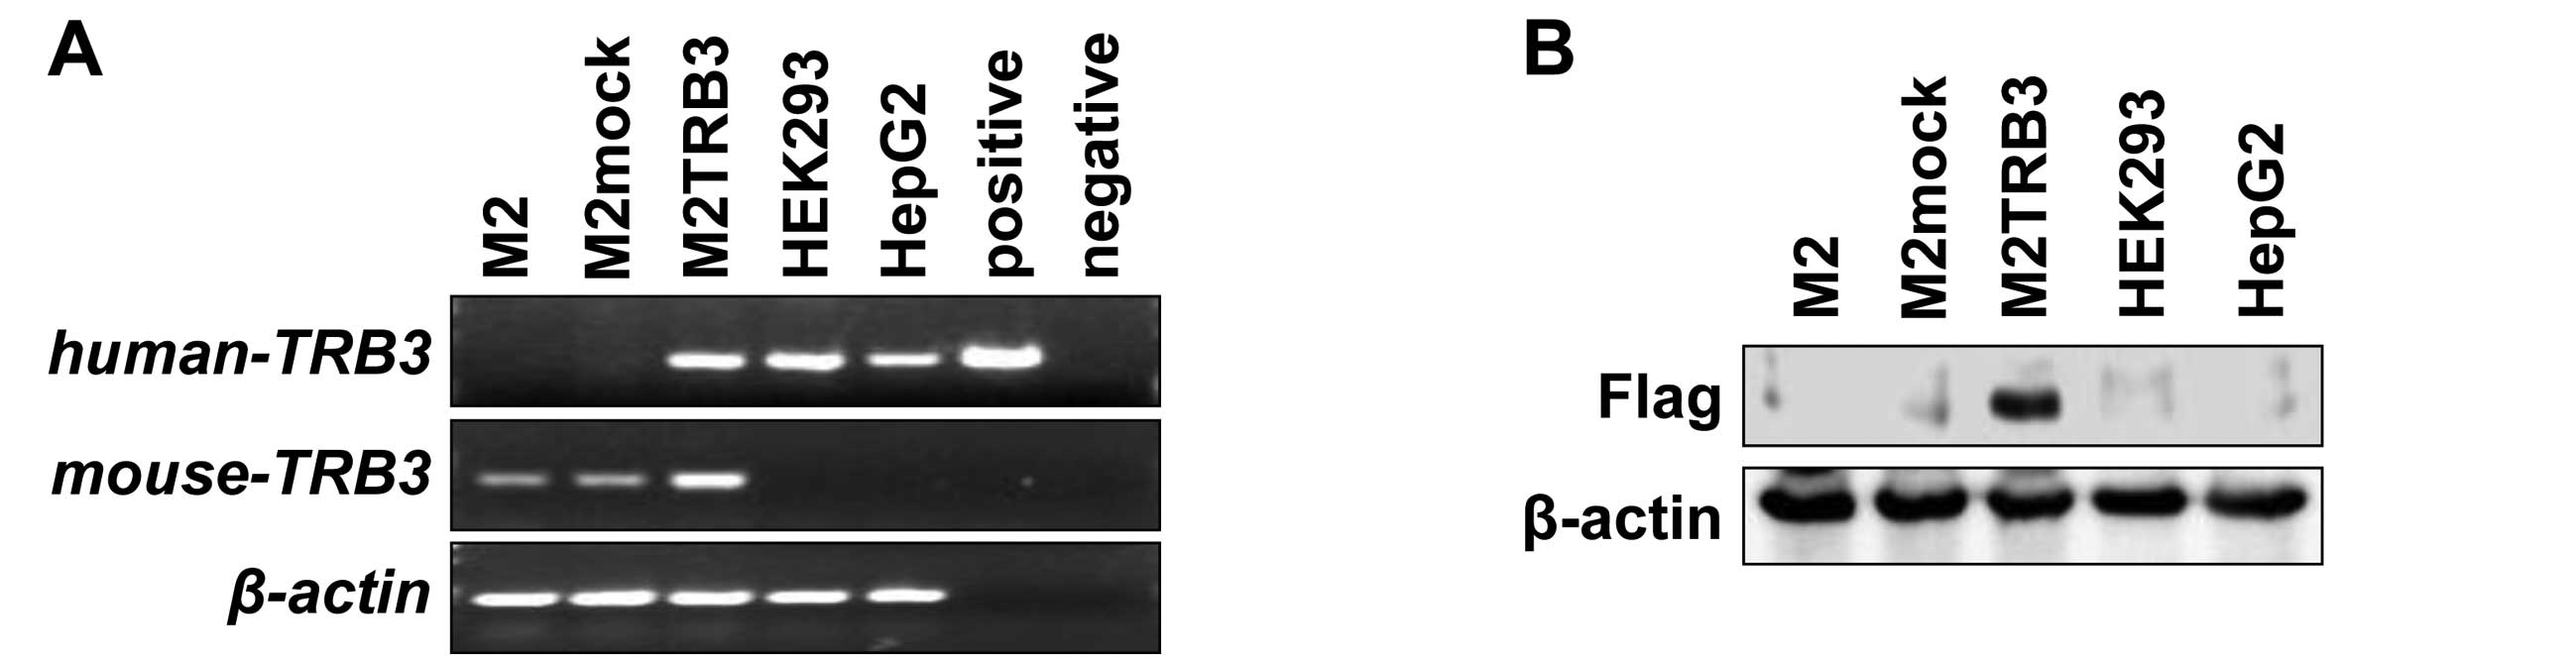
TRB3 expression in the M2TRB3 cells
To examine the role of TRB3 in cell proliferation,
we developed a cell line (M2TRB3) that stably expresses the human
TRB3 gene by transfecting the gene into murine mammary tumor
cell line Cl66M2 (M2) (18). We
also developed the control cells (M2mock) transfected with empty
vector pcDNA3.1-Hygro. M2TRB3 cells expressed both human
TRB3 mRNA and mouse TRB3 mRNA (Fig. 1A). Human embryonic kidney cell line
HEK293 and human hepatoma cell line HepG2 also expressed human
TRB3 mRNA. There was no mRNA expression of human TRB3 in the
M2 and M2mock cells. Human TRB3 DNA was PCR-amplified from
pcDNA3.1-Hygro-flag-human TRB3 vector and the band was present in
the positive lane in Fig. 1A.
Expression of the exogenous TRB3 protein (Flag) was present in the
M2TRB3 cells. No expression was noted in the protein samples
derived from M2, M2mock, HEK293 and HepG2 cells (Fig. 1B). The M2TRB3 and M2mock cells were
used for cell proliferation assays.
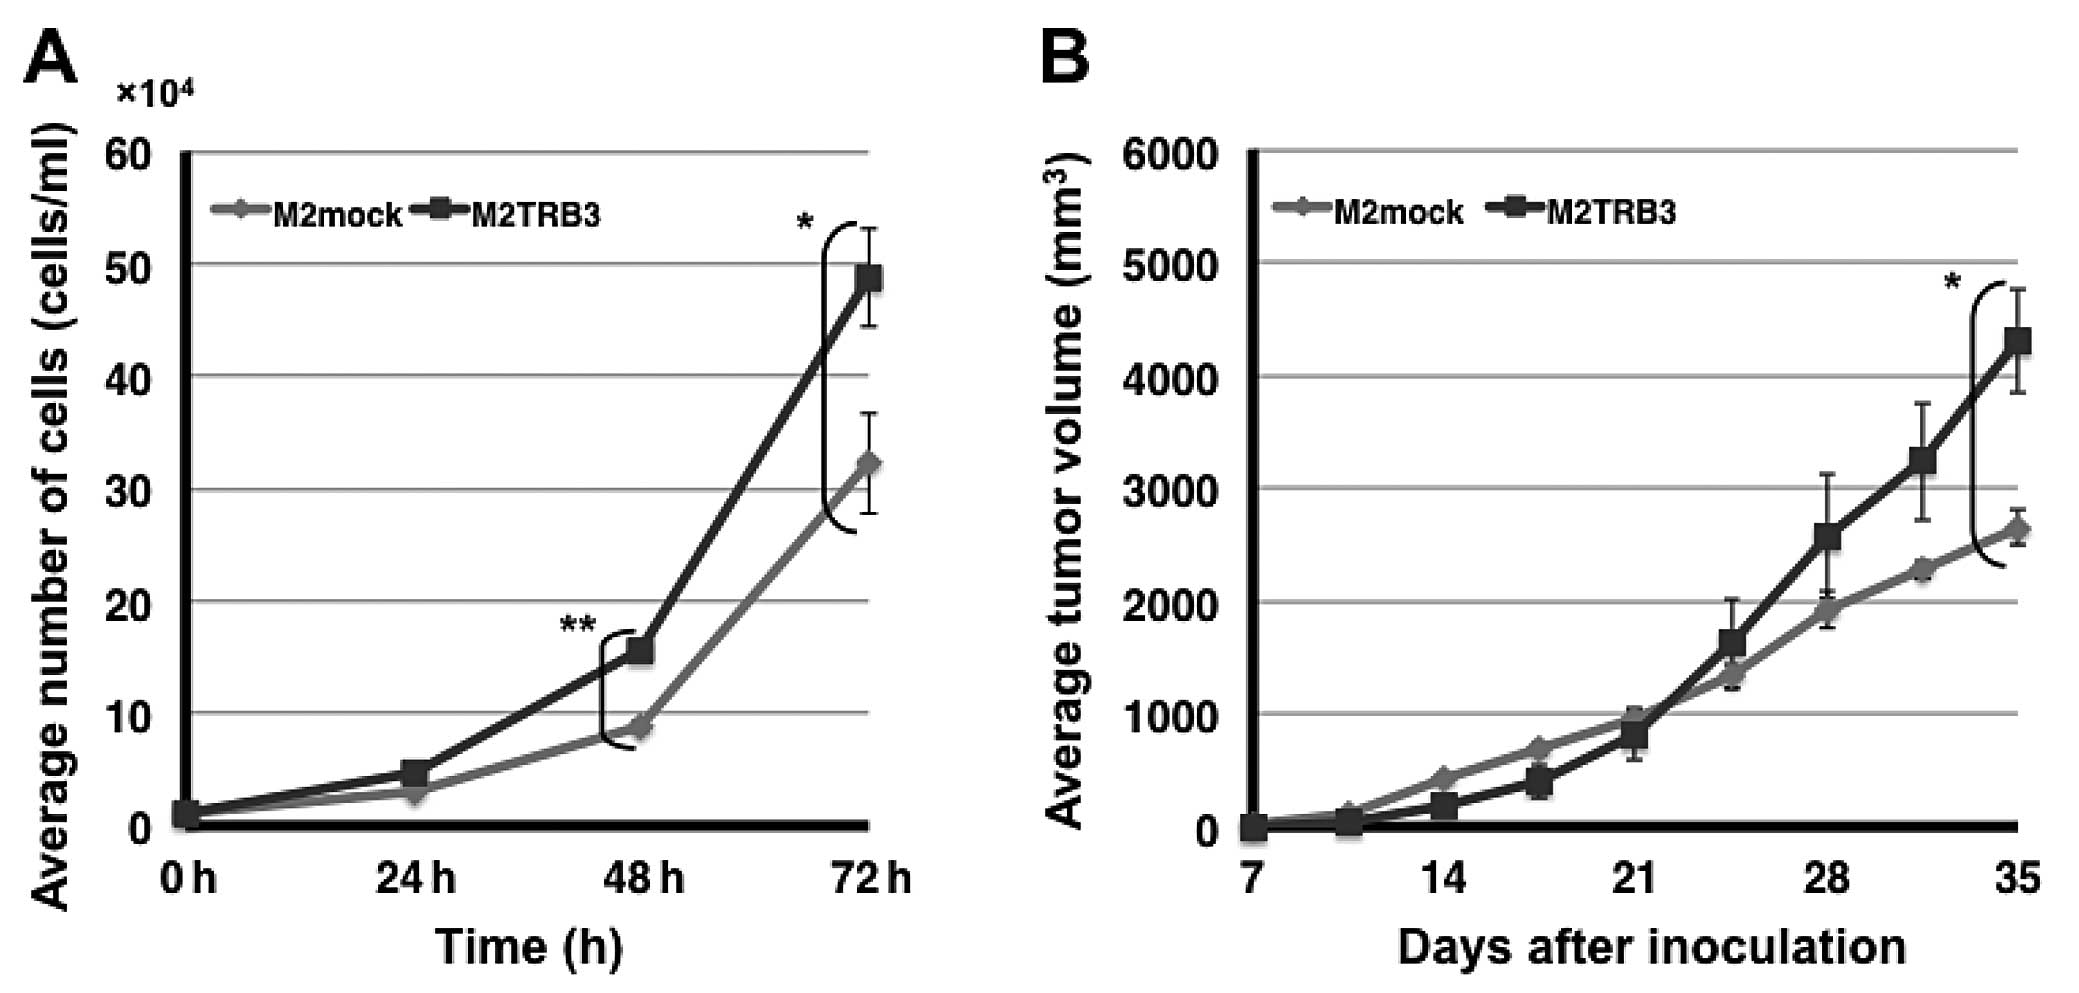
TRB3 gene enhances cell proliferation and
tumor volume
To examine the tumorigenic activity of the TRB3
gene, we investigated its effects on cell and tumor growth using
M2TRB3 and M2mock cells. The number of M2TRB3 cells significantly
increased compared to M2mock cells at the 48 and 72 h time points
(P<0.01 and 0.05, respectively) (Fig. 2A). At 72 h, a 34% increase was noted
in the number of M2TRB3 cells compared to that of the M2mock cells.
To examine the extent of M2TRB3 cell growth when these cells were
implanted into the subcutaneous tissue of mice, we used the
xenograft mouse model as described in Materials and methods. Twice
a week observation was carried out with all mice throughout the
experiment. Tumor growth was monitored with the naked eye from day
7 to 35 after inoculation; tumor volume (mm3) and body
weight (g) were measured twice weekly. No specific physical and
behavioral changes were noted in any mice. The average volume of
the tumors derived from the M2TRB3 cells was significantly
increased by 38% when compared with that of the M2mock tumors at
experimental day 35 (P<0.05) (Fig.
2B).
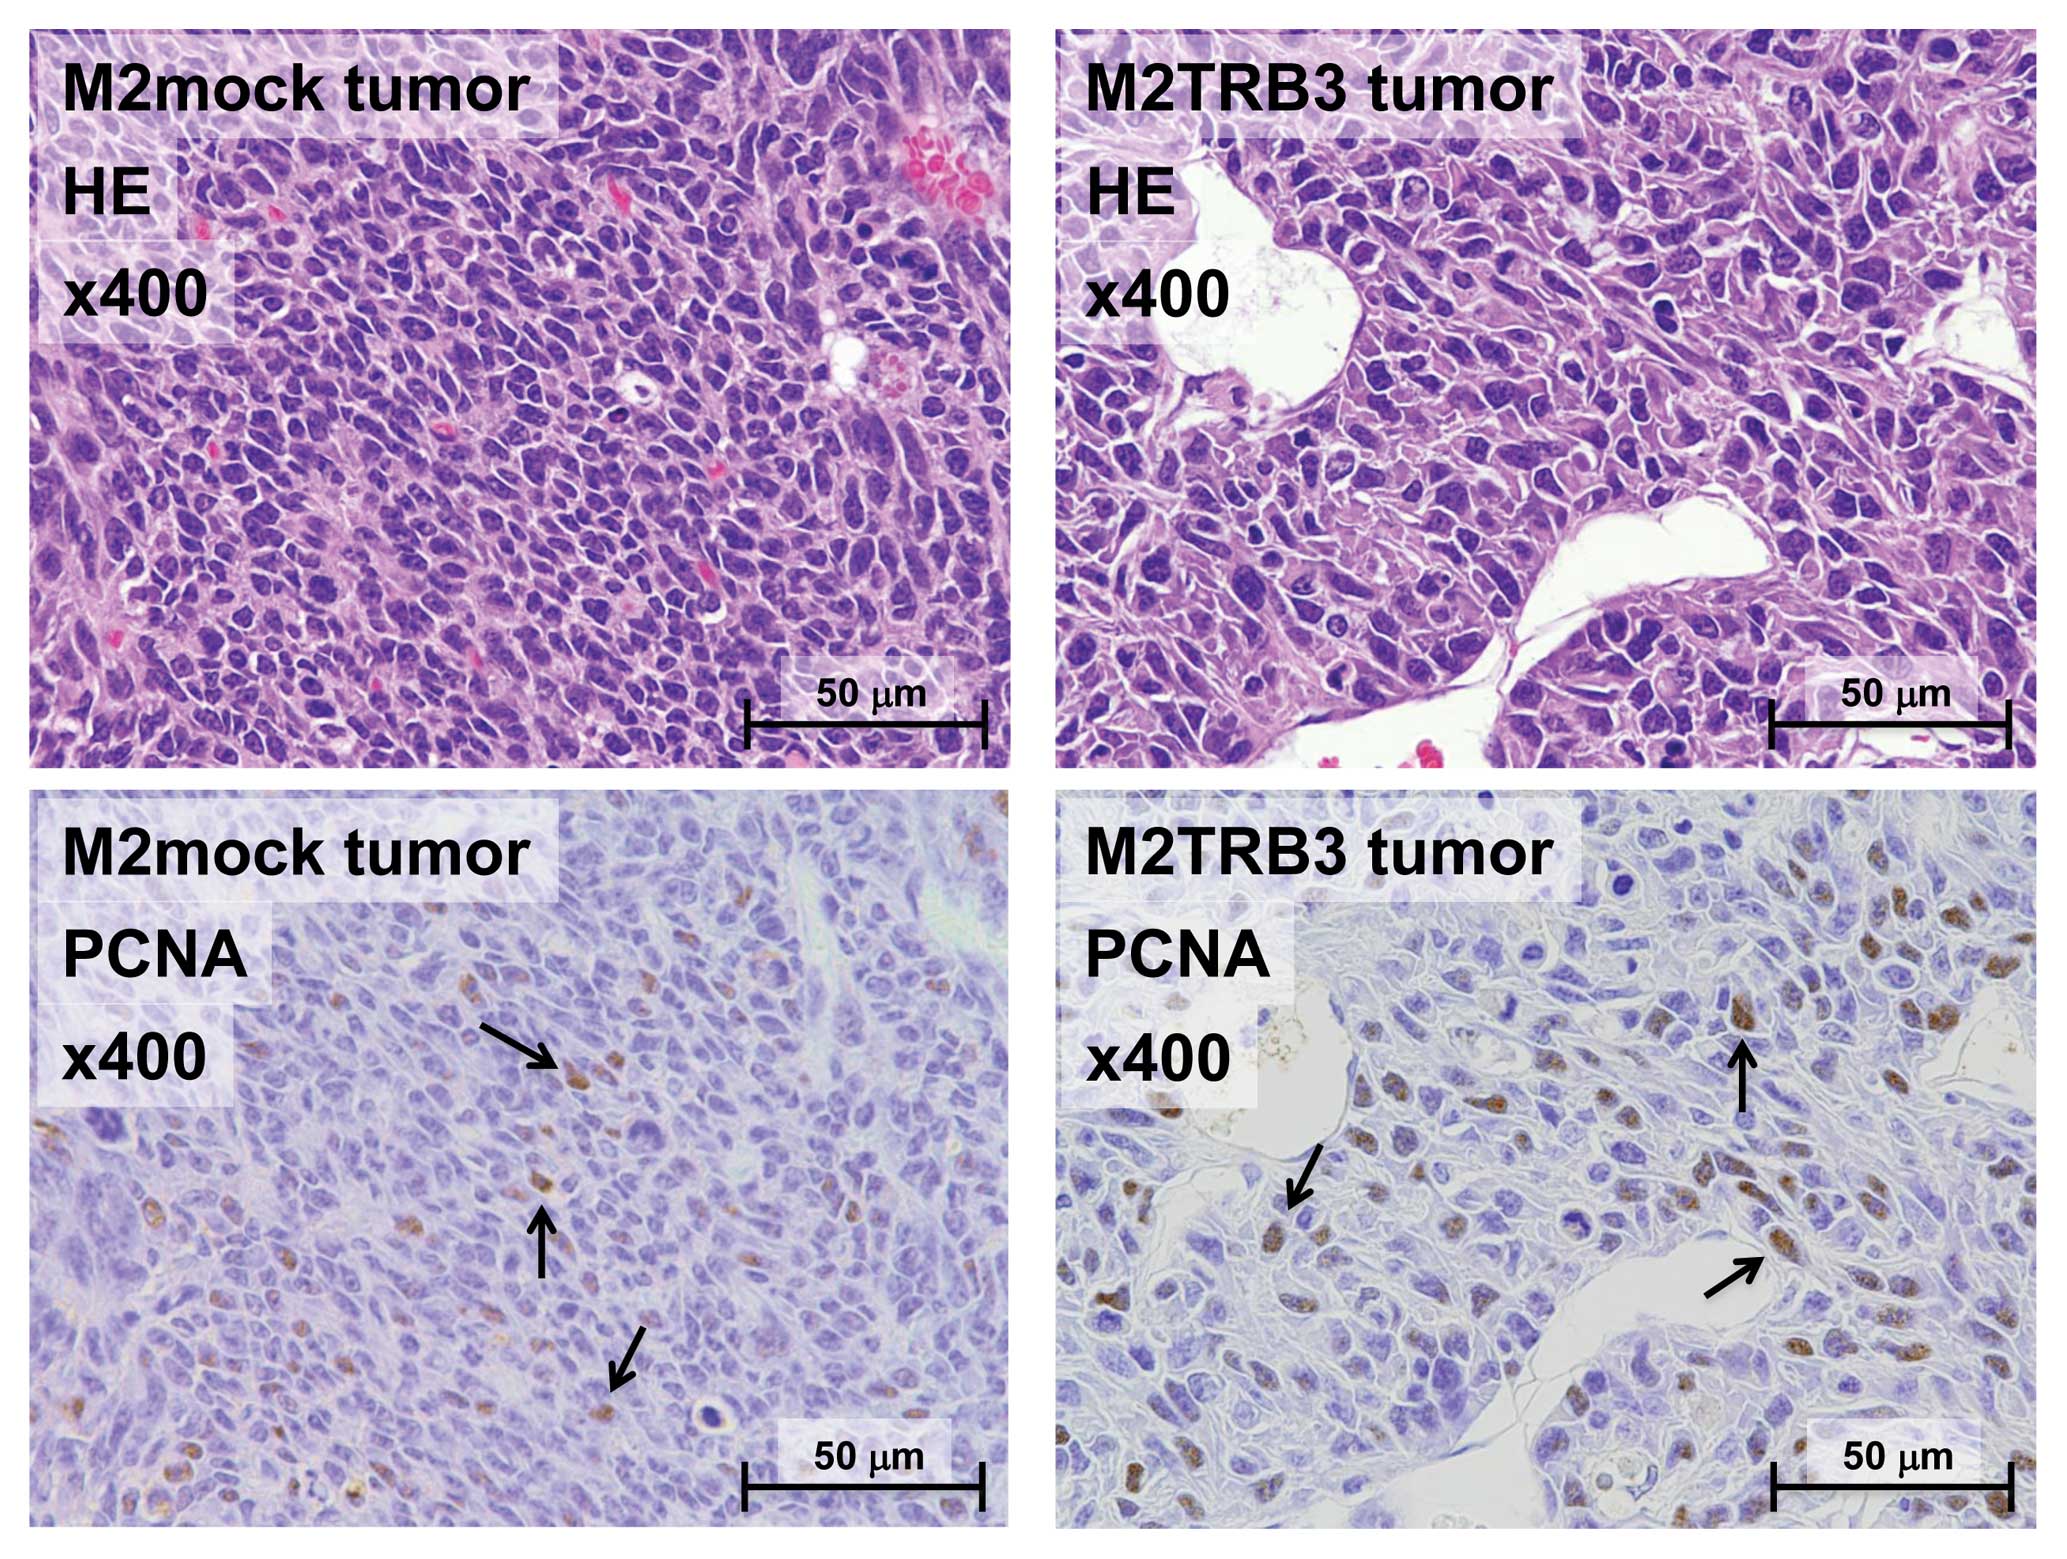
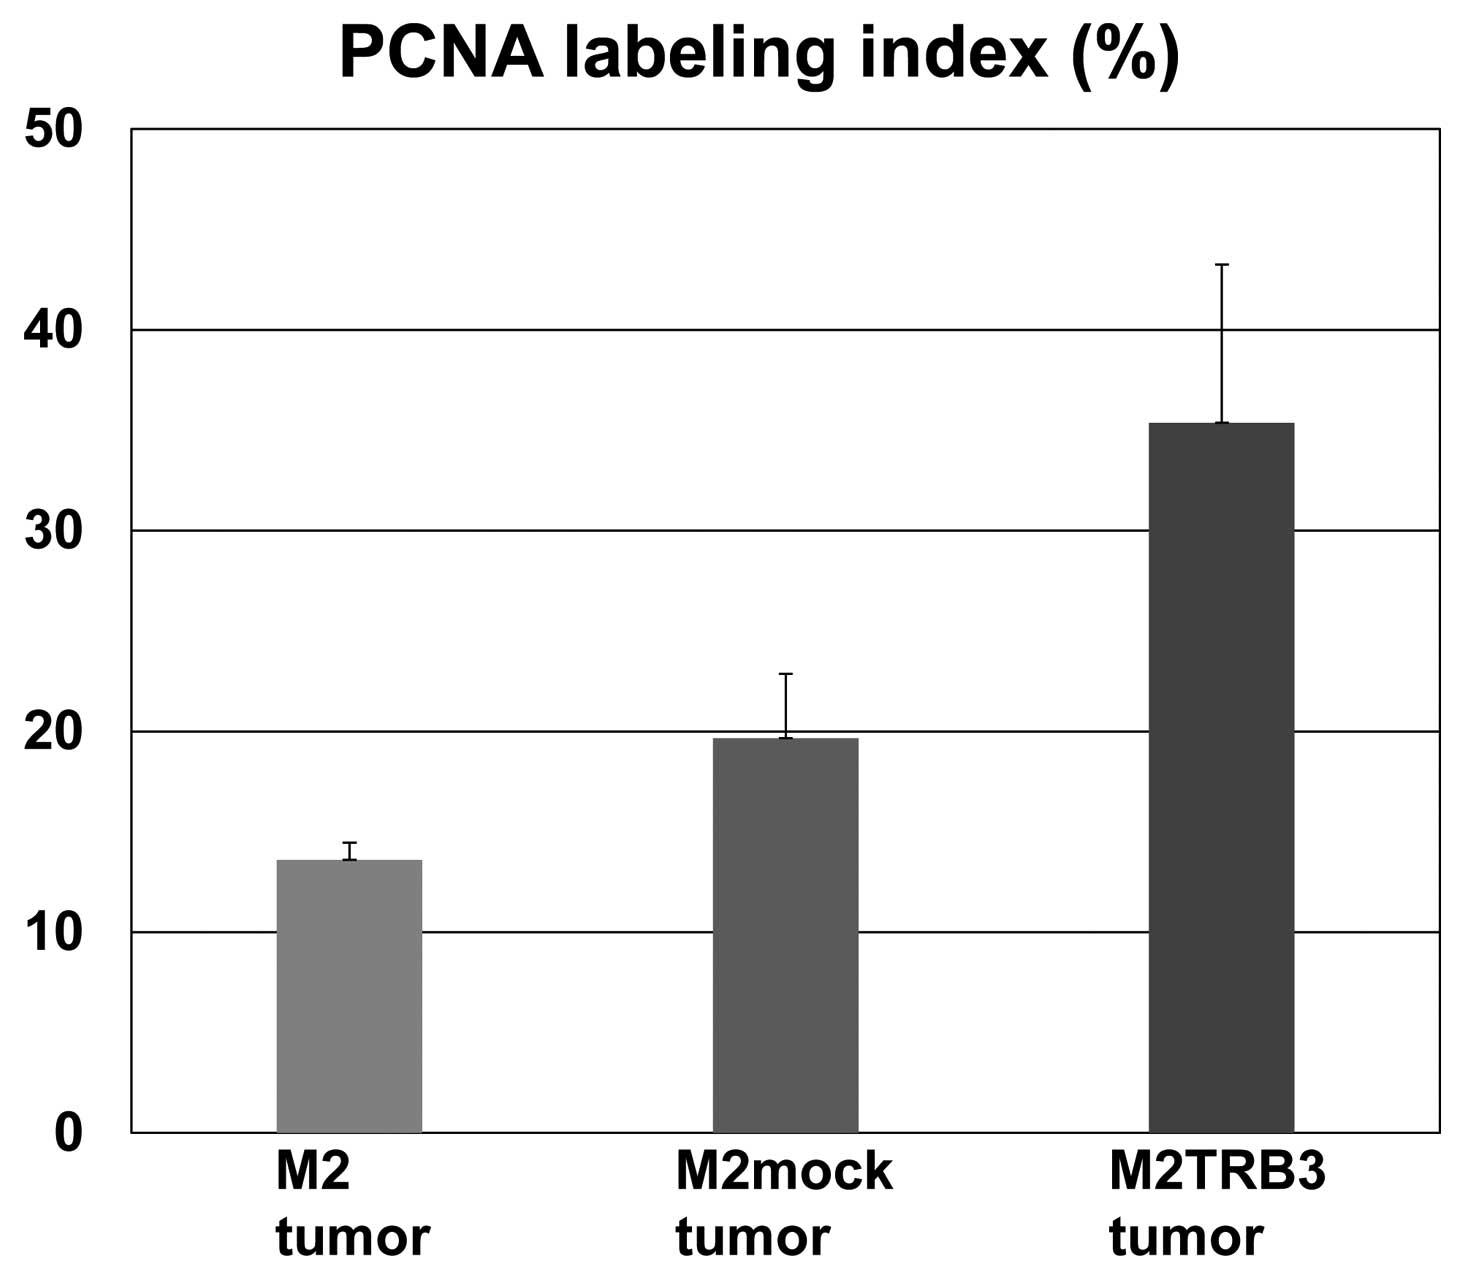
Gross and histological features and PCNA
labeling index of the M2TRB3 tumors
Due to the growth enhancing effects identified
above, we aimed to determine whether the TRB3 gene induced
morphological changes in tumor tissues. The M2TRB3, M2mock and M2
tumors were excised from the mouse skin, fixed with 10% buffered
formalin, and stained with hematoxylin and eosin for histological
examination. The tumors were analyzed using a light microscope.
M2TRB3 and M2mock tumors presented a pedunculated round shape.
Histologically, M2mock tumor cells grew in a solid appearance
(Fig. 3, left upper panel). A site
of necrosis was present in the central region of the tumor. M2TRB3
tumors were also solid and papillary growth was partially noted
(Fig. 3, right upper panel). In the
M2TRB3 tumors, the mean diameter of the nucleus (9.4±0.3 μm) was
significantly greater than that (7.0±0.2 μm) of the M2mock tumors
(P<0.001). The cell proliferation rate was evaluated by
measuring the PCNA labeling index as described in Materials and
methods. The PCNA labeling index of the M2TRB3 tumors was higher
than that of the M2 and M2mock tumors but this difference was not
statistically significant (Fig. 3
lower panels and Fig. 4).
TRB3 affects the ploidy distribution of
mouse mammary tumor cells
Due to the differences in tumor morphology noted in
Fig. 3, we examined the effects of
the TRB3 gene on DNA ploidy in M2mock and M2TRB3 cells. After
synchronizing cells in the G0/G1 phase, we conducted experiments at
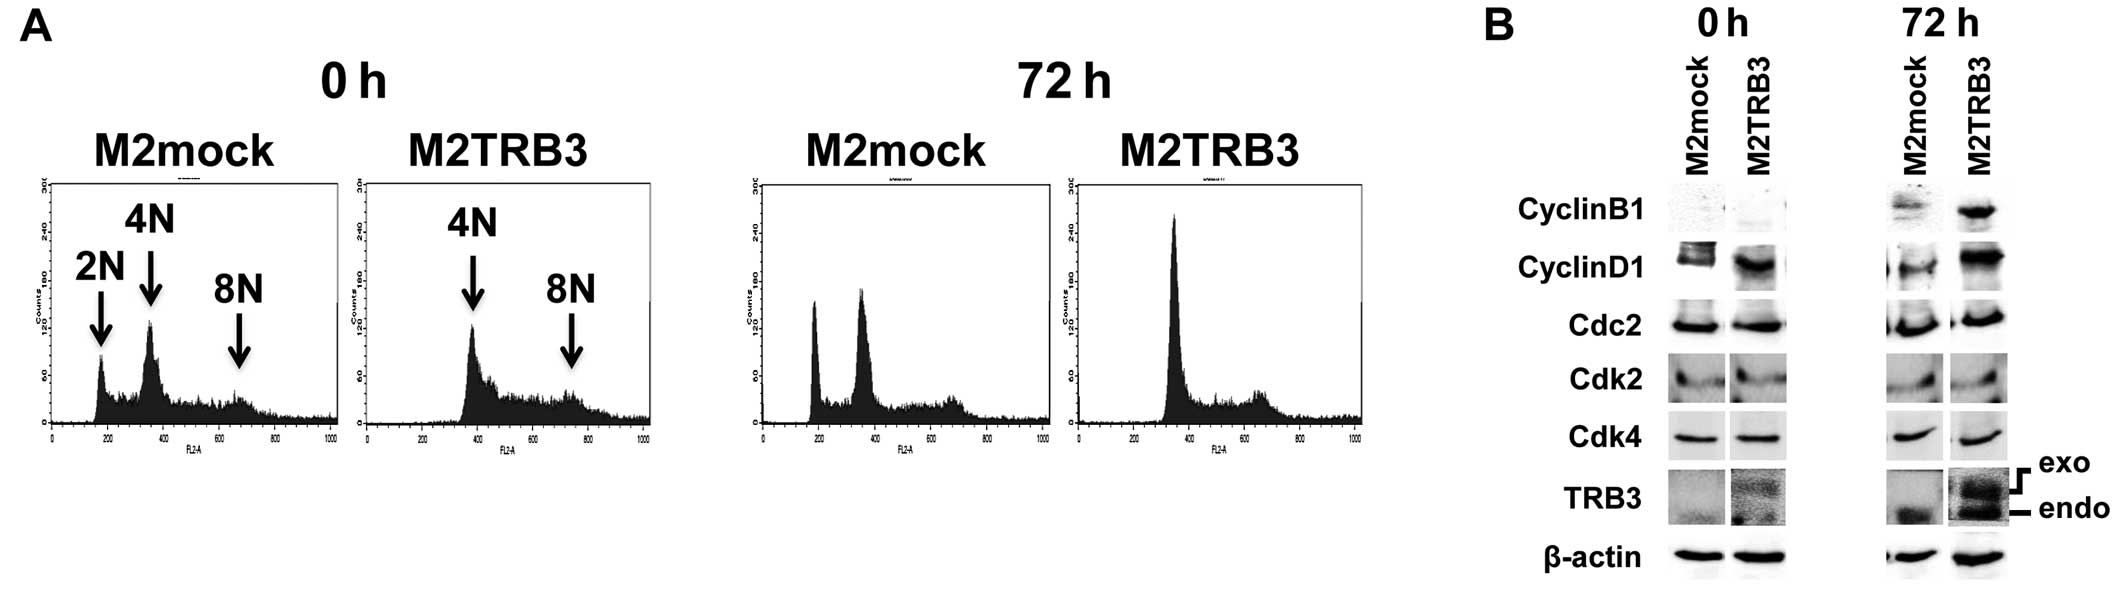
0 and 72 h using flow cytometric analysis. Representative DNA
histograms of the analysis for these cells are shown in Fig. 5A, and distribution and rate of DNA
ploidy are shown in Table I. In
M2mock cells, the average percentage of diploid nuclei measured
12–16%. In contrast, no diploid nuclei were observed in M2TRB3
cells (Table I and Fig. 5A, far right panels). M2TRB3 cells
showed a significant increase by 19 and 12% in the population of
octaploid nuclei at 0 and 72 h, respectively, when compared to
M2mock cells (Table I). There was
also an increase (4–19%) in the population of tetraploid nuclei in
the M2TRB3 cells. These results indicate that TRB3 affects the
status of DNA ploidy in mouse mammary tumor cells. M2mock cells
exhibited population peaks of aneuploid nuclei (2N, 4N and 8N),
indicating that these cells harbor a variable number of
chromosomes.
Expression status of TRB3 and cell cycle
control molecules in M2TRB3 and M2mock cells
Due to the growth enhancing effects of TRB3 as noted
in Fig. 2 and nuclear hyperploidy
in M2TRB3 cells, we examined whether these cells affected the
levels of expression of TRB3 and cell cycle control molecules.
Thus, we measured the protein expression levels of TRB3 and cell
cycle control molecules cyclin B1, cyclin D1, Cdc2, Cdk2 and Cdk4.
In M2TRB3 cells, both exogenous and endogenous TRB3 were highly
expressed at 72 h compared to M2mock cells that only expressed
endogenous TRB3 (Fig. 5B, right two
columns). In contrast, a weak expression level of endogenous TRB3
was observed at 0 h in the M2mock cells, and marginal expression
was noted in both exogenous and endogenous TRB3 at the same time
point in these cells. Cyclin B1 and cyclin D1 expression levels in
the M2TRB3 cells increased at 72 h of the cell culture, in which
tumor cells were out of synchrony, compared to those of the M2mock
cells (Fig. 5B). Expression levels
of Cdc2, Cdk2, and Cdk4 showed no change between the M2TRB3 and
M2mock cells.
Discussion
Several human tumor tissues have recently been shown
to highly express TRB3 mRNA (14).
It has also been demonstrated by us that TRB3 regulates the
stability of Cdc25A, an essential activator of CDKs (10). However, the precise role and
functional morphology of TRB3 have not been established yet. Thus,
we carried out the present study to provide further evidence
concerning cell growth and morphological changes in mouse mammary
tumor cells by focusing on the expression levels of TRB3 and cell
cycle control molecules, cellular nucleus size, and the status of
DNA ploidy. M2TRB3 cells showed a significant numerical increase
compared to the control M2mock cells. As a result, the doubling
time of the M2TRB3 and M2mock cell lines was approximately 12 and
15 h, respectively (Fig. 2A). A
similar condition was also observed in the tumors, clearly
indicating that in this context TRB3 had an enhancing property on
the growth of mouse mammary tumor cells.
It is well understood that cell volume increases
with DNA ploidy, and this correlation has been observed in a wide
variety of eukaryotic cells (19).
Increased DNA ploidy can exert its effects by increasing nuclear
size, chromatin content, and the expression levels of a certain
gene (19). We found that in the
M2TRB3 tumors the mean diameter of the nucleus measured 9.4±0.3 μm
and that of the M2mock tumors was 7.0±0.2 μm. From the flow
cytometric analysis we also found a significant increase in the
population of M2TRB3 cells bearing tetraploid or octaploid nuclei
compared to that of the M2mock cells bearing mostly diploid or
tetraploid nuclei (Fig. 5A). These
findings are consistent with those reported by Danielsen et
al(20) who demonstrated that
nuclei of 6.0–7.5 μm in diameter are classified as diploid, 7.5–9.0
μm as tetraploid, and 9.5–11.0 μm as octaploid. Collectively, TRB3
may have the ability of polyploidization during development.
Cyclins are the key molecules in cell cycle control
due to their specific and periodic expression during cell cycle
progression. Cyclin D1 complexes with Cdk4 and Cdk6 and thereby
regulates transition from the G1 phase into the S phase by
phosphorylation and inactivation of pRB (21–24).
Phosphorylation causes release of the transcription factor E2F that
promotes mitosis (24,25). Gene amplification and/or protein
overexpression of cyclin D1 occurs in a variety of human carcinomas
and tumors in animal models (26,27).
Unlike cyclin D1, the activity of cyclin B1 is essential for G2/M
phase of the cell cycle through a complex with Cdc2 (28). However, little is known about the
association between DNA ploidy and cyclin B1/cyclin D1 expression
status. We found elevated expression levels of cyclin B1 and cyclin
D1 in M2TRB3 cells without significant changes in expression levels
of Cdc2, Cdk2 and Cdk4 (Fig. 5B).
Furthermore, M2TRB3 cells totally lack diploid nuclei but a
population of the M2mock cells consisted mainly of diploid or
tetraploid nuclei, suggesting that expression of cyclin B1 and
cyclin D1 may positively correlate with the generation of
hyperploid nuclei and thereby further promote the chromosomal
instability in TRB3-overexpressing cells. Similar results regarding
cyclin B1/D1 overexpression and promotion of tetraploidy or
aneuploidy (>2N) were previously obtained in human breast
carcinoma and mouse myeloid cells (28,29).
As we found in the present study, the novel aspect of the TRB3 gene
is that this gene induces an increase in cell proliferation and
polyploidy leading to enlargement of the nuclear size of the
implanted mouse mammary tumor cells. These effects of TRB3 may
cause chromosomal instability. The detailed mechanism of this
chromosomal instability is not known but may be related to the
above-described effects of TRB3 on morphological function. In a
recent study, we demonstrated that TRB3 may regulate the activity
of anaphase-promoting complex/cyclosome (APC/CCdh1) that
is a major ubiquitin ligase complex regulating the progression of
the cell cycle through the ubiquitination and subsequent
degradation of cell cycle control molecules including cyclin B1
(30,31). In the present study, we found an
elevated expression level of the cyclin B1 protein in M2TRB3 cells
that overexpressed the human TRB3 gene. We should emphasize that
two cell lines M2TRB3 and M2mock differ in synchrony status that
may influence their response to morphological function. This
intriguing respect may also reflect the role of cell cycle
progression of TRB3. Thus, it is of interest to examine whether the
TRB3 gene causes de novo morphological changes leading to
tumorigenesis in a specific organ site. An additional study using
the TRB3 transgenic animal model is currently in progress to answer
this question.
Acknowledgements
We thank Dr Hiroyuki Tsuda for the valuable comments
and discussions. We also acknowledge the excellent technical
assistance of Kenta Moriwaki and Shuhei Ikenaga. This study was
supported by a Grant-in-Aid from the Ministry of Education,
Culture, Sports, Science, and Technology, and the Ministry of
Health, Labour, and Welfare of Japan.
References
|
1
|
Grosshans J and Wieschaus E: A genetic
link between morphogenesis and cell division during formation of
the ventral furrow in Drosophila. Cell. 101:523–531. 2000.
View Article : Google Scholar : PubMed/NCBI
|
|
2
|
Mata J, Curado S, Ephrussi A and Rørth P:
Tribbles coordinates mitosis and morphogenesis in Drosophila
by regulating string/CDC25 proteolysis. Cell. 101:511–522. 2000.
View Article : Google Scholar : PubMed/NCBI
|
|
3
|
Seher TC and Leptin M: Tribbles, a
cell-cycle brake that coordinates proliferation and morphogenesis
during Drosophila gastrulation. Curr Biol. 10:623–629. 2000.
View Article : Google Scholar : PubMed/NCBI
|
|
4
|
Bowers AJ, Scully S and Boylan JF: SKIP3,
a novel Drosophila tribbles ortholog, is overexpressed in
human tumors and is regulated by hypoxia. Oncogene. 22:2823–2835.
2003.PubMed/NCBI
|
|
5
|
Bezy O, Vernochet C, Gesta S, Farmer SR
and Kahn CR: TRB3 blocks adipocyte differentiation through the
inhibition of C/EBPβ transcriptional activity. Mol Cell Biol.
27:6818–6831. 2007.PubMed/NCBI
|
|
6
|
Chan MC, Nguyen PH, Davis BN, Ohoka N,
Hayashi H, Du K, Lagna G and Hata A: A novel regulatory mechanism
of the bone morphogenetic protein (BMP) signaling pathway involving
the carboxyl-terminal tail domain of BMP type II receptor. Mol Cell
Biol. 27:5776–5789. 2007. View Article : Google Scholar
|
|
7
|
Du K, Herzig S, Kulkarni RN and Montminy
M: TRB3: a tribbles homolog that inhibits Akt/PKB activation by
insulin in liver. Science. 300:1574–1577. 2003. View Article : Google Scholar : PubMed/NCBI
|
|
8
|
Qi L, Heredia JE, Altarejos JY, Screaton
R, Goebel N, Niessen S, Macleod IX, Liew CW, Kulkarni RN, Bain J,
Newgard C, Nelson M, Evans RM, Yates J and Montminy M: TRB3 links
the E3 ubiquitin ligase COP1 to lipid metabolism. Science.
312:1763–1766. 2006. View Article : Google Scholar : PubMed/NCBI
|
|
9
|
Tang M, Zhong M, Shang Y, Lin H, Deng J,
Jiang H, Lu H, Zhang Y and Zhang W: Differential regulation of
collagen types I and III expression in cardiac fibroblasts by AGEs
through TRB3/MAPK signaling pathway. Cell Mol Life Sci.
65:2924–2932. 2008. View Article : Google Scholar : PubMed/NCBI
|
|
10
|
Ohoka N, Yoshii S, Hattori T, Onozaki K
and Hayashi H: TRB3, a novel ER stress-inducible gene, is induced
via ATF4-CHOP pathway and is involved in cell death. EMBO J.
24:1243–1255. 2005. View Article : Google Scholar : PubMed/NCBI
|
|
11
|
Sakai S, Ohoka N, Onozaki K, Kitagawa M,
Nakanishi M and Hayashi H: Dual mode of regulation of cell division
cycle 25 A protein by TRB3. Biol Pharm Bull. 33:1112–1116. 2010.
View Article : Google Scholar : PubMed/NCBI
|
|
12
|
Jin G, Yamazaki Y, Takuwa M, Takahara T,
Kaneko K, Kuwata T, Miyata S and Nakamura T: Trib1 and Evi1
cooperate with Hoxa and Meis1 in myeloid leukemogenesis. Blood.
109:3998–4005. 2007. View Article : Google Scholar : PubMed/NCBI
|
|
13
|
Keeshan K, He Y, Wouters BJ, Shestova O,
Xu L, Sai H, Rodriguez CG, Maillard I, Tobias JW, Valk P, Carroll
M, Aster JC, Delwel R and Pear WS: Tribbles homolog 2 inactivates
C/EBPα and causes acute myelogenous leukemia. Cancer Cell.
10:401–411. 2006.PubMed/NCBI
|
|
14
|
Xu J, Lv S, Qin Y, Shu F, Xu Y, Chen J, Xu
BE, Sun X and Wu J: TRB3 interacts with CtIP and is overexpressed
in certain cancers. Biochim Biophys Acta. 1770:273–278. 2007.
View Article : Google Scholar : PubMed/NCBI
|
|
15
|
Suzui M, Sunagawa N, Chiba I, Moriwaki H
and Yoshimi N: Acyclic retinoid, a novel synthetic retinoid,
induces growth inhibition, apoptosis, and changes in mRNA
expression of cell cycle- and differentiation-related molecules in
human colon carcinoma cells. Int J Oncol. 28:1193–1199. 2006.
|
|
16
|
Suzui M, Inamine M, Kaneshiro T, Morioka
T, Yoshimi N, Suzuki R, Kohno H and Tanaka T: Indole-3-carbinol
inhibits the growth of human colon carcinoma cells but enhances the
tumor multiplicity and volume of azoxymethane-induced rat colon
carcinogenesis. Int J Oncol. 27:1391–1399. 2005.
|
|
17
|
Suzui M, Masuda M, Lim JT, Albanese C,
Pestell RG and Weinstein IB: Growth inhibition of human hepatoma
cells by acyclic retinoid is associated with induction of p21(CIP1)
and inhibition of expression of cyclin D1. Cancer Res.
62:3997–4006. 2002.PubMed/NCBI
|
|
18
|
Futakuchi M, Nannuru KC, Varney ML,
Sadanandam A, Nakao K, Asai K, Shirai T, Sato SY and Singh RK:
Transforming growth factor-beta signaling at the tumor-bone
interface promotes mammary tumor growth and osteoclast activation.
Cancer Sci. 100:71–81. 2009. View Article : Google Scholar : PubMed/NCBI
|
|
19
|
Jorgensen P and Tyers M: How cells
coordinate growth and division. Curr Biol. 14:1014–1027. 2004.
View Article : Google Scholar
|
|
20
|
Danielsen H, Lindmo T and Reith A: A
method for determining ploidy distributions in liver tissue by
stereological analysis of nuclear size calibrated by flow
cytometric DNA analysis. Cytometry. 7:475–480. 1986. View Article : Google Scholar : PubMed/NCBI
|
|
21
|
Hunter T and Pines J: Cyclins and cancer.
II: cyclin D and CDK inhibitors come of age. Cell. 79:573–582.
1994. View Article : Google Scholar : PubMed/NCBI
|
|
22
|
Weinberg RA: The retinoblastoma protein
and cell cycle control. Cell. 81:323–330. 1995. View Article : Google Scholar : PubMed/NCBI
|
|
23
|
Chellappan SP, Hiebert S, Mudryj M,
Horowitz JM and Nevins JR: The E2F transcription factor is a
cellular target for the RB protein. Cell. 65:1053–1061. 1991.
View Article : Google Scholar : PubMed/NCBI
|
|
24
|
Wilson CS, Butch AW, Lai R, Medeiros LJ,
Sawyer JR, Barlogie B, McCourty A, Kelly K and Brynes RK: Cyclin D1
and E2F-1 immunoreactivity in bone marrow biopsy specimens of
multiple myeloma: relationship to proliferative activity,
cytogenetic abnormalities and DNA ploidy. Br J Haematol.
112:776–782. 2001. View Article : Google Scholar
|
|
25
|
Johnson DG, Schwarz JK, Cress WD and
Nevins JR: Expression of transcription factor E2F1 induces
quiescent cells to enter S phase. Nature. 365:349–352. 1993.
View Article : Google Scholar : PubMed/NCBI
|
|
26
|
Staibano S, Lo Muzio L, Pannone G, Mezza
E, Argenziano G, Vetrani A, Lucariello A, Franco R, Errico ME and
De Rosa G: DNA ploidy and cyclin D1 expression in basal cell
carcinoma of the head and neck. Am J Clin Pathol. 115:805–813.
2001. View Article : Google Scholar : PubMed/NCBI
|
|
27
|
Bartkova J, Lukas J, Strauss M and Bartek
J: Cyclin D1 oncoprotein aberrantly accumulates in malignancies of
diverse histogenesis. Oncogene. 10:775–778. 1995.PubMed/NCBI
|
|
28
|
Collecchi P, Santoni T, Gnesi E, Giuseppe
Naccarato A, Passoni A, Rocchetta M, Danesi R and Bevilacqua G:
Cyclins of phases G1, S and G2/M are overexpressed in aneuploid
mammary carcinomas. Cytometry. 42:254–260. 2000. View Article : Google Scholar : PubMed/NCBI
|
|
29
|
Yin XY, Grove L, Datta NS, Katula K, Long
MW and Prochownik EV: Inverse regulation of cyclin B1 by c-Myc and
p53 and induction of tetraploidy by cyclin B1 overexpression.
Cancer Res. 61:6487–6493. 2001.PubMed/NCBI
|
|
30
|
Ohoka N, Sakai S, Onozaki K, Nakanishi M
and Hayashi H: Anaphase-promoting complex/cyclosome-cdh1 mediates
the ubiquitination and degradation of TRB3. Biochem Biophys Res
Commun. 392:289–294. 2010. View Article : Google Scholar : PubMed/NCBI
|
|
31
|
Lukas C, Sørensen CS, Kramer E,
Santoni-Rugiu E, Lindeneg C, Peters JM, Bartek J and Lukas J:
Accumulation of cyclin B1 requires E2F and cyclin-A-dependent
rearrangement of the anaphase-promoting complex. Nature.
401:815–818. 1999. View
Article : Google Scholar : PubMed/NCBI
|