Introduction
Colorectal cancer (CRC) with a multistep process is
a leading cause of high cancer-related morbidity and mortality,
with more than 600,000 deaths worldwide annually (1). Although various etiologies, which have
not been completely established exist, the aberrant accumulation of
genetic and epigenetic changes remains one of the important
mechanisms. Similar to genetic lesions, epigenetic lesions can also
change structure and function of genome without the alteration of
DNA nucleotide sequence (2), and
present heritable and possibly reversible changes (2,3).
Recently, numerous data have shown that alteration of epigenetic
modification involving DNA methylation, histone modifications,
miRNAs and long non-coding RNAs contribute to carcinogenesis
(4), suggesting that DNA
methylation changes may create a carcinogenic field in
histologically normal mucosa of CRC patients. In this setting, an
opportunity to study the environmental effects on epigenetic
alteration reveals a novel challenge to better clarify the function
of epigenetics on CRC tumorigenesis (5). DNA methylation profiles are regulated
by DNA methyltransferases (DNMTs), hence, an aberrant DNMT
expression results in abnormal DNA methylation status (6,7). In
addition, upregulated expression of DNMTs is often prior to change
of hypermethylation in gene promoter, which is considered to be an
early molecular hallmark of cancer cells (7). Therefore, in this context, our
research group performed this study for the first time, we
presented a hypothesis that tissues with different distance from
CRC focus display varied microenvironment playing an important role
in CRC carcinogenesis, and epigenetic alteration is a crucial
player in cellular response to the changed microenvironment.
Recently, miRNAs have attracted extensive attention
owing to their important functions in a large number of biological
activities, such as cellular differentiation, cell proliferation
and apoptosis (8,9). MicroRNAs (miRNAs or miR) are a class
of endogenous small non-coding RNAs known to regulate gene
expression at the post-transcriptional level through binding to a
complementary site that locates on the 3′-untranslated region of
target mRNAs (10). Dysregulation
of miRNA expression is found in many forms of cancer, including
esophageal squamous cell carcinoma (11), breast cancer (12), and gastric cancer (13). Although previous studies have
manifested that global genome hypomethylation presented the
characteristic of step-by-step wide genome depletion of methylated
cytosine base pairs (5-methylated cytosine) (14), and a mass of aberrant miRNAs have
been discovered in CRC as well (15), which seem to have shown the
significant role of miRNAs in development of CRC, the difference
and relative function of the miRNAs targeting DNMTs in precancerous
lesions of CRC are still unclear. Therefore, we performed the
present study to elucidate the global changes of miRNA expression
profiles and the expression difference of miRNAs targeting
corresponding DNMTs in different locations with different distance
from cancer lesions under the above hypothesis.
Materials and methods
Tissue samples and reagents
Tissues resected operationally were from the First
Affiliated Hospital of Guangzhou University of Traditional Chinese
Medicine (TCM). All samples were sporadic CRC, and were not
administered any radiotherapy or chemotherapy before operation. The
diagnosis of CRC were confirmed by at least two pathologists.
Samples collected were immediately frozen in liquid nitrogen.
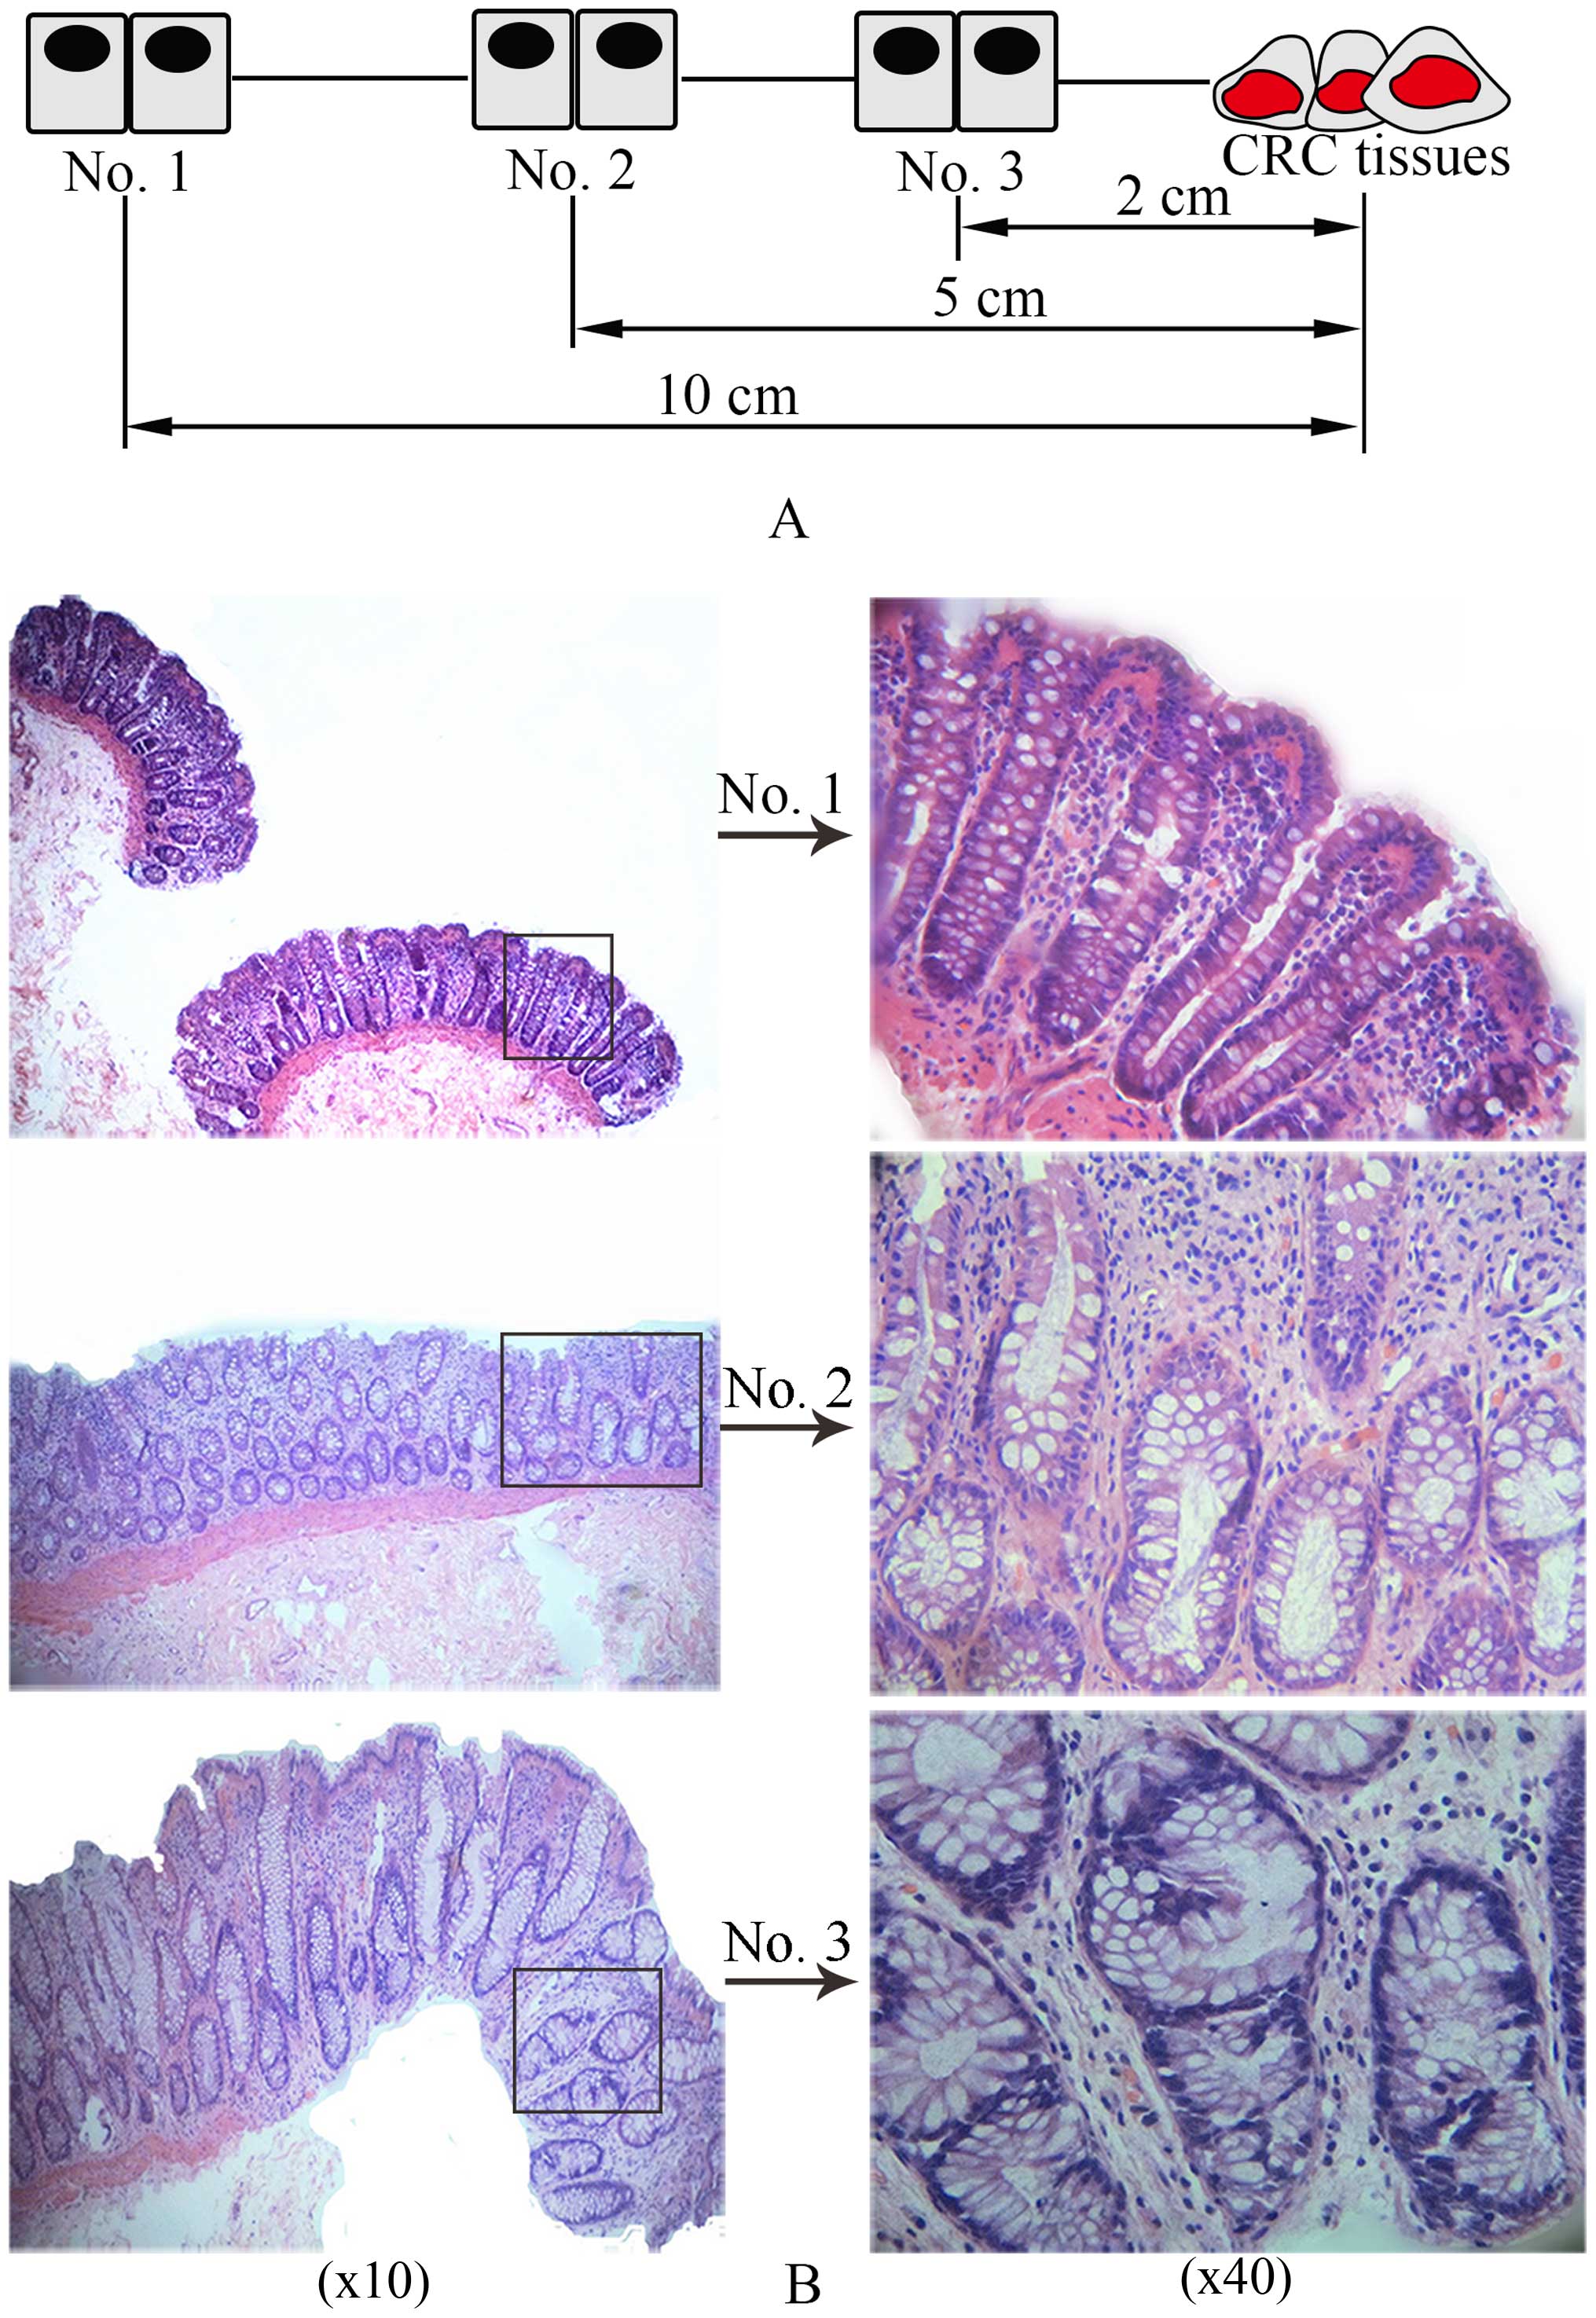
Samples obtained from three sites from the same patient were,
respectively, marked as no. 1, no. 2 and no. 3, which were ≥10, 5
and ≤2 cm away from the CRC lesions, respectively (as shown in
Fig. 1A).
Reagents and instruments used in this study included
TRIzol reagent and glycogen without RNaseA (Invitrogen Life
Technologies, Carlsbad, CA, USA), RNase inhibitor, reverse
transcriptase and 10X RT buffer solution (250 mM Tris-HCl, pH 8.3,
200 mM KCl, 40 mM MgCl2, 5 mM DTT) (all from Epicentre
Biotechnologies, Madison, WI, USA), 2.5 mM dNTP mixed liquids
(dATP, dGTP, dCTP and dTTP 2.5 mM, respectively) (HyTest Ltd.,
Turku, Finland), RT primers (Invitrogen Life Technologies); 2X PCR
Master mix (SuperArray Bioscience, Frederick, MD, USA), Primer 5.0
ABI Prism 7900 system (Applied Biosystems Inc., Foster City, CA,
USA). TRIzol (Invitrogen) and miRNeasy mini kit (Qiagen, Hilden,
Germany), miRCURY™ LNA array (v.18.0), Axon GenePix 4000B
microarray scanner, GenePix Pro 6.0 (Axon Instruments, Foster City,
CA, USA).
H&E staining for tissue
structure
The tissues collected were fixed with 4%
paraformaldehyde, and then paraffin-embedded samples were cut into
4 µm slides. After a 10-min and a 3-min treatment of
dimethylbenzene and ethanol, respectively, the slices were stained
with hematoxylin for 10 min and subsequently 0.5% eosin for 3 min,
and then again treated with ethanol. The slices sealed with neutral
gum were observed to obtain images using an inverted phase contrast
microscope.
Immunohistochemical (IHC) analysis for
biological markers and DNMTs
The 4 µm thickness sections from the tissue
block were selected for IHC staining. Briefly, samples which were
fixed with 4% paraformaldehyde for 24 to 48 h were dehydrated,
permeabilized and embedded in paraffin. Four micrometers of
paraffin-embedded slides were deparaffized by dimethylbenzene for
10 min and incubated with 5% fetal bovine serum at room temperature
for 10 min. Antigen retrieval was performed separately using
moderate heat-induced antigen retrieval two times in microwave
oven. IHC was performed using rabbit anti-human CK18, CD133,
vimentin, cyclin D1 (CD1) monoclonal antibodies. Primary antibodies
were diluted in antibody diluent (Beyotime, Wuhan, China) to the
indicated optimal dilutions of 1:100 for CK18; 1:100 for CD1; 1:50
for vimentin, 1:100 for CD133. The sections were incubated with a
biotinylated goat anti-rabbit IgG secondary antibody. The slides
were stained with diaminobenzidine (DAB) staining used as the
chromogen for optimal time, then the sections were counterstained
with hematoxylin. Optical density (OD) values of a positive immune
product for each group were obtained by pathological analysis
software IPP 6.0.
Western blotting
Total protein from tissue samples was extracted.
Seperation of proteins (30 µg) was performed by 10% sodium
dodecyl sulphate-polyacrylamide gel electrophoresis (SDS-PAGE), and
then these were transferred onto PVDF membrane (Millipore Corp.,
Billerica, MA, USA). After the membrane was incubated with rabbit
anti-human DNMT1 antibody (bs-0678R), DNMT3A antibody (bs-0301R)
and DNMT3B (bs-0301R) (all from BIOSS, Beijing, China) and β-actin
antibody (ab129348; Abcam, San Francisco, CA, USA) at 4°C
overnight, secondary antibodies were added to the membranes for
further incubation. Detection of these proteins was performed by
enhanced chemiluminescence. The quantification of images was
measured using AS image analysis system (Kontron AG, Augsburg,
Germany). Finally, the absolute values of the protein expression
was quantified through the darkness of the DNMT1, DNMT3A, and
DNMT3B bands divided by the darkness of β-actin bands.
miRNA microarray chip
The 7th generation of miRCURY™ LNA array (v.18.0)
(Exiqon, Vedbaek, Denmark) contains 3,100 capture probes, covering
all human, mouse and rat miRNAs annotated in miRBase 18.0, as well
as all viral miRNAs related to these species. In addition, this
array contains capture probes for 25 miRPlus™ human miRNAs. Total
RNA was isolated using TRIzol (Invitrogen) and miRNeasy mini kit
(Qiagen) according to manufacturer's instructions, which
efficiently recovered all RNA species, including miRNAs. RNA
quality and quantity was measured by using NanoDrop
spectrophotometer (ND-1000; NanoDrop Technologies, Wilmington, DE,
USA) and RNA integrity was determined by gel electrophoresis. After
RNA isolation from the samples, the miRCURY™ Hy3™/Hy5™ Power
labeling kit (Exiqon) was used according to the manufacturer's
guideline for miRNA labelling. One microgram of each sample was
3′-end-labeled with Hy3™ fluorescent label, using T4 RNA ligase by
the following procedure: RNA in 2.0 µl of water was combined
with 1.0 µl of CIP buffer and CIP (Exiqon). The mixture was
incubated for 30 min at 37°C, and was terminated by incubation for
5 min at 95°C. Then 3.0 µl of labeling buffer, 1.5 µl
of fluorescent label (Hy3™), 2.0 µl of DMSO, 2.0 µl
of labeling enzyme were added into the mixture. The labeling
reaction was incubated for 1 h at 16°C, and terminated by
incubation for 15 min at 65°C.
Array hybridization
After stopping the labeling procedure, the
Hy3™-labeled samples were hybridized on the miRCURY™ LNA array
(v.18.0) (Exiqon) according to array manual. The total 25 µl
mixture from Hy3™-labeled samples with 25 µl hybridization
buffer were first denatured for 2 min at 95°C, incubated on ice for
2 min and then hybridized to the microarray for 16 to 20 h at 56°C
in a 12-Bay Hybridization Systems (Hybridization System-NimbleGen
Systems, Inc., Madison, WI, USA), which provides an active mixing
action and constant incubation temperature to improve hybridization
uniformity and enhance signal. Following hybridization, the slides
were achieved, washed several times using Wash buffer kit (Exiqon),
and finally dried by centrifugation for 5 min at 400 rpm. Then the
slides were scanned using the Axon GenePix 4000B microarray scanner
(Axon Instruments). Scanned images were then imported into GenePix
Pro 6.0 software (Axon Instruments) for grid alignment and data
extraction. Replicated miRNAs were averaged and miRNAs with
intensities ≥30 in all samples were chosen for calculating the
normalization factor. Expressed data were normalized using the
median normalization. After normalization, for quality assessment
of miRNA data, box plot, correlation matrix and scatter plot for
miRNAs were used, significant differentially expressed miRNAs were
identified through volcano plot filtering (fold-change ≥1.5,
P-value ≤0.05). Hierarchical clustering was performed using MEV
software (v4.6, TIGR). Quality control was by NanoDrop 1000
spectrophotometer and standard denaturing agarose gel
electrophoresis.
qRT-PCR validation assay for target
miRNAs
Total RNA was isolated and abstracted using TRIzol.
Random primer 10 µmol/l was added to total RNA (1 µg)
from samples, then diethylpyrocarbonate was blended for 10 min,
finally, reverse transcription reaction liquids (5X RT reaction
buffer 5 µl, dNTP 1 mmol/l, RNase inhibitor 1 U/µl,
M-MLV RTase 8 U/µl, diethylpyrocarbonate 4 µl) were
added for 1 h to obtain reverse transcription products. SYBR-Green
I was used to obtain quantitative RT-PCR according to
manufacturer's instructions, relative expression levels were
calculated by subtracting the average U6 (internal control) Ct from
the Ct of the target gene obtained from the same cDNA and applying
the formula 2−ΔΔCt. All samples were in triplicate. The
primers used by Primer 5.0 ABI Prism 7900 system are listed in
Table I. A 2X qRT-PCR reaction mix
8 µl (2X Master mix 5 µl, PCR sequence specific
primer F 0.5 µl, PCR sequence specific primer R 0.5
µl) was added to holes corresponding to 384-PCR plate, then
corresponding 2 µl cDNA was added. Three-step program was
used for the PCR reaction, after the reaction, analysis of melting
curves was performed.
 | Table IThe primers used for qRT-PCR. |
Table I
The primers used for qRT-PCR.
| Gene name | RT two-way
primer | Annealing
temperature (°C) | Length of products
(bp) |
|---|
| U6 | F:
5′GCTTCGGCAGCACATATACTAAAAT3′ | 60 | 89 |
| R:
5′CGCTTCACGAATTTGCGTGTCAT3′ |
| hsa-miR-429 | GSP:
5′GGGGGTAATACTGTCTGGT3′ | 60 | 64 |
| R:
5′TGCGTGTCGTGGAGTC3′ |
|
hsa-miR-200a-5p | GSP:
5′GGGCATCTTACCGGACAG3′ | 60 | 65 |
| R:
5′CAGTGCGTGTCGTGGAGT3′ |
| hsa-miR-185-5p | GSP:
5′GGTGGAGAGAAAGGCAGT3′ | 60 | 59 |
| R:
5′TGCGTGTCGTGGAGTC3′ |
| hsa-miR-29c-3p | GSP:
5′GGGGTAGCACCATTTGAA3′ | 60 | 66 |
| R:
5′CAGTGCGTGTCGTGGAG3′ |
| hsa-miR-1237 | GSP:
5′GGGTCCTTCTGCTCCGTC3′ | 60 | 62 |
| R:
5′GTGCGTGTCGTGGAGTCG3′ |
| hsa-miR-625-3p | GSP:
5′GCGGCAGACTATAGAACTTT3′ | 60 | 68 |
| R:
5′CAGTGCGTGTCGTGGA3′ |
| hsa-miR-497-5p | GSP:
5′GGGCAGCAGCACACTGT3′ | 60 | 64 |
| R:
5′CAGTGCGTGTCGTGGAGT3′ |
Statistic analysis
All data analysis was performed by SPSS 17.0
software. The RT-PCR results are presented as the mean ± SEM.
One-way ANOVA analysis was used to accomplish the comparison among
three groups, if the data were normal distribution, otherwise,
non-parametric test was performed. Significant level α was 0.05,
and P-values <0.05 were considered to be statistically
significant. All experiments were independently performed a
triplicate.
Results
Histologically varied tissue structures
are present in different tissue samples
Normal tissue structure, an important element of
microenvironment, is responsible for stabilization of internal
milieu. Stable tissue microenvironment exactly mediates generation
and release of growth signaling responsible for cell proliferation
and differentiation to sustain architecture and function of normal
tissue (16). Alteration of tissue
architecture and homeostasis is an early signal initiating
carcinogenesis (17,18). As for large intestine, crypts are
structurally fundamental element of epithelial tissues and
functionally basic unit for performing the above biological
activities. In this context, we explored biological characteristics
during colorectal cancerization on the basis of the crypt. To
obtain histologically legible stucture, we performed HE staining.
As shown in Fig. 1B, regular crypt
structure is shown in no. 1, lumens of gland and monolayer cell
nuclei in crypt were normal in dimension. However, crypt structure
in no. 2 presented irregular shapes showing bigger and zigzag
lumens of gland, and elongated cell nuclei with crowded and
multilayer arrangement, hence, these crypts are called aberrant
crypt foci (ACF) which is consist of a certain number of
accumulated aberrant crypts with or without atypical hyperplasia
(19). Significantly enlarged
crypts in dimension are demonstrated in no. 3 whose closest
distance to the CRC lesions is about 2.0 cm, the aberrant crypts
revealed that these nuclei were larger than those of normal cells,
the arrangement of the cells was more crowded and multilayered, and
polarity of cells had disappeared, which suggest that
histologically dramatic alteration appears in colorectal mucosa in
the process of canceration.
Changed biological hallmarks exist in
different tissues
Tumor microenvironment (TME), a contributor of
carcinogenesis, includes not only tumor tissues within TME, but
also other tissues and stoma cells and large groups of cytokines
produced by the cells. Therefore, in addtion to the exploration of
histological alteration in colon epithelium, study of several
stroma cells within tissue microenvironment was also performed by
our group.
Cyclin D1 (CD1), a marker of tumor cells and a
mediator of cell cycle, can regulate transformation of G1/S phase.
However, excessive cell division can be caused by overexpressed CD1
through regulation of cell cycle resulting in uncontrolled cell
growth, leading to formation of neoplasm. Thus, many studies have
demonstrated CD1 overexpression in various forms of cancer
(20–22). CD133, a member of cytomembrane
protein superfamily, is deemed as a marker of tumor stem cells of
CRC (23,24). Increasing tumor cells and stem cells
during colorectal cancerization can be presented by the expression
of CD1 and CD133. Cytoskeleton, a kind of dominant tissue
structure, is responsible for supporting cell stucture and
accommodating components in cells, and associated with cell
behavior, signal pathway, and apoptosis (25), and alteration of cytoskeleton can
directly contribute to oncogenesis. Cytokeratin 18 (CK18), a
component of epithelial cytoskeleton, served as a specific
biomarker for the epithelium (26).
Vimentin, a kind of intermediate filament, is also an important
epithelial cytoskeleton taking part in various biological functions
including cell growth, differentiation, signal transduction, and
regulation of interaction between cytoskeleton proteins and cell
adhesion molecules (27). In
addition, its expression is located in mesenchyme and hence acted
as marker of fibroblasts. Therefore, CD133, CD1, CK18, and vimentin
were selected in our study.
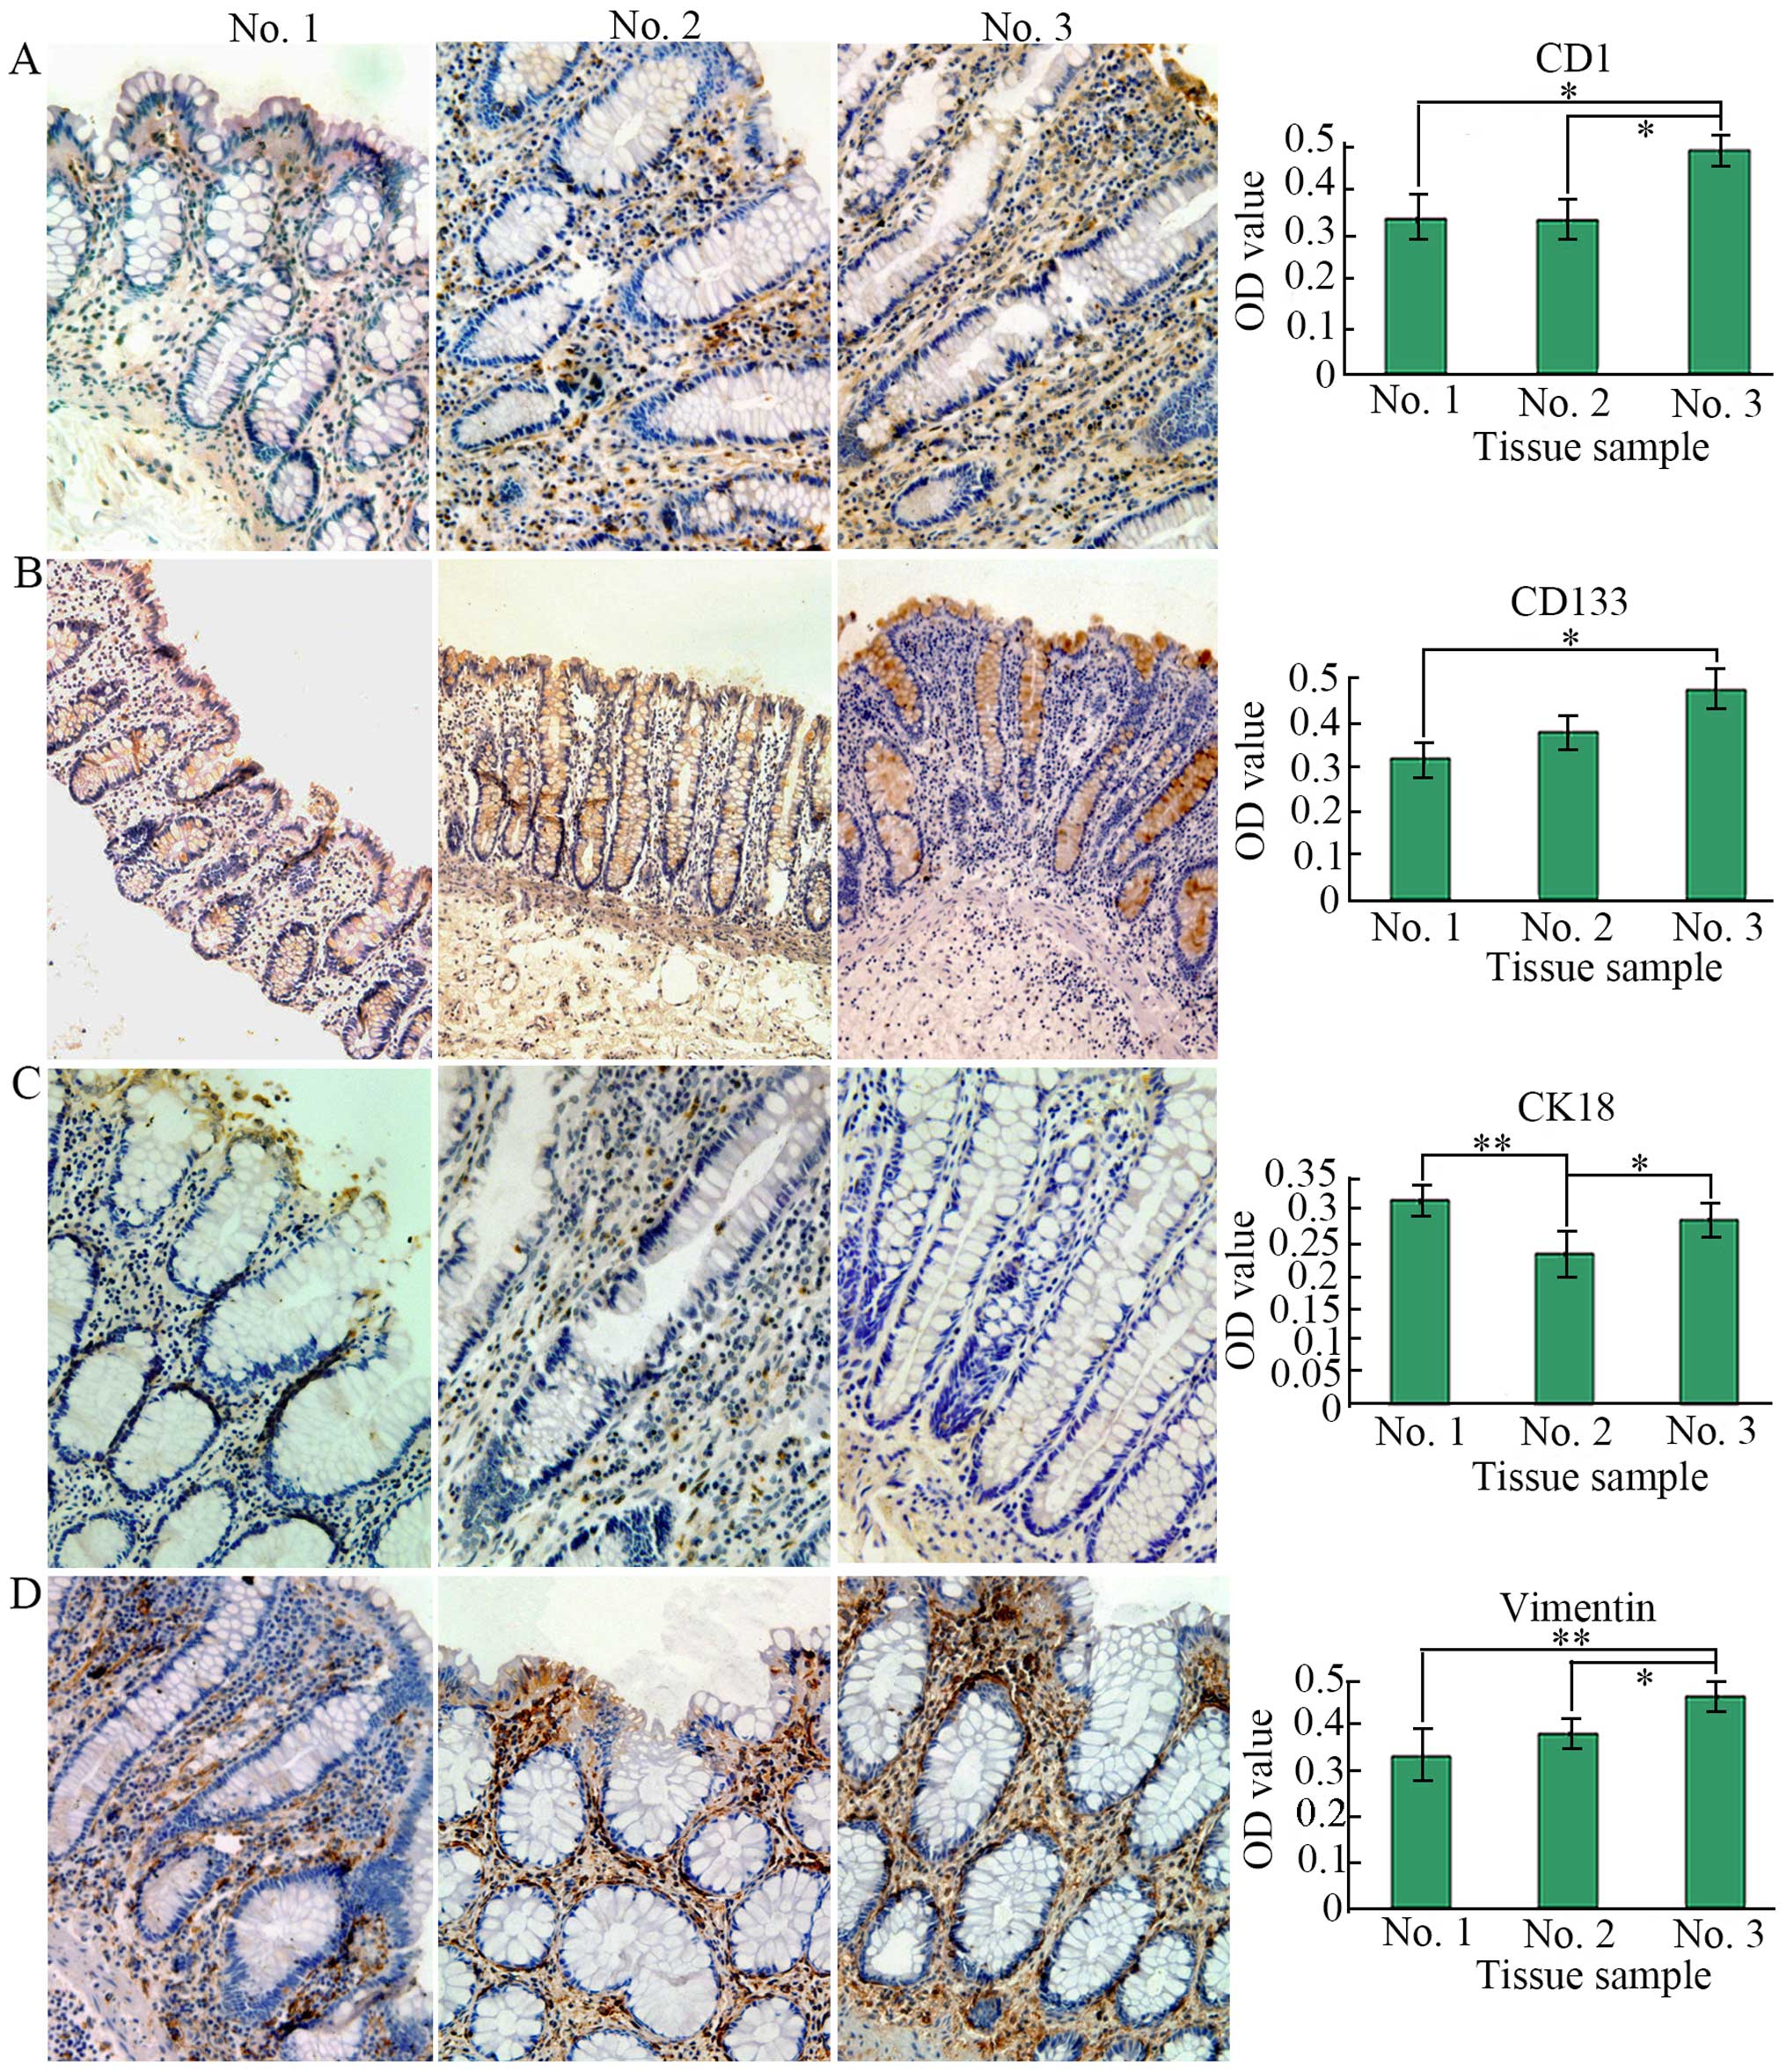
To analyze the expression level of the four
biological makers, we performed IHC staining. In this study, as
shown in Fig. 2, we found that the
expression of these markers was dysregulated, for instance, CK18
had a high expression in no. 1 whose microenvironment may be
normal, namely, its expression was higher than that of no. 2
(P<0.01) and no. 3 (P>0.05), showing alteration of
cytokeleton in no. 3, while its corresponding mesenchymal marker
vimentin revealed a low expression in no. 1, but its upregulation
was found in no. 3 and in mesenchyme of crypts whose
microenvironment is likely to be abnormal and tumorigenic
responsible for colorectal carcinogenesis, thus leading to high
expression of CD133 and CD1 which were higher than that of no. 1
(P<0.05). CD133 expression was mainly in the interior of crypts
instead of the mesenchyme. On the contrary, CD1 expression was
mainly in mesenchyme between crypts instead of in crypts. Hence,
the results demonstrated increased tumor stem cells and their more
extensive distribution. Besides, no. 2 represents a kind of
transitional tissue which is between normal and cancerous, hence
presenting an inconclusive variation.
Expression of DNMTs is significantly
upregulated in para-carcinoma tissues
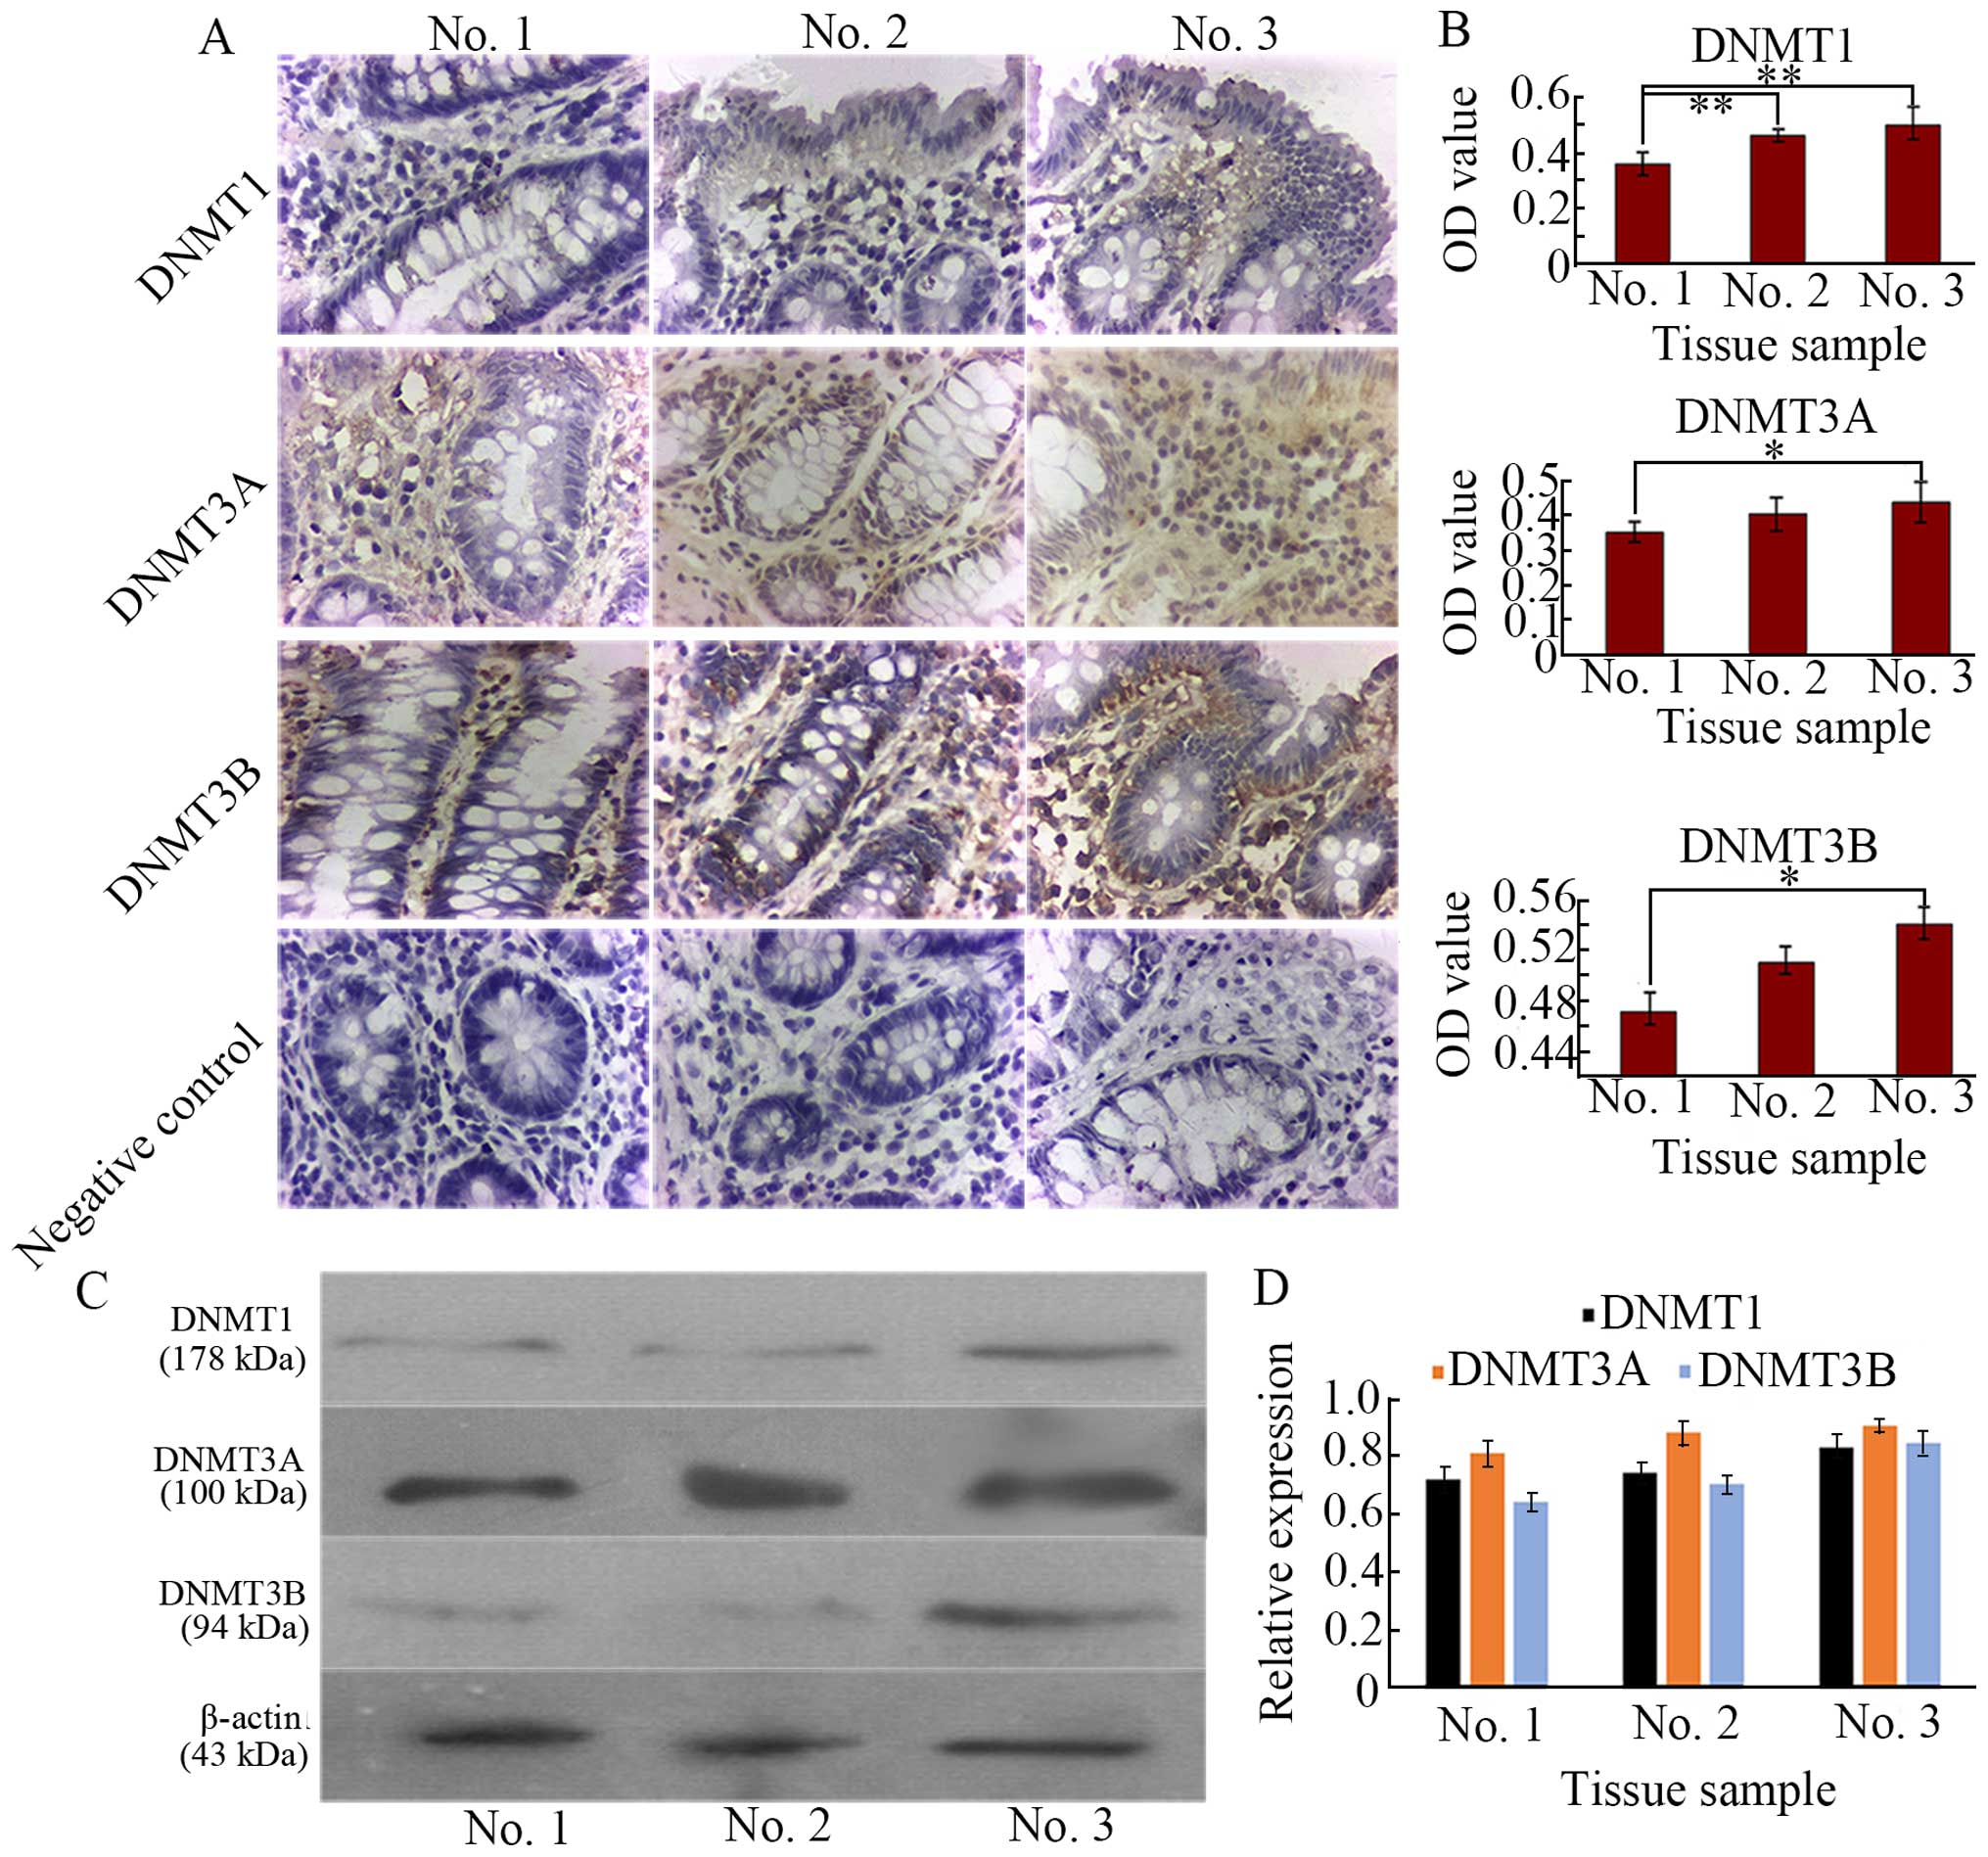
To examine DNMT expression under different tissue
microenvironment, we respectively carried out IHC staining and
western blotting for protein quantification. Our results, as
demonstrated in Fig. 3A, revealed
that expression of DNMT1, DNMT3A, and DNMT3B was mainly found in
aberrant tissues (no. 3), and weak staining was observed in normal
tissue (no. 1), implying that alteration of DNA methylation existed
in the aberrant tissues leading to abnormal DNA methylation within
the promoter regions of genes, consequently, inactivated tumor
suppressor gene (TSG) or other related genes including CK18 and
reactiveted oncogenes including CD1, vimentin, and CD133 in tumor
cells are caused, which are considered to be the most well-defined
epigenetic signature in cancer (28,29).
All negative controls revealed negligible background staining.
These DNMT levels were significantly higher compared with those in
the no. 1 (P<0.05) shown by OD value (Fig. 3B). The higher the degree of
dysplasia, the higher the expression level of DNMTs, DNMT1
expression mainly existed in mesenchyme between crypts, but in no.
2, its expression was more and located in both mesenchyme and
crypts. High expressed DNMT3A in no. 2 and no. 3 was mainly in
mesenchyme, while high DNMT3B expression was in both mesenchyme and
crypts (Fig. 3A). To further
acquire protein quantification, western blotting demonstrated by
Fig. 3C and D revealed the
expression profile of the DNMTs similar to IHC results. Substantial
research has shown that DNA methylation appears in the cancerous
and para-cancerous tissues (30),
these data are in agreement with our present study.
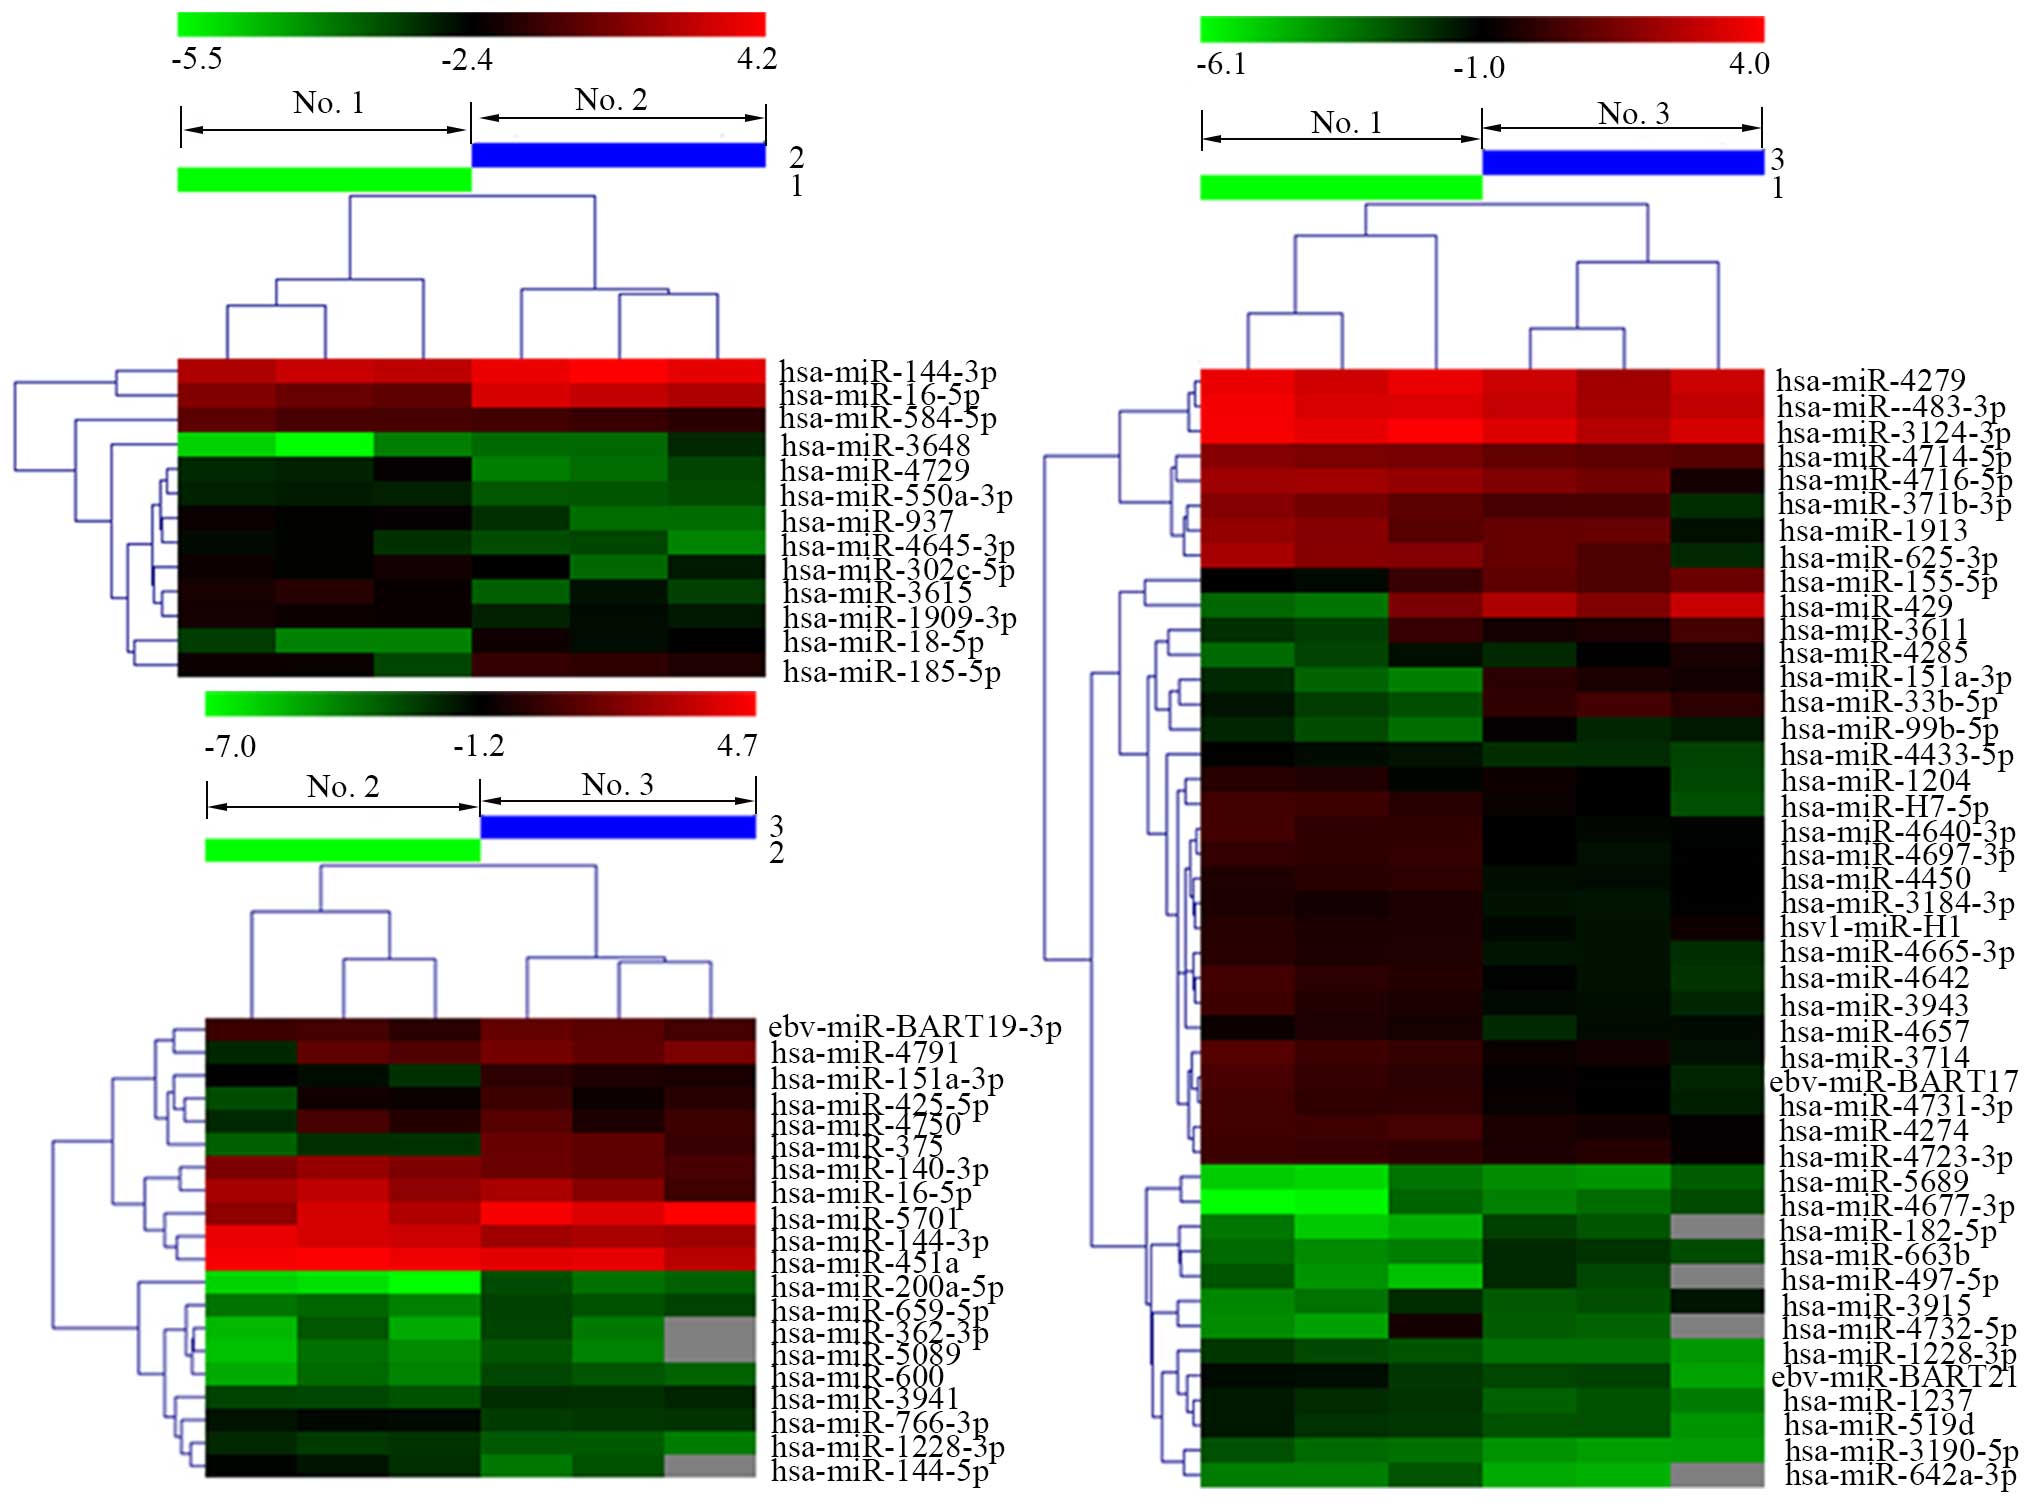
Distinguishable miRNA expression
profiling in tissue samples
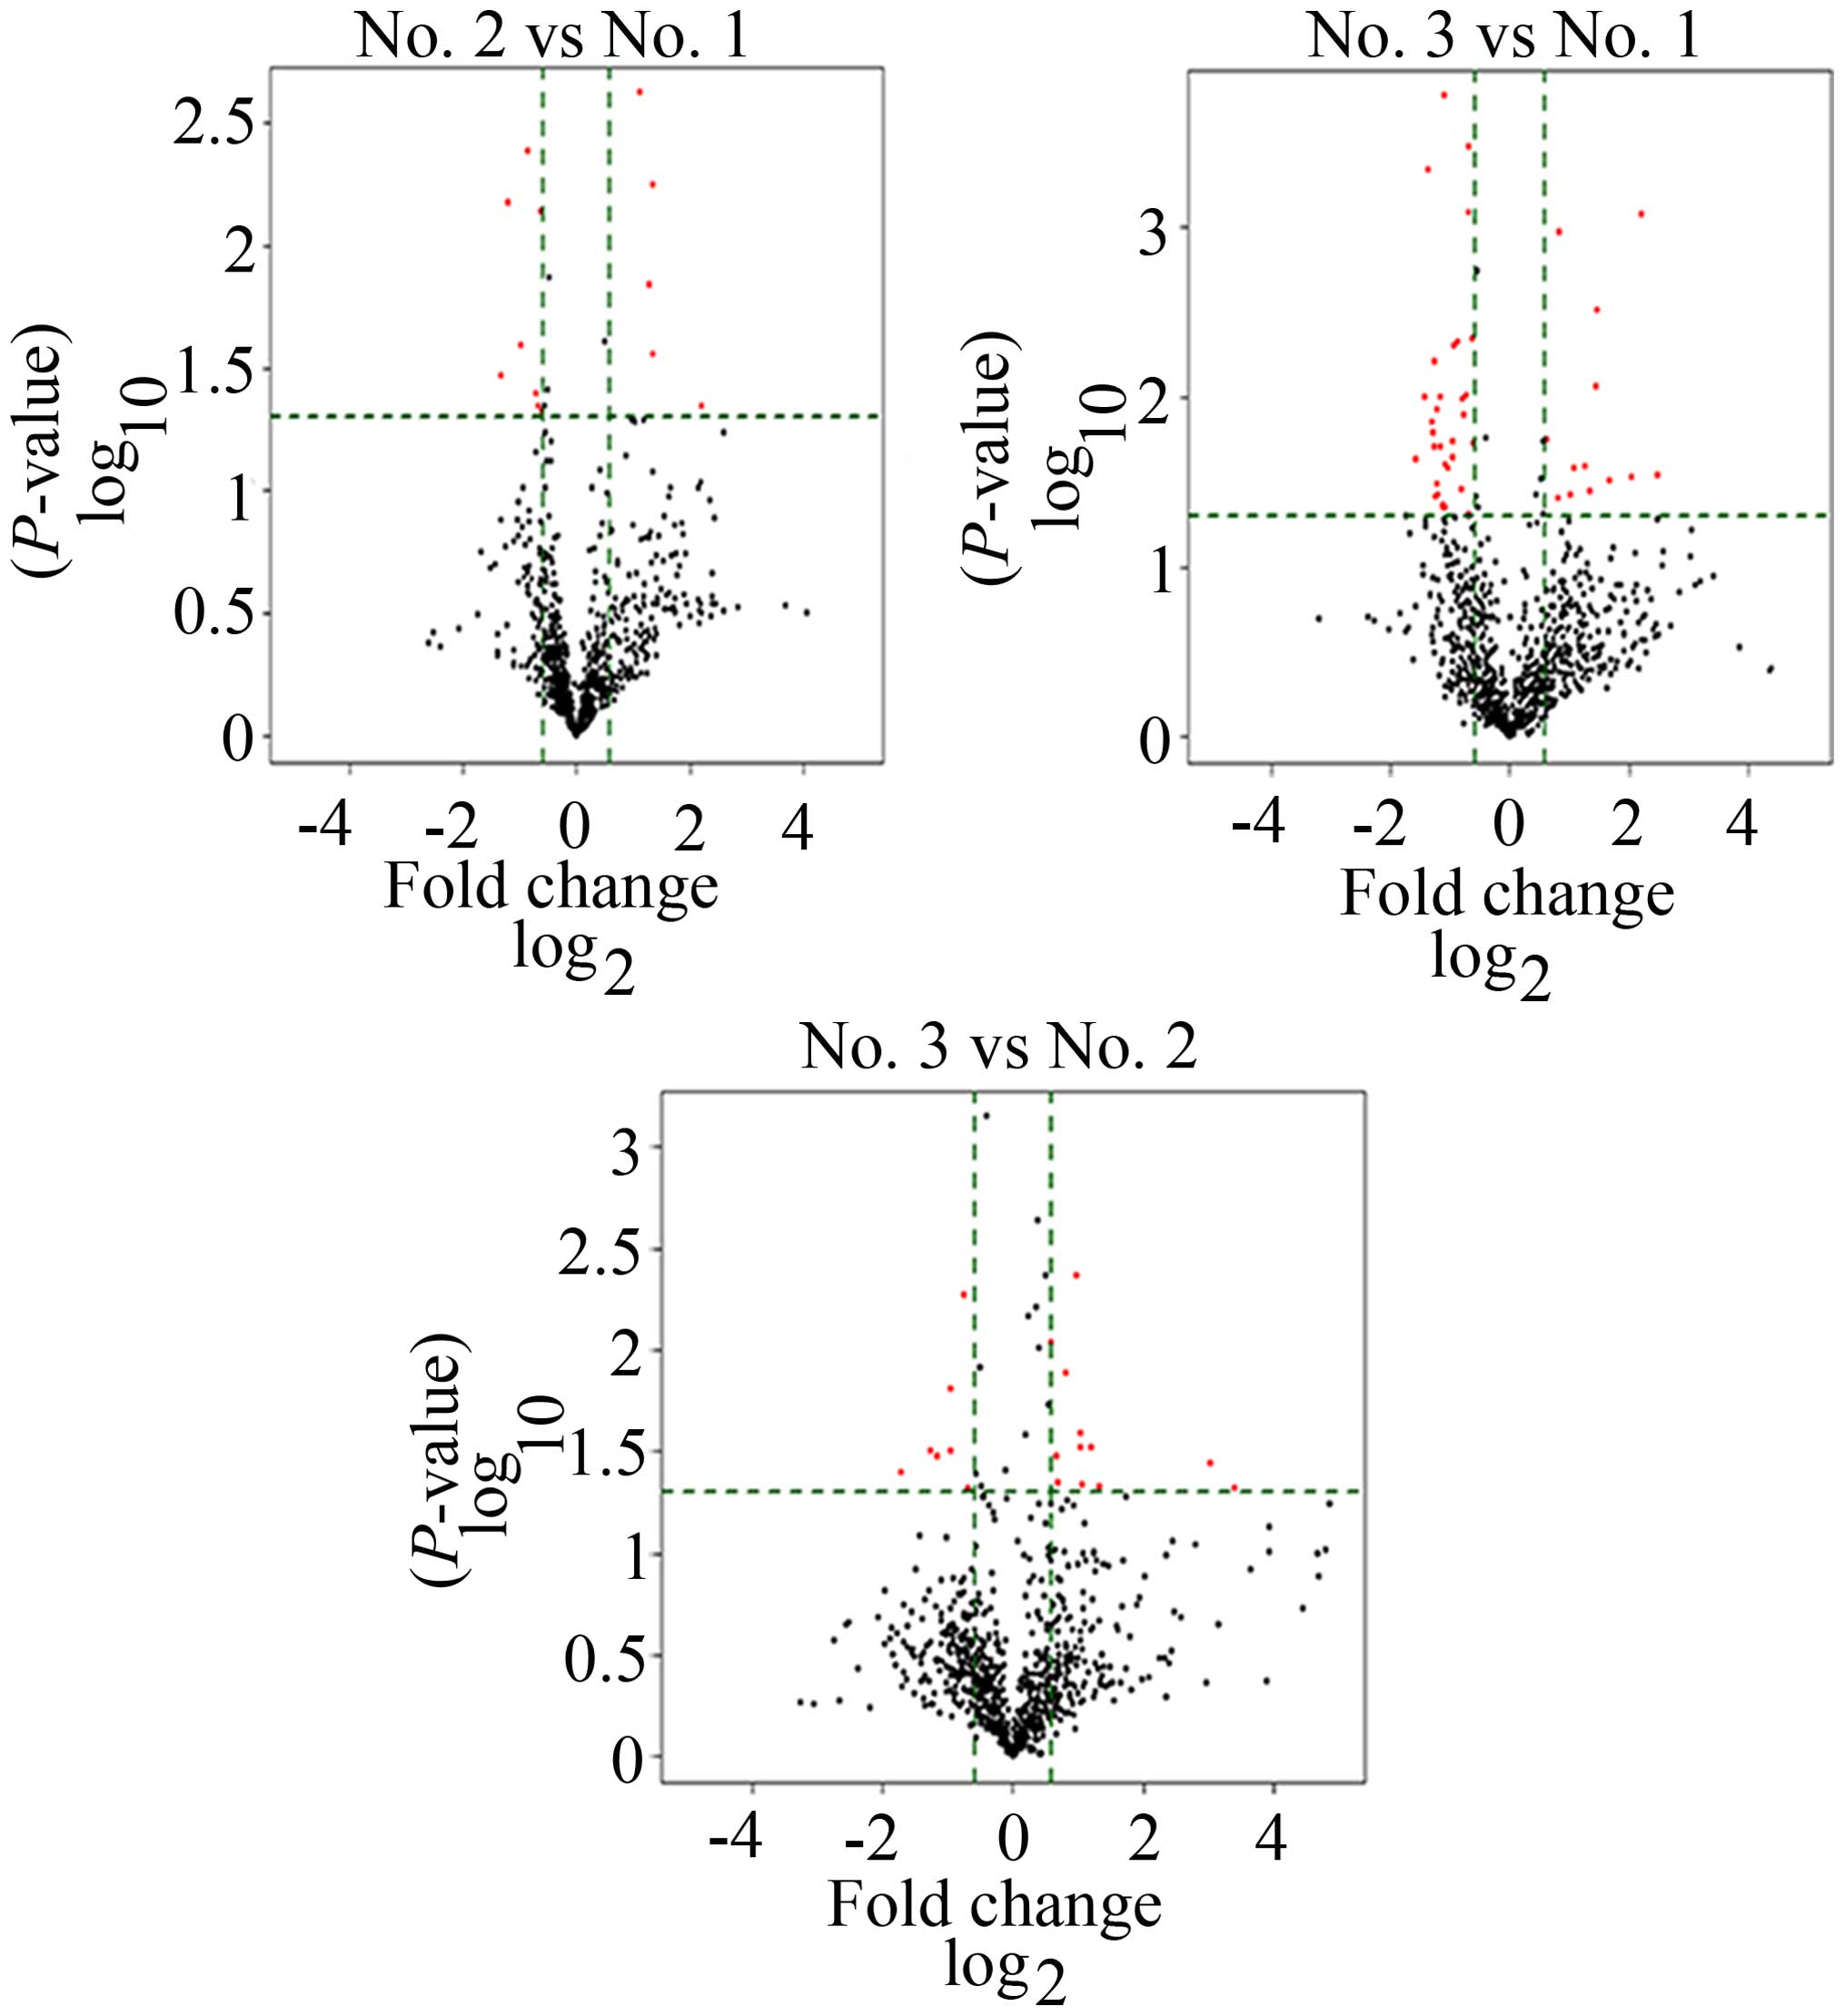
To screen differentially significantly expressed
miRNAs in no. 1, no. 2 and no. 3, we performed a miRNA microarray.
After volcano plot filtering (Fig.
4), the differentially significant miRNAs were displayed. As
shown in Fig. 5, no. 2 vs. no. 1,
13 miRNAs were filtered, among them, 5 miRNAs were upregulated, 8
miRNAs were downregulated. No. 3 vs. no. 1, 45 miRNAs were
differently expressed, 13 miRNAs were upregulated, 32 miRNAs were
downregulated. No. 3 vs. no. 2, 13 miRNAs were upregulated, 7
miRNAs were downregulated. Previous studies have discovered that
the degree of epigenetic difference between cancer cells and normal
cells was considerably higher than that of normal cells with
different phenotypes and even different germ cells, such as
fibroblasts and epithelial cells (2). In this study, we found a cluster of
upregulated and downregulated miRNAs in no. 2 and no. 3 tissues
compared to no. 1 with normal microenvironment, implying
differences of DNA methylation pattern in different tissues. These
results reveal that cancer cells are different from normal cells in
epigenetics, consistent with the previous studies. In addition,
complexity and frequency of epigenetic alterations observed in
cancer cells appear to be able to overturn the explanation that
epigenetic alterations rely on single event (2), on the contrary, these pathological
alterations may be caused by multiple mechanisms. Our results
included in total 78 dramatically expressed miRNAs, and many
upregulated or downregulated miRNAs also emerged in the same
tissues, implying that some co-regulatory mechanisms may exist
between different miRNAs or the same miRNAs may be co-regulated by
several distinctive mechanisms.
Screening miRNAs targeting DNMTs and
qRT-PCR validation of the target miRNAs
Four main DNMT isoforms are present in mammalian
cells. DNMT1, the maintenance methyltransferase, is responsible for
the conservation of methyl marks during DNA replication, while,
DNMT3A and DNMT3B are contributed mainly to de novo DNA
methylation, DNMT1, the catalytically inactive isoform, has a
synergy with DNMT3A and DNMT3B (31), although a study appears to disagree
with this rigid classification (32). These DNMTs play an important role in
DNA methylation pattern of cellular processes, for example,
differentiation of stem cells during embryonic development
(33,34). However, abnormal DNA methylation
profile caused by DNMT mutations or overexpression is likely to be
an early epigenetic event during oncogenesis (33). Other epigenetic regulators including
miRNAs are also involved in aberrant mediation of DNA methylation
profile, and their combination participates in tumor transformation
(35–38). Our results found the aberrant
changes of DNMTs in the precancerous lesions of CRC, revealing
abnormal accumulation of methylated DNA.
To determine the miRNAs targeting DNMTs, we adopted
predictive information from the following three databases, mirbase,
miranda and targetscan (http://www.ebi.ac.uk/enright-srv/microcosm/htdocs/targets/v5/,
http://www.microrna.org/microrna/home.do, http://mir-db.org/miRDB/), and overlapping parts of
the three predictive results served as the final result prediction.
As a result, three target miRNAs were screened by the database, and
other three target miRNAs were obtained through previous
literature. Finally, six target miRNAs including hsa-miR-185-5p,
hsa-miR-1237, hsa-miR-429, hsa-miR-200a-5p, hsa-miR-497-5p, and
hsa-miR-625-3p were selected. These miRNAs target DNMT1, DNMT3A,
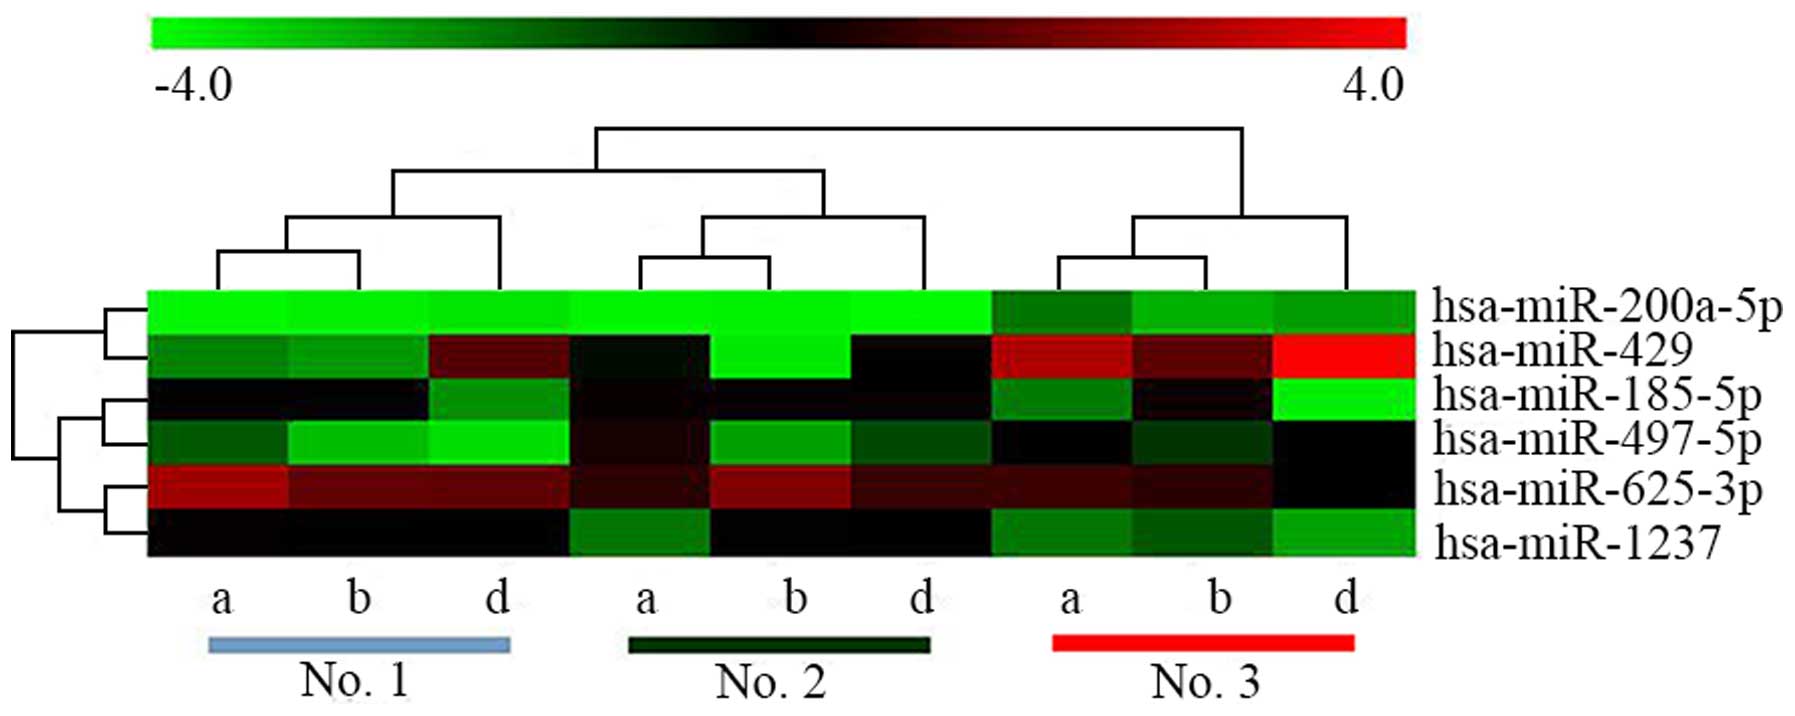
and DNMT3B (as shown in Table II).
Because of better sample clustering after removing c and e (c and e
represent number of each sample), hierarchical clustering of six
target miRNAs for 3 samples of every location was performed
(Fig. 6). As shown in Fig. 6 and Table II, expression level of
hsa-miR-200a-5p and hsa-miR-429 in no. 3 was higher than that of
no. 1 and no. 2 (P-value of hsa-miR-429 <0.05), indicating that
low expressed DNA methylation profile probably participates in the
formation of certain oncology mechanisms. For example, global DNA
hypomethylation mainly occurs in dinucleotide of cytosine guanine
(CpG) within mobility and repetitive genome components, including
satellite DNA sequence (pericentromeric regions), repetitive
sequence of long interspersed nuclear element (LINE) and
retrotransposon (39).
Hypomethylation profile results in destruction of normal
dinucleotide sequence and damage of chromosome stability through
accumulating chromosome damage and inducing the reactivation of
previously silenced genetic elements (retrotransposon), leading to
the formation of various forms of cancer (40). A study has reported that miR-429 can
target phosphatase and tensin homolog (PTEN) in endometrial cancer
as a TSG and contribute to oncogenesis (41). Furthermore, in addition to genomic
instability resulted from DNA hypomethylation, positive
transcriptional regulation of proto-oncogenes is also a stimulative
process of tumor initiation (42,43).
Recently, studies have found that mutation of TSG adenomatous
polyposis coli (APC) is a driving event in initiation of coloretal
cancer and seems to control expression and activity of DNMTs, then
leading to demethylation of numerous genes and forcing intestinal
epithelial cells to maintain a undifferentiated and progenitor-like
status (44). Similar to APC
mutation, whether the aberrant miRNAs observed in our study are
involved in this mechanism needs to be thoroughly investigated in
the future.
| Table IIAverage 2−∆∆Ct of 6 target
miRNAs. |
Table II
Average 2−∆∆Ct of 6 target
miRNAs.
| Genes (DNMTs
targeted) | Tissue samples
|
|---|
| No. 1 | No. 2 | No. 3 |
|---|
| hsa-miR-185-5p
(DNMT1) | 0.893±0.298 | 2.310±0.259 | 0.848±0.146 |
| hsa-miR-200a-5p
(DNMT3B) | 1.147±0.1934 | 1.272±0.0769 | 2.301± 1.0458 |
| hsa-miR-429
(DNMT3A) | 1.104±0.162 | 0.151±0.014b | 2.241±0.211 |
| hsa-miR-497-5p
(DNMT3B) | 0.611±0.114a | 1.486±0.101 | 0.966±0.082 |
| hsa-miR-625-3p
(DNMT3B) | 0.513±0.141 | 0.339±0.115 | 0.125±0.009 |
| hsa-miR-1237
(DNMT3A) | 0.647±0.103 | 0.348±0.039 | 0.314±0.022 |
| U6 (internal
control) | 12.479±0.112 | 12.605±0.161 | 12.209±0.256 |
Furthermore, DNMTs mediated by miRNAs play an
important role in hypermethylation of CpG islands. Downregulated
hsa-miR-185-5p, hsa-miR-497-5p, hsa-miR-625-3p and hsa-miR-1237
were observed in no. 3 tissue, implying increased level of DNMTs.
These results suggest that CpG islands have an inclination to
hypermethylation, because CpG islands of colon epithelial cells are
not methylated under normal conditions (35,45),
therefore, CpG island methylation pattern in tissue cells with
inclination to canceration have altered. For example, the
expression levels of hsa-miR-625-3p and hsa-miR-1237 had a
decreasing tendency from normal tissues to precancerous lesions,
although their difference was not statistically significant. While
the expression levels of hsa-miR-185-5p and hsa-miR-497-5p of no. 2
location were more than that of no. 1 (hsa-miR-185-5p had no
statistical difference), implying that possibly some mechanisms are
involved in these changes where miR-185-5p and miR-497-5p of no. 2
tissue were upregulated.
Discussion
Under general conditions, clinical and pathological
studies have found that direct infiltration range of colon cancer
along the distance at both ends is no more than 2 cm, while the
distance that lymph nodes around the colon can spread bilaterally
exceeds 8 cm. In our samples, the distance of no. 1 to CRC lesions
is more than 10 cm. The no. 1 deemed as safe location of surgery
resection is regarded as normal tissue. On the contrary, the
distance of no. 3 from CRC lesions is no more than 2 cm, which is
regarded as para-carcinoma tissue. Tissue of no. 2 is between no. 1
and no. 3.
Accumulating evidence suggests that neoplasms are
complex tissues consisted of multiple different cell types
participating in heterotypic interactions with one another. During
the past decade, an emerging notion that the contributions of the
TME to carcinogenesis must be considered in the biology of
neoplasms (16), revealing an
important role of local tissue microenvironment involving in the
formation of tumor-associated stroma in tumorigenesis. To date,
several studies have found that altered tissue microenvironment has
an effect on colorectal carcinogenesis, and epigenetic changes
function as a key player in cellular response to the alteration of
microenvironment (46–48), which are consistent with our results
revealing the histologically altered morphologies of tissues with
different distance to CRC lesions, loss of normal crypts and
existence of many ACF in no. 3, however, tissues no. 2 have shown
inclination to canceration under altered microenvironment.
Abundance of oncogene CD1 and CD133 expression appears in no. 3
where the aberrant tissue structures are formed, indicating the
establishment of tumor-associated microenvironment which provides
support and shield for growth of tumor cells (49). On the contrary, our data revealed
that significantly decreased CK18 expression and increased vimentin
expression were found in no. 3, indicating an emergence of altered
cytoskeleton in the process of colorectal cancerization, which is
in agreement with the epithelial-mesenchymal transition (EMT)
defined by Thompson et al (50).
Epigenetic alterations in cancer are mediated by
complex network of co-factors, such as DNA methylases, histone
modification enzymes and non-coding RNAs (51). DNA methylation can fight against
activation of reverse transcription transposon and promote
stability of chromosomes and then become genome guardian (33). Functional DNA methylation patterns
in normal cells are frequently in disorder, presenting global
genome hypomethylation and local hypermethylation of TSGs. Global
hypomethylation is associated with genome instability, including
probable onco-gene activation, while hypomethylation of promoter
will often lead to the aberrant silence of TSGs (52). Chromatin structure changes with
global hypomethylation will result in increased instability of
genome, which can be a key motivator of colon canceration (53). For example, the decreased
methylation levels of microsatellite DNA sequences [simple sequence
repeats (SSRs)] easily lead to gene mutation, which has been
validated in many tumor models (52). Previous studies have shown that
aberrant DNA methylation and miRNA alteration may play a vital role
in different steps of cancer formation (54). Therefore, our study explored
expression of DNMT and miRNA profiling in colon tissues with
different location, and assessed the relative levels of miRNAs
targeting corresponding DNMTs by quantitative real-time PCR. In our
study, the downregulation of hsa-miR-185-5p, hsa-miR-497-5p,
hsa-miR-625-3p and hsa-miR-1237 in canceration tissues (no. 3)
suggests that aberrant DNMT expression has led to DNA
hypermethylation pattern demonstrated by high expressed DNMT1,
DNMT3A, and DNMT3B in no. 3 (Fig.
3), which is likely to prompt increased instability of
chromosome structure and overexpression of some oncogenes. The
difference of miRNA profiling in the different phases of colorectal
canceration reveals that oncogenesis is not a molecular event but a
sequential process involving a number of genes and signal
molecules. Furthermore, two or more miRNAs may take part in the
canceration process at the same time. For example, hsa-miR-200a-5p
and hsa-miR-429 present upregulated tendency from no. 1 to no. 3,
although the difference of miR-200a-5p has no statistical
significance, showing a viewpoint that they have a synergistic
function during colorectal carcinogenesis.
In conclusion, the results presented for the first
time show histological alteration in different colorectal tissue
microenvironment using colorectal tissue samples with diverse
distance from CRC lesions. Besides, highly expressed DNMT1, DNMT3A,
DNMT3B and distinguishable miRNA expression profiling in cancerous
tissues compared with the histopathologically unchanged indicated
the pivotal function of DNA methylation and miRNAs in initiation of
CRC under altered tissue microenvironment. Although DNA methylation
level and miRNAs are considered as a single biomarker for early
cancer detection, other epigenetic biomarkers, such as histone
modifications, circulating cell-free DNA and long non-coding RNA,
may have more potential. A panel of DNA methylations of miRNAs,
epigenetic hallmarks, can have potential in the early detection of
CRC and screening patients with high risk factors.
Acknowledgments
This study was supported by the National Science
Foundation of China (no. 81173257).
References
|
1
|
Jemal A, Bray F, Center MM, Ferlay J, Ward
E and Forman D: Global cancer statistics. CA Cancer J Clin.
61:69–90. 2011. View Article : Google Scholar : PubMed/NCBI
|
|
2
|
Dawson MA and Kouzarides T: Cancer
epigenetics: From mechanism to therapy. Cell. 150:12–27. 2012.
View Article : Google Scholar : PubMed/NCBI
|
|
3
|
Migheli F and Migliore L: Epigenetics of
colorectal cancer. Clin Genet. 81:312–318. 2012. View Article : Google Scholar : PubMed/NCBI
|
|
4
|
Feinberg AP and Tycko B: The history of
cancer epigenetics. Nat Rev Cancer. 4:143–153. 2004. View Article : Google Scholar : PubMed/NCBI
|
|
5
|
Sahnane N, Magnoli F, Bernasconi B,
Tibiletti MG, Romualdi C, Pedroni M, Ponz de Leon M, Magnani G,
Reggiani-Bonetti L, Bertario L, et al: AIFEG: Aberrant DNA
methylation profiles of inherited and sporadic colorectal cancer.
Clin Epigenetics. 7:1312015. View Article : Google Scholar
|
|
6
|
Baylin SB, Herman JG, Graff JR, Vertino PM
and Issa JP: Alterations in DNA methylation: A fundamental aspect
of neoplasia. Adv Cancer Res. 72:141–196. 1998. View Article : Google Scholar
|
|
7
|
Robertson KD, Uzvolgyi E, Liang G,
Talmadge C, Sumegi J, Gonzales FA and Jones PA: The human DNA
methyltransferases (DNMTs) 1, 3a and 3b: Coordinate mRNA expression
in normal tissues and overexpression in tumors. Nucleic Acids Res.
27:2291–2298. 1999. View Article : Google Scholar : PubMed/NCBI
|
|
8
|
Stefani G and Slack FJ: Small non-coding
RNAs in animal development. Nat Rev Mol Cell Biol. 9:219–230. 2008.
View Article : Google Scholar : PubMed/NCBI
|
|
9
|
Hwang HW and Mendell JT: MicroRNAs in cell
proliferation, cell death, and tumorigenesis. Br J Cancer.
94:776–780. 2006. View Article : Google Scholar : PubMed/NCBI
|
|
10
|
Rangel-Salazar R, Wickström-Lindholm M,
Aguilar-Salinas CA, Alvarado-Caudillo Y, Døssing KB, Esteller M,
Labourier E, Lund G, Nielsen FC, Rodríguez-Ríos D, et al: Human
native lipoprotein-induced de novo DNA methylation is associated
with repression of inflammatory genes in THP-1 macrophages. BMC
Genomics. 12:5822011. View Article : Google Scholar : PubMed/NCBI
|
|
11
|
Mori Y, Ishiguro H, Kuwabara Y, Kimura M,
Mitsui A, Ogawa R, Katada T, Harata K, Tanaka T, Shiozaki M, et al:
MicroRNA-21 induces cell proliferation and invasion in esophageal
squamous cell carcinoma. Mol Med Rep. 2:235–239. 2009.PubMed/NCBI
|
|
12
|
Iorio MV, Ferracin M, Liu CG, Veronese A,
Spizzo R, Sabbioni S, Magri E, Pedriali M, Fabbri M, Campiglio M,
et al: MicroRNA gene expression deregulation in human breast
cancer. Cancer Res. 65:7065–7070. 2005. View Article : Google Scholar : PubMed/NCBI
|
|
13
|
Song YX, Yue ZY, Wang ZN, Xu YY, Luo Y, Xu
HM, Zhang X, Jiang L, Xing CZ and Zhang Y: MicroRNA-148b is
frequently down-regulated in gastric cancer and acts as a tumor
suppressor by inhibiting cell proliferation. Mol Cancer. 10:12011.
View Article : Google Scholar : PubMed/NCBI
|
|
14
|
Matsubara N: Epigenetic regulation and
colorectal cancer. Dis Colon Rectum. 55:96–104. 2012. View Article : Google Scholar
|
|
15
|
Wu WK, Law PT, Lee CW, Cho CH, Fan D, Wu
K, Yu J and Sung JJ: MicroRNA in colorectal cancer: From benchtop
to bedside. Carcinogenesis. 32:247–253. 2011. View Article : Google Scholar
|
|
16
|
Hanahan D and Weinberg RA: Hallmarks of
cancer: The next generation. Cell. 144:646–674. 2011. View Article : Google Scholar : PubMed/NCBI
|
|
17
|
Egeblad M, Nakasone ES and Werb Z: Tumors
as organs: Complex tissues that interface with the entire organism.
Dev Cell. 18:884–901. 2010. View Article : Google Scholar : PubMed/NCBI
|
|
18
|
Weber CE and Kuo PC: The tumor
microenvironment. Surg Oncol. 21:172–177. 2012. View Article : Google Scholar
|
|
19
|
Paulsen JE, Namork E, Steffensen IL, Eide
TJ and Alexander J: Identification and quantification of aberrant
crypt foci in the colon of Min mice - a murine model of familial
adenomatous polyposis. Scand J Gastroenterol. 35:534–539. 2000.
View Article : Google Scholar : PubMed/NCBI
|
|
20
|
Serrano M, Hannon GJ and Beach D: A new
regulatory motif in cell-cycle control causing specific inhibition
of cyclin D/CDK4. Nature. 366:704–707. 1993. View Article : Google Scholar : PubMed/NCBI
|
|
21
|
Lin RJ, Lubpairee T, Liu KY, Anderson DW,
Durham S and Poh CF: Cyclin D1 overexpression is associated with
poor prognosis in oropharyngeal cancer. J Otolaryngol Head Neck
Surg. 42:232013. View Article : Google Scholar : PubMed/NCBI
|
|
22
|
Ren B, Li W, Yang Y and Wu S: The impact
of cyclin D1 overexpression on the prognosis of bladder cancer: A
meta-analysis. World J Surg Oncol. 12:552014. View Article : Google Scholar : PubMed/NCBI
|
|
23
|
O'Brien CA, Pollett A, Gallinger S and
Dick JE: A human colon cancer cell capable of initiating tumour
growth in immunodeficient mice. Nature. 445:106–110. 2007.
View Article : Google Scholar
|
|
24
|
Ricci-Vitiani L, Lombardi DG, Pilozzi E,
Biffoni M, Todaro M, Peschle C and De Maria R: Identification and
expansion of human colon-cancer-initiating cells. Nature.
445:111–115. 2007. View Article : Google Scholar
|
|
25
|
Snásel J, Shoeman R, Horejsí M,
Hrusková-Heidingsfeldová O, Sedlácek J, Ruml T and Pichová I:
Cleavage of vimentin by different retroviral proteases. Arch
Biochem Biophys. 377:241–245. 2000. View Article : Google Scholar : PubMed/NCBI
|
|
26
|
Hondo T, Kanaya T, Takakura I, Watanabe H,
Takahashi Y, Nagasawa Y, Terada S, Ohwada S, Watanabe K, Kitazawa
H, et al: Cytokeratin 18 is a specific marker of bovine intestinal
M cell. Am J Physiol Gastrointest Liver Physiol. 300:G442–G453.
2011. View Article : Google Scholar : PubMed/NCBI
|
|
27
|
Singh S, Sadacharan S, Su S, Belldegrun A,
Persad S and Singh G: Overexpression of vimentin: Role in the
invasive phenotype in an androgen-independent model of prostate
cancer. Cancer Res. 63:2306–2311. 2003.PubMed/NCBI
|
|
28
|
Previati M, Manfrini M, Galasso M,
Zerbinati C, Palatini J, Gasparini P and Volinia S: Next generation
analysis of breast cancer genomes for precision medicine. Cancer
Lett. 339:1–7. 2013. View Article : Google Scholar : PubMed/NCBI
|
|
29
|
Chen XY, He QY and Guo MZ: XAF1 is
frequently methylated in human esophageal cancer. World J
Gastroenterol. 18:2844–2849. 2012. View Article : Google Scholar : PubMed/NCBI
|
|
30
|
Cao XY, Ma HX, Shang YH, Jin MS, Kong F,
Jia ZF, Cao DH, Wang YP, Suo J and Jiang J: DNA methyltransferase3a
expression is an independent poor prognostic indicator in gastric
cancer. World J Gastroenterol. 20:8201–8208. 2014. View Article : Google Scholar : PubMed/NCBI
|
|
31
|
Seidel C, Florean C, Schnekenburger M,
Dicato M and Diederich M: Chromatin-modifying agents in anti-cancer
therapy. Biochimie. 94:2264–2279. 2012. View Article : Google Scholar : PubMed/NCBI
|
|
32
|
Walton EL, Francastel C and Velasco G:
Maintenance of DNA methylation: Dnmt3b joins the dance.
Epigenetics. 6:1373–1377. 2011. View Article : Google Scholar : PubMed/NCBI
|
|
33
|
Van Emburgh BO and Robertson KD:
Modulation of Dnmt3b function in vitro by interactions with Dnmt3L,
Dnmt3a and Dnmt3b splice variants. Nucleic Acids Res. 39:4984–5002.
2011. View Article : Google Scholar : PubMed/NCBI
|
|
34
|
Ooi SK, O'Donnell AH and Bestor TH:
Mammalian cytosine methylation at a glance. J Cell Sci.
122:2787–2791. 2009. View Article : Google Scholar : PubMed/NCBI
|
|
35
|
Schnekenburger M and Diederich M:
Epigenetics Offer New Horizons for Colorectal Cancer Prevention.
Curr Colorectal Cancer Rep. 8:66–81. 2012. View Article : Google Scholar : PubMed/NCBI
|
|
36
|
Florean C, Schnekenburger M, Grandjenette
C, Dicato M and Diederich M: Epigenomics of leukemia: From
mechanisms to therapeutic applications. Epigenomics. 3:581–609.
2011. View Article : Google Scholar : PubMed/NCBI
|
|
37
|
Kanai Y and Hirohashi S: Alterations of
DNA methylation associated with abnormalities of DNA
methyltransferases in human cancers during transition from a
precancerous to a malignant state. Carcinogenesis. 28:2434–2442.
2007. View Article : Google Scholar : PubMed/NCBI
|
|
38
|
Karius T, Schnekenburger M, Ghelfi J,
Walter J, Dicato M and Diederich M: Reversible epigenetic
fingerprint-mediated glutathione-S-transferase P1 gene silencing in
human leukemia cell lines. Biochem Pharmacol. 81:1329–1342. 2011.
View Article : Google Scholar : PubMed/NCBI
|
|
39
|
van Engeland M, Derks S, Smits KM, Meijer
GA and Herman JG: Colorectal cancer epigenetics: Complex
simplicity. J Clin Oncol. 29:1382–1391. 2011. View Article : Google Scholar : PubMed/NCBI
|
|
40
|
Vaiopoulos AG, Athanasoula KC and
Papavassiliou AG: Epigenetic modifications in colorectal cancer:
Molecular insights and therapeutic challenges. Biochim Biophys
Acta. 1842:971–980. 2014. View Article : Google Scholar : PubMed/NCBI
|
|
41
|
Yoneyama K, Ishibashi O, Kawase R, Kurose
K and Takeshita T: miR-200a, miR-200b and miR-429 are onco-miRs
that target the PTEN gene in endometrioid endometrial carcinoma.
Anticancer Res. 35:1401–1410. 2015.PubMed/NCBI
|
|
42
|
Roy S and Majumdar AP: Cancer stem cells
in colorectal cancer: genetic and epigenetic changes. J Stem Cell
Res Ther. (Suppl 7): pii: 10342.
|
|
43
|
Tost J: DNA methylation: An introduction
to the biology and the disease-associated changes of a promising
biomarker. Mol Biotechnol. 44:71–81. 2010. View Article : Google Scholar
|
|
44
|
Hammoud SS, Cairns BR and Jones DA:
Epigenetic regulation of colon cancer and intestinal stem cells.
Curr Opin Cell Biol. 25:177–183. 2013. View Article : Google Scholar : PubMed/NCBI
|
|
45
|
Choong MK and Tsafnat G: Genetic and
epigenetic biomarkers of colorectal cancer. Clin Gastroenterol
Hepatol. 10:9–15. 2012. View Article : Google Scholar
|
|
46
|
Mima K, Nishihara R, Qian ZR, Cao Y,
Sukawa Y, Nowak JA, Yang J, Dou R, Masugi Y, Song M, et al:
Fusobacterium nucleatum in colorectal carcinoma tissue and patient
prognosis. Gut. Aug 26–2015.Epub ahead of print. View Article : Google Scholar : PubMed/NCBI
|
|
47
|
Tahara T, Yamamoto E, Suzuki H, Maruyama
R, Chung W, Garriga J, Jelinek J, Yamano HO, Sugai T, An B, et al:
Fusobacterium in colonic flora and molecular features of colorectal
carcinoma. Cancer Res. 74:1311–1318. 2014. View Article : Google Scholar : PubMed/NCBI
|
|
48
|
Ogino S, Lochhead P, Chan AT, Nishihara R,
Cho E, Wolpin BM, Meyerhardt JA, Meissner A, Schernhammer ES, Fuchs
CS, et al: Molecular pathological epidemiology of epigenetics:
Emerging integrative science to analyze environment, host, and
disease. Mod Pathol. 26:465–484. 2013. View Article : Google Scholar : PubMed/NCBI
|
|
49
|
Potter JD: Morphogens, morphostats,
microarchitecture and malignancy. Nat Rev Cancer. 7:464–474. 2007.
View Article : Google Scholar : PubMed/NCBI
|
|
50
|
Thompson EW, Newgreen DF and Tarin D:
Carcinoma invasion and metastasis: A role for
epithelial-mesenchymal transition? Cancer Res. 65:5991–5995;
discussion 5995. 2005. View Article : Google Scholar : PubMed/NCBI
|
|
51
|
González-Ramírez I, Soto-Reyes E,
Sánchez-Pérez Y, Herrera LA and García-Cuellar C: Histones and long
non-coding RNAs: The new insights of epigenetic deregulation
involved in oral cancer. Oral Oncol. 50:691–695. 2014. View Article : Google Scholar : PubMed/NCBI
|
|
52
|
Robertson KD: DNA methylation and human
disease. Nat Rev Genet. 6:597–610. 2005. View Article : Google Scholar : PubMed/NCBI
|
|
53
|
Li J, Jin H and Wang X: Epigenetic
biomarkers: potential applications in gastrointestinal cancers.
ISRN Gastroenterology. 2014:4640152014. View Article : Google Scholar : PubMed/NCBI
|
|
54
|
Calin GA and Croce CM: MicroRNA signatures
in human cancers. Nat Rev Cancer. 6:857–866. 2006. View Article : Google Scholar : PubMed/NCBI
|