Introduction
Cachexia has two well-known features: weight loss
(mainly due to loss of skeletal muscle and body fat) and
inflammation. This syndrome is prevalent in cancer patients, and
muscle wasting is the most prominent symptom of cancer cachexia. It
is well known that muscle wasting in cancer cachexia is directly
related to the poor quality of life of cancer patients and even
impacts their survival (1). The
current clinical therapy for muscle wasting contributes to the
recovery of cancer patients, but the mortality rate of cancer is
still rising. Consequently, a novel strategy for the clinical
treatment of cancer-induced muscle wasting is urgently required,
and research on this subject is highly necessary (2).
To date, for both practical and ethical reasons,
studies on muscle wasting have mainly depended on the use of murine
models. Among the many available models, the colon-26
adenocarcinoma (C26) and Lewis lung carcinoma (LLC) models are the
most commonly used (3,4). Many researchers worldwide have
attempted to elucidate the molecular mechanism underlying muscle
wasting using the two models (5–16).
Many studies have shown that an intricate regulatory
network is involved in muscle wasting (17). Increasing evidence indicates that
pro-inflammatory mediators, protein degradation-associated factors,
and some other circulating mediators drive this process (18). In addition, the functions of several
molecules in this process have been demonstrated, particularly
their downstream signaling transduction pathways (17).
Myostatin, which functions specifically as a
negative regulator of skeletal muscle growth, is present at a
higher level in serum of cancer cachectic mice than in those of
normal healthy mice (19–21). Activation of myostatin signaling in
muscle tissue has been demonstrated to be critical to enhancing
muscle catabolism, which causes muscle wasting in cancer cachexia
(22). Myostatin binding to type
IIB activin receptor (ActRIIB) on muscle surface induces the
recruitment and activation of activin receptor-like kinase 5
(ALK5), and eventually leads to forkhead box O3 (FoxO3a)-dependent
transcription to promote muscle protein breakdown via the
ubiquitin-proteasome system (23).
During the process, myostatin induces a reduction in the
phospho-FoxO3a level (24,25). Dephosphorylation of FoxO3a leads to
its nuclear entry (26). Nuclear
FoxO3a activates the atrogin1 promoter (27). Atrogin1 and muscle RING-finger 1
(MuRF1) are two important muscle-specific ubiquitin ligases that
are induced in almost all types of muscle wasting (28–30).
The ubiquitin proteasome system and autophagy system are two major
proteolytic systems involved in skeletal muscle wasting (31,32).
Ubiquitin ligases tag myofilament proteins, such as myosin, with
ubiquitin groups and target them for degradation (33). Atrogin1, a crucial factor that
promotes muscle protein breakdown, is one of the most important
downstream molecules of the myostatin signaling pathway (34). Therefore, the myostatin-atrogin1
axis plays a crucial role in the process of muscle wasting.
Furthermore, this axis can be regulated by several other
molecules.
The activity of FoxO3a is inhibited by an important
transcriptional coactivator, peroxisome proliferator-activated
receptor gamma coactivator 1 alpha (PGC1α), which is stimulated by
signals that maintain energy and nutrient homeostasis and involved
in important metabolic pathways in muscular tissue (35–37).
PGC1α is decreased during muscle wasting, and overexpression of
PGC1α inhibits loss of muscle in denervation, hindlimb unloading,
sarcopenia and metabolic disease in mice (38–40).
CCAAT/enhancer binding protein beta (C/EBPβ) is an
important transcription factor involved in cellular metabolism and
inflammation (41). The expression
level of C/EBPβ is increased during muscle wasting under multiple
conditions (42,43). Activated p38β mitogen-activated
protein kinase (MAPK) interacts with and phosphorylates C/EBPβ,
promoting the binding of C/EBPβ to the atrogin1 promoter in the
muscle tissues of cancer cachectic mice (10,44).
Histone deacetylases (HDACs) are the most well known
for their roles in the regulation of muscle development and
differentiation (45). Subsequent
research found that protein deacetylation by HDACs was associated
with muscle atrophy in certain conditions (46–48).
More recently, class I HDACs have been demonstrated to promote
muscle atrophy during nutrient deprivation. Further research has
revealed that overexpression of HDAC1 is sufficient to enhance
FoxO3a activity and cause skeletal muscle fiber atrophy (49).
Additionally, the roles of microRNAs in skeletal
muscle damage and regeneration induced by atrophy have emerged
(50). An additional novel study
has demonstrated the downregulation of the miR-30 family in muscle
disuse atrophy (51).
Although a lot of information has been reported
about muscle wasting in cancer cachexia, few studies have been
focused on whether muscle wasting in early cancer cachexia (ECC)
differs from that in late cancer cachexia (LCC). It has been
established that the development of tumors can be divided into
different phases (52). Muscle
wasting induced by tumors at different stages might be different.
Bonetto et al (8)
demonstrated that cancer cachexia had different severity, although
the tumor-free body weight, muscle mass and certain molecule
expression in their study were not significantly different between
moderate and severe cancer cachexia. However, muscle wasting in LCC
may, theoretically, have a more severe impact on cancer patients
quality of life than that in ECC, for example more body weight
loss. Therefore, the differences between ECC and LCC remain poorly
understood so far. The aim of the present study was to further
reveal the different manifestations and molecular changes in muscle
tissues from mice with ECC and LCC. To assess molecular
alterations, we used two different cancer cachectic models,
according to a previous study (53). Our results may provide some clues
for preventing cancer cachexia at the early stage and improving
cancer patients quality of life.
Materials and methods
Cell culture and animal models
Colon-26 adenocarcinoma cells (C26 cells) (Medical
Science Experimentation Center of Sun Yat-Sen University, China)
and Lewis lung carcinoma cells (LLC cells) (Shanghai Branch of
Chinese Academy of Science, China) were cultured in Dulbeccos
modified Eagles medium (DMEM) plus 10% fetal bovine serum (FBS)
with 1% penicillin/streptomycin at 37°C and 5% CO2.
Before injection of C26 cells into CD2F1 mice (C26 model) or
injection of LLC cells into C57BL/6 mice (LLC model), cells were
counted and resuspended at 5×10⁷ cells/ml in sterilized
PBS. The right flanks of the mice were shaved, and they were
administered a subcutaneous (s.c.) injection of either
5×10⁶ C26 cells or LLC cells suspended in 100 µl
sterilized PBS (tumor-bearing mice, TB mice) or 100 µl sterilized
PBS without cells (control mice, CN mice). Eight-week-old male
CD2F1 or C57BL/6 mice were allocated randomly into one of four
experimental groups: i) tumor-bearing mice in early cachexia (ECC
mice); ii) tumor-bearing mice in late cachexia (LCC mice); iii)
ECC-matched control mice (ECC-CN mice); and iv) LCC-matched control
mice (LCC-CN mice). The animals were monitored daily and were
euthanized separately at 24 days (ECC and ECC-CN mice) and 36 days
(LCC and LCC-CN mice) following injection (7,9).
Tumors, quadriceps, tibialis anterior, soleus, and gastrocnemius
muscles, hearts, spleens, and epididymal fat were immediately
harvested and weighed. For subsequent studies, tibialis anterior
muscles were fixed in 4% paraformaldehyde, and the other tissues
were quickly frozen in liquid nitrogen and stored at −80°C. All
experiments were approved by the Animal Care and Use Committee of
Tongji Medical College of Huazhong University of Science and
Technology.
Myofiber cross-sectional area
To determine the myofiber cross-sectional area
(CSA), hematoxylin and eosin (H&E) staining was performed on a
middle cross-section of the tibialis anterior. Images were acquired
using a digital camera and were quantified using ImageJ software
(NIH, Bethesda, MD, USA). Within each section, five view fields
with 100 myofibers per field were measured (10).
Immunofluorescence
To visualize the outlines of myofibers, 10 µm
sections were obtained from the middle of the tibialis anterior.
The sections were then incubated with Alexa Fluor 350-conjugated
wheat germ agglutinin (Invitrogen, Carlsbad, CA, USA) for 2 h and
subsequently washed in PBS. Images were acquired using a digital
camera (3,49). Representative view fields were
elected and recorded.
Real-time reverse transcription
PCR
RNA was extracted from quadriceps muscles using
TRIzol reagent (Invitrogen) according to the manufacturers
instructions. The concentration and purity of the RNA solution were
determined by Epoch microplate spectrophotometer (BioTek
Instruments, Inc., Winooski, VT, USA). RNA (1 µg) was used for
reverse transcription. Reverse transcription of mRNA was performed
using a RevertAid First-Strand cDNA Synthesis kit (Thermo Fisher
Scientific, Inc., Rockford, IL, USA) in a total reaction volume of
10 µl. Dilution (1:10) of the RT product was used as template for
the quantitative real-time PCR (qPCR). qPCR was performed with the
2X SYBR-Green Mix (Thermo Fisher Scientific) using a
LightCycler® 480 (Roche Diagnostics, Mannheim, Germany)
in a total reaction volume of 10 µl with the primers from Sangon
Biotech, Co., Ltd. (Shanghai, China). The amplification procedure
was 95°C pre-denaturation for 10 min followed by 95°C for 15 sec,
60°C for 10 sec and 72°C for 30 sec for a total of 40 cycles. The
data were normalized to glyceraldehyde-3-phosphate dehydrogenase
(GAPDH) expression and the relative expression was calculated using
the formula: 2−ΔCt (ΔCt = Ct gene - Ct
GAPDH). The primer sequences were as follows: Myostatin:
F-AGTGGATCTAAATGAGGG CAGT and R-GTTTCCAGGCGCAGCTTAC; PGC1α: F-AA
CCACACCCACAGGATCAGA and R-TCTTCGCTTTAT TGCTCCATGA; FoxO3a:
F-GCAAGCCGTGTACTGTGGA and R-CGGGAGCGCGATGTTATCC; MuRF1: F-AGCAT
CAAGATCCGTCTGACA and R-CCAGAGCCGTCCACA ACAAT; Atrogin1:
F-ACACATCCTTATGCACACTGG and R-TCTCCATCCGATACACCCACA; GAPDH:
F-GGTGAA GGTCGGAGTCAACGG and R-GAGGTCAATGAAGGGG TCATTG.
Western blotting
The quadriceps muscles were homogenized, and total
protein was extracted using RIPA protein lysis buffer (P1003;
Beyotime Institute of Biotechnology, Nantong, China) with freshly
added protease inhibitor cocktail and phenylmethylsulphonyl
fluoride (PMSF). The protein concentration of the samples was
measured using BCA method. A total of 80 µg of protein was
subjected to a 10% SDS-PAGE gel to separate the proteins by gel
electrophoresis, and they were then transferred onto polyvinylidene
fluoride (PVDF) (0.45 µm; Millipore, Boston, MA, USA) membranes.
The membranes were blocked for 1 h at 37°C in 5% (w/v) non-fat
dried skim milk (blocking buffer) and incubated with primary
antibodies in blocking buffer overnight at 4°C. The primary
antibodies were as follows: anti-atrogin1 antibody (#AP2041),
purchased from ECM Biosciences, Versailles, KY, USA; anti-PGC1α
antibody (ab54481), purchased from Abcam, Cambridge, MA, USA;
anti-Phospho-FoxO3a (#9466) and anti-FoxO3a (#2497) antibodies
obtained from Cell Signaling Technology, Danvers, MA, USA;
anti-C/EBPβ (sc-7962), anti-HDAC1 (sc-7872), anti-HDAC2 (sc-7899),
and anti-HDAC3 (sc-11417) antibodies acquired from Santa Cruz
Biotechnology, Santa Cruz, CA, USA. The membranes were washed and
incubated with the appropriate horseradish peroxidase-conjugated
secondary antibody (Invitrogen) in blocking buffer for 2 h at room
temperature. Finally, the membranes were washed before detection.
Quantitative analyses of protein expression were performed using
ImageJ software (25).
Statistical analysis
All values were represented as the mean ± standard
error (SEM) unless stated otherwise. Differences between group
means were determined using the Students t-test with Graphpad Prism
5 unless otherwise specified. A two-sided P-value of <0.05 was
considered to indicate statistically significant result.
Results
Body weights of LCC mice were
decreased for C26 model but not LLC model
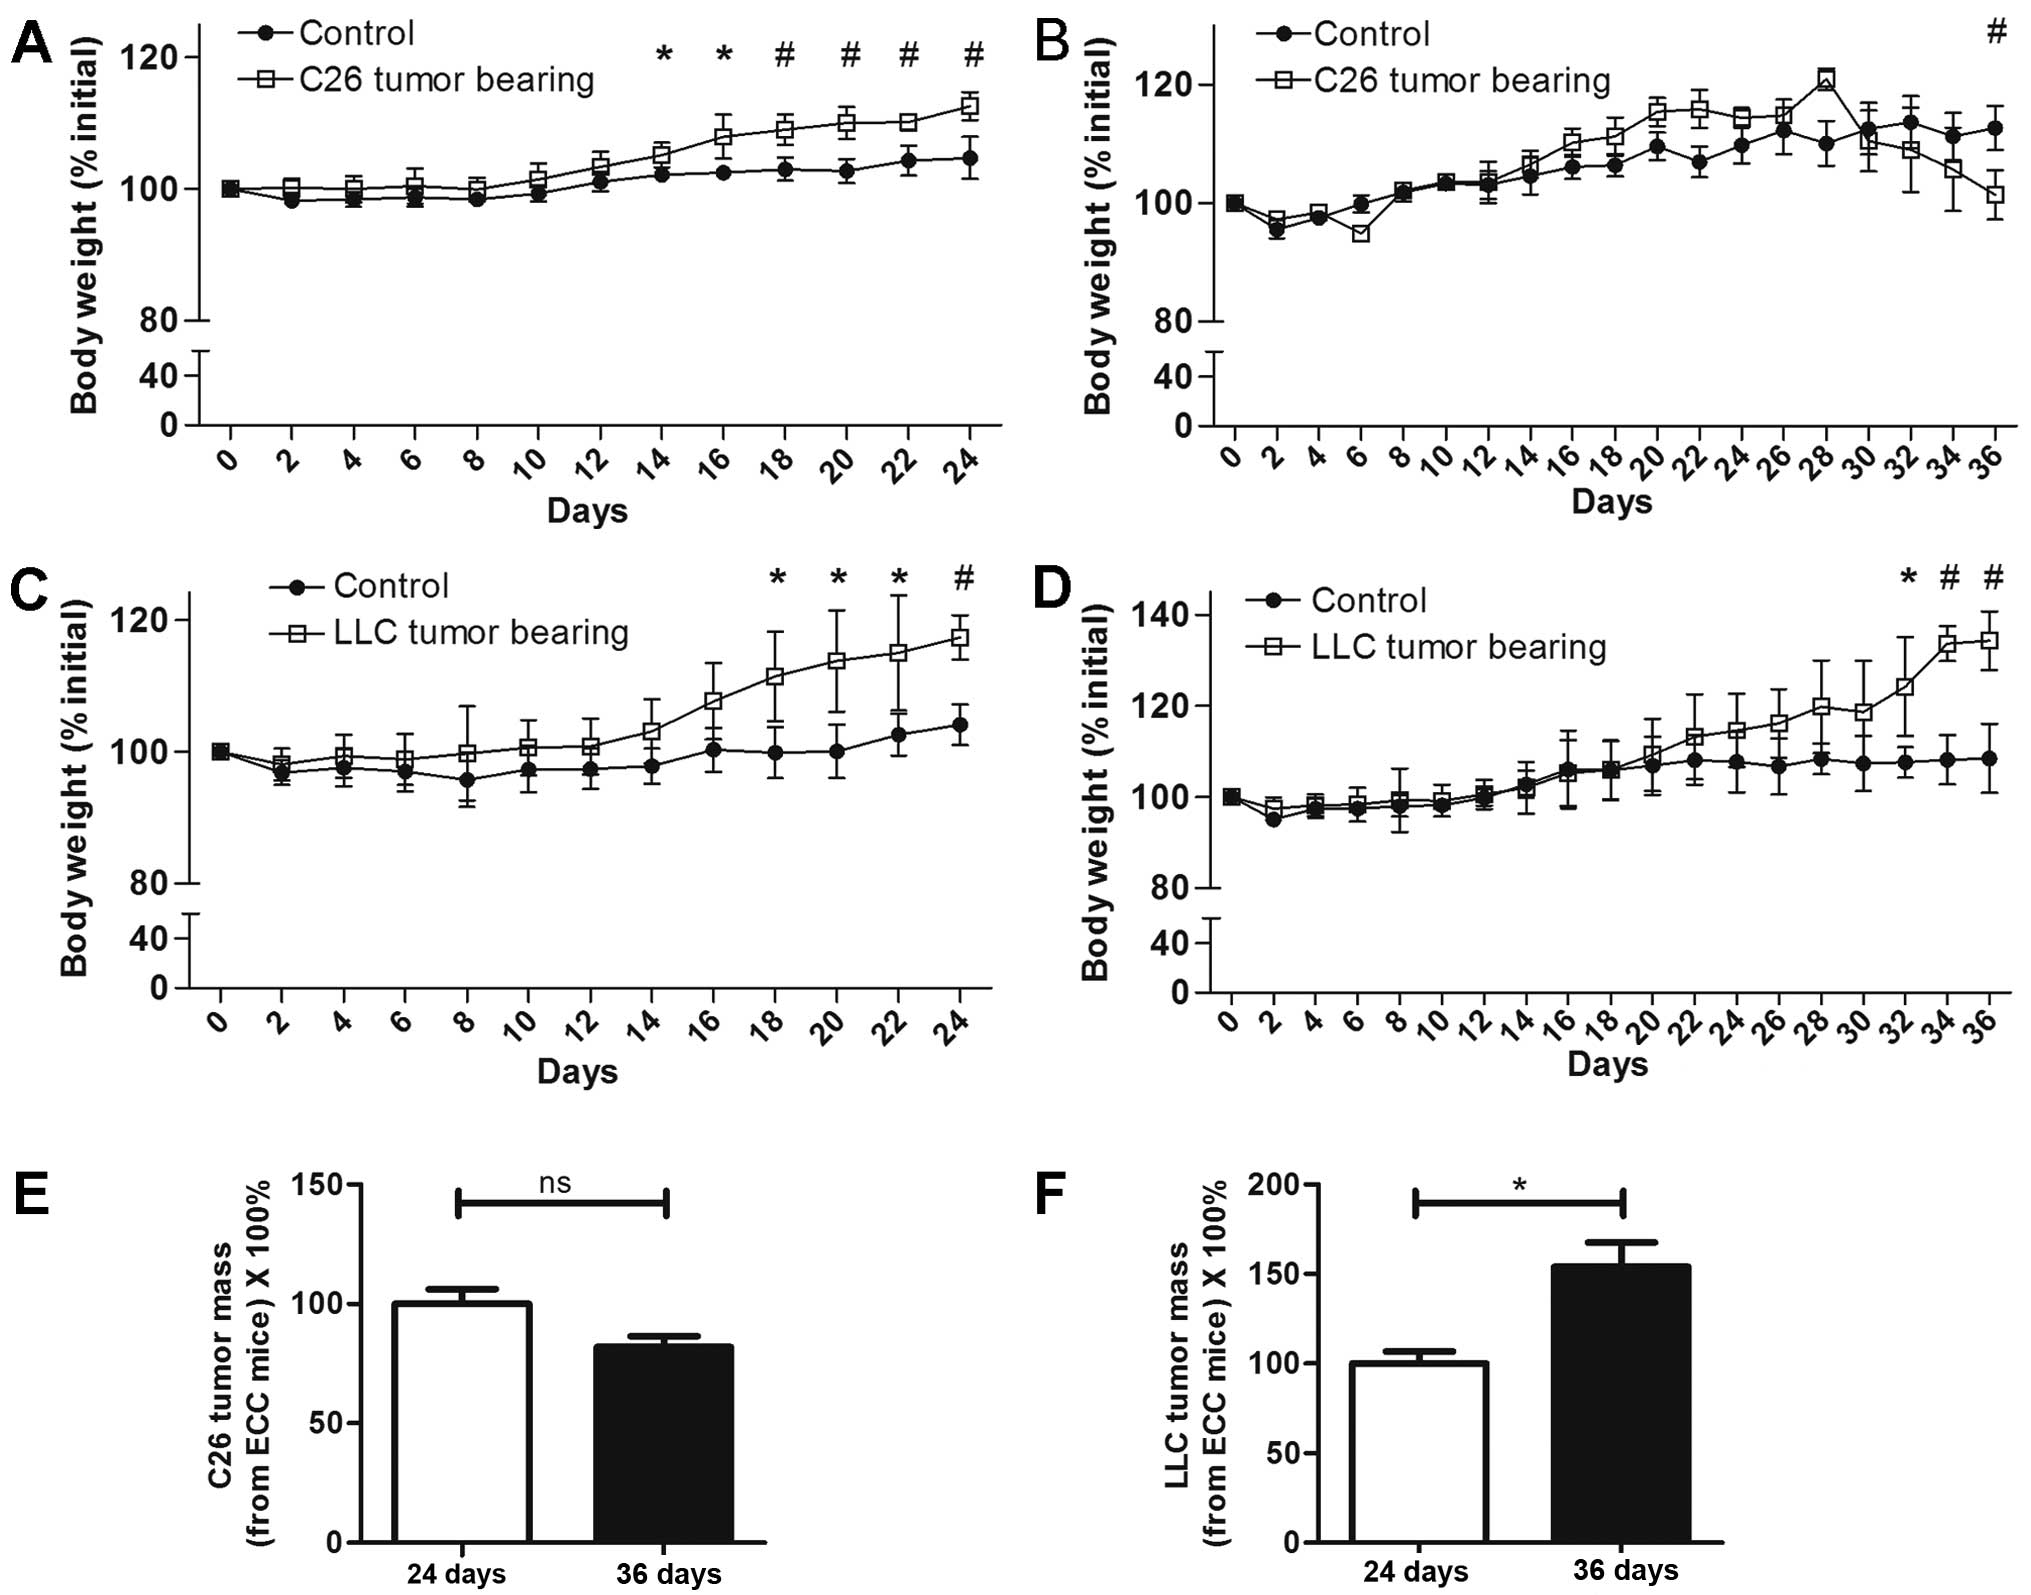
For the C26 model mice, at 24 days following C26
tumor implantation, the body weights of the ECC-CN and ECC mice
were both increased (Fig. 1A). From
the 30th day, the body weights of the LCC mice started to decrease,
and this trend was maintained until the 36th day, when the mice in
this group were sacrificed (Fig.
1B). For the LLC model mice, in contrast with the C26 model
mice, the body weights of both the ECC and LCC mice consistently
increased until day 36 (Fig. 1C and
D). Nevertheless, the ECC mice had already developed cancer
cachexia, as the tumor-free body masses of these mice were
significantly decreased for both the C26 and LLC models.
Interestingly, the tumor masses of the LCC mice were higher than
that of ECC mice in LLC model. But no significant differences
existed between the ECC mice and LCC mice in C26 model (Fig. 1E and F).
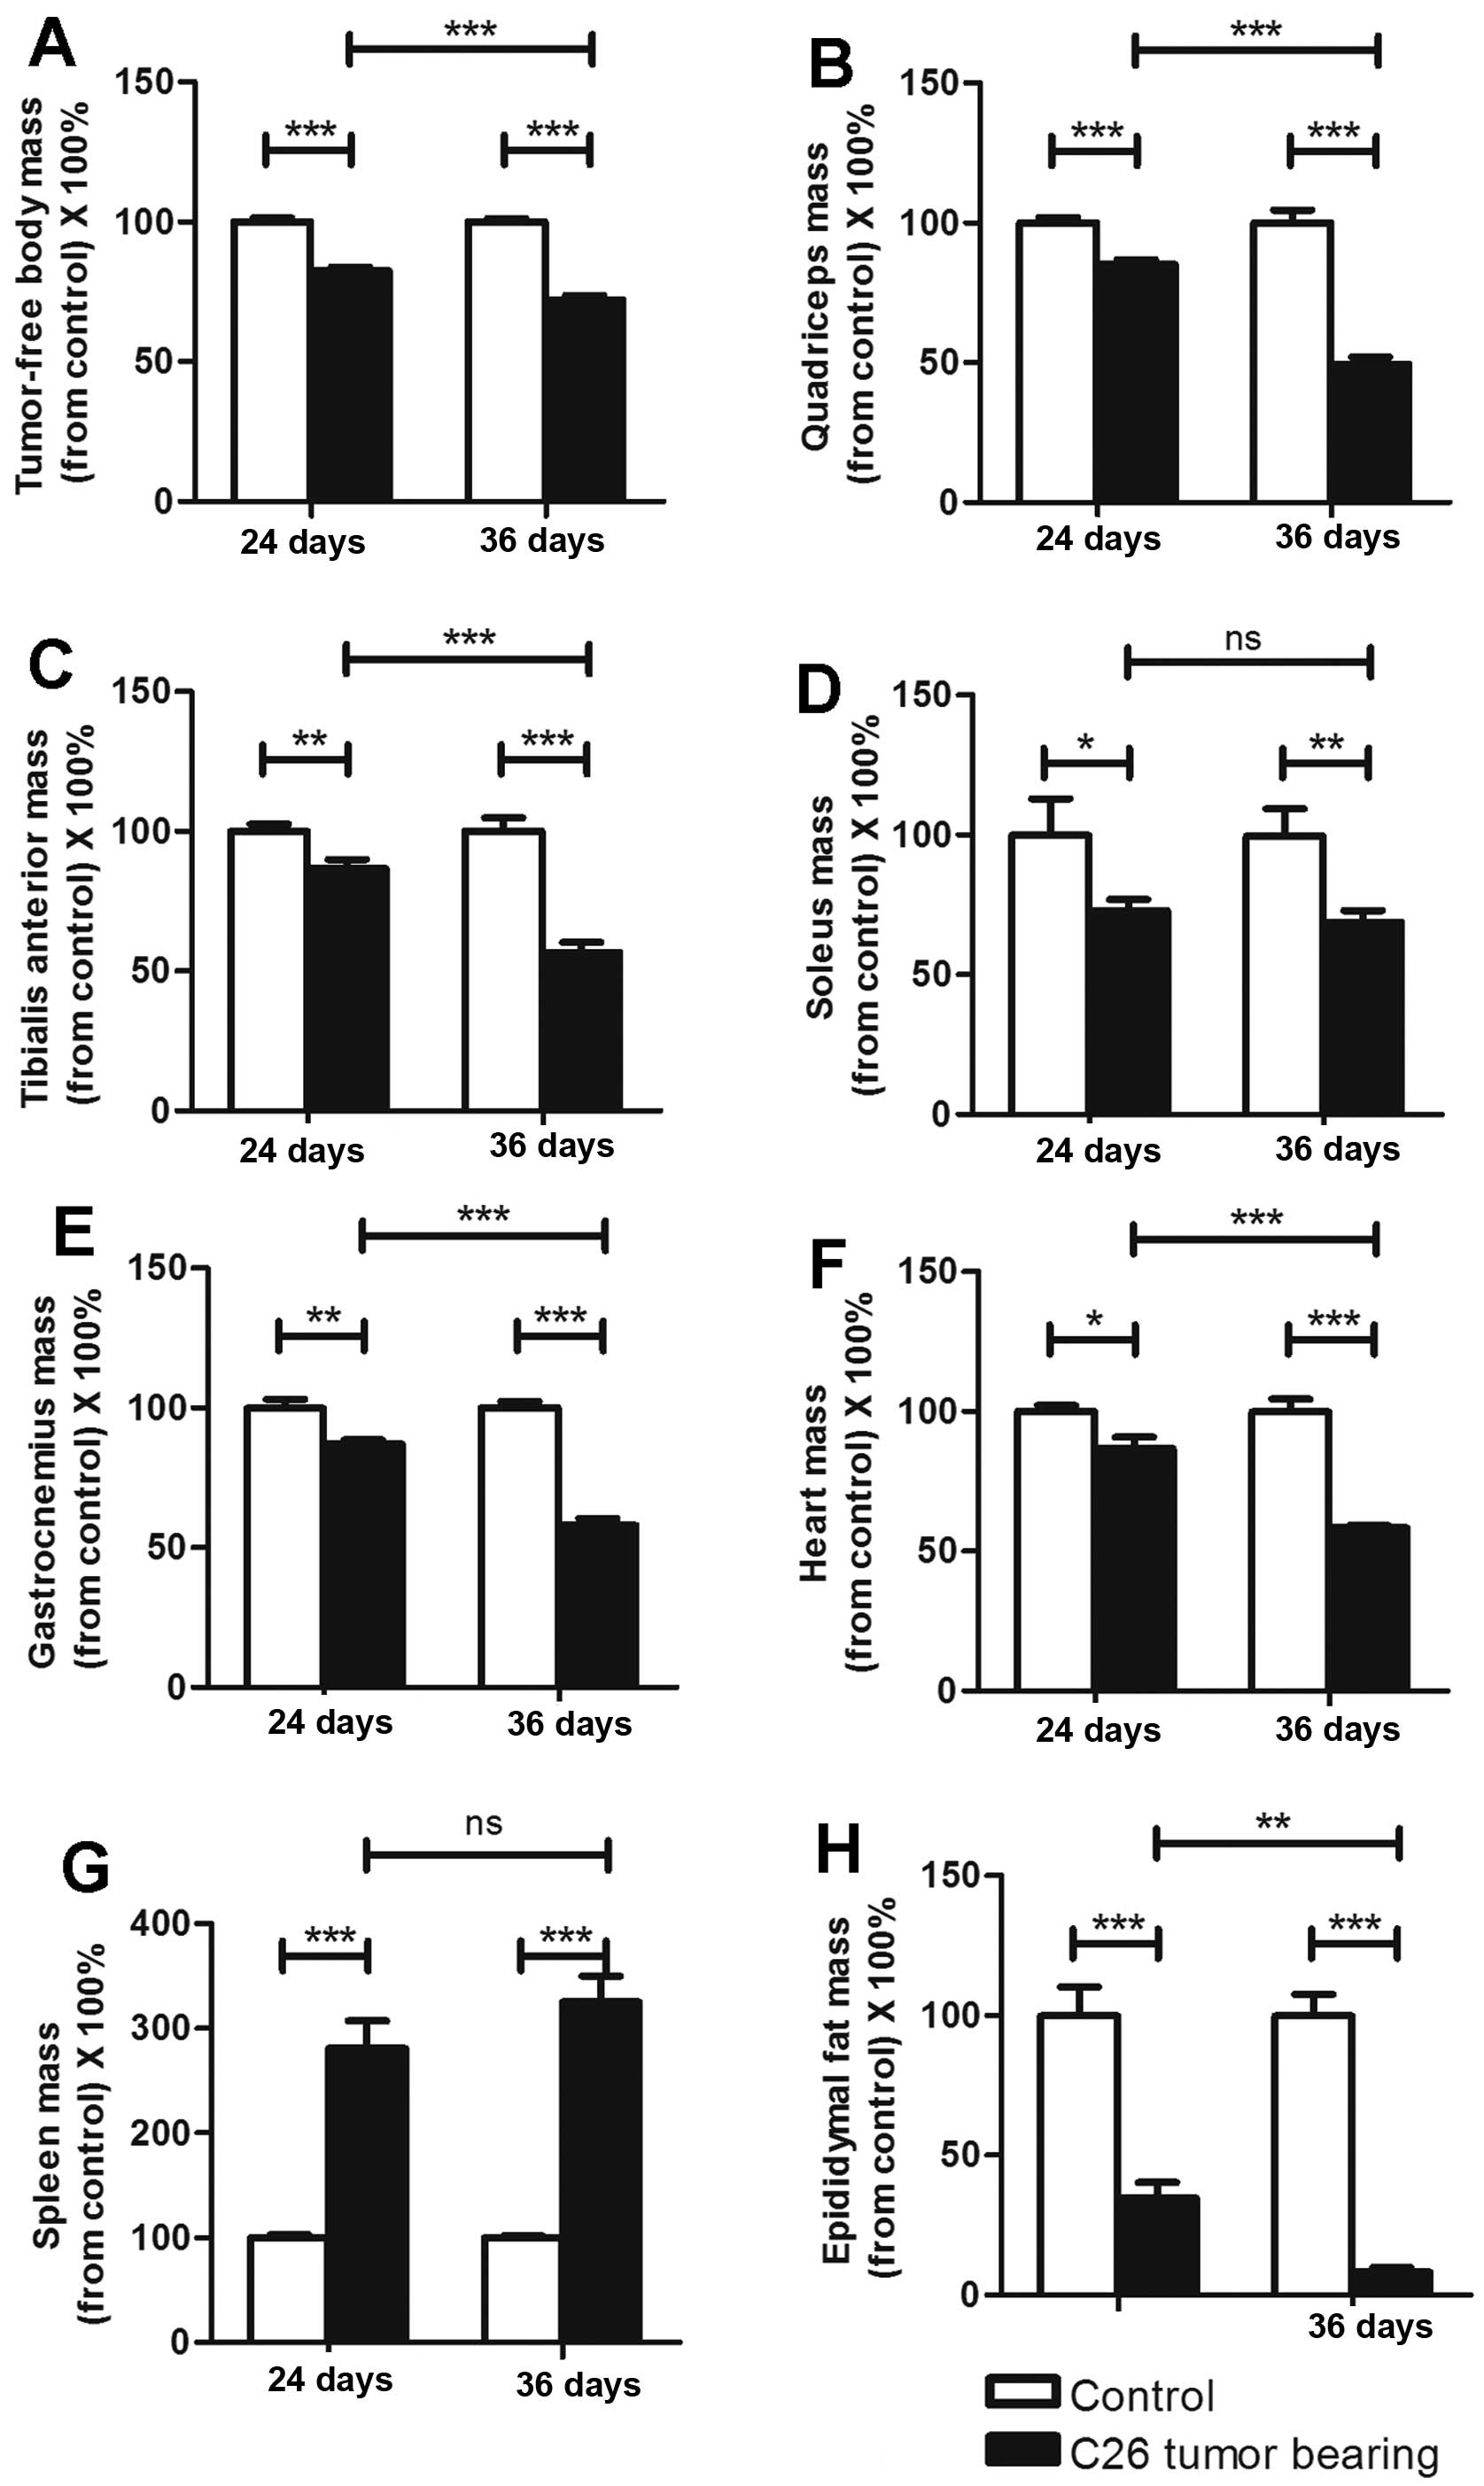
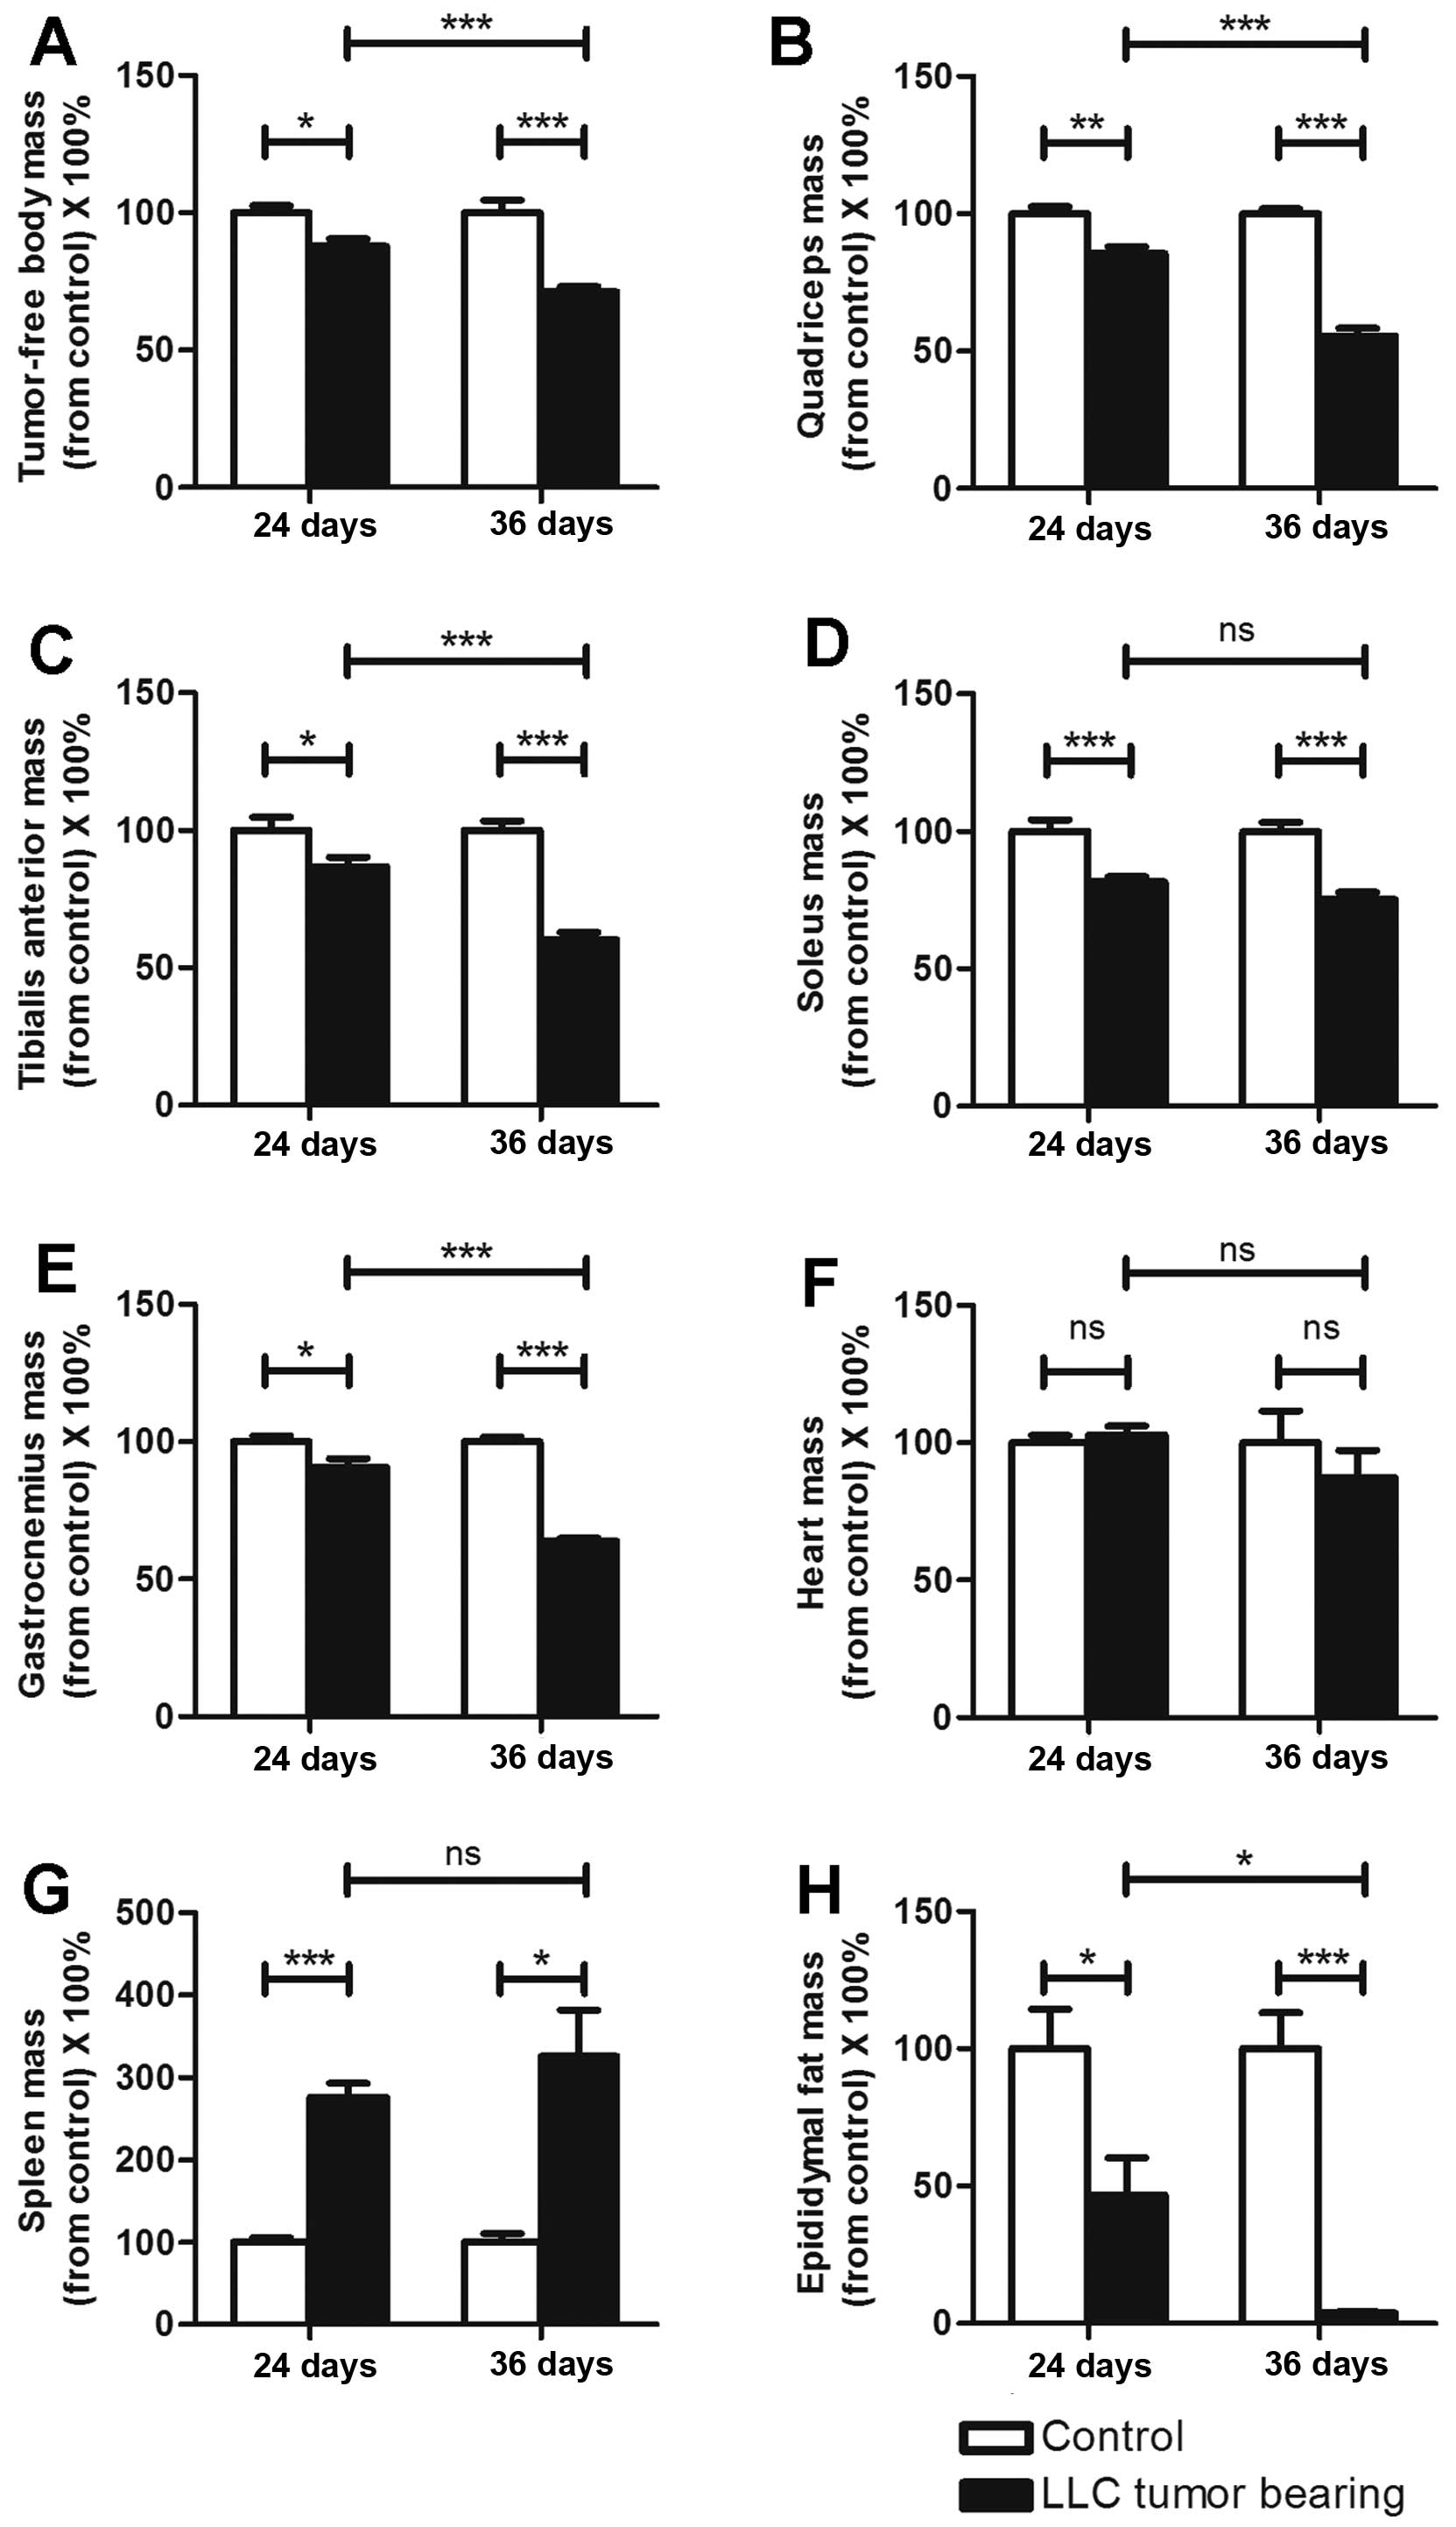
The tumor-free masses of the ECC mice were reduced
by ~18 and 13% compared with those of ECC-CN mice for the C26 and
LLC models, respectively. A similar finding was observed for the
LCC mice, but with higher rates of reduction (~28 and 29% compared
with the C26 and LLC model LCC-CN mice, respectively). The
tumor-free masses of the LCC mice were obviously less than those of
the ECC mice for both models (Figs.
2A and 3A).
For the above reasons, we defined the TB mice
sacrificed on the 24th day as ECC mice (their tumor-free body
masses were decreased by <20%) and the TB mice sacrificed on the
36th day as LCC mice (their tumor-free body masses were decreased
by >20%).
The mass variations in organs and
muscles differed between the ECC and LCC mice
As previously reported, C26 cachexia results in
skeletal muscle, epididymal adipose and heart mass losses (7). The masses of the organs and muscles
harvested from the C26 and LLC model mice are listed in Tables I and II. We obtained similar findings for these
two models (Figs. 2 and 3), except that the heart mass did not
exhibit a substantial change (Fig.
3F) in the LLC model. We found that the LCC mice had much
greater losses of muscle and epididymal adipose mass than the ECC
mice for both models (Figs. 2 and
3), except for the soleus muscle
mass (Figs. 2D and 3D). These data further demonstrated that
the LCC mice suffered from more severe cancer cachexia than the ECC
mice.
 | Table I.Changes in tumor-free body mass,
muscle mass, organ mass, and fat mass in the C26 model. |
Table I.
Changes in tumor-free body mass,
muscle mass, organ mass, and fat mass in the C26 model.
|
| 24 days | 36 days |
|---|
|
|
|
|
|---|
|
| Control (CN) | P-value | C26 tumor bearing
(TB) | Control(CN) | P-value | C26 tumor bearing
(TB) |
|---|
| n | 4 |
| 5 | 4 |
| 5 |
| Tumor-free body
mass (g) | 27.74±0.74 | 0.001c | 22.92±0.73 | 27.15±0.62 | 0.001e | 19.60±0.90 |
| Quadriceps
(mg) | 134.90±7.30 | 0.001c | 114.97±7.69 | 161.93±20.82 | 0.001e | 80.09±13.07 |
| Tibialis anterior
(mg) | 51.76±3.75 | 0.01b | 44.93±5.03 | 56.24±7.39 | 0.001e | 31.89±6.43 |
| Gastrocnemius
(mg) | 128.56±10.80 | 0.01b | 111.99±6.67 | 144.61±10.06 | 0.001e | 83.98±10.89 |
| Soleus (mg) | 6.73±2.46 | 0.05a | 4.90±0.84 | 6.46±1.80 | 0.01d | 4.47±0.85 |
| Heart (mg) | 139.60±6.05 | 0.05a | 120.94±13.33 | 149.65±13.61 | 0.001e | 87.26±3.28 |
| Spleen (mg) | 77.83±5.14 | 0.001c | 218.84±45.36 | 90.33±4.14 | 0.001e | 293.70±49.96 |
| Epididymal fat
(mg) | 559.78±114.77 | 0.001c | 194.54±68.95 | 401.48±60.37 | 0.001e | 33.24±14.99 |
| Table II.Changes in tumor-free body mass,
muscle mass, organ mass, and fat mass in the LLC model. |
Table II.
Changes in tumor-free body mass,
muscle mass, organ mass, and fat mass in the LLC model.
|
| 24 days | 36 days |
|---|
|
|
|
|
|---|
|
| Control (CN) | P-value | C26 tumor bearing
(TB) | Control (CN) | P-value | C26 tumor bearing
(TB) |
|---|
| n | 4 |
| 6 | 4 |
| 6 |
| Tumor-free body
mass (g) | 22.61±1.16 | 0.05a | 19.87±1.39 | 23.19±2.10 | 0.001e | 16.49±1.05 |
| Quadriceps
(mg) | 117.04±8.50 | 0.01b | 100.13±10.23 | 116.18±6.16 | 0.001e | 64.49±11.48 |
| Tibialis anterior
(mg) | 50.88±6.95 | 0.05a | 44.24±5.69 | 50.26±4.91 | 0.001e | 30.27±4.32 |
| Gastrocnemius
(mg) | 131.11±7.58 | 0.05a | 119.15±12.54 | 134.11±7.04 | 0.001e | 85.55±5.83 |
| Soleus (mg) | 7.73±0.89 | 0.001c | 6.29±0.55 | 7.10±0.64 | 0.001e | 5.34±0.67 |
| Heart (mg) | 100.23±5.61 |
| 103.05±8.24 | 142.80±33.31 |
| 124.58±35.09 |
| Spleen (mg) | 72.05±7.50 | 0.001c | 198.63±30.27 | 67.90±13.51 | 0.05d | 220.72±85.35 |
| Epididymal fat
(mg) | 339.38±97.72 | 0.05a | 159.32±100.88 | 465.55±121.66 | 0.001e | 18.16±5.69 |
C26 cancer cachexia has been reported to result in a
large increase in the mass of the spleen (3). This conclusion is consistent with our
results (Fig. 2G), and we obtained
the same results with the LLC model (Fig. 3G). However, the spleen masses did
not significantly differ between the ECC and LCC mice for either
model (Figs. 2G and 3G). Additionally, the heart masses did not
significantly differ between the ECC or LCC mice and their matched
CN mice for the LLC model (Fig.
3F). These results differed from those for the C26 model mice
but are consistent with those of a previous study (14).
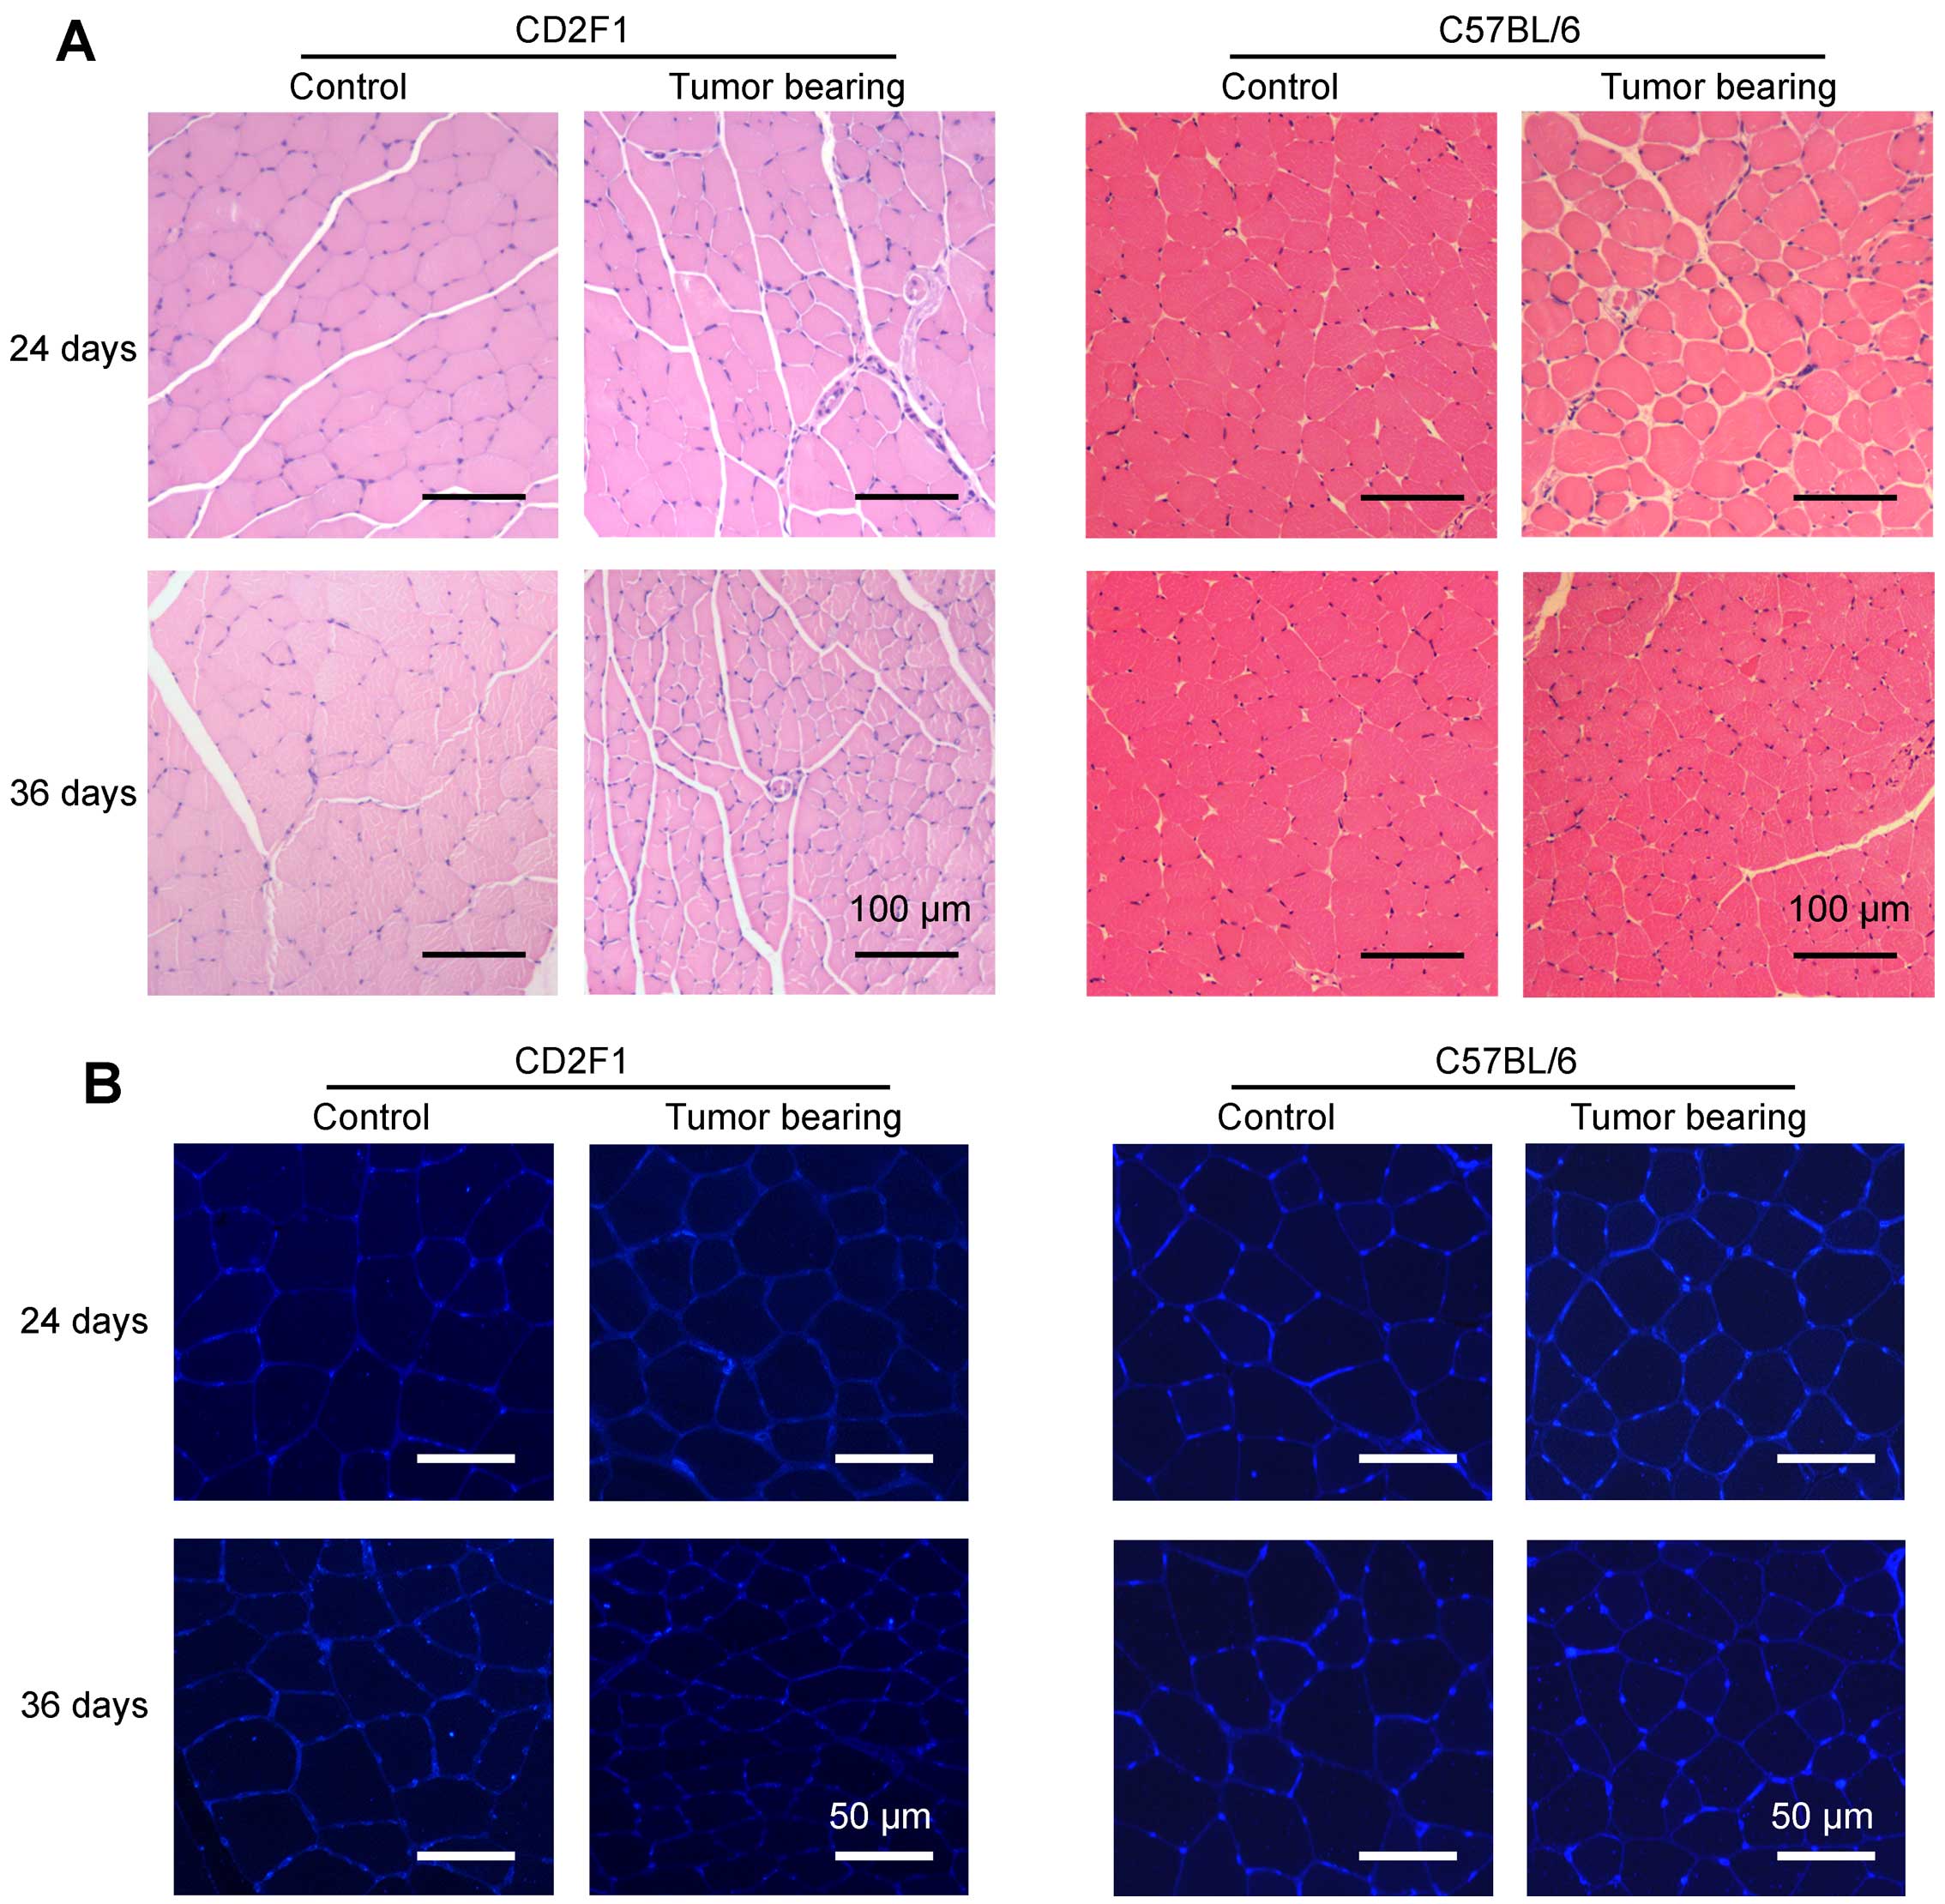
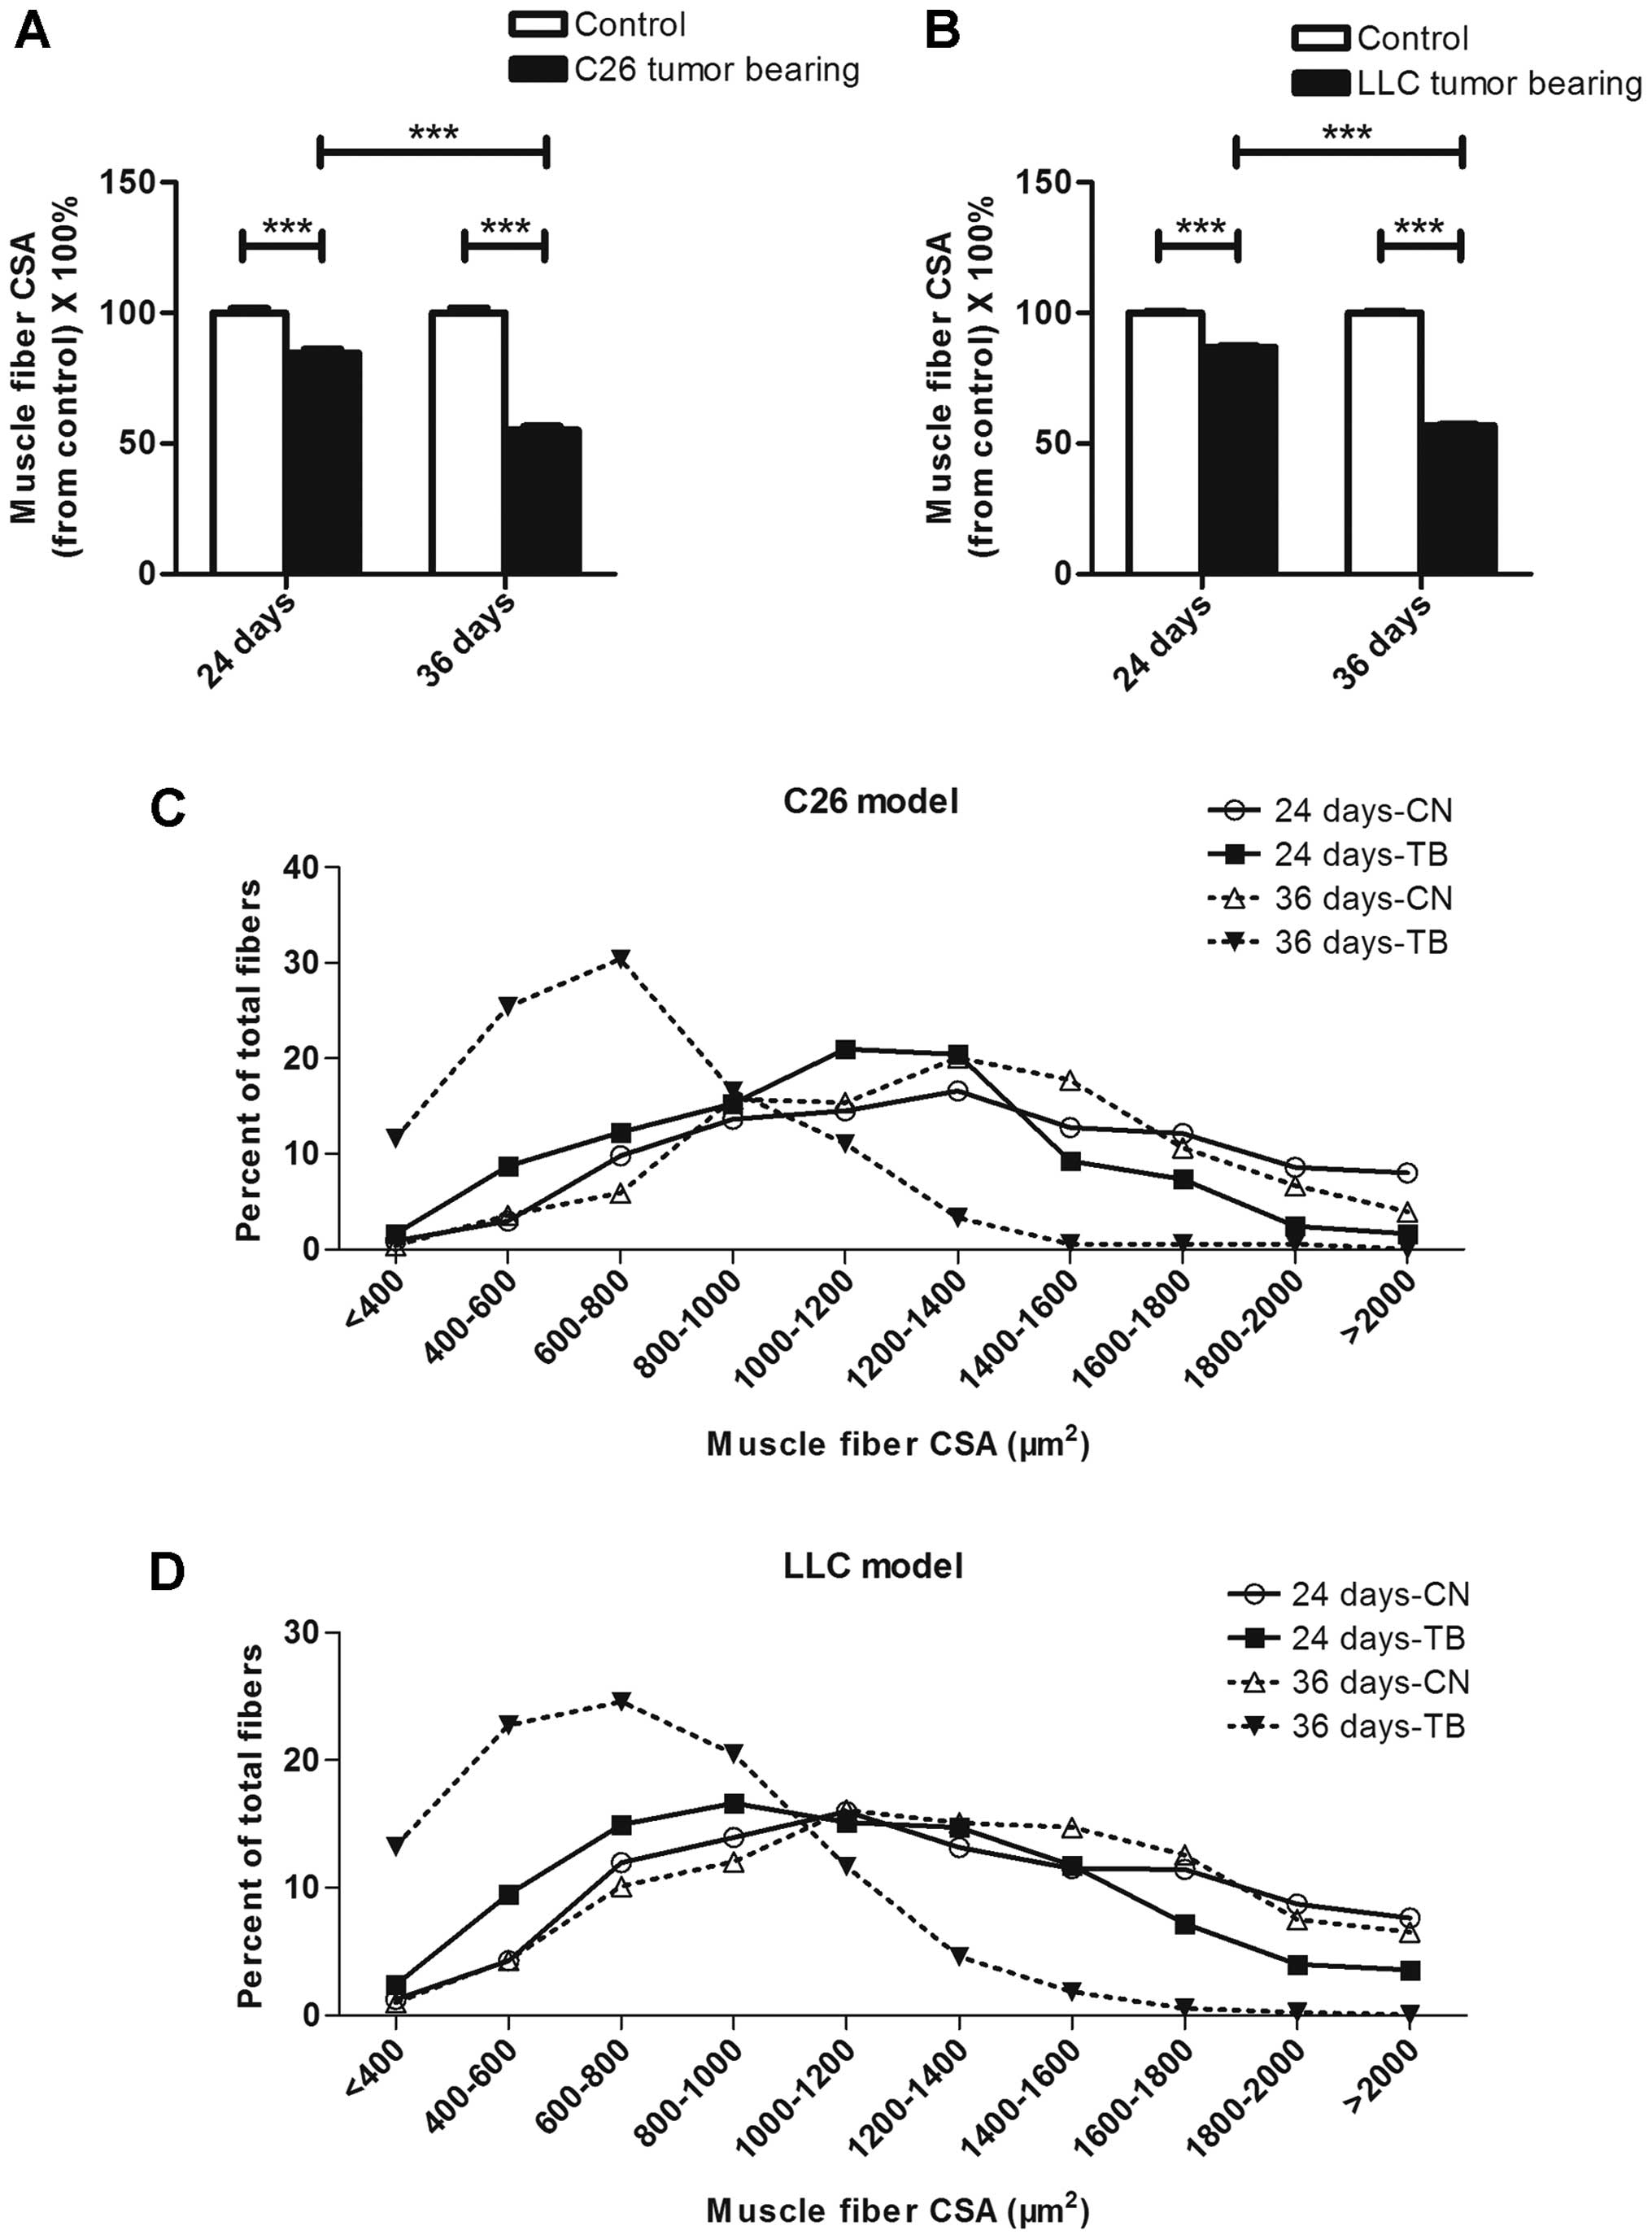
The muscle fiber size was smaller in
LCC mice than in ECC mice
Representative images of H&E-stained tibialis
anterior middle cross sections from the mice in each group are
shown in Fig. 4A. To better
visualize the outlines of muscle fibers, skeletal muscle cross
sections taken from tibialis anterior muscles were incubated with
fluorescently labeled wheat germ agglutinin (Fig. 4B). The average muscle fiber CSAs
declined by 15 and 45% in the ECC and LCC mice, respectively,
compared with their matched CN mice for the C26 model (Fig. 5A), and these values declined by 13
and 43%, respectively, for the LLC model (Fig. 5B). Additionally, the changes in
muscle mass were confirmed by analyses of the size distributions of
myofibers in each group. These results indicated that the muscle
fiber CSA of the LCC mice, but not the ECC mice, was obviously less
than that of the LCC-CN mice for both models (Fig. 5C and D).
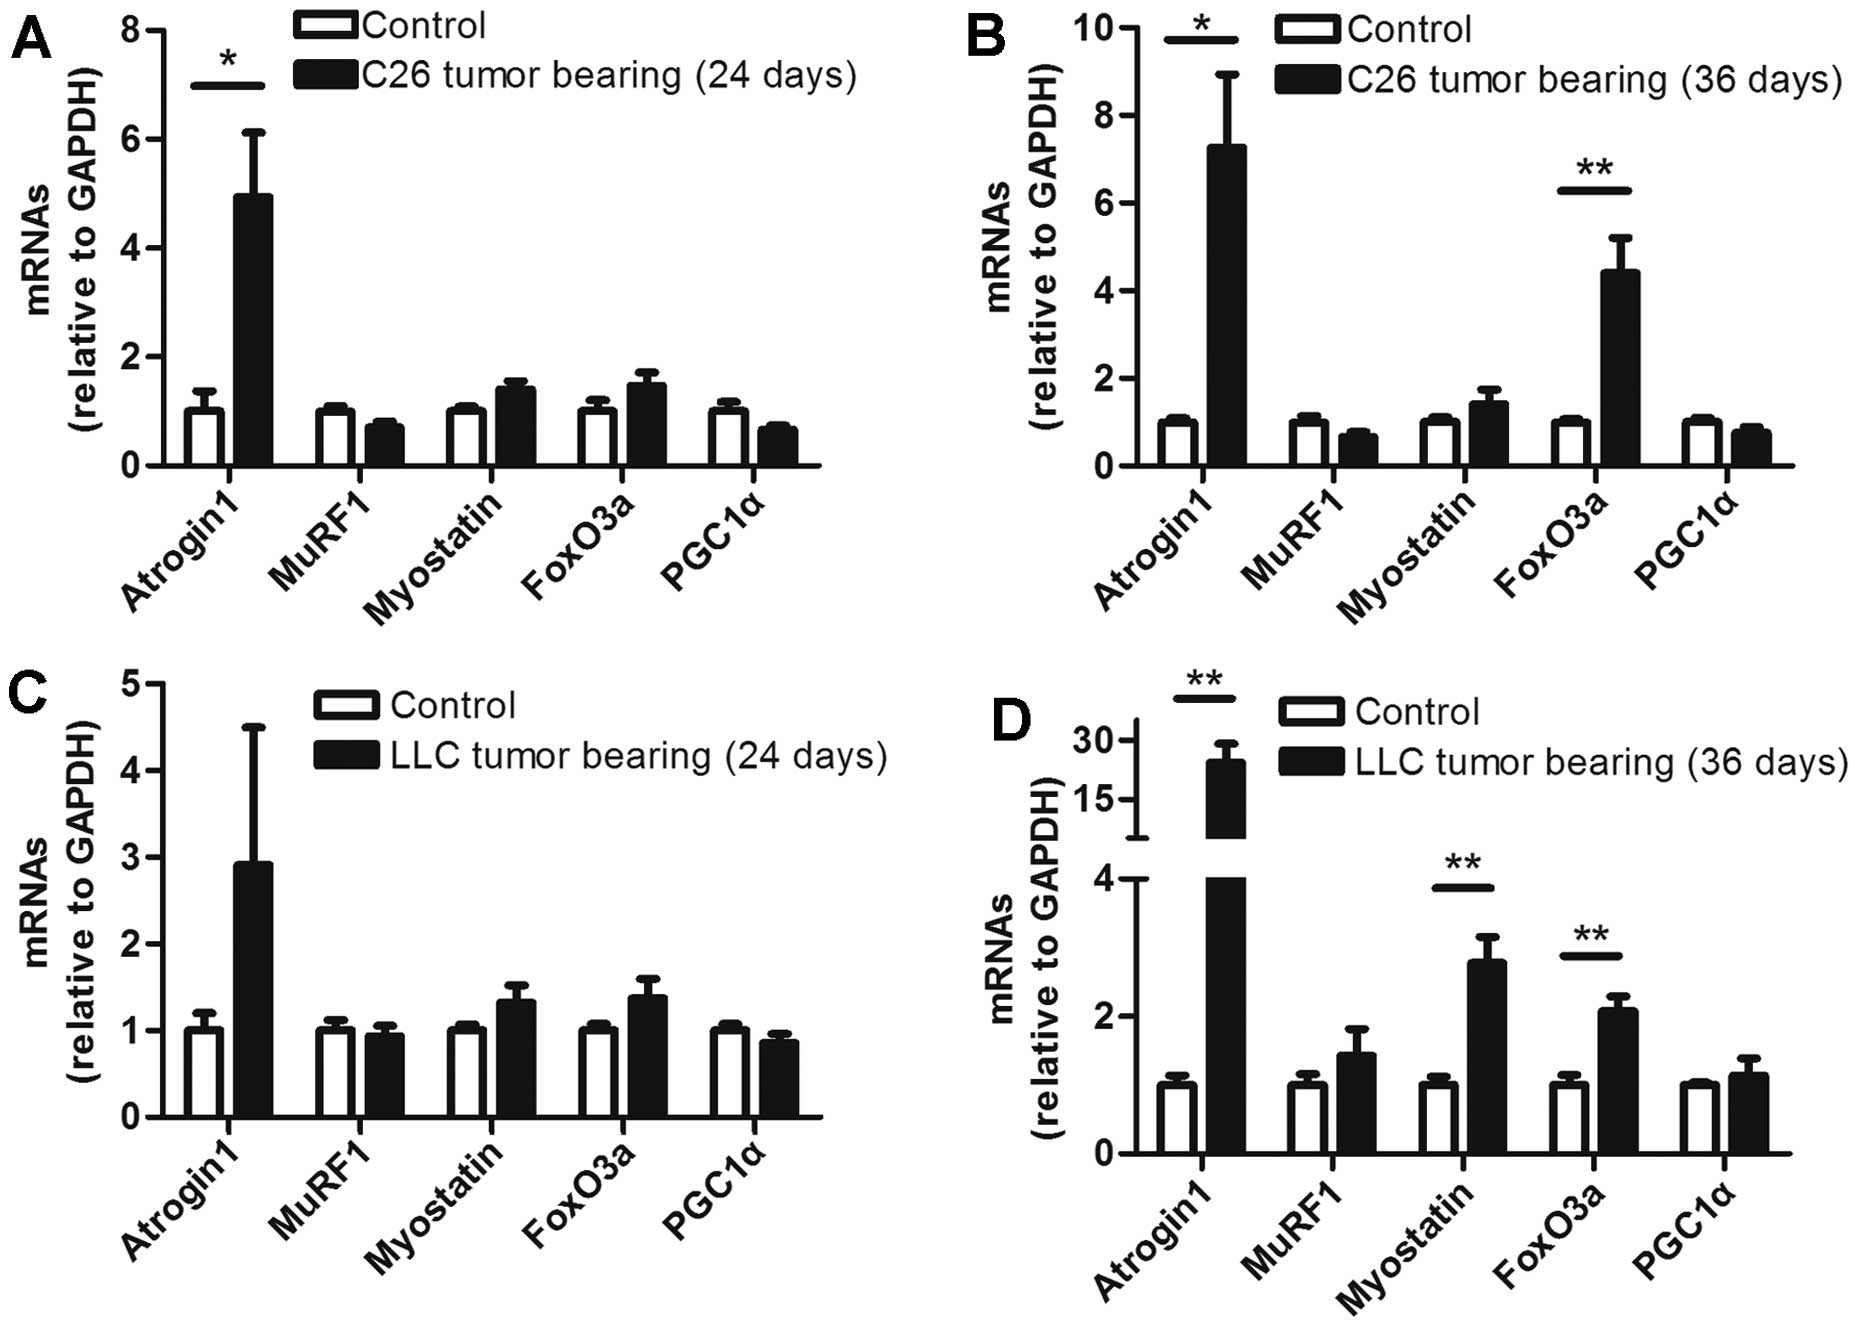
The levels of several muscle mRNAs
differed between the ECC and LCC mice
To determine the mRNA levels of some molecules
involved in muscle wasting, five prominent molecules were selected
for analysis in each group. The mRNA levels of these molecules did
not obviously change in the ECC mice of both models, except for
that of atrogin1, which was increased in the ECC mice compared with
the ECC-CN mice for the C26 model, but not the LLC model (Fig. 6A and C). In contrast with the ECC
mice, the levels of several mRNAs were increased in the muscles
from the LCC mice of the two models. The mRNA levels of atrogin1
and FoxO3a were increased in the LCC mice of both models (Fig. 6B and D). Additionally, the mRNA
expression of myostatin was increased in the muscles from the LLC
model LCC mice (Fig. 6D). A
previous study revealed that the mRNA level of PGC1α is
consistently decreased (25).
However, we found no significant difference in this mRNA level
between the CN and TB mice of either model (Fig. 6).
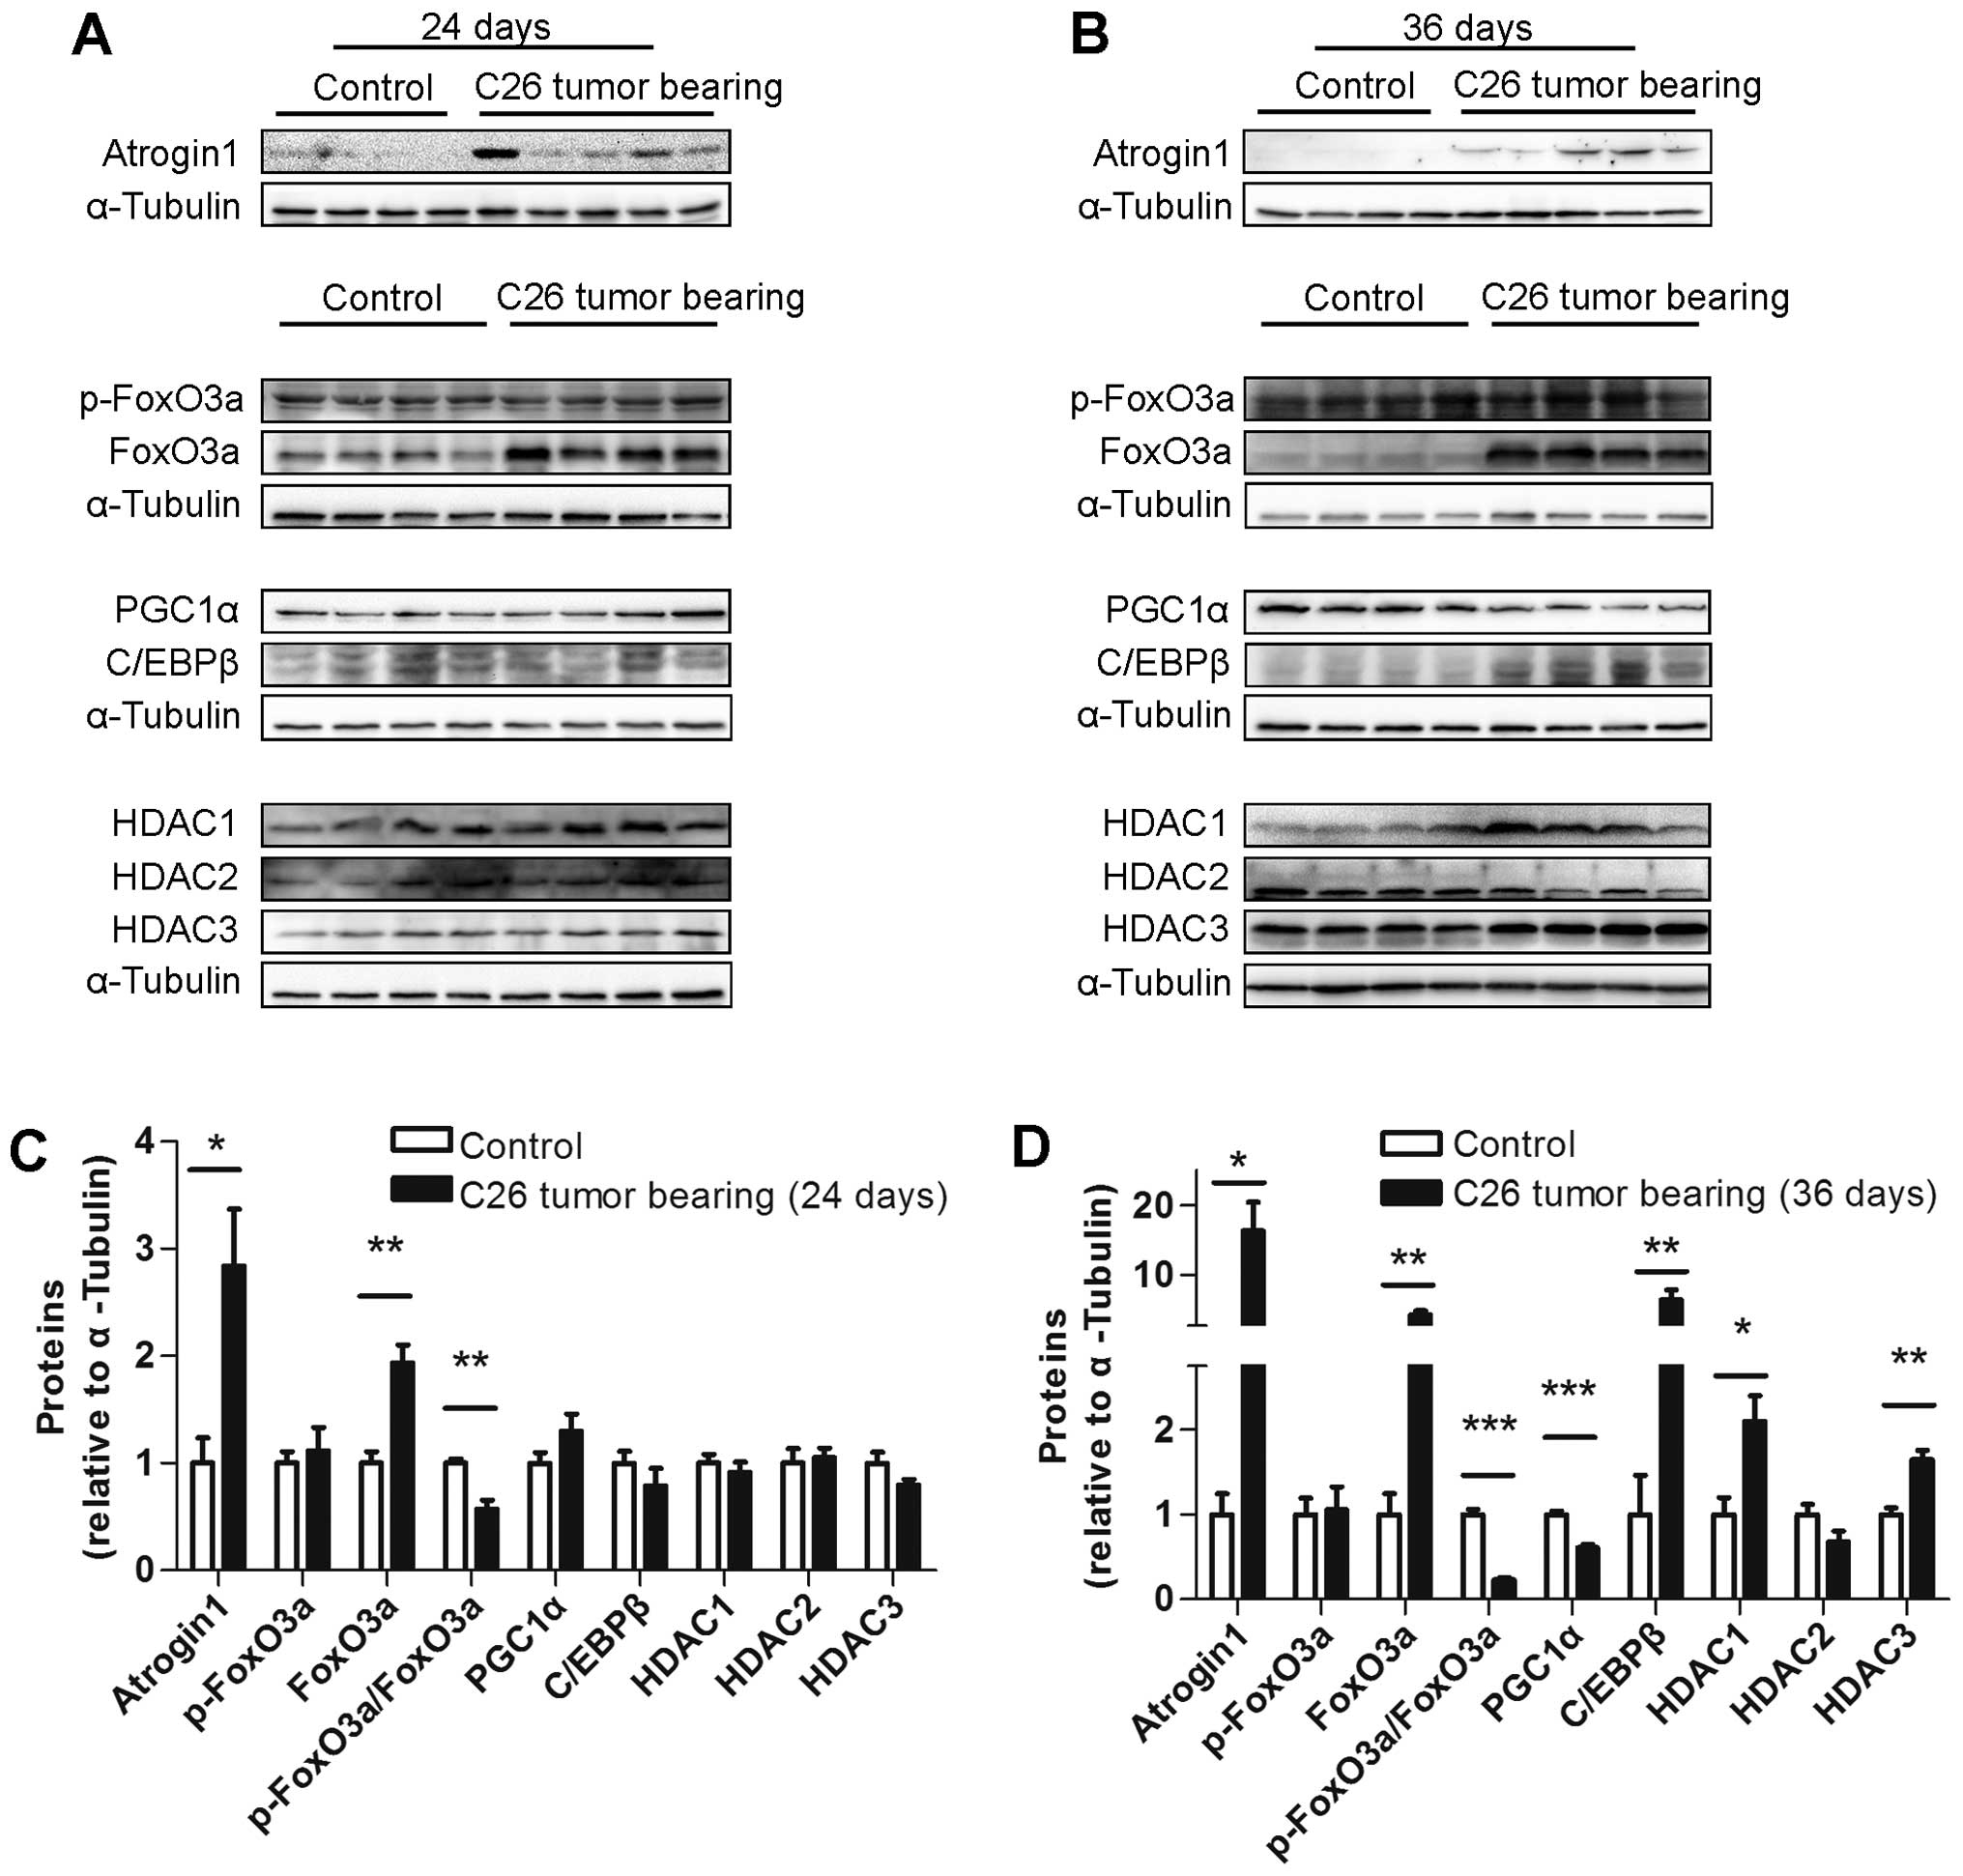
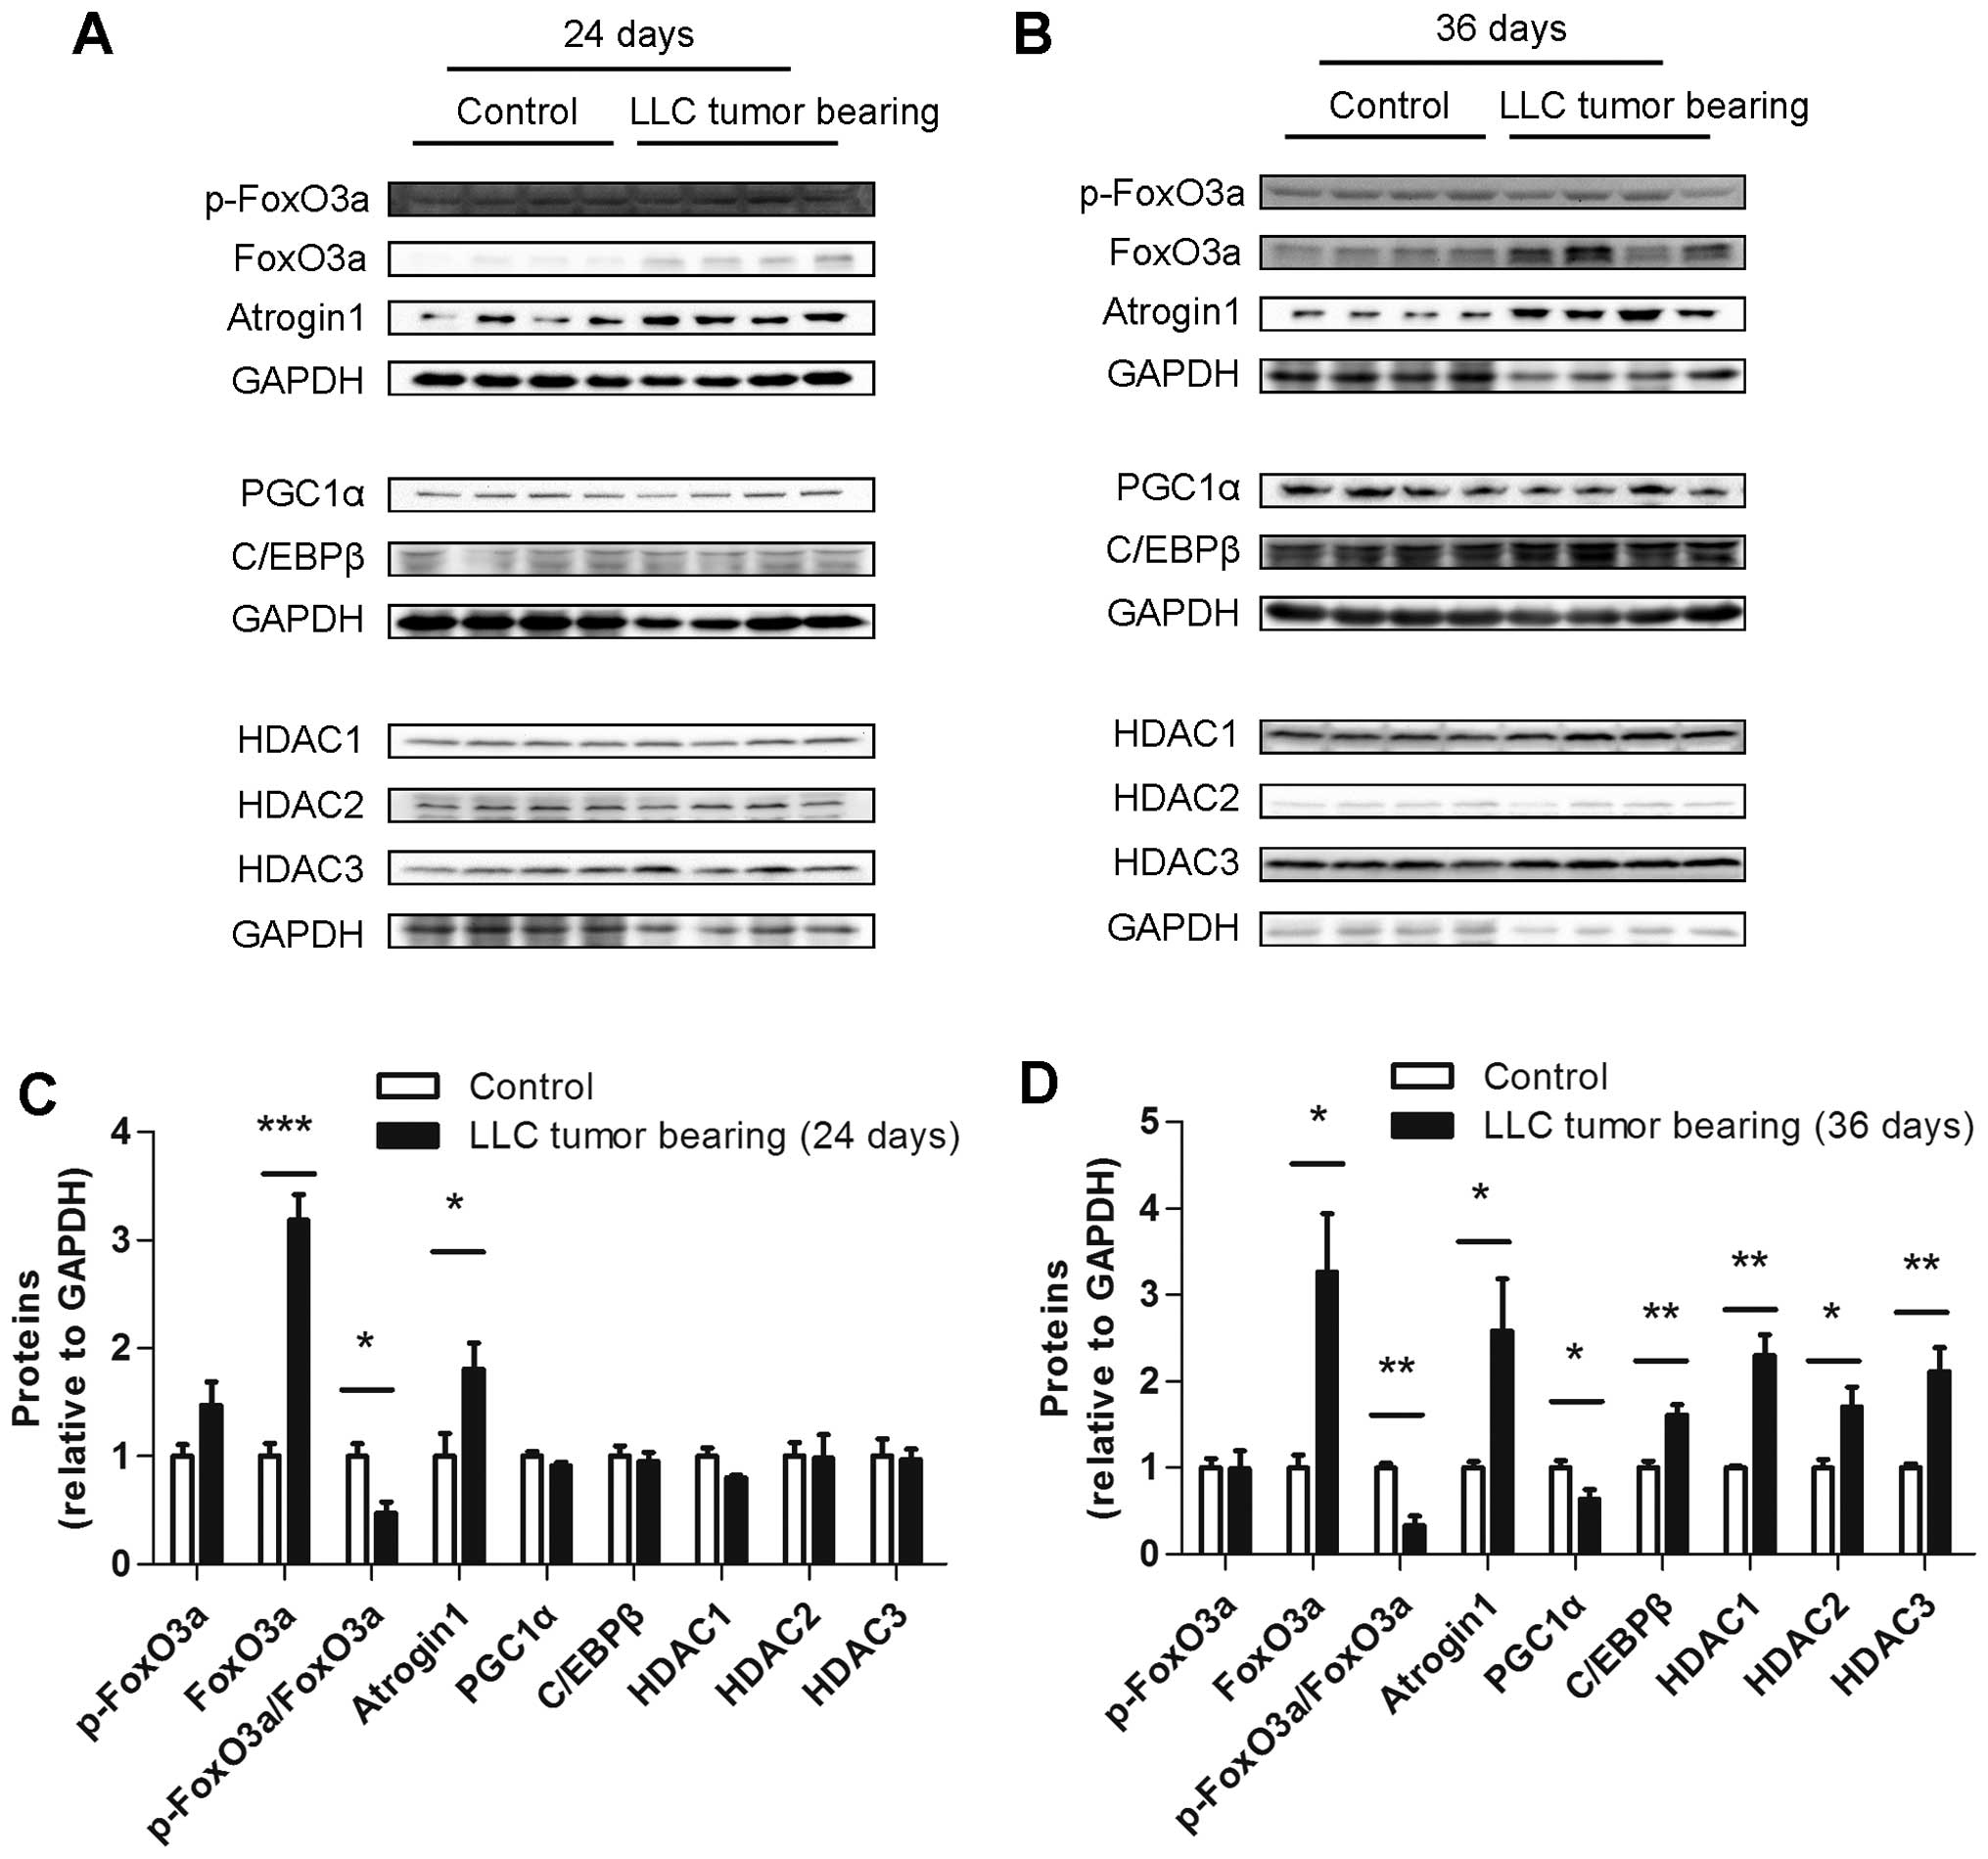
Several muscle protein levels differed
between the ECC and LCC mice
To explore the underlying mechanism of the increased
severity of cancer cachexia in the LCC mice compared with the ECC
mice, the protein levels of some crucial molecules involved in
muscle wasting, such as atrogin1, FoxO3a, PGC1α, C/EBPβ and class I
HDACs, were determined. The protein level of atrogin1 was increased
in the TB mice compared with their matched CN mice for both models
(Figs. 7 and 8). We subsequently detected the expression
of the molecules that may regulate the expression of atrogin1. The
FoxO3a (not phospho-FoxO3a) protein level was also found to be
increased in the muscles from the TB mice compared with their
matched CN mice for both models (Figs.
7 and 8). The PGC1α protein
level was obviously decreased in the LCC mice compared with the
LCC-CN mice, but no significant difference was observed between the
ECC and ECC-CN mice (Figs. 7 and
8). In contrast, the C/EBPβ protein
level was obviously increased in the LCC mice compared with the
LCC-CN mice, but no significant difference was detected between the
ECC and ECC-CN mice (Figs. 7 and
8).
Furthermore, the protein levels of three class I
HDACs were determined, and those of HDAC1 and HDAC3 were found to
be slightly increased in the LCC mice compared with the LCC-CN mice
for both models, while only HDAC2 was increased in the LLC model
LCC mice (Figs. 7 and 8).
Discussion
ECC and LCC definitions suitable for
the study of muscle wasting were determined
Cancer cachexia has been widely studied. A previous
report demonstrated that lipid metabolism in adipose tissue differs
between C26 model ECC and LCC mice. ECC was defined by the author
as occurring no more than 12 days following C26 tumor implantation,
when the white adipose tissue mass in cachectic mice is moderately
reduced (34–42%) and weight loss is <10% of the initial body
weight (54). Normally, loss of fat
always occurs before muscle wasting in cancer cachexia. Therefore,
in the present study, we prolonged the period defined as ECC for
the optimal assessment of muscle wasting. We found that this
definition was suitable for research of muscle wasting in the C26
and LLC models.
Muscle wasting in LCC should not be
overlooked
Prior to this study, many research groups focused on
muscle wasting only in ECC. Thus, we questioned whether the
molecules regulating muscle wasting in LCC are similar to those in
ECC. The aim of the present study was to determine the differences
between muscle wasting in ECC and LCC.
The tissue changes differed between
the ECC and LCC mice
The alterations in the tumor-free body masses, the
masses of various tissues and the cross-sectional areas (CSAs) of
muscle fibers differed between the ECC and LCC mice and their
matched CN mice. These results demonstrated that obvious
differences existed between ECC and LCC. From this point of view,
the definitions of ECC and LCC in the C26 and LLC models were also
feasible.
The expression changes differed
between the ECC and LCC mice
Myostatin plays an important role in many types of
muscle atrophy (19). However, its
mRNA level was only altered in the muscles from the LLC model LCC
mice. This result might indicate that the mRNA expression of
myostatin is not a sensitive indicator of muscle wasting in our
models, especially in the C26 model. Although the mRNA level of
myostatin did not obviously change, the expression of the
downstream molecule FoxO3a was altered. The protein level of FoxO3a
was increased in the TB mice of both models, and its mRNA level was
only increased in the LCC mice, but not in the ECC mice. Atrogin1
and MuRF1 are both important E3 ubiquitin ligases involved in
muscle wasting (28), but only the
mRNA level of atrogin1, and not that of MuRF1, was increased in our
models. In addition, the protein level of atrogin1 was increased in
the TB mice of both models. These results suggested that atrogin1
might be the more crucial gene involved in muscle wasting in our
models. The altered atrogin1 expression directly induced muscle
wasting in the TB mice, and no significant difference in its
expression was detected between the ECC and LCC mice. Collectively,
the myostatin-FoxO3a-atrogin1 axis indeed played an important role
in muscle wasting in our models.
Currently, increasing numbers of studies are
focusing on the molecules that affect the myostatin-FoxO3a-atrogin1
axis. We found that the molecules involved in muscle wasting were
not exactly the same in the ECC and LCC mice of each model. In
addition, we focused on the molecules that were altered only in the
muscles from the LCC mice. Although the mRNA level of PGC1α was not
altered in the TB mice, its protein level was decreased in the LCC
mice, but not in the ECC mice, of both models. These results
indicated that C/EBPβ, HDAC1 and HDAC3 might play roles in
promoting cancer cachexia, especially during the late stage.
Correspondingly, PGC1α might play an opposite role. As previously
reported, muscles from the TB mice had a higher level of
phosphorylated C/EBPβ, along with a modest increase in total
C/EBPβ, on day 14 for the LLC model (10,44).
In our opinion, the LLC model TB mice sacrificed on day 14 were the
ECC mice in this study. However, we measured the protein levels of
total C/EBPβ in the muscles from the ECC mice of both models and
found that they were not significantly different. This result is
consistent with the previous report. In addition, we showed that
the protein expression of HDAC1 was increased in muscles from the
LCC mice of both models. The change in HDAC3 expression was similar
to that in HDAC1 expression. In contrast, HDAC3 has been reported
to be decreased in dexamethasone-induced muscle wasting (47). Although this finding is not
consistent with our data, it suggests that HDAC3 is indeed involved
in muscle wasting and might have different roles in different
models. The role of PGC1α in protecting muscles from wasting has
been proven (35,40). In our experiment, this role might be
inhibited in both the C26 and LLC models.
miR-30c may play a role in LCC
mice
Many studies have verified that the levels of
microRNAs are altered in muscles from cancer cachectic mice. We
used different miRNA target-predicting algorithms (for example,
TargetScan and RegRNA) to identify potential miRNAs that could
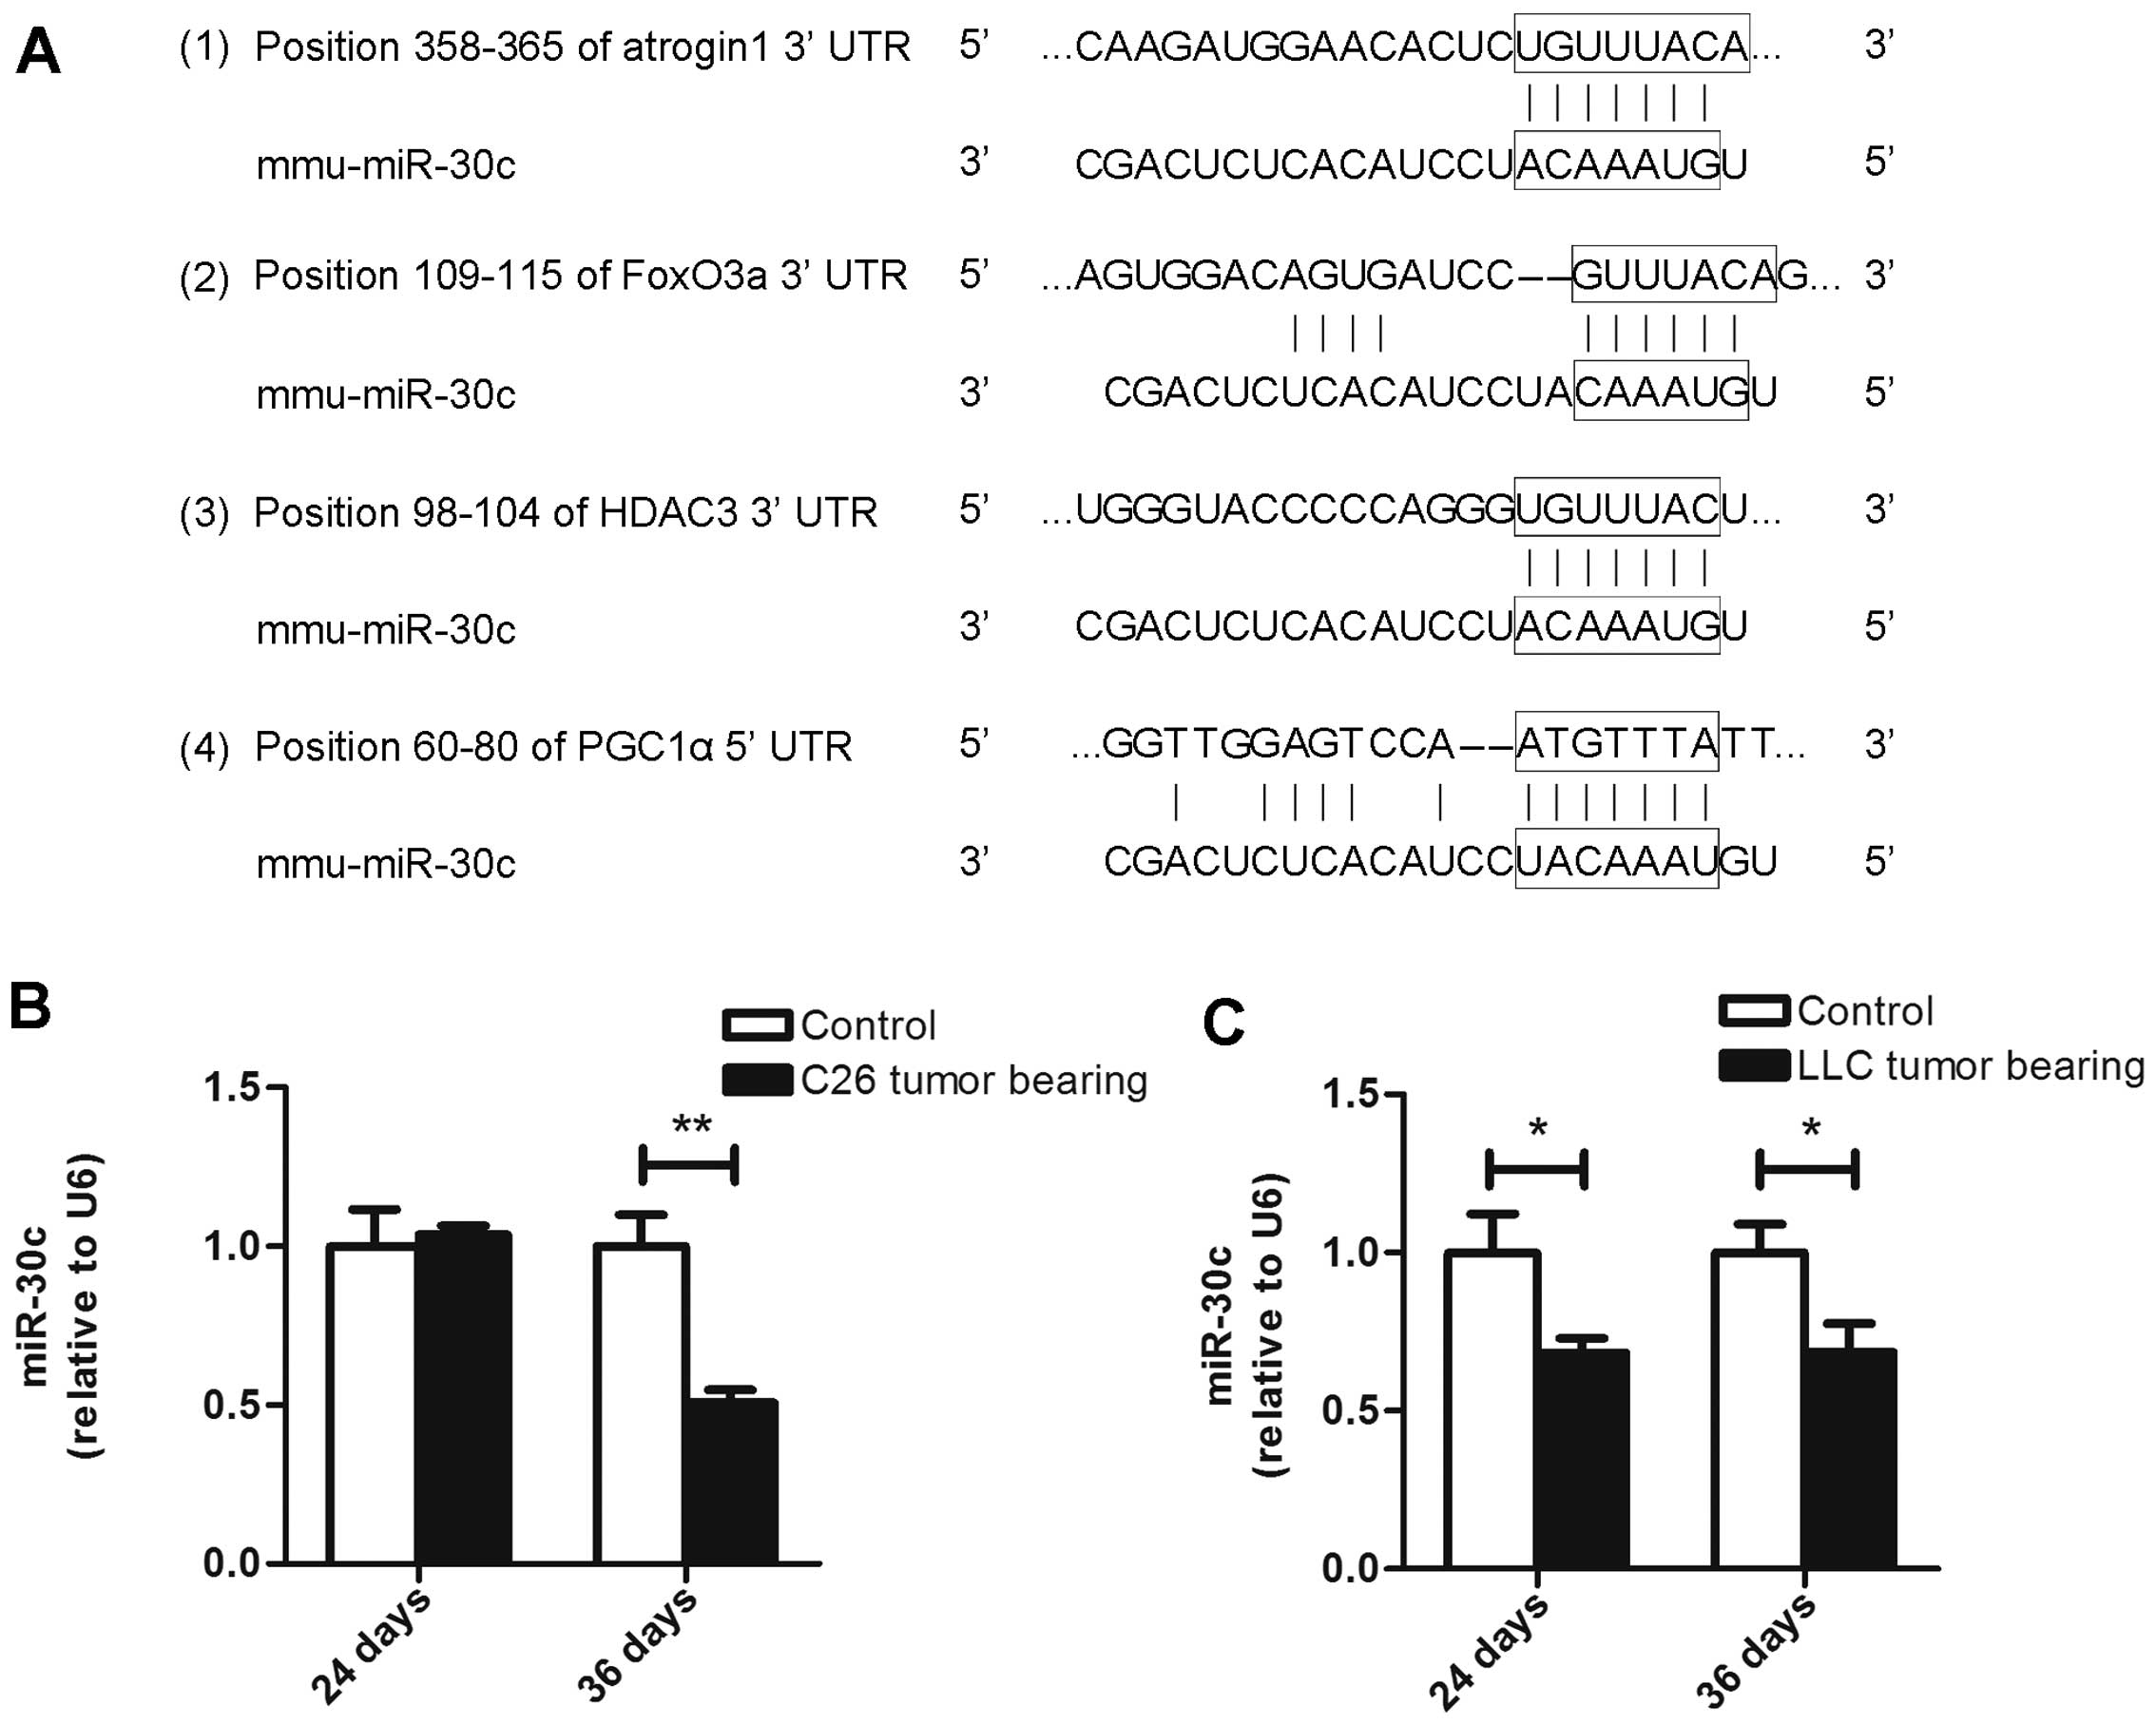
affect the aforementioned genes. We found conserved miR-30c sites
in the 3UTRs of atrogin1, FoxO3a and HDAC3 (Fig. 9A). Moreover, we found a conserved
miR-30c site in the 5UTR of PGC1α (Fig.
9A). Consequently, we observed that the miR-30c level was not
altered in muscles from the ECC mice of the C26 model but that it
was decreased in the LCC mice of both models (Fig. 9B and C). Our observations indicate
that miR-30c might be involved in the process of cancer cachexia by
interfering with the expression of PGC1α, atrogin1, FoxO3a and
HDAC3. Further research needs to be performed to determine whether
these genes are directly regulated by miR-30c.
Molecules with no change in ECC do not
necessarily indicate no effect on muscle wasting
By comparing the changes in the expression of
crucial molecules involved in muscle wasting in both the ECC and
LCC mice, we confirmed that some molecules exhibited varying
degrees of change in our models. Although the expression levels of
several other molecules did not obviously change in the ECC mice,
they were significantly altered in the LCC mice, such as PGC1α,
C/EBPβ and HDACs. However, it is still difficult to conclude that
these unchanged molecules do not play roles in the ECC mice. For
instance, the role of HDACs in muscle wasting has been realized in
recent years, and pharmacological interventions with HDAC
inhibitors have been shown to increase myofiber size and counter
the functional decline of dystrophic muscles (55). In addition, class II HDACs promote
neurogenic muscle atrophy by inducing E3 ubiquitin ligases
(56). These findings suggest that
HDACs might accelerate the process of muscle wasting induced by
cancer. A previous report has shown that the total protein level of
HDAC1 does not change in disused muscle but that the relative
abundance of HDAC1 is decreased in the nuclear fraction and
increased in the cytosol (49).
These data suggest that HDAC1 may shuttle out of the nucleus to
exert its function within the cytoplasm. In our models, the protein
level of HDAC1 was increased in the LCC mice, but not in the ECC
mice. This finding does not indicate that HDAC1 plays no role in
muscle wasting in ECC mice. The function of this molecule might
have been further enhanced when its level was increased in the LCC
mice.
In conclusion, our results have revealed that the
expression levels of several molecules are altered in muscles from
LCC mice, but not in those from ECC mice. From our results we
deduce that these changes may promote muscle wasting in late cancer
cachexia. The data in this study may facilitate the further
understanding of the underlying mechanism involved in the
development of cancer cachexia. However, our present study on
muscle wasting in late cancer cachexia merely sheds light on the
underlying mechanism, which remains poorly understood. Thus,
further investigation is warranted to delineate the foundation of
late cancer cachexia to provide a solid basis for the clinical
prediction and prevention of muscle wasting in cancer cachexia.
Acknowledgements
The present study was supported by the National
Natural Science Foundation of China (NSFC; grant no. 81272560), the
Open Research Foundation of the State Key Laboratory of Virology of
Wuhan University (grant no. 2014KF007), the Hubei Province
Scientific and Technical Project (grant no. 2011CDB366), and the
Hubei Provincial Health Project (grant no. WJ2015MB020) to H.Y. The
study was also supported by the National Natural Science Foundation
of China (grant nos. 30872924, 81072095 and 81372760), the Program
for New Century Excellent Talents in University from the Department
of Education of China (NCET-08-0223), and the National High
Technology Research and Development Program of China (863 Program)
(2012AA021101) to X.Z.
References
|
1
|
Argilés JM, Busquets S, Stemmler B and
López-Soriano FJ: Cancer cachexia: Understanding the molecular
basis. Nat Rev Cancer. 14:754–762. 2014. View Article : Google Scholar : PubMed/NCBI
|
|
2
|
Li B, Wan L, Li Y, Yu Q, Chen P, Gan R,
Yang Q, Han Y and Guo C: Baicalin, a component of Scutellaria
baicalensis, alleviates anorexia and inhibits skeletal muscle
atrophy in experimental cancer cachexia. Tumour Biol.
35:12415–12425. 2014. View Article : Google Scholar : PubMed/NCBI
|
|
3
|
Talbert EE, Metzger GA, He WA and
Guttridge DC: Modeling human cancer cachexia in colon 26
tumor-bearing adult mice. J Cachexia Sarcopenia Muscle. 5:321–328.
2014. View Article : Google Scholar : PubMed/NCBI
|
|
4
|
Cai D, Frantz JD, Tawa NE Jr, Melendez PA,
Oh BC, Lidov HG, Hasselgren PO, Frontera WR, Lee J, Glass DJ, et
al: IKKbeta/NF-kappaB activation causes severe muscle wasting in
mice. Cell. 119:285–298. 2004. View Article : Google Scholar : PubMed/NCBI
|
|
5
|
Acharyya S, Ladner KJ, Nelsen LL, Damrauer
J, Reiser PJ, Swoap S and Guttridge DC: Cancer cachexia is
regulated by selective targeting of skeletal muscle gene products.
J Clin Invest. 114:370–378. 2004. View Article : Google Scholar : PubMed/NCBI
|
|
6
|
Bonetto A, Aydogdu T, Jin X, Zhang Z, Zhan
R, Puzis L, Koniaris LG and Zimmers TA: JAK/STAT3 pathway
inhibition blocks skeletal muscle wasting downstream of IL-6 and in
experimental cancer cachexia. Am J Physiol Endocrinol Metab.
303:E410–E421. 2012. View Article : Google Scholar : PubMed/NCBI
|
|
7
|
Ham DJ, Murphy KT, Chee A, Lynch GS and
Koopman R: Glycine administration attenuates skeletal muscle
wasting in a mouse model of cancer cachexia. Clin Nutr. 33:448–458.
2014. View Article : Google Scholar : PubMed/NCBI
|
|
8
|
Bonetto A, Aydogdu T, Kunzevitzky N,
Guttridge DC, Khuri S, Koniaris LG and Zimmers TA: STAT3 activation
in skeletal muscle links muscle wasting and the acute phase
response in cancer cachexia. PLoS One. 6:e225382011. View Article : Google Scholar : PubMed/NCBI
|
|
9
|
Murphy KT, Chee A, Trieu J, Naim T and
Lynch GS: Importance of functional and metabolic impairments in the
characterization of the C-26 murine model of cancer cachexia. Dis
Model Mech. 5:533–545. 2012. View Article : Google Scholar : PubMed/NCBI
|
|
10
|
Zhang G, Jin B and Li YP: C/EBPβ mediates
tumour-induced ubiquitin ligase atrogin1/MAFbx upregulation and
muscle wasting. EMBO J. 30:4323–4335. 2011. View Article : Google Scholar : PubMed/NCBI
|
|
11
|
Busquets S, Toledo M, Orpí M, Massa D,
Porta M, Capdevila E, Padilla N, Frailis V, López-Soriano FJ, Han
HQ, et al: Myostatin blockage using actRIIB antagonism in mice
bearing the Lewis lung carcinoma results in the improvement of
muscle wasting and physical performance. J Cachexia Sarcopenia
Muscle. 3:37–43. 2012. View Article : Google Scholar : PubMed/NCBI
|
|
12
|
Ruas JL, White JP, Rao RR, Kleiner S,
Brannan KT, Harrison BC, Greene NP, Wu J, Estall JL, Irving BA, et
al: A PGC-1α isoform induced by resistance training regulates
skeletal muscle hypertrophy. Cell. 151:1319–1331. 2012. View Article : Google Scholar : PubMed/NCBI
|
|
13
|
Reed SA, Sandesara PB, Senf SM and Judge
AR: Inhibition of FoxO transcriptional activity prevents muscle
fiber atrophy during cachexia and induces hypertrophy. FASEB J.
26:987–1000. 2012. View Article : Google Scholar : PubMed/NCBI
|
|
14
|
Puppa MJ, Gao S, Narsale AA and Carson JA:
Skeletal muscle glycoprotein 130s role in Lewis lung
carcinoma-induced cachexia. FASEB J. 28:998–1009. 2014. View Article : Google Scholar : PubMed/NCBI
|
|
15
|
He SS, Wu QJ, Gong CY, Luo ST, Zhang S, Li
M, Lu L, Wei YQ and Yang L: Enhanced efficacy of combination
therapy with adeno-associated virus-delivered pigment
epithelium-derived factor and cisplatin in a mouse model of Lewis
lung carcinoma. Mol Med Rep. 9:2069–2076. 2014.PubMed/NCBI
|
|
16
|
Wang H, Lai YJ, Chan YL, Li TL and Wu CJ:
Epigallocatechin-3-gallate effectively attenuates skeletal muscle
atrophy caused by cancer cachexia. Cancer Lett. 305:40–49. 2011.
View Article : Google Scholar : PubMed/NCBI
|
|
17
|
Fearon KC, Glass DJ and Guttridge DC:
Cancer cachexia: Mediators, signaling, and metabolic pathways. Cell
Metab. 16:153–166. 2012. View Article : Google Scholar : PubMed/NCBI
|
|
18
|
Johns N, Stephens NA and Fearon KC: Muscle
wasting in cancer. Int J Biochem Cell Biol. 45:2215–2229. 2013.
View Article : Google Scholar : PubMed/NCBI
|
|
19
|
McPherron AC, Lawler AM and Lee SJ:
Regulation of skeletal muscle mass in mice by a new TGF-beta
superfamily member. Nature. 387:83–90. 1997. View Article : Google Scholar : PubMed/NCBI
|
|
20
|
Padrão AI, Oliveira P, Vitorino R, Colaço
B, Pires MJ, Márquez M, Castellanos E, Neuparth MJ, Teixeira C,
Costa C, et al: Bladder cancer-induced skeletal muscle wasting:
Disclosing the role of mitochondria plasticity. Int J Biochem Cell
Biol. 45:1399–1409. 2013. View Article : Google Scholar : PubMed/NCBI
|
|
21
|
Padrão AI, Moreira-Gonçalves D, Oliveira
PA, Teixeira C, Faustino-Rocha AI, Helguero L, Vitorino R, Santos
LL, Amado F, Duarte JA, et al: Endurance training prevents TWEAK
but not myostatin-mediated cardiac remodelling in cancer cachexia.
Arch Biochem Biophys. 567:13–21. 2015. View Article : Google Scholar : PubMed/NCBI
|
|
22
|
Gallot YS, Durieux AC, Castells J,
Desgeorges MM, Vernus B, Plantureux L, Rémond D, Jahnke VE, Lefai
E, Dardevet D, et al: Myostatin gene inactivation prevents skeletal
muscle wasting in cancer. Cancer Res. 74:7344–7356. 2014.
View Article : Google Scholar : PubMed/NCBI
|
|
23
|
Han HQ, Zhou X, Mitch WE and Goldberg AL:
Myostatin/activin pathway antagonism: Molecular basis and
therapeutic potential. Int J Biochem Cell Biol. 45:2333–2347. 2013.
View Article : Google Scholar : PubMed/NCBI
|
|
24
|
Zhou X, Wang JL, Lu J, Song Y, Kwak KS,
Jiao Q, Rosenfeld R, Chen Q, Boone T, Simonet WS, et al: Reversal
of cancer cachexia and muscle wasting by ActRIIB antagonism leads
to prolonged survival. Cell. 142:531–543. 2010. View Article : Google Scholar : PubMed/NCBI
|
|
25
|
Lokireddy S, Wijesoma IW, Bonala S, Wei M,
Sze SK, McFarlane C, Kambadur R and Sharma M: Myostatin is a novel
tumoral factor that induces cancer cachexia. Biochem J. 446:23–36.
2012. View Article : Google Scholar : PubMed/NCBI
|
|
26
|
Ramaswamy S, Nakamura N, Sansal I,
Bergeron L and Sellers WR: A novel mechanism of gene regulation and
tumor suppression by the transcription factor FKHR. Cancer Cell.
2:81–91. 2002. View Article : Google Scholar : PubMed/NCBI
|
|
27
|
Sandri M, Sandri C, Gilbert A, Skurk C,
Calabria E, Picard A, Walsh K, Schiaffino S, Lecker SH and Goldberg
AL: Foxo transcription factors induce the atrophy-related ubiquitin
ligase atrogin-1 and cause skeletal muscle atrophy. Cell.
117:399–412. 2004. View Article : Google Scholar : PubMed/NCBI
|
|
28
|
Bodine SC, Latres E, Baumhueter S, Lai VK,
Nunez L, Clarke BA, Poueymirou WT, Panaro FJ, Na E, Dharmarajan K,
et al: Identification of ubiquitin ligases required for skeletal
muscle atrophy. Science. 294:1704–1708. 2001. View Article : Google Scholar : PubMed/NCBI
|
|
29
|
Gomes MD, Lecker SH, Jagoe RT, Navon A and
Goldberg AL: Atrogin-1, a muscle-specific F-box protein highly
expressed during muscle atrophy. Proc Natl Acad Sci USA.
98:14440–14445. 2001. View Article : Google Scholar : PubMed/NCBI
|
|
30
|
Cohen S, Nathan JA and Goldberg AL: Muscle
wasting in disease: Molecular mechanisms and promising therapies.
Nat Rev Drug Discov. 14:58–74. 2015. View Article : Google Scholar : PubMed/NCBI
|
|
31
|
Wang DT, Yang YJ, Huang RH, Zhang ZH and
Lin X: Myostatin activates the ubiquitin-proteasome and
autophagy-lysosome systems contributing to muscle wasting in
chronic kidney disease. Oxid Med Cell Longev. 2015:6849652015.
View Article : Google Scholar : PubMed/NCBI
|
|
32
|
Attaix D, Ventadour S, Codran A, Béchet D,
Taillandier D and Combaret L: The ubiquitin-proteasome system and
skeletal muscle wasting. Essays Biochem. 41:173–186. 2005.
View Article : Google Scholar : PubMed/NCBI
|
|
33
|
Taillandier D, Combaret L, Pouch MN,
Samuels SE, Béchet D and Attaix D: The role of
ubiquitin-proteasome-dependent proteolysis in the remodelling of
skeletal muscle. Proc Nutr Soc. 63:357–361. 2004. View Article : Google Scholar : PubMed/NCBI
|
|
34
|
Lokireddy S, Wijesoma IW, Sze SK,
McFarlane C, Kambadur R and Sharma M: Identification of
atrogin-1-targeted proteins during the myostatin-induced skeletal
muscle wasting. Am J Physiol Cell Physiol. 303:C512–C529. 2012.
View Article : Google Scholar : PubMed/NCBI
|
|
35
|
Sandri M, Lin J, Handschin C, Yang W,
Arany ZP, Lecker SH, Goldberg AL and Spiegelman BM: PGC-1alpha
protects skeletal muscle from atrophy by suppressing FoxO3 action
and atrophy-specific gene transcription. Proc Natl Acad Sci USA.
103:16260–16265. 2006. View Article : Google Scholar : PubMed/NCBI
|
|
36
|
Esterbauer H, Oberkofler H, Krempler F and
Patsch W: Human peroxisome proliferator activated receptor gamma
coactivator 1 (PPARGC1) gene: cDNA sequence, genomic organization,
chromosomal localization, and tissue expression. Genomics.
62:98–102. 1999. View Article : Google Scholar : PubMed/NCBI
|
|
37
|
Puigserver P: Tissue-specific regulation
of metabolic pathways through the transcriptional coactivator
PGC1-alpha. Int J Obes. 29:(Suppl 1). S5–S9. 2005. View Article : Google Scholar
|
|
38
|
Brault JJ, Jespersen JG and Goldberg AL:
Peroxisome proliferator-activated receptor gamma coactivator 1alpha
or 1beta overexpression inhibits muscle protein degradation,
induction of ubiquitin ligases, and disuse atrophy. J Biol Chem.
285:19460–19471. 2010. View Article : Google Scholar : PubMed/NCBI
|
|
39
|
Cannavino J, Brocca L, Sandri M,
Bottinelli R and Pellegrino MA: PGC1-α over-expression prevents
metabolic alterations and soleus muscle atrophy in hindlimb
unloaded mice. J Physiol. 592:4575–4589. 2014. View Article : Google Scholar : PubMed/NCBI
|
|
40
|
Wenz T, Rossi SG, Rotundo RL, Spiegelman
BM and Moraes CT: Increased muscle PGC-1alpha expression protects
from sarcopenia and metabolic disease during aging. Proc Natl Acad
Sci USA. 106:20405–20410. 2009. View Article : Google Scholar : PubMed/NCBI
|
|
41
|
Ramji DP and Foka P:
CCAAT/enhancer-binding proteins: Structure, function and
regulation. Biochem J. 365:561–575. 2002. View Article : Google Scholar : PubMed/NCBI
|
|
42
|
Allen DL, Bandstra ER, Harrison BC, Thorng
S, Stodieck LS, Kostenuik PJ, Morony S, Lacey DL, Hammond TG,
Leinwand LL, et al: Effects of spaceflight on murine skeletal
muscle gene expression. J Appl Physiol (1985). 106:582–595. 2009.
View Article : Google Scholar : PubMed/NCBI
|
|
43
|
Penner G, Gang G, Sun X, Wray C and
Hasselgren PO: C/EBP DNA-binding activity is upregulated by a
glucocorticoid-dependent mechanism in septic muscle. Am J Physiol
Regul Integr Comp Physiol. 282:R439–R444. 2002. View Article : Google Scholar : PubMed/NCBI
|
|
44
|
Zhang G and Li YP: p38β MAPK upregulates
atrogin1/MAFbx by specific phosphorylation of C/EBPβ. Skelet
Muscle. 2:202012. View Article : Google Scholar : PubMed/NCBI
|
|
45
|
McKinsey TA, Zhang CL and Olson EN:
Control of muscle development by dueling HATs and HDACs. Curr Opin
Genet Dev. 11:497–504. 2001. View Article : Google Scholar : PubMed/NCBI
|
|
46
|
Alamdari N, Aversa Z, Castillero E and
Hasselgren PO: Acetylation and deacetylation - novel factors in
muscle wasting. Metabolism. 62:1–11. 2013. View Article : Google Scholar : PubMed/NCBI
|
|
47
|
Yang H, Wei W, Menconi M and Hasselgren
PO: Dexamethasone-induced protein degradation in cultured myotubes
is p300/HAT dependent. Am J Physiol Regul Integr Comp Physiol.
292:R337–R334. 2007. View Article : Google Scholar : PubMed/NCBI
|
|
48
|
Demos-Davies KM, Ferguson BS, Cavasin MA,
Mahaffey JH, Williams SM, Spiltoir JI, Schuetze KB, Horn TR, Chen
B, Ferrara C, et al: HDAC6 contributes to pathological responses of
heart and skeletal muscle to chronic angiotensin-II signaling. Am J
Physiol Heart Circ Physiol. 307:H252–H258. 2014. View Article : Google Scholar : PubMed/NCBI
|
|
49
|
Beharry AW, Sandesara PB, Roberts BM,
Ferreira LF, Senf SM and Judge AR: HDAC1 activates FoxO and is both
sufficient and required for skeletal muscle atrophy. J Cell Sci.
127:1441–1453. 2014. View Article : Google Scholar : PubMed/NCBI
|
|
50
|
Greco S, De Simone M, Colussi C,
Zaccagnini G, Fasanaro P, Pescatori M, Cardani R, Perbellini R,
Isaia E, Sale P, et al: Common micro-RNA signature in skeletal
muscle damage and regeneration induced by Duchenne muscular
dystrophy and acute ischemia. FASEB J. 23:3335–3346. 2009.
View Article : Google Scholar : PubMed/NCBI
|
|
51
|
Guess MG, Barthel KK, Harrison BC and
Leinwand LA: miR-30 family microRNAs regulate myogenic
differentiation and provide negative feedback on the microRNA
pathway. PLoS One. 10:e01182292015. View Article : Google Scholar : PubMed/NCBI
|
|
52
|
Cavallo F, Calogero RA and Forni G: Are
oncoantigens suitable targets for anti-tumour therapy? Nat Rev
Cancer. 7:707–713. 2007. View Article : Google Scholar : PubMed/NCBI
|
|
53
|
Das SK, Eder S, Schauer S, Diwoky C,
Temmel H, Guertl B, Gorkiewicz G, Tamilarasan KP, Kumari P, Trauner
M, et al: Adipose triglyceride lipase contributes to
cancer-associated cachexia. Science. 333:233–238. 2011. View Article : Google Scholar : PubMed/NCBI
|
|
54
|
Kliewer KL, Ke JY, Tian M, Cole RM,
Andridge RR and Belury MA: Adipose tissue lipolysis and energy
metabolism in early cancer cachexia in mice. Cancer Biol Ther.
2014.PubMed/NCBI
|
|
55
|
Minetti GC, Colussi C, Adami R, Serra C,
Mozzetta C, Parente V, Fortuni S, Straino S, Sampaolesi M, Di
Padova M, et al: Functional and morphological recovery of
dystrophic muscles in mice treated with deacetylase inhibitors. Nat
Med. 12:1147–1150. 2006. View
Article : Google Scholar : PubMed/NCBI
|
|
56
|
Moresi V, Williams AH, Meadows E, Flynn
JM, Potthoff MJ, McAnally J, Shelton JM, Backs J, Klein WH,
Richardson JA, et al: Myogenin and class II HDACs control
neurogenic muscle atrophy by inducing E3 ubiquitin ligases. Cell.
143:35–45. 2010. View Article : Google Scholar : PubMed/NCBI
|