Introduction
Clear cell renal cell carcinoma (ccRCC) is the most
common histological subtype of kidney cancer in adults (70–75% of
cases) (1). Approximately 30% of
early-stage patients develop metastases after surgery for localized
disease (2). This carcinoma is
histologically characterized by the presence of clear and abundant
cytoplasm (2,3). The aggressive characteristics of renal
clear cell carcinoma interfere in the efficiency of conventional
treatment approaches, such as chemotherapy and radiotherapy
(4).
Mutations or deletions associated with tumor
suppressor genes may cause the loss or inactivation of these
negative regulators. However, the loss of function may be caused by
epigenetic changes (5), including
acetylation, methylation, phosphorylation, ubiquitinylation,
sumoylation, carbonylation and regulation of microRNAs (6). Epigenetic alterations occur at a high
frequency, are reversible upon treatment with pharmacological
agents and arise at defined regions within a gene (7,8). These
features make epigenetics a very attractive field for cancer
detection and several studies have shown multiple genes with
different types of epigenetic alterations in tumor tissue (9–11).
Analyzing the gene expression and regulatory
mechanisms in tumor samples has shown great efficiency in providing
new information on signaling pathway activation of several
processes, such as evasion of apoptosis, angiogenesis and
metastatic potential.
The occludin (OCLN) gene, responsible for
producing the protein occludin, is known to be present in all the
tight junctions (TJs). TJ formation and expression has been
described as a hallmark of epithelial cells and their subsequent
loss from cancer cells tends to be considered as a direct effect of
epithelial-mesenchymal transition (EMT) (12). Furthermore, occludin is structurally
connected to the TGF-β receptor contributing to essential changes
in EMT cell phenotype (13).
Growth arrest-specific 1 (GAS1) gene is
associated with cell arrest and the protein is linked to the outer
cell membrane by a glycosyl phosphatydylinositol. GAS1 protein
binds to Hedgehog ligands for the potentiation of Hedgehog
signaling (14).
Solute carrier family 2 member 1 (SLC2A1)
gene encodes the solute carrier family 2 facilitated glucose
transporter member 1 protein essential for cellular energy
metabolism pathways (15–17). This protein is able to develop
bidirectional flow of glucose according to the gradient of the
substrate. The overexpression of the SLC2A1 protein has been found
to be involved in increased uptake of glucose in human breast
adenocarcinoma cell lines (18).
In the present study, we selected genes described in
the literature related to cellular differentiation and
proliferation. We analyzed their expression by quantitative PCR
(qPCR) and immunohistochemistry, and examined the possible
epigenetic mechanisms that regulate genes in ccRCC samples and cell
lines. OCLN and GAS1 were underexpressed in ccRCC and
miR-122 and miR-34a may regulate their expression in this type of
cancer. Furthermore, we showed by qPCR and immunohistochemistry
that SLC2A1 was significantly overexpressed in ccRCC
samples. These genes may be involved in the molecular biology and
development of the disease and analysis of them may contribute to
insights for new prognoses, treatments and understanding this type
of tumor.
Materials and methods
ccRCC samples
The samples were collected from 101 patients
diagnosed with ccRCC, including 45 fresh samples of ccRCC, 56
paraffin-embedded samples of ccRCC, 2 fresh-frozen histologically
healthy renal tissue and 24 paraffin-embedded samples of
histologically healthy renal tissues, all of which were confirmed
by pathologists (Tables I and
II). The samples were obtained
from the Hospital de Base at Faculdade de Medicina de São José do
Rio Preto (Sao Paulo, Brazil). The use of patient-derived material
was approved by the Research Ethics Committee of the IBILCE-UNESP
and FAMERP (Sao Paulo, Brazil) and written consent was obtained
from all the patients. Tissues were obtained from patients
undergoing tumor resection surgery, and a diagnosis of ccRCC was
determined post-operatively using histopathology. The samples were
classified according to the criteria provided by the International
Union against Cancer (19).
 | Table I.Epidemiological and
clinicopathological characteristics of the patients diagnosed with
ccRCC (fresh samples). |
Table I.
Epidemiological and
clinicopathological characteristics of the patients diagnosed with
ccRCC (fresh samples).
| Sample | Gender | Age (years) | Alcohol | Smoking | TNM |
|---|
| F1 | M | 58 | No | No | T1N1M1 |
| F2 | F | 39 | No | No | T2N0M0 |
| F3 | F | 71 | No | No | T4N0M1 |
| F4 | F | 64 | No | No | T2N0M0 |
| F5 | M | 46 | No | No | T1bN0M0 |
| F6 | M | 70 | No | No | T2N0M0 |
| F7 | M | 70 | Yes | Yes | T3aN0M0 |
| F8 | F | 58 | Yes | Yes | T3N3M1 |
| F9 | M | 36 | No | No | T1aN0M0 |
| F10 | M | 48 | Yes | No | T2N0M0 |
| F11 | M | 52 | No | No | T3aN0M0 |
| F12 | F | 62 | No | No | T1aN0M0 |
| F13 | M | 75 | No | Yes | T1N0M0 |
| F14 | F | 49 | No | No | T1bN0M0 |
| F15 | F | 71 | No | No | T1N0M0 |
| F16 | F | 79 | No | No | T1aN0M0 |
| F17 | F | 29 | No | No | T2N0M0 |
| F18 | M | 70 | No | No | T2N0M0 |
| F19 | M | 39 | No | Yes | T2N0M0 |
| F20 | M | 66 | Yes | No | T2N0M0 |
| F21 | M | 77 | No | No | T2N0M1 |
| F22 | F | 23 | No | No | T2N0M0 |
| F23 | F | 53 | No | No | T2N0M0 |
| F24 | M | 69 | No | No | T3N0M0 |
| F25 | F | 60 | No | No | T3bN0M1 |
| F26 | F | 79 | No | No | T3aN0M0 |
| F27 | F | 59 | No | No | T2N0M0 |
| F28 | F | 64 | No | No | T1N0M0 |
| F29 | M | 53 | Yes | No | T2N0M0 |
| F30 | M | 56 | Yes | No | T1N1M1 |
| F31 | M | 54 | No | No | T2N0M0 |
| F32 | M | 52 | Yes | No | T1aN0M0 |
| F33 | M | 67 | Yes | No | T1aN0M0 |
| F34 | M | 41 | No | Yes | T1N0M0 |
| F35 | F | 55 | No | No | T3aN2M1 |
| F36 | F | 52 | Yes | Yes | T3aNxMx |
| F37 | F | 25 | No | Yes | NI |
| F38 | M | 56 | No | No | T1bN0Mx |
| F39 | F | 83 | No | No | T1N0M0 |
| F40 | M | 68 | Yes | Yes | NI |
| F41 | F | 71 | No | Yes | T1bNxMx |
| F42 | M | 73 | No | Yes | T3NxM1 |
| F43 | M | 63 | Yes | No | T3aN0M0 |
| F44 | M | 62 | Yes | Yes | NI |
| F45 | M | 39 | Yes | No | T2NxM0 |
| Table II.Epidemiological and
clinicopathological characteristics of the patients diagnosed with
ccRCC (paraffin-embedded samples). |
Table II.
Epidemiological and
clinicopathological characteristics of the patients diagnosed with
ccRCC (paraffin-embedded samples).
| Sample | Gender | Age (years) | Alcohol | Smoking | TNM |
| P1 | M | 80 | No | No | T4N1M1 |
| P2 | M | 50 | No | No | T2N0M0 |
| P3 | M | 61 | No | No | T3bN0M0 |
| P4 | F | 69 | No | No | T1bN0M0 |
| P5 | M | 52 | No | Yes | T2N0M0 |
| P6 | M | 88 | No | Yes | T2N0M0 |
| P7 | M | 60 | No | No | T1bN0M0 |
| P8 | M | 58 | No | No | T1bN1M1 |
| P9 | M | 71 | No | Yes | T1N0M0 |
| P10 | M | 56 | No | No | T3bN0M1 |
| P11 | M | 77 | No | No | T2N1M1 |
| P12 | F | 32 | Yes | No | T1aN0M0 |
| P13 | M | 68 | No | No | T3bN0M0 |
| P14 | M | 83 | Yes | Yes | T2N0M1 |
| P15 | F | 65 | No | No | T2N0M0 |
| P16 | F | 54 | No | No | T1bN0M0 |
| P17 | M | 44 | NI | NI | NI |
| P18 | M | 65 | No | No | T3aN0M1 |
| P19 | F | 72 | No | Yes | T2N0M1 |
| P20 | F | 60 | No | No | T2N0M0 |
| P21 | M | 77 | No | No | T1bN0M0 |
| P22 | M | 52 | No | No | T1bN0M0 |
| P23 | M | 74 | No | No | T3aN0M1 |
| P24 | M | 75 | No | No | T2N0M0 |
| P25 | M | 78 | No | No | T2N0M0 |
| P26 | F | 66 | No | No | T2N0M0 |
| P27 | M | 64 | No | No | T1bN0M0 |
| P28 | M | 67 | Yes | Yes | T2N0M0 |
| P29 | M | 49 | No | No | T2N0M0 |
| P30 | F | 58 | No | No | T1bN0M0 |
| P31 | M | 84 | No | Yes | T1bN0M0 |
| P32 | F | 48 | No | Yes | T2N0M0 |
| P33 | F | 55 | No | No | T1bN0M0 |
| P34 | F | 50 | No | No | T2N0M0 |
| P35 | F | 46 | No | No | T1aN0M0 |
| P36 | M | 43 | No | No | T2N0M0 |
| P37 | F | 54 | No | Yes | T3aN0M0 |
| P38 | F | 86 | No | Yes | T3N0M0 |
| P39 | M | 51 | No | No | T2N0M0 |
| P40 | M | 74 | No | No | T2N0M0 |
| P41 | F | 51 | No | Yes | T1aN0M0 |
| P42 | M | 63 | Yes | Yes | T3aN0M0 |
| P43 | M | 56 | No | No | T2N0M0 |
| P44 | F | 76 | No | Yes | T1bNxMx |
| P45 | M | 70 | No | Yes | T1aNxMx |
| P46 | M | 58 | No | No | T1bN0M0 |
| P47 | M | 56 | No | No | T1bN0M0 |
| P48 | M | 76 | No | No | T3N0M0 |
| P49 | F | 61 | No | No | NI |
| P50 | M | 81 | Yes | No | NI |
| P51 | M | 76 | Yes | Yes | T2N0M0 |
| P52 | F | 72 | No | No | T1N0M0 |
| P53 | F | 79 | No | No | T2N0M0 |
| P54 | M | 59 | No | Yes | T2N0M0 |
| P55 | M | 46 | No | No | T2N0M1 |
| P56 | F | 89 | No | Yes | T1N0M0 |
Cell lines and treatments
The 786-O (primary clear cell adenocarcinoma) cell
line was obtained from the American Type Culture Collection (ATCC;
Manassas, VA, USA) and HaCaT (an immortal human keratinocyte cell
line) was kindly provided by Luisa Lina Villa (Department of
Radiology, Center of Translational Oncology Investigation, São
Paulo State Cancer Institute, Universidade de São Paulo, Brazil).
786-O cells were cultured in RPMI-1640 medium, and HaCaT cells were
cultured in Dulbeccos modified Eagles medium (DMEM) (both from
Gibco by Life Technologies, Grand Island, NY, USA). The media were
supplemented with 10% fetal bovine serum (Cultilab, Sao Paulo,
Brazil), 100 U/ml of penicillin and 100 µg/ml of streptomycin (both
from Invitrogen, Grand Island, NY, USA). Cell cultures were grown
at 37°C in a 5% CO2 atmosphere. 786-O cells were plated
into 6-well plates, cultured for 24 h, and treated for 72 h with
fresh 5, 2 or 1 µM of 5-Aza-dC (Sigma-Aldrich, St. Louis, MO, USA)
dissolved in phosphate-buffered saline. Due to its chemical
instability, fresh medium with 5-Aza-dC was added every 24 h. For
the trichostatin A (TSA) experiments, the cells were seeded in
6-well plates, cultured for 24 h, and treated for 24 h with fresh
1,000, 500, 300, 200 or 100 nM of TSA (Sigma-Aldrich) dissolved in
dimethyl sulfoxide (DMSO). To assess the combined effect of both
drugs, we performed the co-treatment of cells with 5 µM of 5-Aza-dC
and 1,000 nM of TSA using the following protocol: 5-Aza-dC was
added for 72 h, after which it was removed and TSA was added for an
additional 24 h. All experiments were performed in triplicate.
Cytotoxicity assay
786-O cells were seeded into 96-well plates at a
density of 103 cells for 5-Aza-dC treatment,
104 cells for TSA and 5×10³ cells for
co-treatment. After the 5-Aza-dC and TSA treatments, 1 mg/ml of
3-(4,5-dimethylthiazol-2-yl)-2,5-diphenyltetrazolium bromide (MTT)
(Sigma-Aldrich) was added to each well and incubated for 30 min at
37°C. Then, the MTT was removed and 100 µl of 100% DMSO
(Sigma-Aldrich) was added to each well and the absorbance was
measured at 562 nm. Each experiment was performed in triplicate and
in 2 independent assays.
RNA and DNA extraction
Genomic DNA and total RNA extraction were performed
using TRIzol® reagent (Life Technologies) using both
cell lines, the 45 fresh samples of ccRCC and 2 fresh-frozen
histologically healthy renal tissue samples, following the
manufacturer's instructions. The DNA and RNA quality was verified
by electrophoresis through an agarose gel and stained with ethidium
bromide. For quantitative real-time PCR, 5 µg of total RNA from
each sample was used to synthesize cDNA with a High-Capacity cDNA
Archive kit (Applied Biosystems, Foster City, CA, USA), according
to the manufacturer's instructions. The cDNA quality was
ascertained by PCR using the housekeeping gene β-actin. The
PCR products were analyzed by electrophoresis on a 1% agarose gel
and stained with ethidium bromide.
Selection of genes
We analyzed the differential expression of the
following genes by qPCR: E-cadherin (CDH1), N-cadherin
(CDH2), claudin 1 (CLDN1), cathepsin B (CTSB),
platelet-activating factor acetylhydrolase 2 (PAFAH2),
growth arrest-specific 1 (GAS1), laminin β1 (LAMβ1),
occludin (OCLN), phosphoglycerate dehydrogenase
(PHGDH), solute carrier family 2 member 1 (SLC2A1),
transforming growth factor β1 (TGFβ1), tight junction
protein 1 (TJP1) and vimentin (VIM). The genes were
selected according to their role in cellular differentiation and
proliferation.
Quantitative real-time polymerase
chain reaction
The qPCR amplification was performed with Power
SYBR-Green and an ABI 7300 Real-Time PCR System (Applied
Biosystems, Warrington, UK). In brief, the reaction mixture (20 µl
of total volume) contained 25 ng of cDNA, gene-specific forward and
reverse primers and 10 µl of 2X Quantitative SYBR-Green PCR Master
Mix. The samples were tested in triplicate. The relative expression
of each specific gene was calculated using the following previously
published (20) formula: R = (E
target)ΔCt target (control - sample)/(E
endogenous ΔCt endogenous (control - sample).
A 2-fold-change was set as the cut-off. Gene expression was
analyzed in 45 ccRCC samples, in the 786-O cells after treatment
and the HaCaT cell line. Two healthy renal fresh-frozen tissue
samples were used as the healthy reference (control group). A
non-treated 786-O cell line was used as a reference sample and
GAPDH was selected as the endogenous control gene.
Bisulfite sequencing
Genomic DNA was subjected to a sodium bisulfite
treatment to modify unmethylated cytosine to uracil, as described
by Calmon et al (21).
Bisulfite-treated DNA was amplified by PCR, using primers designed
to amplify CpG-rich regions located at the 5′ region of OCLN
(−438 to +1232, relative to the transcription start site (TSS) and
encompassing 164 CpG dinucleotides] and GAS1 [-485 to +1518,
relative to the TSS and encompassing 269 CpG dinucleotides). The
amplified products were cloned using a CloneJET PCR Cloning kit
(Thermo Scientific, Carlsbad, CA, USA). Five positive clones from
the 786-O cell line before and after treatment with 5-Aza-dC, one
ccRCC sample and one healthy renal sample were sequenced using a
BigDye Terminator v3.1 Cycle Sequencing kit and an ABI3130XL
sequencer, according to the manufacturer's instructions (Applied
Biosystems). The methylation percentage for each sample was
calculated as the proportion of unconverted CpG dinucleotides among
all of the CpG dinucleotides analyzed from the 5 positive
clones.
Chromatin immunoprecipitation
(ChIP)
ChIP was performed using a ChIP-IT® High
Sensitivity kit according to the manufacturers instructions (Active
Motif, Carlsbad, CA, USA). The 786-O and HaCaT cells were
cross-linked with 1% formaldehyde for 10 min at room temperature
and nuclei were isolated. Isolated nuclei were sonicated on ice to
break the chromatin into 8,200–1,200 bp fragments. Soluble
chromatin was used in immunoprecipitation with H3K4me3, H3K27me3,
H3K4me2 and H3K9ac antibodies (Thermo Scientific, Rockford, IL,
USA). IgG was used as a negative control (Abcam, Cambridge, MA,
USA) and immune complexes were absorbed with protein G magnetic
beads. After reversing the cross-linking and treating with
proteinase K, the immunoprecipitated DNA was analyzed on a
gene-specific basis using qPCR. The quality control ChIP was
performed using a ChIP-IT® qPCR Analysis kit (Active
Motif) with Human Negative Control Primer Set 1 and Human Positive
Control Primer Set GAPDH-2, according to the manufacturers
instructions.
MicroRNA analysis
Two microRNA databases, miRBase (www.mirbase.org) and TargetScanHuman (www.targetscan.org), were used to select microRNAs
that target the OCLN and GAS1 mRNA. For microRNA
expression analysis, total RNA was reverse transcribed into cDNA
using miR-34a, miR-122 and U48-specific steam-loop primers.
Expression of mature miR-34a and miR-122 was quantified as
described in the qPCR methods. The microRNA expression was analyzed
in 30 ccRCC samples and in the cell lines 786-O and HaCaT. Two
healthy renal fresh-frozen tissue samples were used as a healthy
reference. Each sample was run in triplicate, and the miRNA
expression levels were normalized to U48.
Tissue array construction and
immunohistochemistry
Tissue microarrays were constructed using a tissue
microarrayer (Beecher Instruments, Silver Spring, MD, USA).
Briefly, the slides were reviewed by a pathologist, and areas
containing each category were annotated on the hematoxylin and
eosin (H&E) slides. Fifty-six 1.0 mm in diameter cylindrical
tissue cores from the ccRCC tumor samples and 24 from the tumor
margins were taken from the corresponding regions of the paraffin
blocks and transplanted into a recipient paraffin block.
For immunohistochemical staining, all of the
paraffin-embedded sections were cut into 4-µm in thickness and the
endogenous peroxidase activity was blocked with 3% hydrogen
peroxide for 30 min. Antigen retrieval was performed using sodium
citrate buffer (pH 6,0) for 20 min at 96°C in a steam pan. The
sections were then incubated with SLC2A1 polyclonal primary
antibody (1:200) (Abcam) diluted in 1% BSA at 4°C overnight. After
incubation with a primary antibody, the sections were incubated
with a biotinylated secondary antibody (Santa Cruz Biotechnology,
Paso Robles, CA, USA) and then exposed to a streptavidin complex
(HRP ready-to-use; DakoCytomation, Carpinteria, CA, USA). Positive
staining was identified using DAB substrate color detection (Dako,
Cambridge, UK). The sections were counterstained with
hematoxylin.
The SLC2A1 densitometric analyses were conducted
with an Axioskop II microscope using the Axiovision™ software (both
from Zeiss, Oberkochen, Germany). For these analyses, 20 different
points were analyzed from 3 different fields of each tumor fragment
and the average immunoreactivity intensity [arbitrary units (AU)]
was recorded.
Statistical analysis
Statistical analyses were performed using GraphPad
Prism 5 Software (GraphPad Software Inc., San Diego, CA, USA). The
relative expression levels detected by qPCR in ccRCC were
transformed into natural logarithms. The Wilcoxon signed-rank test
was applied to compare the gene expression levels in tumor and
healthy tissues. The Mann-Whitney U test and Wilcoxon signed-ranks
tests were used to compare the protein expression levels detected
by immunohistochemistry.
Results
Evaluation of EMT gene expression in
ccRCC
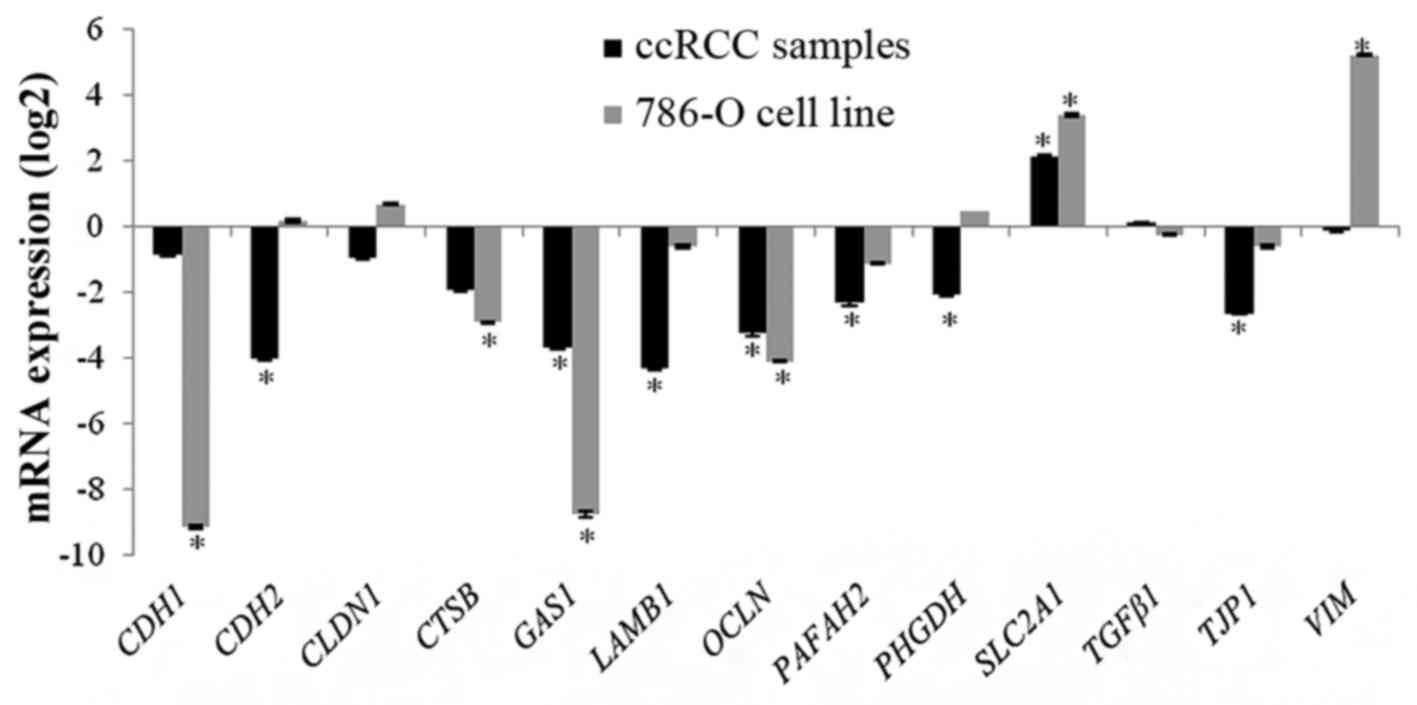
To evaluate gene expression in 45 ccRCC fresh
samples and the 786-O cell line, we performed qPCR for the
following target genes: CDH1, CDH2, CLDN1,
CTSB, PAFAH2, GAS1, LAMβ1, OCLN,
PHGDH, SLC2A1, TGFβ1, TJP1 and
VIM.
CDH2, CTSB, GAS1, LAMβ1,
OCLN, PHGDH, PAFAH2 and TJP1 were
significantly downregulated in the ccRCC samples when compared to
the reference samples. SLC2A1 was significantly
overexpressed in tumor tissues when compared to healthy renal
tissues. CDH1, TGFβ1, VIM and CLDN1
were not differentially expressed (Fig.
1).
CDH1, CTSB, GAS1 and
OCLN were significantly downregulated in 786-O cells.
SLC2A1 and VIM were significantly overexpressed in
786-O cells. CDH2, CLDN1, LAMβ1,
PAFAH2, PHGDH, TGFβ1 and TJP1 were not
differentially expressed (Fig.
1).
OCLN and GAS1 were chosen for
epigenetic analysis due to the presence of CpG islands in their
promoter regions and the observed downregulation in both the ccRCC
samples and 786-O cells. SLC2A1 was selected for
immunohistochemical analysis since it was overexpressed in both the
ccRCC samples and 786-O cells.
DNA methylation and histone
acetylation analysis
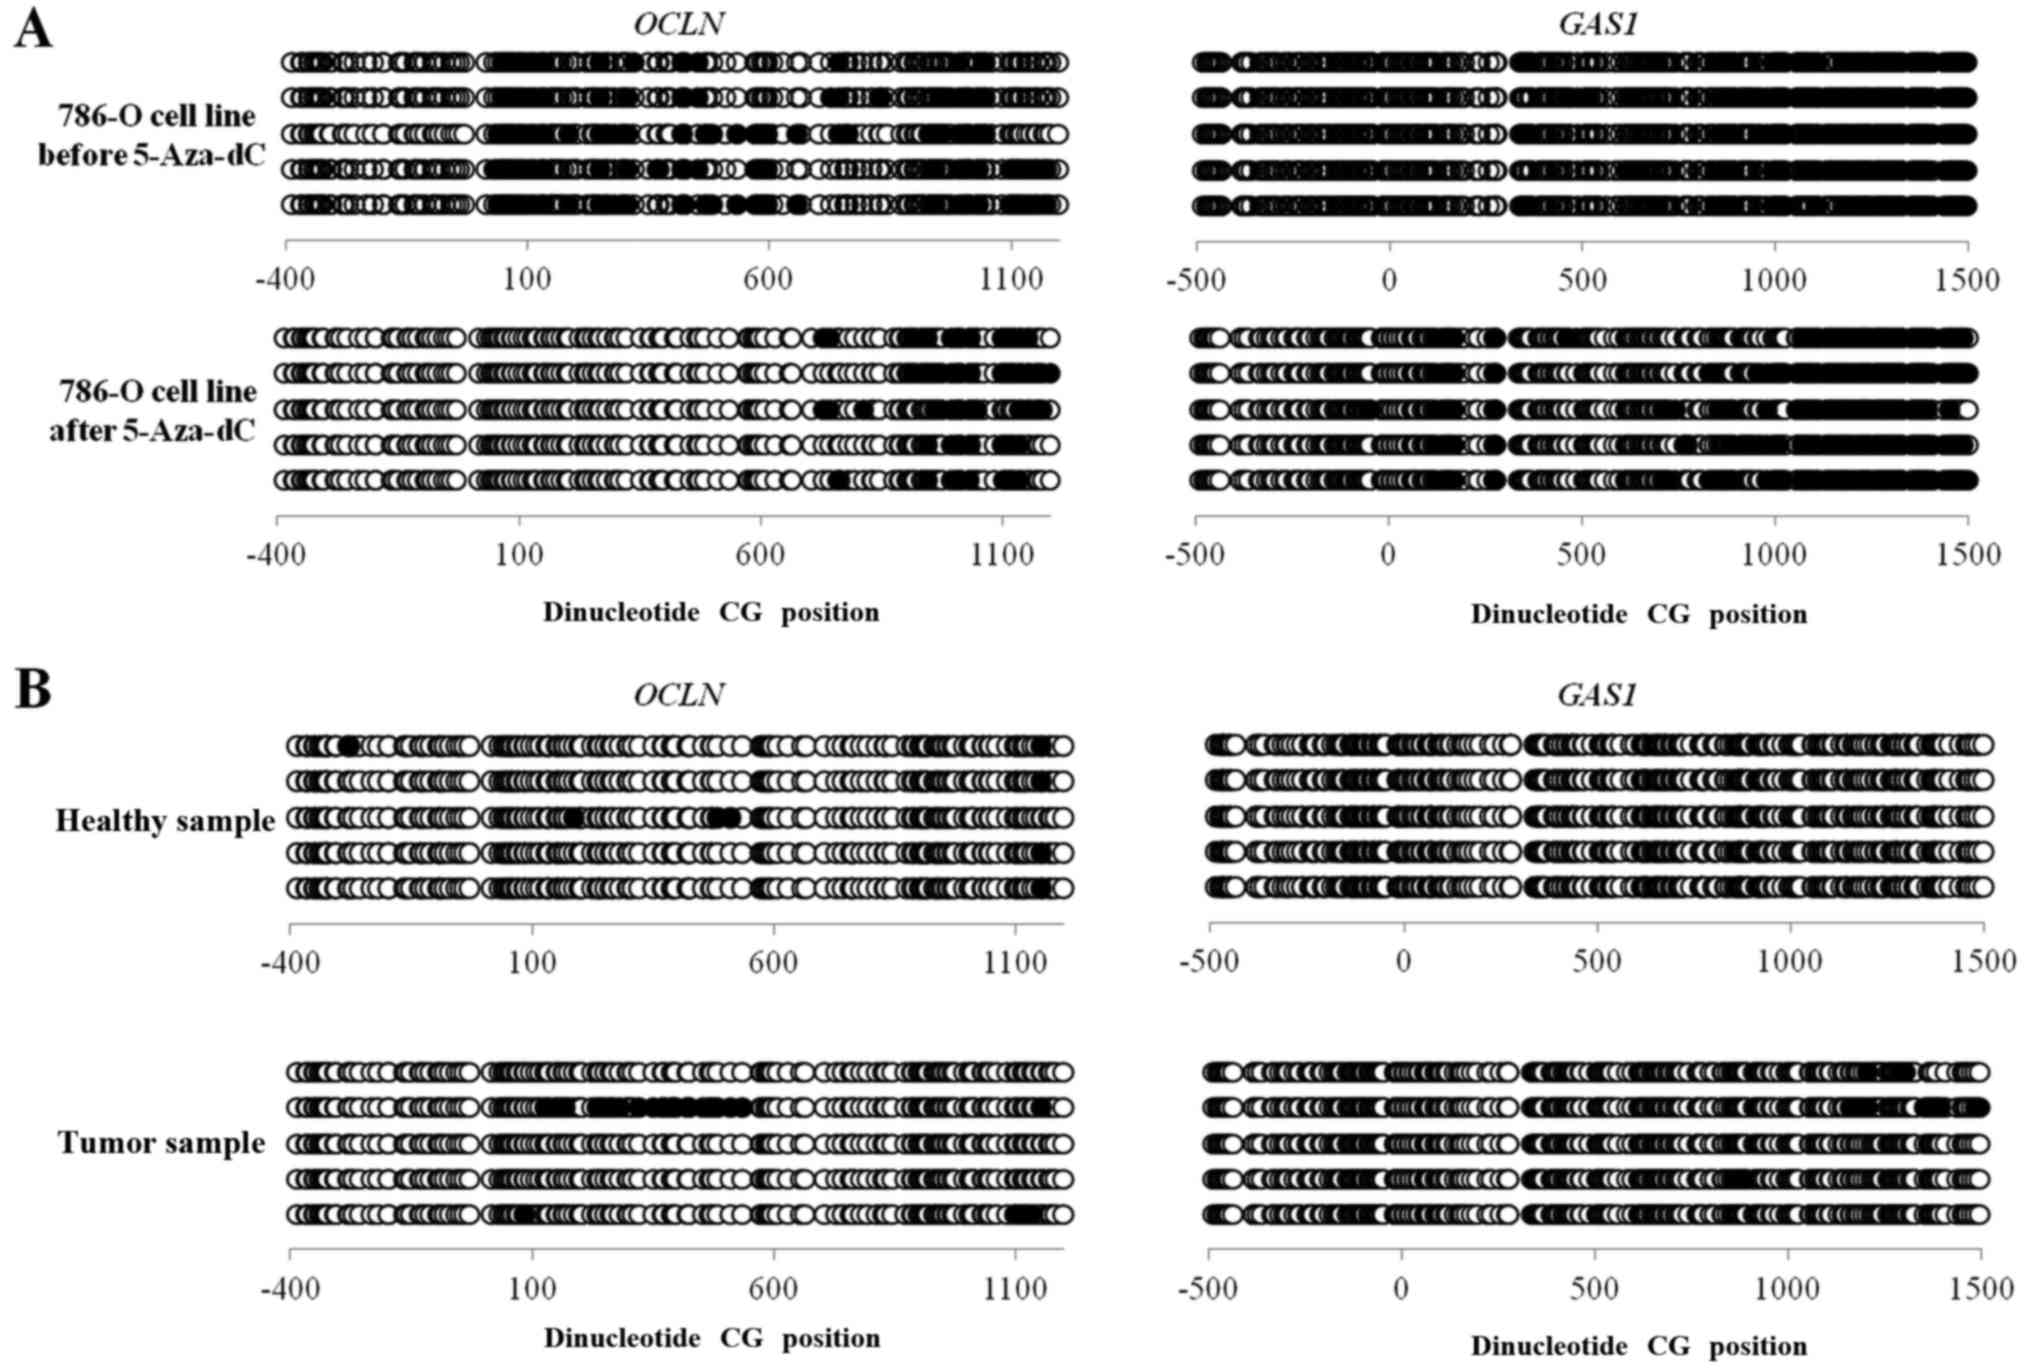
The methylation status of CpG islands at the 5′
region of the OCLN and GAS1 genes was investigated by
bisulfite sequencing in ccRCC samples, healthy renal tissue and
786-O cells before and after 5-Aza-dC treatment. The bisulfite
sequencing was performed in the −438 to +1232 region of OCLN
and the −485 to +1518 region of GAS1. The methylation levels
of OCLN and GAS1 were not significantly reduced in
786-O cells before and after 5 µM of 5-Aza-dC treatment
(24.39–22.19% for OCLN and 22.5–22.23% for GAS1). The
methylation level of the genes compared between the ccRCC samples
and the healthy renal samples did not significantly differ, 4–1%
for OCLN and 1.8–0% for GAS1 (Fig. 2).
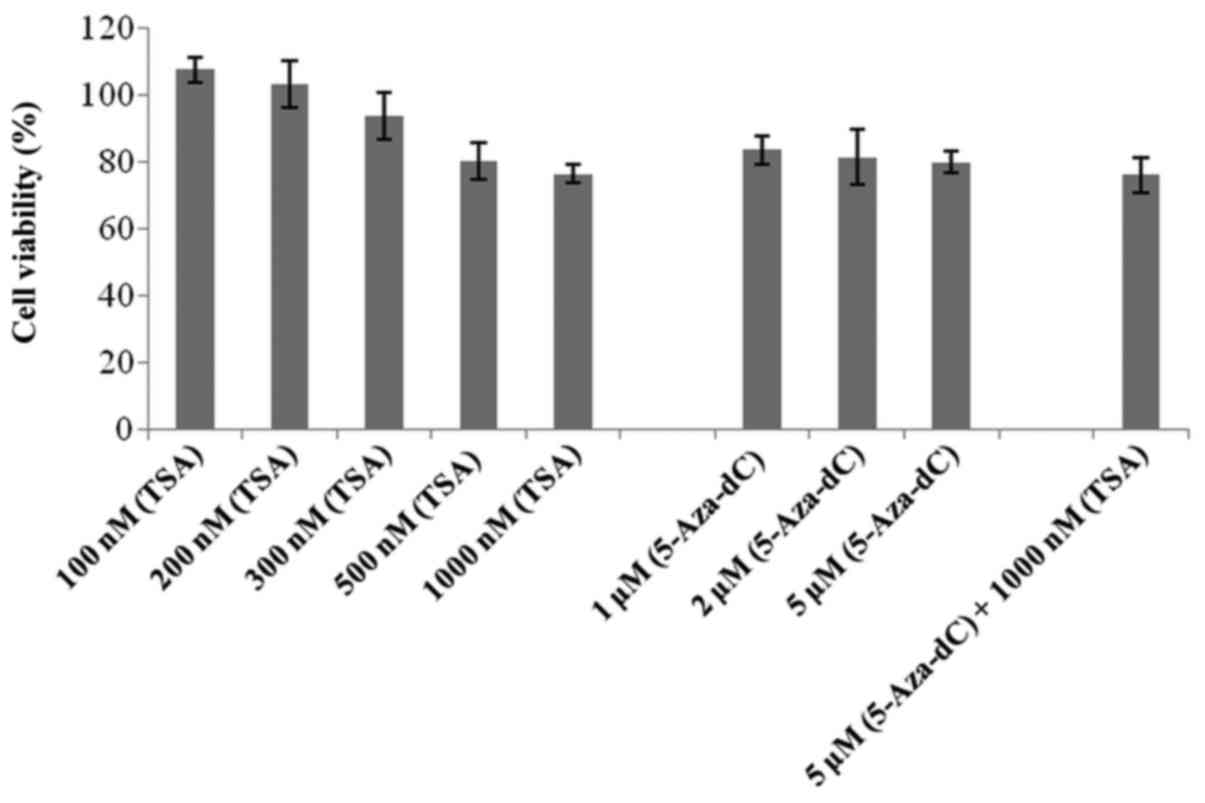
An MTT assay was performed to detect the possible
effects of 5-Aza-dC and TSA treatment on 786-O cell viability. All
of the drug concentrations tested showed viability >75%,
including the co-treatment (Fig.
3).
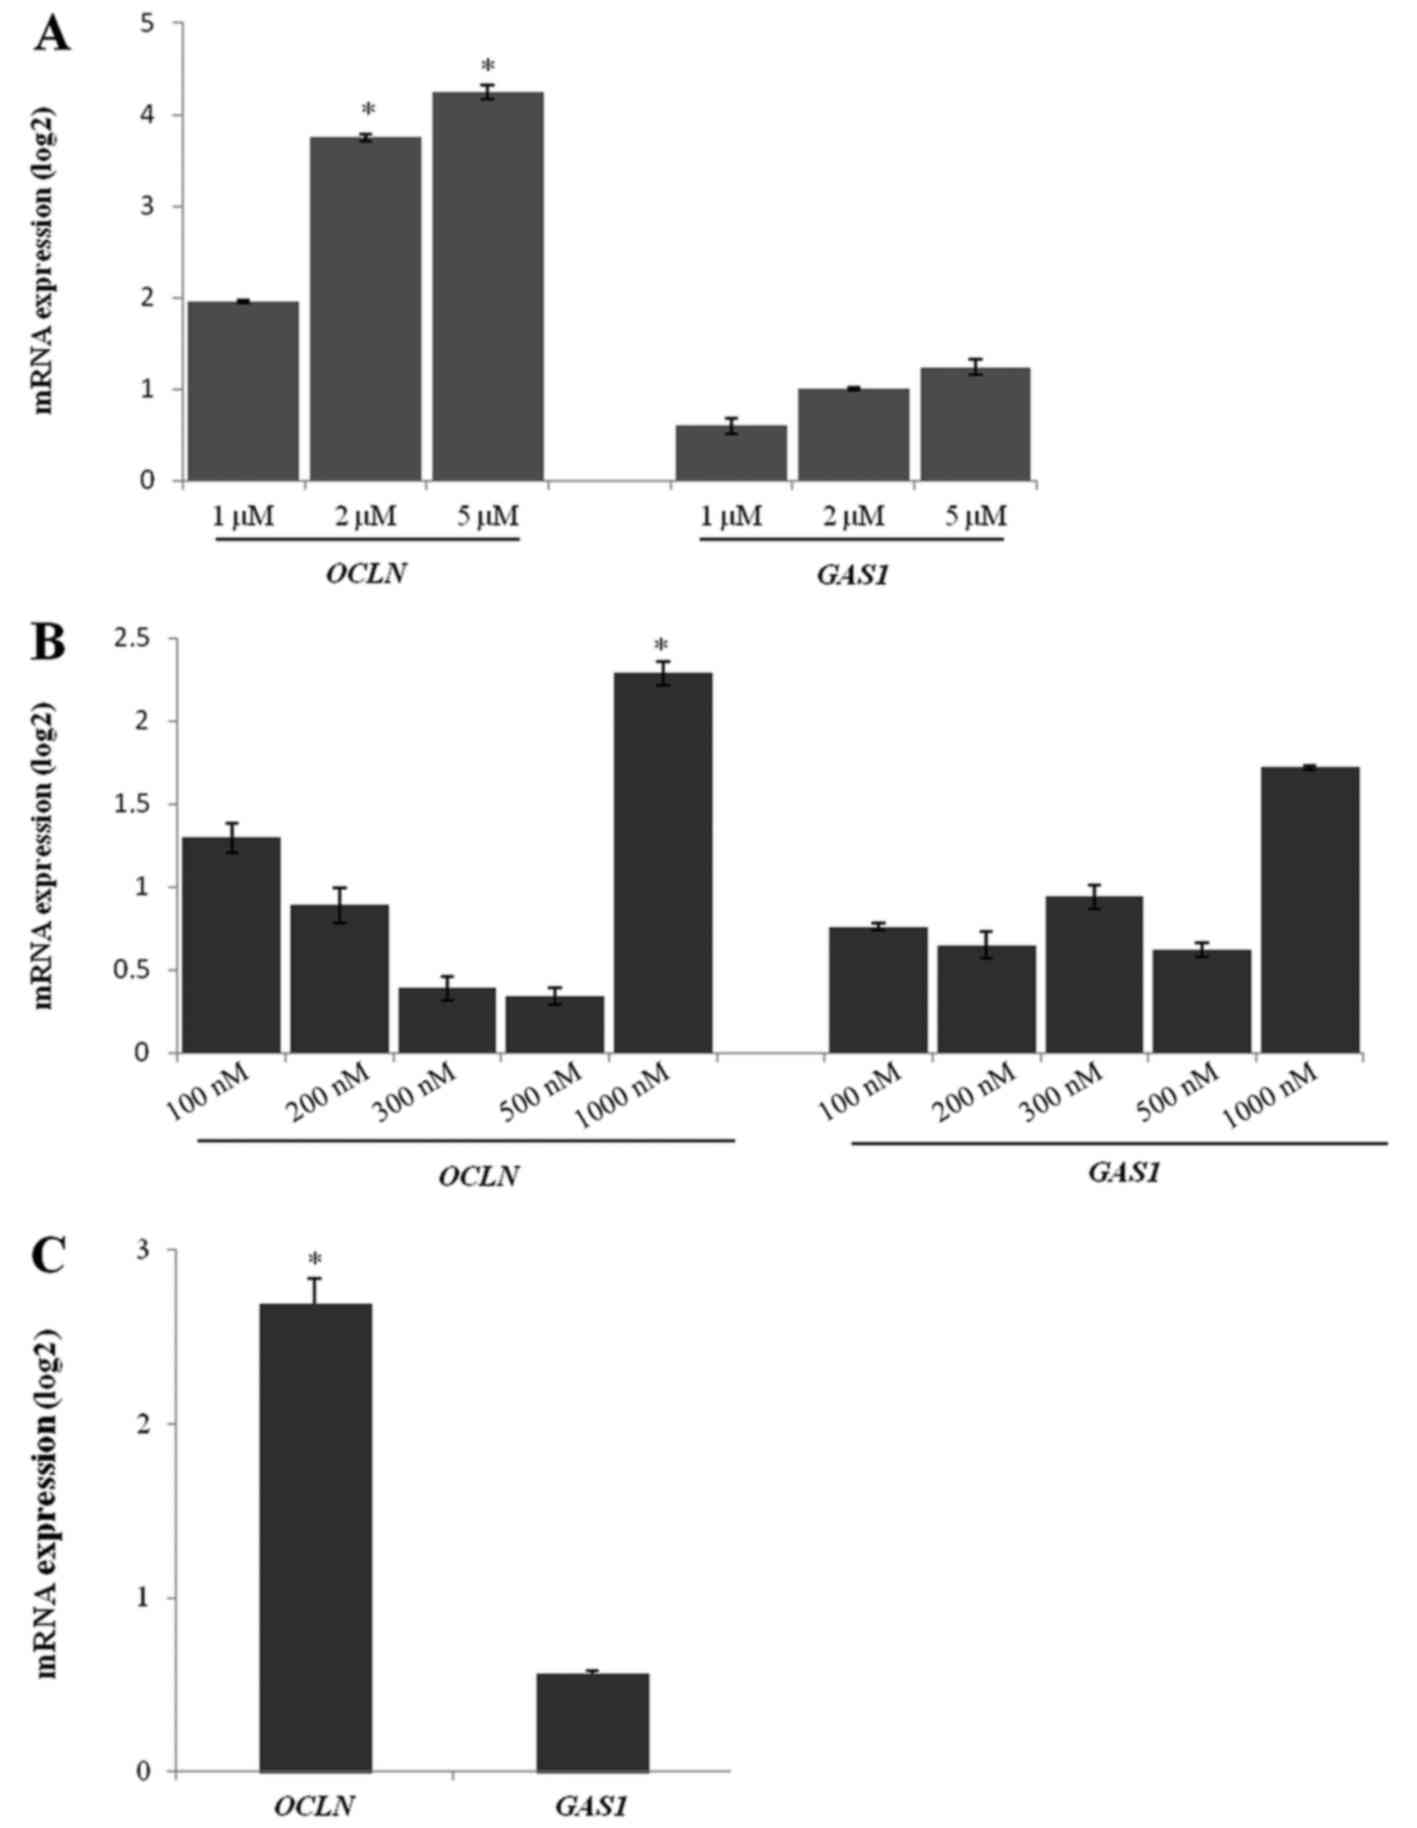
The cell growth was inhibited in a dose-dependent
manner by 5-Aza-dC treatment in 786-O cells. The expression of
OCLN mRNA was higher in the cells treated with 5 and 2 µM of
5-Aza-dC than in the untreated cells (Fig. 4A). There was no difference in the
GAS1 mRNA expression after treatment with any 5-Aza-dC
concentration (Fig. 4A).
Similar to the 5-Aza-dC treatment, TSA treatment
showed a better response at the highest concentration (1,000 nM).
The OCLN gene was upregulated in the 786-O cells after 1,000
nM TSA treatment when compared to the untreated cells (Fig. 4B). Other TSA concentrations were not
able to significantly upregulate OCLN expression. The
GAS1 expression levels were unchanged after TSA treatment in
786-O cells when compared to the untreated cells (Fig. 4B).
The 5-Aza-dC (5 µM) and TSA (1,000 nM) co-treatment
efficiently upregulated OCLN expression in 786-O cells.
However, GAS1 gene expression was not altered after
co-treatment (Fig. 4C).
ChIP
Since there was alteration in the OCLN gene
expression after 5-Aza-dC treatment without any difference in the
DNA methylation level in its promoter region and it is known that
5-Aza-dC treatment may alter both DNA and histone methylation
(22), we investigated whether the
loss of OCLN expression in 786-O cells could be due to
histone modifications. Regarding the GAS1 gene, we could not
observe any change in its expression after the 5-Aza-dC and TSA
treatments, and therefore, we also investigated if histone
modifications could contribute to GAS1 supression in the
absence of DNA hypermethylation or histone deacetylation.
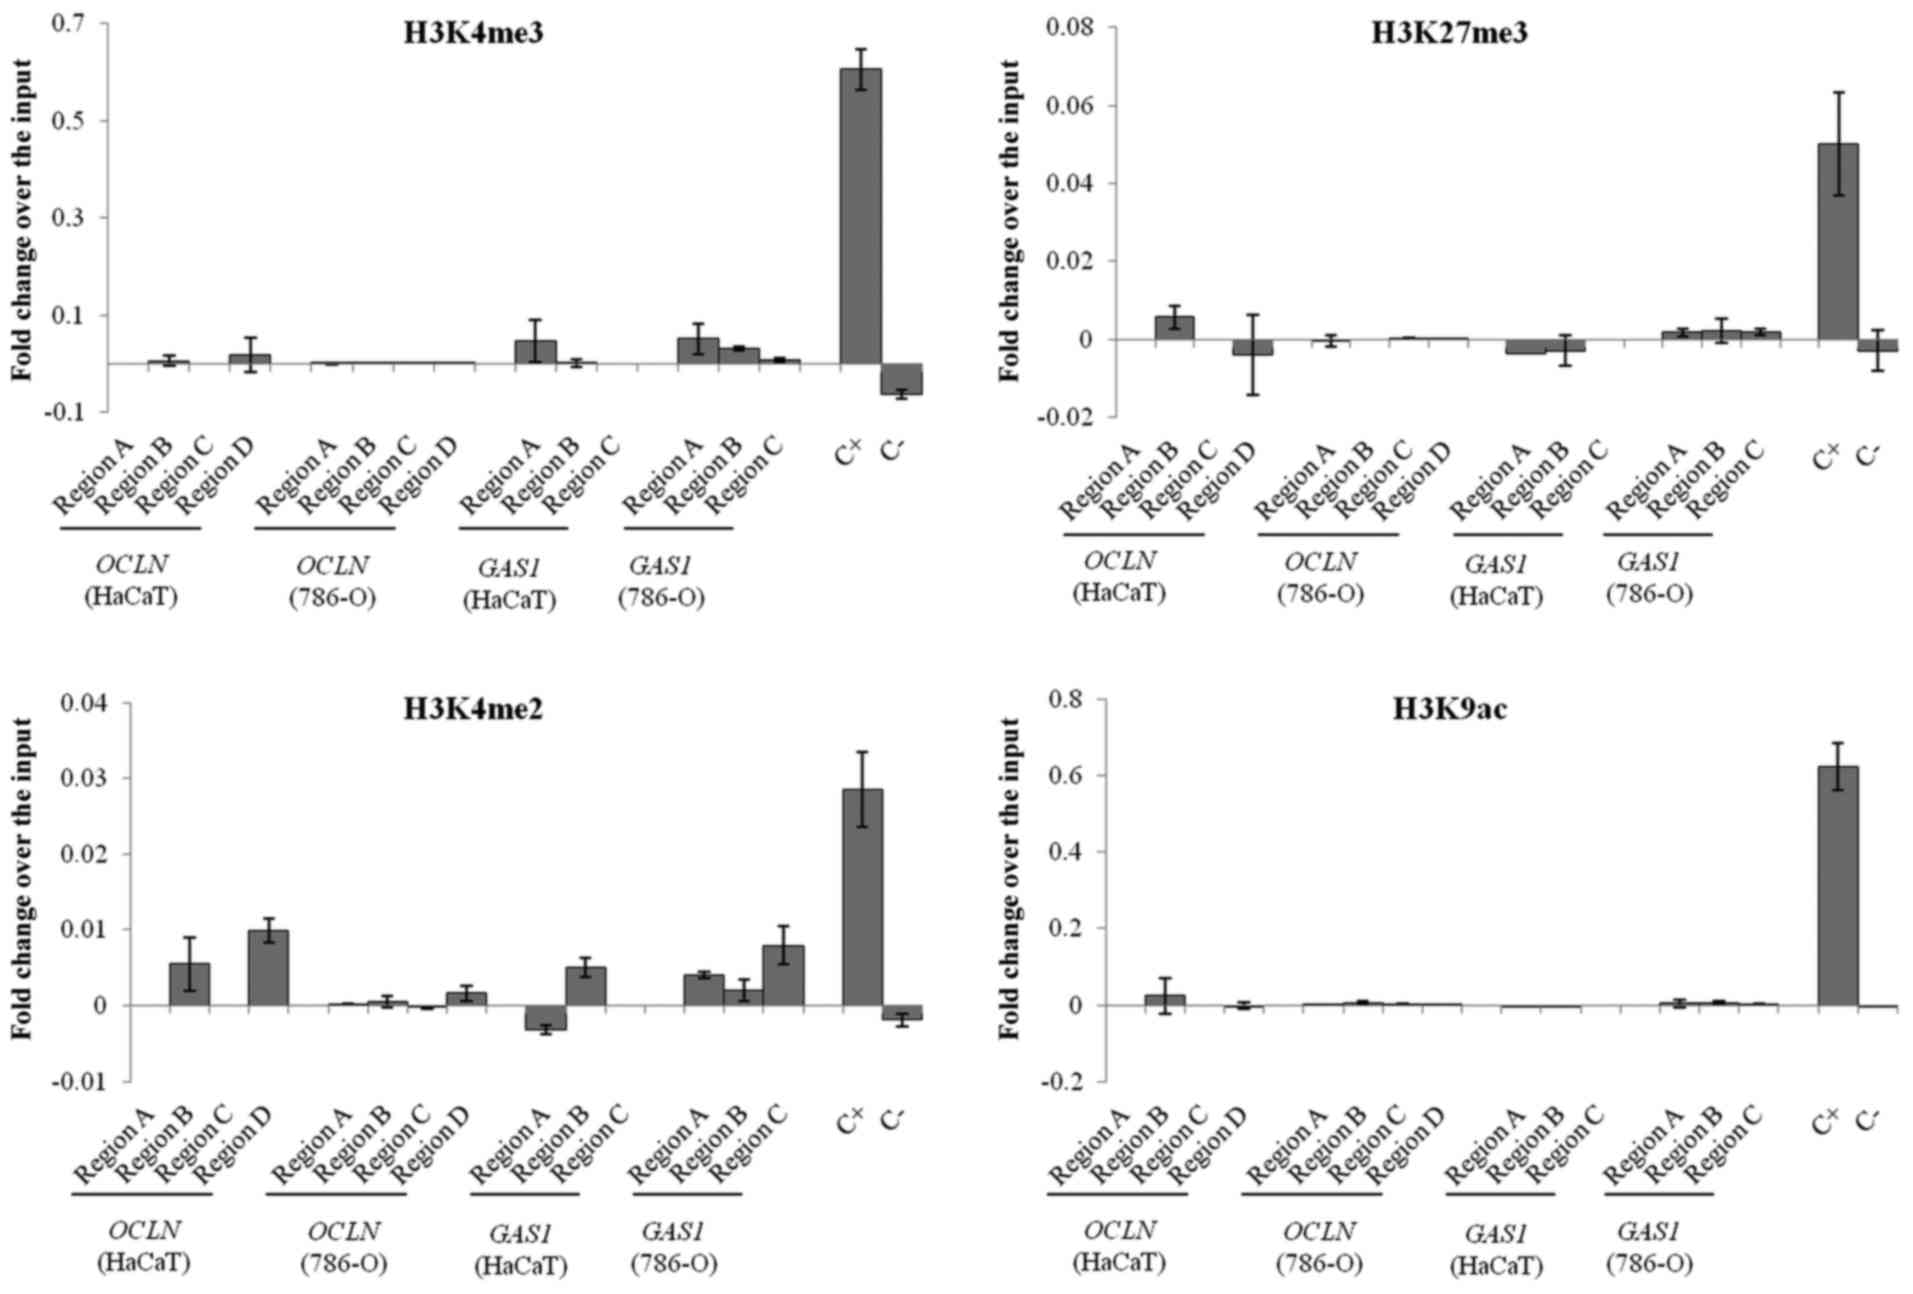
In both cell lines, ChIP followed by qPCR analysis
showed that all of the histone modifications were reduced or absent
in the promoter regions of OCLN and GAS1. It was not
possible to differentiate the relative occupancy of the marks
studied between the healthy and tumor cell lines. The Human
Negative Control Primer Set 1 and Human Positive Control Primer Set
GAPDH-2 served as negative and positive controls, respectively
(Fig. 5).
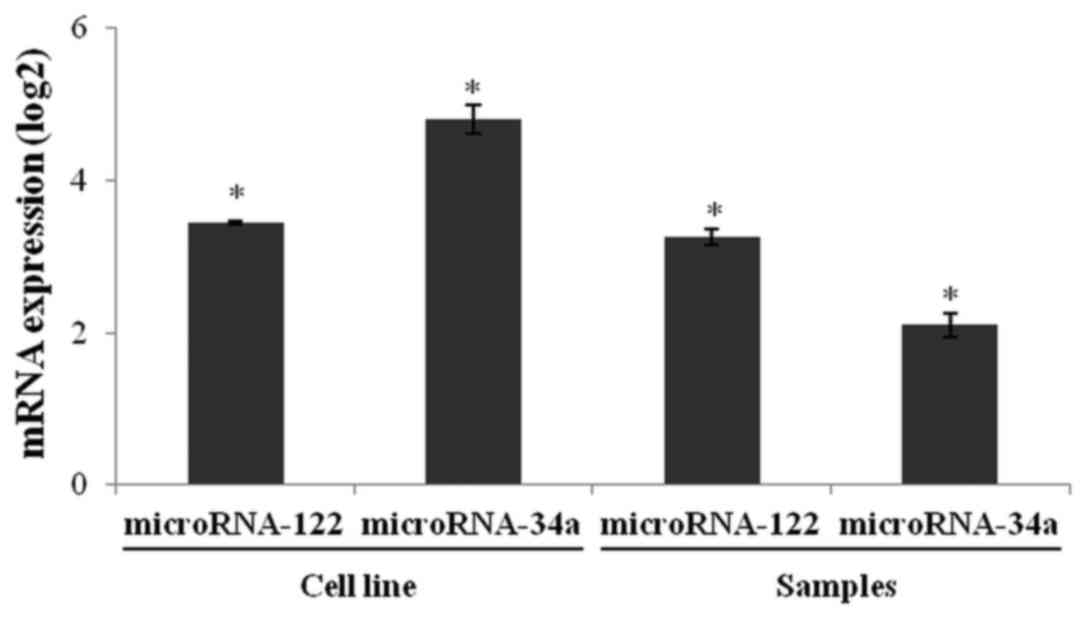
microRNA analysis
We performed stem-loop reverse transcription PCR
(RT-qPCR) to quantify miR-122 and miR-34a expression in the 786-O
and HaCaT cell lines. The relative expression of miR-122 and
miR-34a in the 786-O cells was higher than in the HaCaT cells
(Fig. 6). Both microRNAs were
significantly overexpressed in tumor tissues when compared to
healthy renal tissues. These results suggest that upregulation of
miR-122 and miR-34a may be, at least in part, involved in the
downregulation of OCLN and GAS1 in ccRCC.
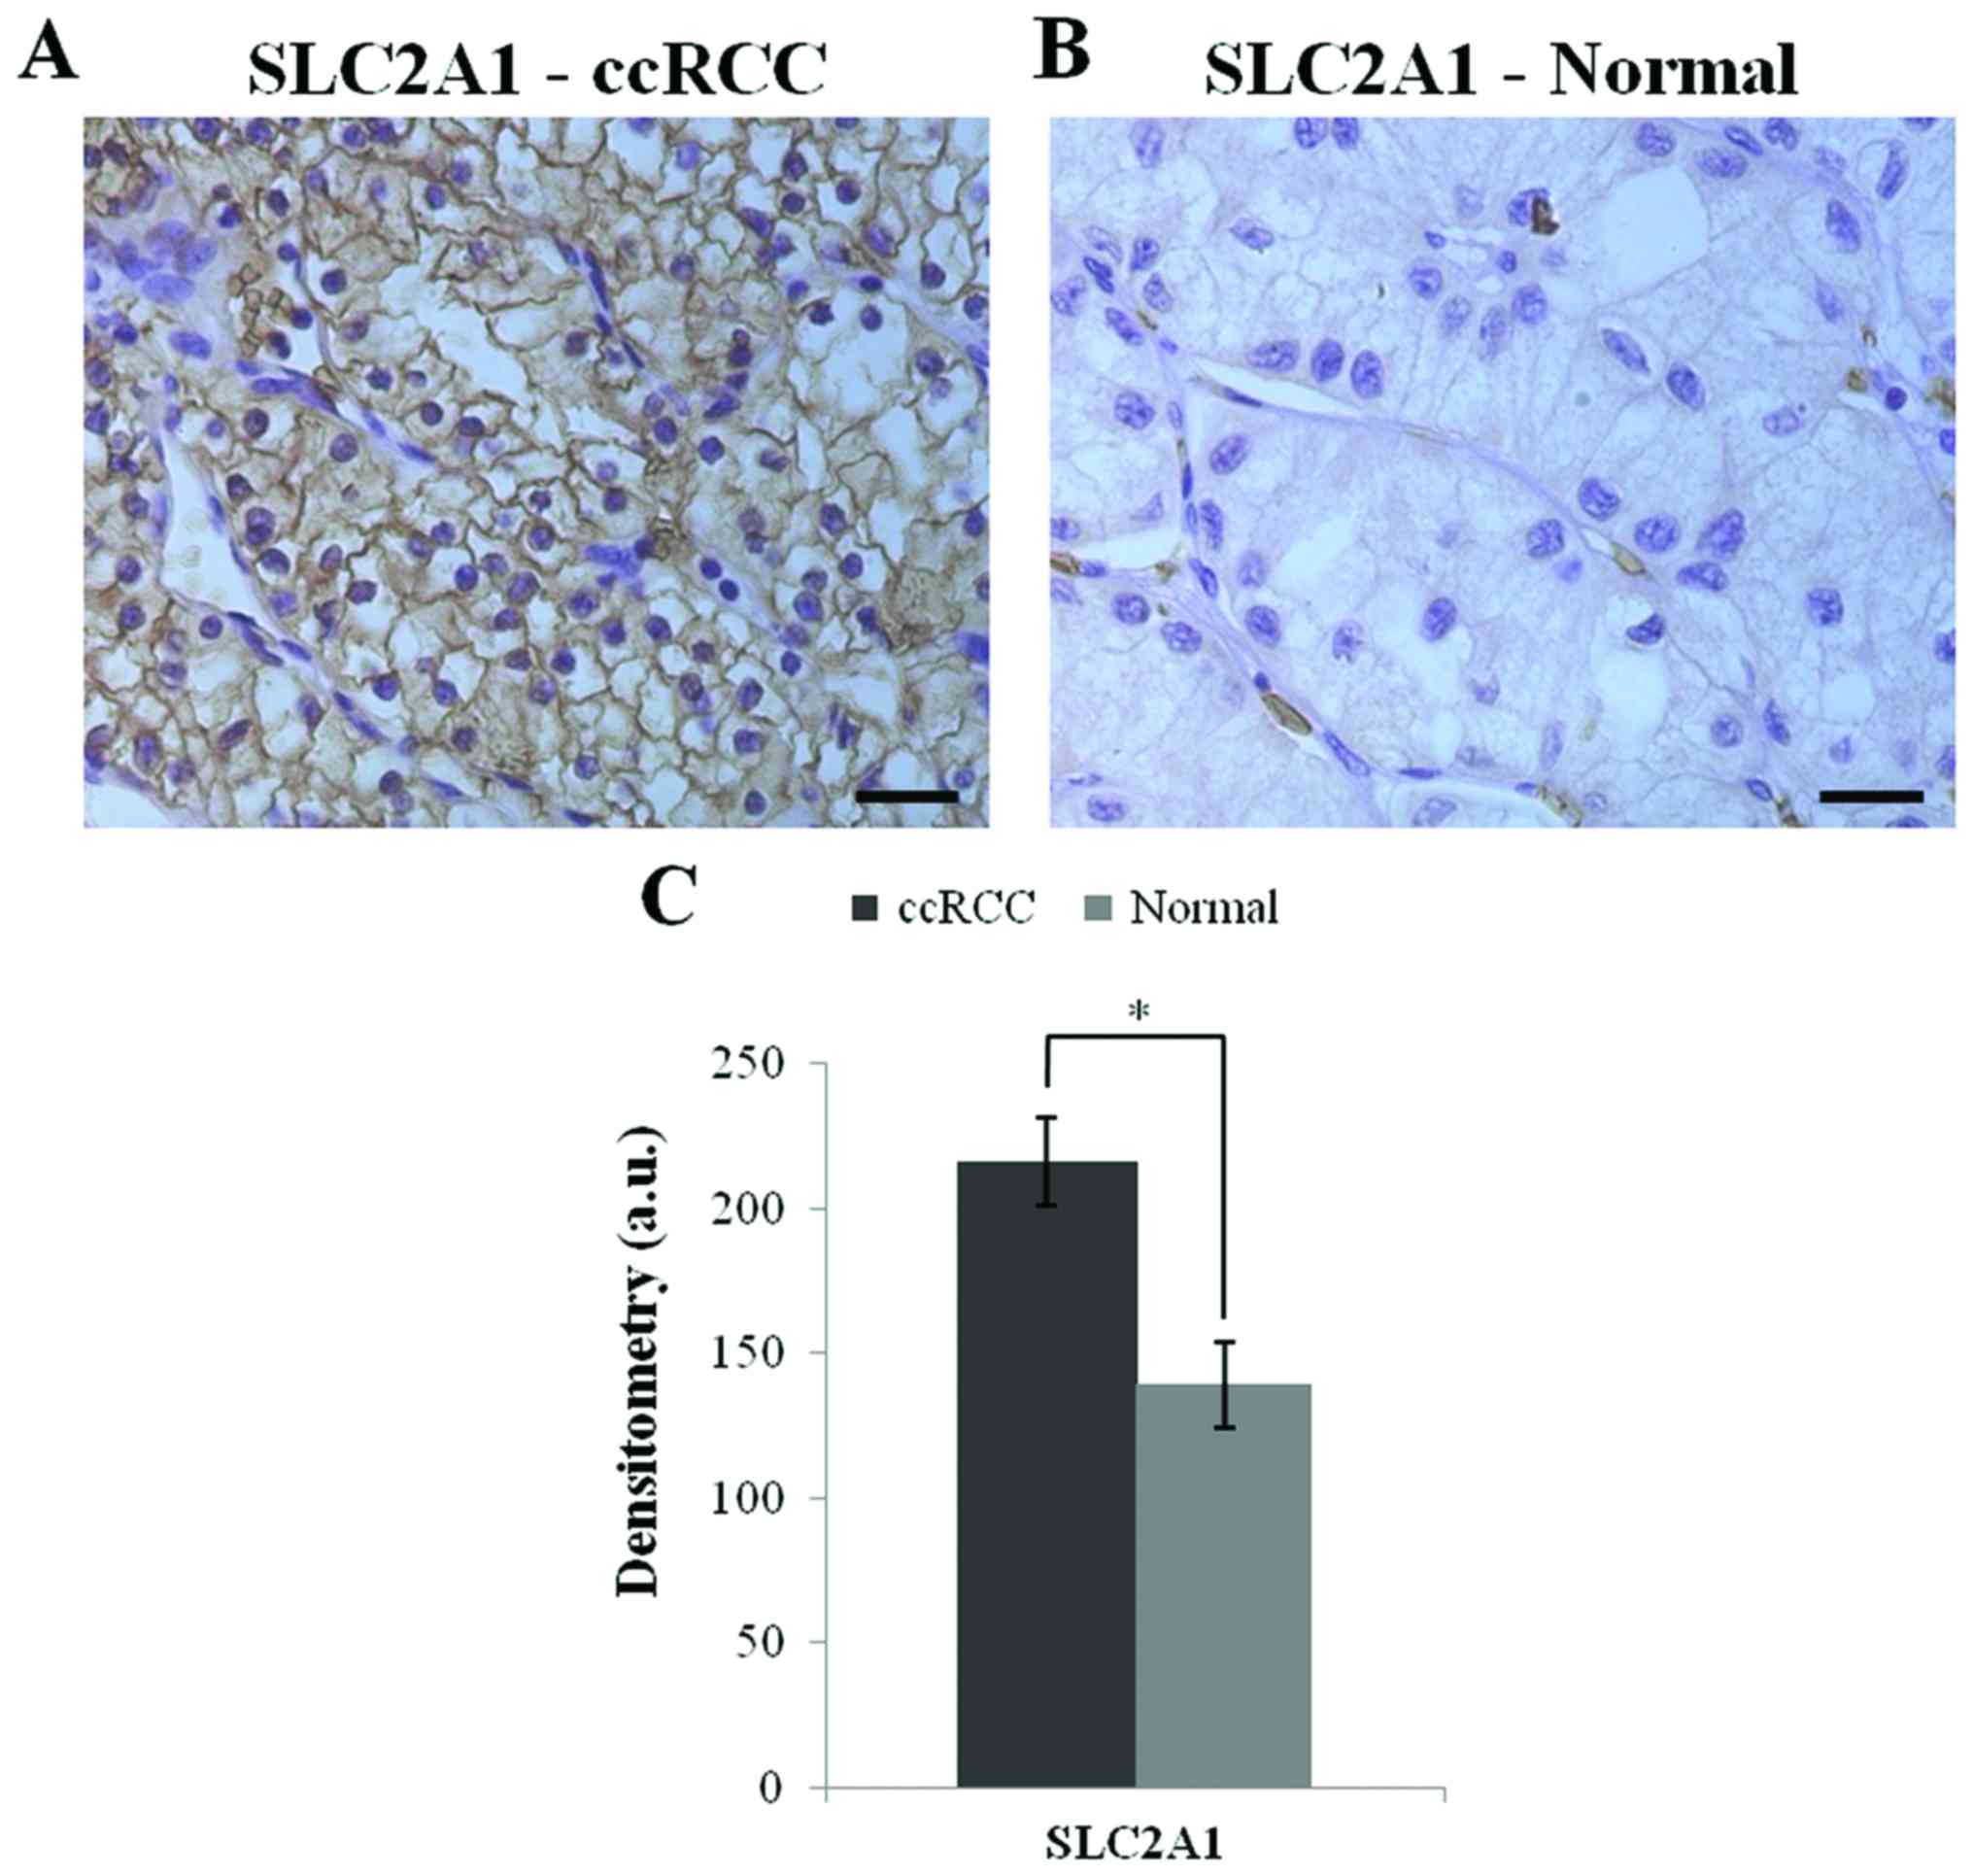
Immunohistochemistry
The SLC2A1 protein expression was investigated in
ccRCC tissue array by immunohistochemistry.The ccRCC tissues showed
a higher expression of the SLC2A1 protein (p<0.0001) relative to
the healthy tissues. Fig. 7 shows
the SLC2A1 immunoreactivity and the densitometric data.
Discussion
Several prognostic models are used to predict the
survival of ccRCC patients, including clinicopathological
parameters and protein, genetic and epigenetic biomarkers (23–25).
In the present study, we investigated the epigenetic regulatory
mechanisms of OCLN and GAS1, genes that may
contribute to epithelial-mesenchymal transition (EMT), cellular
differentiation and proliferation in renal cell carcinoma.
The OCLN gene is responsible for producing
the occludin protein, which is present in all tight junctions.
Occludin has been implicated in tight junction permeability and, in
particular, to the regulation of size-selective diffusion (26–28).
The transmembrane proteins occludin and claudin are present in
tight junctions, which are connected to the cytoskeleton via a
network of proteins, such as zonula occludens-1 (29). This epithelial junctional complex,
along with adherens junctions and desmosomes, is located at the
most apical part of the complex (30). Tight junctions determine epithelial
cell polarity and undergo dissolution during cancer progression
that is accompanied by cytoskeletal changes (31).
Downregulation of OCLN has been observed in
liver tumors, breast cancer, endometrial and lung carcinomas
(32–35). A study of human cutaneous squamous
cell carcinoma observed the loss of OCLN and related this loss to
cell-cell adhesion, apoptosis and proliferation (36). OCLN was found to be partially
methylated in the promoter and endogenous region of a breast cancer
cell line, and treatment with 5-Aza-dC and TSA could induce
re-expression of this gene (37).
In the present study, we observed hypermethylation in ~20% of the
endogenous region, although, treatment with 5-Aza-dC did not change
the global methylation profile of the OCLN gene in the ccRCC
cell line. However, we demonstrated that the effect of 5-Aza-dC
treatment and the synergistic effect of 5-Aza-dC and TSA treatment
in 786-O cells were effective in reactivating OCLN gene
expression. Thus, 786-O cells showed a methylation profile in the
OCLN promoter, despite the suggestion of alternate modes of
reactivation based upon OCLN expression. To further
investigate whether increased OCLN expression in 786-O cells
could be due to chromatin modifications, we performed ChIP for
H3K27me3, H3K4me3, H3K4me2 and H3K9ac marks in the OCLN
promoter in 786-O cells. ChIP analysis did not show any differences
between H3K27me3 silencing marks or changes in H3K4me3, H3K4me2 and
H3K9ac activation marks in the OCLN gene promoter region.
H3K4me1, H3K4me2 and H3K4me3 marks inform us on the potential
prognosis since their increase was found to be inversely correlated
with lymph node involvement and distant metastasis in patients with
renal cell carcinoma (38).
Another potential regulatory mechanism that may
influence OCLN expression is microRNAs. miR-122 has been
reported to regulate OCLN expression in intestinal tissue,
which contributes to increased intestinal permeability (39). In the present study, miR-122
expression levels were higher in the ccRCC cell line and tumor
samples, suggesting that the increase in microRNA expression may
contribute to the downregulation of the OCLN gene. miR-122
expression was upregulated in 15 cases of clear cell papillary
renal cell carcinoma and in 80 samples of ccRCC (40–42).
In breast cancer, high miR-122 levels have been associated with
metastasis, likely by increasing nutrient availability in the
pre-metastatic niche (43).
GAS1 is a membrane-associated protein; it is
tethered to the membrane through a glycosyl-phosphatidylinositol
anchor (44,45). GAS1 contributes to inhibitory signal
transduction and interferes with cell proliferation due to the
inhibition of DNA synthesis during the G0 to S phase (44,46).
The Hedgehog pathway is an essential regulator of carcinogenesis,
and the GAS1 protein participates in the Hedgehog signaling pathway
through the binding to Hedgehog ligands and enhancing the
signaling, thus, indirectly inducing EMT (14,47,48).
Reduced GAS1 expression was found to be
positively associated with the survival time in gastric cancer
cells (49). The downregulation of
the GAS1 gene has been described in colorectal cancer,
melanoma and prostate cancer metastasis (50–52).
In the present study, the global methylation profile
of GAS1 in ccRCC cells was unchanged before and after
5-Aza-dC treatment. Similarly, there were no gene expression
modifications after treatment with TSA or co-treatment with TSA and
5-Aza-dC. Sacilotto et al (53) suggested that GAS1 gene
transcription is modulated by chromatin remodeling and histone
modifying complex recruitment to the GAS1 promoter in
hepatic cells. However, our chromatin immunoprecipitation assays
did not show a difference in the H3K27me3 silencing mark, nor were
there differences in the H3K4me3, H3K4me2 and H3K9ac activation
marks in the GAS1 gene promoter region in ccRCC cells. It is
possible that other regulatory mechanisms are altering the
expression of GAS1 in ccRCC, such as microRNAs.
GAS1 gene regulation in papillary thyroid
carcinoma occurs through miR-34a, leading to cell proliferation and
apoptotic suppression (54).
miR-34a regulates mesangial proliferation and glomerular
hypertrophy by directly inhibiting GAS1 in early diabetic
nephropathies (55). In the present
study, we measured miR-34a expression levels, which target the
GAS1 gene, in ccRCC cell lines and tumor samples and suggest
that the increase in this microRNA may contribute to the
downregulation of GAS1. miR-34a was upregulated in 8 ccRCC
samples and renal carcinoma cell lines, establishing an association
between this miR and multiple targets (56,57).
miR-34a overexpression supports cell proliferation in the majority
of cancers, suggesting an unexpected link between cancer and
neuronal and endocrine cell metabolism (58).
The SLC2A1 gene is overexpressed in different
types of cancers, including lung, liver and breast (59–61).
SLC2A1 facilitates glucose transport and is present in the
epithelium and endothelium, contributing to proliferation (59,62,63).
In the present study, SLC2A1 was upregulated in ccRCC
samples and 786-O cells as determined by both qPCR and
immunohistochemistry. Cifuentes et al (64) demonstrated that SLC2A1 and glucose
transport are regulated by insulin and therefore may be an
important target for conventional pharmaceutical therapy and gene
therapy in the treatment of osteosarcoma. The SLC2A1 protein
belongs to a class of markers that can detect breast cancer by
molecular imaging with more common immunoreactivity in ductal
carcinoma in situ than in invasive breast cancer (65,66).
In summary, the silencing of OCLN and
GAS1 may contribute to tumor progression due to a possible
relationship between these genes and cell-cell adhesion, apoptosis
and proliferation. We suggest that the increase in miR-122 and
miR-34a expression may contribute to the downregulation of the
OCLN and GAS1 genes, respectively. Overexpression of
the SLC2A1 gene was higher in ccRCC than that in the
non-neoplastic samples. The expression of these genes may be
involved in ccRCC progression in addition to other cellular
processes that contribute to tumor development. Once these genes
have been characterized in ccRCC, molecular genetic tools may be
used to explore the biological process involved, thus improving
diagnosis, treatment and patient outcomes. More studies should be
conducted to assess the overall importance of epigenetic events in
the regulation of OCLN and GAS1 expression in ccRCC
and in others tumors, as well as its relevancce in the analysis of
possible transcription factors that may also contribute to the
regulation of the expression of these genes.
Acknowledgements
The present study was supported by the São Paulo
State Research Foundation, FAPESP (2012/08853-0), and the National
Council for Research, CNPq.
References
|
1
|
Shuch B, Amin A, Armstrong AJ, Eble JN,
Ficarra V, Lopez-Beltran A, Martignoni G, Rini BI and Kutikov A:
Understanding pathologic variants of renal cell carcinoma:
Distilling therapeutic opportunities from biologic complexity. Eur
Urol. 67:85–97. 2015. View Article : Google Scholar : PubMed/NCBI
|
|
2
|
Cohen HT and McGovern FJ: Renal-cell
carcinoma. N Engl J Med. 353:2477–2490. 2005. View Article : Google Scholar : PubMed/NCBI
|
|
3
|
Kuroda N, Hosokawa T, Michal M, Hes O,
Sima R, Ohe C and Lee GH: Clear cell renal cell carcinoma with
focal renal angiomyoadenomatous tumor-like area. Ann Diagn Pathol.
15:202–206. 2011. View Article : Google Scholar : PubMed/NCBI
|
|
4
|
Nagata M, Sakurai-Yageta M, Yamada D, Goto
A, Ito A, Fukuhara H, Kume H, Morikawa T, Fukayama M, Homma Y, et
al: Aberrations of a cell adhesion molecule CADM4 in renal clear
cell carcinoma. Int J Cancer. 130:1329–1337. 2012. View Article : Google Scholar : PubMed/NCBI
|
|
5
|
Baylin SB: DNA methylation and gene
silencing in cancer. Nat Clin Pract Oncol. 2 Suppl 1:S4–S11. 2005.
View Article : Google Scholar : PubMed/NCBI
|
|
6
|
Tang J and Zhuang S: Epigenetics in acute
kidney injury. Curr Opin Nephrol Hypertens. 24:351–358.
2015.PubMed/NCBI
|
|
7
|
Baylin SB and Ohm JE: Epigenetic gene
silencing in cancer - a mechanism for early oncogenic pathway
addiction? Nat Rev Cancer. 6:107–116. 2006. View Article : Google Scholar : PubMed/NCBI
|
|
8
|
Feinberg AP and Tycko B: The history of
cancer epigenetics. Nat Rev Cancer. 4:143–153. 2004. View Article : Google Scholar : PubMed/NCBI
|
|
9
|
Benard A, Goossens-Beumer IJ, van Hoesel
AQ, De Graaf W, Horati H, Putter H, Zeestraten EC, van de Velde CJ
and Kuppen PJ: Histone trimethylation at H3K4, H3K9 and H4K20
correlates with patient survival and tumor recurrence in
early-stage colon cancer. BMC Cancer. 14:5312014. View Article : Google Scholar : PubMed/NCBI
|
|
10
|
Khakpour G, Pooladi A, Izadi P, Noruzinia
M and Bazzaz J Tavakkoly: DNA methylation as a promising landscape:
A simple blood test for breast cancer prediction. Tumour Biol.
36:4905–4912. 2015. View Article : Google Scholar : PubMed/NCBI
|
|
11
|
Li J and Mansmann UR: A microRNA molecular
modeling extension for prediction of colorectal cancer treatment.
BMC Cancer. 15:4722015. View Article : Google Scholar : PubMed/NCBI
|
|
12
|
De Wever O, Pauwels P, De Craene B, Sabbah
M, Emami S, Redeuilh G, Gespach C, Bracke M and Berx G: Molecular
and pathological signatures of epithelial-mesenchymal transitions
at the cancer invasion front. Histochem Cell Biol. 130:481–494.
2008. View Article : Google Scholar : PubMed/NCBI
|
|
13
|
Pierucci-Alves F, Yi S and Schultz BD:
Transforming growth factor beta 1 induces tight junction
disruptions and loss of transepithelial resistance across porcine
vas deferens epithelial cells. Biol Reprod. 86:362012. View Article : Google Scholar : PubMed/NCBI
|
|
14
|
Katoh Y and Katoh M: Hedgehog signaling,
epithelial-to-mesenchymal transition and miRNA (Review). Int J Mol
Med. 22:271–275. 2008.PubMed/NCBI
|
|
15
|
Kunkel M, Reichert TE, Benz P, Lehr HA,
Jeong JH, Wieand S, Bartenstein P, Wagner W and Whiteside TL:
Overexpression of Glut-1 and increased glucose metabolism in tumors
are associated with a poor prognosis in patients with oral squamous
cell carcinoma. Cancer. 97:1015–1024. 2003. View Article : Google Scholar : PubMed/NCBI
|
|
16
|
Sun L, Zeng X, Yan C, Sun X, Gong X, Rao Y
and Yan N: Crystal structure of a bacterial homologue of glucose
transporters GLUT1-4. Nature. 490:361–366. 2012. View Article : Google Scholar : PubMed/NCBI
|
|
17
|
Sasaki H, Shitara M, Yokota K, Hikosaka Y,
Moriyama S, Yano M and Fujii Y: Overexpression of GLUT1 correlates
with Kras mutations in lung carcinomas. Mol Med Rep. 5:599–602.
2012.PubMed/NCBI
|
|
18
|
Li W, Wei Z, Liu Y, Li H, Ren R and Tang
Y: Increased 18F-FDG uptake and expression of Glut1 in the EMT
transformed breast cancer cells induced by TGF-beta. Neoplasma.
57:234–240. 2010. View Article : Google Scholar : PubMed/NCBI
|
|
19
|
Fisseler-Eckhoff A: New TNM classification
of malignant lung tumors 2009 from a pathology perspective.
Pathologe. 30 Suppl 2:S193–S199. 2009.(In German). View Article : Google Scholar
|
|
20
|
Pfaffl MW: A new mathematical model for
relative quantification in real-time RT-PCR. Nucleic Acids Res.
29:e452001. View Article : Google Scholar : PubMed/NCBI
|
|
21
|
Calmon MF, Colombo J, Carvalho F, Souza
FP, Filho JF, Fukuyama EE, Camargo AA, Caballero OL, Tajara EH,
Cordeiro JA, et al: Methylation profile of genes CDKN2Ap14 and
p16), DAPK1CDH1, and ADAM23 in head and neck cancer. Cancer Genet
Cytogenet. 173:31–37. 2007. View Article : Google Scholar : PubMed/NCBI
|
|
22
|
Nguyen CT, Weisenberger DJ, Velicescu M,
Gonzales FA, Lin JC, Liang G and Jones PA: Histone H3-lysine 9
methylation is associated with aberrant gene silencing in cancer
cells and is rapidly reversed by 5-aza-2′-deoxycytidine. Cancer
Res. 62:6456–6461. 2002.PubMed/NCBI
|
|
23
|
Zigeuner R, Hutterer G, Chromecki T,
Imamovic A, Kampel-Kettner K, Rehak P, Langner C and Pummer K:
External validation of the Mayo Clinic stage, size, grade, and
necrosis (SSIGN) score for clear-cell renal cell carcinoma in a
single European centre applying routine pathology. Eur Urol.
57:102–109. 2010. View Article : Google Scholar : PubMed/NCBI
|
|
24
|
Gulati S, Martinez P, Joshi T, Birkbak NJ,
Santos CR, Rowan AJ, Pickering L, Gore M, Larkin J, Szallasi Z, et
al: Systematic evaluation of the prognostic impact and intratumour
heterogeneity of clear cell renal cell carcinoma biomarkers. Eur
Urol. 66:936–948. 2014. View Article : Google Scholar : PubMed/NCBI
|
|
25
|
Fisel P, Kruck S, Winter S, Bedke J,
Hennenlotter J, Nies AT, Scharpf M, Fend F, Stenzl A, Schwab M, et
al: DNA methylation of the SLC16A3 promoter regulates expression of
the human lactate transporter MCT4 in renal cancer with
consequences for clinical outcome. Clin Cancer Res. 19:5170–5181.
2013. View Article : Google Scholar : PubMed/NCBI
|
|
26
|
Furuse M, Hirase T, Itoh M, Nagafuchi A,
Yonemura S and Tsukita S and Tsukita S: Occludin: A novel integral
membrane protein localizing at tight junctions. J Cell Biol.
123:1777–1788. 1993. View Article : Google Scholar : PubMed/NCBI
|
|
27
|
Balda MS, Whitney JA, Flores C, González
S, Cereijido M and Matter K: Functional dissociation of
paracellular permeability and transepithelial electrical resistance
and disruption of the apical-basolateral intramembrane diffusion
barrier by expression of a mutant tight junction membrane protein.
J Cell Biol. 134:1031–1049. 1996. View Article : Google Scholar : PubMed/NCBI
|
|
28
|
Balda MS, Flores-Maldonado C, Cereijido M
and Matter K: Multiple domains of occludin are involved in the
regulation of paracellular permeability. J Cell Biochem. 78:85–96.
2000. View Article : Google Scholar : PubMed/NCBI
|
|
29
|
Tsukita S, Furuse M and Itoh M:
Multifunctional strands in tight junctions. Nat Rev Mol Cell Biol.
2:285–293. 2001. View Article : Google Scholar : PubMed/NCBI
|
|
30
|
Farquhar MG and Palade GE: Junctional
complexes in various epithelia. J Cell Biol. 17:375–412. 1963.
View Article : Google Scholar : PubMed/NCBI
|
|
31
|
Thiery JP and Sleeman JP: Complex networks
orchestrate epithelial-mesenchymal transitions. Nat Rev Mol Cell
Biol. 7:131–142. 2006. View Article : Google Scholar : PubMed/NCBI
|
|
32
|
Orbán E, Szabó E, Lotz G, Kupcsulik P,
Páska C, Schaff Z and Kiss A: Different expression of occludin and
ZO-1 in primary and metastatic liver tumors. Pathol Oncol Res.
14:299–306. 2008. View Article : Google Scholar : PubMed/NCBI
|
|
33
|
Martin TA, Mansel RE and Jiang WG: Loss of
occludin leads to the progression of human breast cancer. Int J Mol
Med. 26:723–734. 2010. View Article : Google Scholar : PubMed/NCBI
|
|
34
|
Tobioka H, Isomura H, Kokai Y, Tokunaga Y,
Yamaguchi J and Sawada N: Occludin expression decreases with the
progression of human endometrial carcinoma. Hum Pathol. 35:159–164.
2004. View Article : Google Scholar : PubMed/NCBI
|
|
35
|
Tobioka H, Tokunaga Y, Isomura H, Kokai Y,
Yamaguchi J and Sawada N: Expression of occludin, a
tight-junction-associated protein, in human lung carcinomas.
Virchows Arch. 445:472–476. 2004. View Article : Google Scholar : PubMed/NCBI
|
|
36
|
Rachow S, Zorn-Kruppa M, Ohnemus U,
Kirschner N, Vidal-y-Sy S, von den Driesch P, Börnchen C, Eberle J,
Mildner M, Vettorazzi E, et al: Occludin is involved in adhesion,
apoptosis, differentiation and Ca2+-homeostasis of human
keratinocytes: Implications for tumorigenesis. PLoS One.
8:e551162013. View Article : Google Scholar : PubMed/NCBI
|
|
37
|
Osanai M, Murata M, Nishikiori N, Chiba H,
Kojima T and Sawada N: Epigenetic silencing of occludin promotes
tumorigenic and metastatic properties of cancer cells via
modulations of unique sets of apoptosis-associated genes. Cancer
Res. 66:9125–9133. 2006. View Article : Google Scholar : PubMed/NCBI
|
|
38
|
Ellinger J, Kahl P, Mertens C, Rogenhofer
S, Hauser S, Hartmann W, Bastian PJ, Büttner R, Müller SC and von
Ruecker A: Prognostic relevance of global histone H3 lysine 4
(H3K4) methylation in renal cell carcinoma. Int J Cancer.
127:2360–2366. 2010. View Article : Google Scholar : PubMed/NCBI
|
|
39
|
Ye D, Guo S, Al-Sadi R and Ma TY: MicroRNA
regulation of intestinal epithelial tight junction permeability.
Gastroenterology. 141:1323–1333. 2011. View Article : Google Scholar : PubMed/NCBI
|
|
40
|
Munari E, Marchionni L, Chitre A, Hayashi
M, Martignoni G, Brunelli M, Gobbo S, Argani P, Allaf M, Hoque MO,
et al: Clear cell papillary renal cell carcinoma: micro-RNA
expression profiling and comparison with clear cell renal cell
carcinoma and papillary renal cell carcinoma. Hum Pathol.
45:1130–1138. 2014. View Article : Google Scholar : PubMed/NCBI
|
|
41
|
White NM, Bao TT, Grigull J, Youssef YM,
Girgis A, Diamandis M, Fatoohi E, Metias M, Honey RJ, Stewart R, et
al: miRNA profiling for clear cell renal cell carcinoma: Biomarker
discovery and identification of potential controls and consequences
of miRNA dysregulation. J Urol. 186:1077–1083. 2011. View Article : Google Scholar : PubMed/NCBI
|
|
42
|
Zhou L, Chen J, Li Z, Li X, Hu X, Huang Y,
Zhao X, Liang C, Wang Y, Sun L, et al: Integrated profiling of
microRNAs and mRNAs: microRNAs located on Xq27.3 associate with
clear cell renal cell carcinoma. PLoS One. 5:e152242010. View Article : Google Scholar : PubMed/NCBI
|
|
43
|
Fong MY, Zhou W, Liu L, Alontaga AY,
Chandra M, Ashby J, Chow A, O'Connor ST, Li S, Chin AR, et al:
Breast-cancer-secreted miR-122 reprograms glucose metabolism in
premetastatic niche to promote metastasis. Nat Cell Biol.
17:183–194. 2015. View Article : Google Scholar : PubMed/NCBI
|
|
44
|
Ruaro ME, Stebel M, Vatta P, Marzinotto S
and Schneider C: Analysis of the domain requirement in Gas1 growth
suppressing activity. FEBS Lett. 481:159–163. 2000. View Article : Google Scholar : PubMed/NCBI
|
|
45
|
Stebel M, Vatta P, Ruaro ME, Del Sal G,
Parton RG and Schneider C: The growth suppressing gas1 product is a
GPI-linked protein. FEBS Lett. 481:152–158. 2000. View Article : Google Scholar : PubMed/NCBI
|
|
46
|
Del Sal G, Ruaro ME, Philipson L and
Schneider C: The growth arrest-specific gene, gas1, is involved in
growth suppression. Cell. 70:595–607. 1992. View Article : Google Scholar : PubMed/NCBI
|
|
47
|
Beachy PA, Karhadkar SS and Berman DM:
Tissue repair and stem cell renewal in carcinogenesis. Nature.
432:324–331. 2004. View Article : Google Scholar : PubMed/NCBI
|
|
48
|
Allen BL, Tenzen T and McMahon AP: The
Hedgehog-binding proteins Gas1 and Cdo cooperate to positively
regulate Shh signaling during mouse development. Genes Dev.
21:1244–1257. 2007. View Article : Google Scholar : PubMed/NCBI
|
|
49
|
Wang H, Zhou X, Zhang Y, Zhu H, Zhao L,
Fan L, Wang Y, Gang Y, Wu K, Liu Z, et al: Growth arrest-specific
gene 1 is downregulated and inhibits tumor growth in gastric
cancer. FEBS J. 279:3652–3664. 2012. View Article : Google Scholar : PubMed/NCBI
|
|
50
|
Jiang Z, Xu Y and Cai S: Down-regulated
GAS1 expression correlates with recurrence in stage II and III
colorectal cancer. Hum Pathol. 42:361–368. 2011. View Article : Google Scholar : PubMed/NCBI
|
|
51
|
Gobeil S, Zhu X, Doillon CJ and Green MR:
A genome-wide shRNA screen identifies GAS1 as a novel melanoma
metastasis suppressor gene. Genes Dev. 22:2932–2940. 2008.
View Article : Google Scholar : PubMed/NCBI
|
|
52
|
Scaltriti M, Brausi M, Amorosi A, Caporali
A, DArca D, Astancolle S, Corti A and Bettuzzi S: Clusterin (SGP-2,
ApoJ) expression is downregulated in low- and high-grade human
prostate cancer. Int J Cancer. 108:23–30. 2004. View Article : Google Scholar : PubMed/NCBI
|
|
53
|
Sacilotto N, Espert A, Castillo J, Franco
L and López-Rodas G: Epigenetic transcriptional regulation of the
growth arrest-specific gene 1Gas1) in hepatic cell proliferation at
mononucleosomal resolution. PLoS One. 6:e233182011. View Article : Google Scholar : PubMed/NCBI
|
|
54
|
Ma Y, Qin H and Cui Y: MiR-34a targets
GAS1 to promote cell proliferation and inhibit apoptosis in
papillary thyroid carcinoma via PI3K/Akt/Bad pathway. Biochem
Biophys Res Commun. 441:958–963. 2013. View Article : Google Scholar : PubMed/NCBI
|
|
55
|
Zhang L, He S, Guo S, Xie W, Xin R, Yu H,
Yang F, Qiu J, Zhang D, Zhou S, et al: Down-regulation of miR-34a
alleviates mesangial proliferation in vitro and glomerular
hypertrophy in early diabetic nephropathy mice by targeting GAS1. J
Diabetes Complications. 28:259–264. 2014. View Article : Google Scholar : PubMed/NCBI
|
|
56
|
Liu H, Brannon AR, Reddy AR, Alexe G,
Seiler MW, Arreola A, Oza JH, Yao M, Juan D, Liou LS, et al:
Identifying mRNA targets of microRNA dysregulated in cancer: With
application to clear cell renal cell carcinoma. BMC Syst Biol.
4:512010. View Article : Google Scholar : PubMed/NCBI
|
|
57
|
Yu G, Li H, Wang J, Gumireddy K, Li A, Yao
W, Tang K, Xiao W, Hu J, Xiao H, et al: miRNA-34a suppresses cell
proliferation and metastasis by targeting CD44 in human renal
carcinoma cells. J Urol. 192:1229–1237. 2014. View Article : Google Scholar : PubMed/NCBI
|
|
58
|
Dutta KK, Zhong Y, Liu YT, Yamada T,
Akatsuka S, Hu Q, Yoshihara M, Ohara H, Takehashi M, Shinohara T,
et al: Association of microRNA-34a overexpression with
proliferation is cell type-dependent. Cancer Sci. 98:1845–1852.
2007. View Article : Google Scholar : PubMed/NCBI
|
|
59
|
Yan S, Wang Y, Chen M, Li G and Fan J:
Deregulated SLC2A1 promotes tumor cell proliferation and metastasis
in gastric cancer. Int J Mol Sci. 16:16144–16157. 2015. View Article : Google Scholar : PubMed/NCBI
|
|
60
|
Amann T, Maegdefrau U, Hartmann A, Agaimy
A, Marienhagen J, Weiss TS, Stoeltzing O, Warnecke C, Schölmerich
J, Oefner PJ, et al: GLUT1 expression is increased in
hepatocellular carcinoma and promotes tumorigenesis. Am J Pathol.
174:1544–1552. 2009. View Article : Google Scholar : PubMed/NCBI
|
|
61
|
Krzeslak A, Wojcik-Krowiranda K, Forma E,
Jozwiak P, Romanowicz H, Bienkiewicz A and Brys M: Expression of
GLUT1 and GLUT3 glucose transporters in endometrial and breast
cancers. Pathol Oncol Res. 18:721–728. 2012. View Article : Google Scholar : PubMed/NCBI
|
|
62
|
Manel N, Kim FJ, Kinet S, Taylor N, Sitbon
M and Battini JL: The ubiquitous glucose transporter GLUT-1 is a
receptor for HTLV. Cell. 115:449–459. 2003. View Article : Google Scholar : PubMed/NCBI
|
|
63
|
Augustin R: The protein family of glucose
transport facilitators: It's not only about glucose after all.
IUBMB Life. 62:315–333. 2010.PubMed/NCBI
|
|
64
|
Cifuentes M, García MA, Arrabal PM,
Martínez F, Yañez MJ, Jara N, Weil B, Domínguez D, Medina RA and
Nualart F: Insulin regulates GLUT1-mediated glucose transport in
MG-63 human osteosarcoma cells. J Cell Physiol. 226:1425–1432.
2011. View Article : Google Scholar : PubMed/NCBI
|
|
65
|
Vermeulen JF, van Brussel AS, van der
Groep P, Morsink FH, Bult P, van der Wall E and van Diest PJ:
Immunophenotyping invasive breast cancer: Paving the road for
molecular imaging. BMC Cancer. 12:2402012. View Article : Google Scholar : PubMed/NCBI
|
|
66
|
Vermeulen JF, van der Wall E, Witkamp AJ
and van Diest PJ: Analysis of expression of membrane-bound tumor
markers in ductal carcinoma in situ of the breast: Paving the way
for molecular imaging. Cell Oncol. 36:333–340. 2013. View Article : Google Scholar
|