Introduction
Gastric cancer (GC) is the fourth most common cancer
and the third most common cause of cancer-related death worldwide
(1). Advances in chemotherapy and
surgical techniques have increased the survival rate of patients
with GC, but the outcome of this common malignancy remains
unsatisfactory because of a poor understanding of the pathogenesis
of GC and the lack of specific targeted gene therapy (2,3). Since
multiple genetic alterations in tumor suppressor genes and
oncogenes are involved in gastric carcinogenesis, identifying
mechanisms that underlie this malignancy is important (4). The identification of predictive
markers for cancer progression and prognosis would aid in the
assessment of the clinical outcome and potential treatment
stratification for patients with GC (5–9).
cAMP is a second messenger whose signaling controls
a variety of functions in cancer cells. However, its role is
complex and depends on both the tissue type and the specific cAMP
sensor that transduces the signal (10). cAMP signals are mediated by two
ubiquitously expressed intracellular receptor families: the classic
cAMP-dependent protein kinase (PKA) and the more recently
discovered exchange protein directly activated by cAMP (EPAC)
(11). EPAC has two isoforms, EPAC1
and EPAC2, which primarily act as guanine nucleotide exchange
factors that activate the small G proteins, Rap1 and Rap2 (12). These small G proteins in turn
mediate the vast majority of EPAC responses, which span a wide
array of biologic functions, including the regulation of cell
adhesion, migration and proliferation, in different cell types
(13).
Gene amplification and protein overexpression of
EPAC1 are observed in several human cancers, including pancreatic
cancer and melanoma. In one study, the expression levels of EPAC1
protein were examined by immunohistochemistry in pancreatic
tissues. The staining was markedly enhanced in pancreatic cancer
tissues compared with surrounding normal tissues (14). In another study, quantitative
real-time PCR also confirmed significantly higher levels of EPAC1
in metastatic melanoma compared with primary melanoma (15). The clinical significance of EPAC1
has gained increased attention in recent years, and many studies
have focused on the relationship between EPAC1 and cancer cell
migration. The role that EPAC1 plays in the regulation of cancer
cell migration is controversial, and it appears to be dependent on
the tissue type. In melanoma, the consensus states that EPAC1
enhances metastasis, as shown in several in vitro and in
vivo studies (16,17). In prostate cancer, some studies
suggest that EPAC1 promotes migration and proliferation (18,19),
whereas others suggest an inhibitory role for the EPAC-selective
activator 8-(4-chlorophenylthio)-29-O-methyladenosine-39, 59-cyclic
monophosphate (007) (13). However,
it has been argued that it is actually the indirect activation of
cAMP-dependent protein kinase by 007, not the activation of EPAC1,
that leads to the inhibition of migration and proliferation of
prostate cancer cells (20). In
ovarian cancer, EPAC1 seems to exert promigratory effects in some
cell lines (Ovcar3) (21) and
antimigratory effects in others (ES-2) (22).
Thus far, the correlations between the EPAC1
expression level in GC and clinicopathologic parameters and
prognosis have not been established. Therefore, this study
investigated the correlations between EPAC1 expression and
clinicopathologic parameters and evaluated the significance of
EPAC1 in the prediction of the prognosis of patients with GC.
Material and methods
Participants and specimens
The patient cohort examined in this study comprised
141 consecutive GC cases from 1999 through 2011 with documented
clinicopathologic factors and clinical outcomes. None of these
patients had received preoperative chemotherapy and/or
radiotherapy. For each patient, we analyzed paired tumor and
non-tumor gastric tissues to determine the expression of EPAC1. The
institutional review board at Wan Fang Hospital approved the tissue
acquisition protocol for the immunohistochemical and quantitative
real-time PCR study (approval no. 99049). Written informed consent
was obtained from each participant before tissue acquisition.
Immunohistochemical analysis
Paraffin-embedded sections were deparaffinized,
rehydrated and subjected to antigen retrieval (pH 6.0 citrate
buffer for 40 min at 95°C). After blocking with 5% normal goat
serum (Abcam, Cambridge, UK), the slides were subsequently
incubated with the primary antibody rabbit anti-human EPAC1
monoclonal antibody (LifeSpan Biosciences, Seattle, WA, USA) for 45
min at room temperature at a dilution of 1:200. The
immunoreactivity was detected using the avidin-biotin-peroxidase
complex method according to the manufacturer's instructions. A
sensitive Dako Real EnVision Detection System was used (Dako North
America, Carpinteria, CA, USA). Normal kidney was used as a
positive control for EPAC1. The sections were then scored using a
semi-quantitative scoring system that accounted for staining
intensity (0, no staining; 1, weak staining; 2, strong staining)
and the fraction of positively stained tumor cells (0, no staining;
1, less than half of cells stained; 2, more than half of cells
stained). The final score was calculated for each sample by
multiplying the score for the intensity and the score for the
percentage of staining: 0, no staining; 1, weak staining; 2,
moderate staining; 4, strong staining. Sections with a score of 0
or 1 displayed low expression of EPAC1, whereas those with scores
of 2 or 4 displayed high expression or overexpression of EPAC1. The
collection of clinical data and the immunohistochemical analysis
were performed independently of each other in an
investigator-blinded study.
RNA extraction and cDNA synthesis
According to the manufacturer's instructions, total
RNA from 10 tumor and non-tumor pairs of gastric tissues was
isolated using an RNA extraction kit (Zymo Reserach, Irvine, CA,
USA). cDNA synthesis was performed as described in our previous
study (23). Synthesized cDNA was
stored at −20°C until use.
Primers and quantitative real-time
PCR
Primers for EPAC1 and GAPDH, which was used as an
internal control, and real-time PCR master mix (KiCqStart SYBR
Green qPCR Ready Mix) were purchased from Sigma (St. Louis, MO,
USA). Primer sequences are shown in Table I. The expression levels of the
target genes were measured using quantitative real-time PCR in an
Illumina Eco Real-time PCR System (Illumina, San Diego, CA, USA).
The level of EPAC1 mRNA in tumor and non-tumor tissue was
determined relative to GAPDH.
 | Table I.Primers used in quantitative real-time
PCR. |
Table I.
Primers used in quantitative real-time
PCR.
| Gene | Sequence |
|---|
| EPAC1 | Forward:
ccgaagctgctcctacca |
|
| Reverse:
actcctcgctgttggtgagt |
| GAPDH | Forward:
acagttgccatgtagacc |
|
| Reverse:
tttttggttgagcacagg |
Cell culture
The normal human gastric cell line Hs738.St/Int was
obtained from the American Type Culture Collection (ATCC, Manassas,
VA, USA). The GC cell lines NCI-N87, TMC-1 and TSGH 9201 were
obtained from the Bioresource Collection and Research Center (BCRC,
Hsinchu, Taiwan). The GC cell lines SK-GT-2 and HGC-27 were
obtained from the European Collection of Cell Cultures (ECACC,
Salisbury, UK), and the GC cell line 23132/87 was obtained from
Creative Bioarray (Shirley, NY, USA). Cells were cultured in DMEM
(Gibco, Grand Island, NY, USA, for Hs738.St/Int), RPMI-1640 (Gibco,
for NCI-N87, TMC-1, TSGH 9201, SK-GT-2 and 23132/87), MEM
(Mediatech, Manassas, VA, USA for HGC-27) media supplemented with
10% fetal bovine serum (FBS), 100 U/ml penicillin G, 100 µg/ml
streptomycin sulfate, and 250 ng/ml amphotericin B (Gibco).
Total protein preparation
Total protein was extracted using M-PER Mammalian
Protein Extraction Reagent (Pierce Biotechnology, Rockford, IL,
USA), according to the manufacturer's instructions. The samples
were stored at −80°C until use. The protein concentration was
determined using a BCA Protein assay kit (Pierce Biotechnology)
with bovine serum albumin as the standard.
Immunoblotting
Denatured protein samples were subjected to SDS-PAGE
and transferred to nitrocellulose membranes. After blocking with 5%
non-fat dry milk (Santa Cruz Biotechnology, Dallas, TX, USA), the
membranes were incubated with an anti-EPAC1 polyclonal antibody
(1:1000 dilution) at 4°C overnight and were further incubated with
the appropriate peroxidase-conjugated secondary antibody (Sigma)
for 1 h at room temperature. Reactive bands were detected using
Western Lighting ECL Pro chemiluminescent substrate (Perkin-Elmer,
Waltham, MA, USA) The band intensity was quantitatively analyzed
using Fuji Image Gauge software (Fuji Co., Tokyo, Japan), and the
absolute intensity of EPAC1 was normalized to the absolute
intensity of GAPDH.
siRNA treatment
SK-GT-2 cells were seeded at 50% confluence. For
siRNA treatment, cells were transfected with siRNAs (two
EPAC1-siRNAs, oligo no. 8022287661–000080 and 8022287661-000110;
and one control, oligo no. 8022065260-000020, purchased from Sigma)
at a concentration of 10 nM by using MISSION siRNA Transfection
Reagent (Sigma). After transfection, the knockdown efficiency was
examined by immunoblotting.
Colony formation assay
Five hundred cells were seeded into 6-well plates
and cultured for 12 days. Individual colonies (>50 cells/colony)
were fixed, stained in a solution of 1% crystal violet in methanol,
and counted. The plates were scanned with a Scanjet 2200c scanner
(Hewlett-Packard, Palo Alto, CA, USA). After scanning, methanol was
added to solubilize crystal violet at room temperature with
shaking. The optical density (OD540) was measured to
quantify the amount of colony formation. The assay was performed
three times, and the results are presented as the mean ± the
standard deviation (SD).
Cell invasion assay
The cell invasion capability was examined with a
Cell Invasion assay kit (Merck Millipore, Darmstadt, Germany)
according to the manufacturer's instructions. Complete media were
first added to 24-well plates. Then, cells (2×10⁵) in
serum-free media were added to ECMatrix-layered cell culture
inserts (containing polycarbonate membranes with pores 8 µm in
diameter) and cultured for 72 h. After the cells on the upper
surface were removed, the inserts were then dipped in staining
solution to stain the cells that had invaded the lower surface of
the membranes. The cultures were imaged (x100 magnification), using
a Leica DMIRB microscope (Wetzlar, Germany). The number of invaded
cells was counted. The assay was performed three times, and the
results are presented as the mean ± SD.
Statistical analysis
Paired t-tests were used to assess the difference in
EPAC1 expression between tumor and non-tumor tissues for each
patient. The differences in growth and invasion between EPAC1
knockdown and control cells were analyzed using Student's t-tests.
We also examined the following clinicopathological parameters: age,
gender, depth of invasion, nodal status, distant metastasis, stage,
degree of differentiation, and vascular invasion. The correlation
between EPAC1 expression and each clinicopathological parameter was
examined using the χ2 test. The time-to-event endpoints
for the parameters were plotted according to the Kaplan-Meier
method, and the degree of significance was calculated by the
univariate log-rank test. Parameters that emerged as significant
(P≤0.05) in univariate Cox regression analysis were entered as
variables in the multivariate Cox regression model; the hazard
ratio (HR) and independent prognostic impact were determined in a
stepwise backward fashion. All data were analyzed using SPSS
software version 20.0 (SPSS, Chicago, IL, USA), and a P-value of
<0.05 was considered significant.
Results
Basic data
This study enrolled 141 patients with GC; of these,
90 were men, and 51 were women (Table
II). The age of the patients ranged from 32 to 96 years at the
time of first diagnosis (mean, 68.7 years). According to the AJCC
classification system, 25 patients had stage I disease, 38 had
stage II, 59 had stage III, and 19 had stage IV disease. The
follow-up period for all patients ranged from 30 to 3498 days
(mean, 925 days). During the follow-up period, 88 patients died as
a result of GC.
| Table II.Demographic data and survival in
different stages of GC according to the AJCC classification. |
Table II.
Demographic data and survival in
different stages of GC according to the AJCC classification.
| Variables | Stage I (n=25) | Stage II
(n=38) | Stage III
(n=59) | Stage IV
(n=19) | Total (n=141) |
|---|
| Gender |
|
|
|
|
|
|
Male | 15 | 23 | 40 | 12 | 90 |
|
Female | 10 | 15 | 19 | 7 | 51 |
| Age
(years)a | 67.3 (12.7) | 74.7 (12.4) | 69.2 (14.0) | 57.4 (14.9) | 68.7 (14.3) |
| Follow-up period
(days)a | 1386.9 (952.1) | 1097.1 (859.1) | 800.0 (812.7) | 363.1 (270.8) | 925.2 (853.9) |
| Survival |
|
|
|
|
|
|
Yes | 18 (72%) | 20 (53%) | 13 (22%) | 2
(11%) | 53 (38%) |
| No | 7
(28%) | 18 (47%) | 46 (78%) | 17 (89%) | 88 (62%) |
EPAC1 expression is upregulated and
associated with several clinicopathological parameters in GC
To investigate the potential significance of EPAC1
in the development and progression of GC, we first examined the
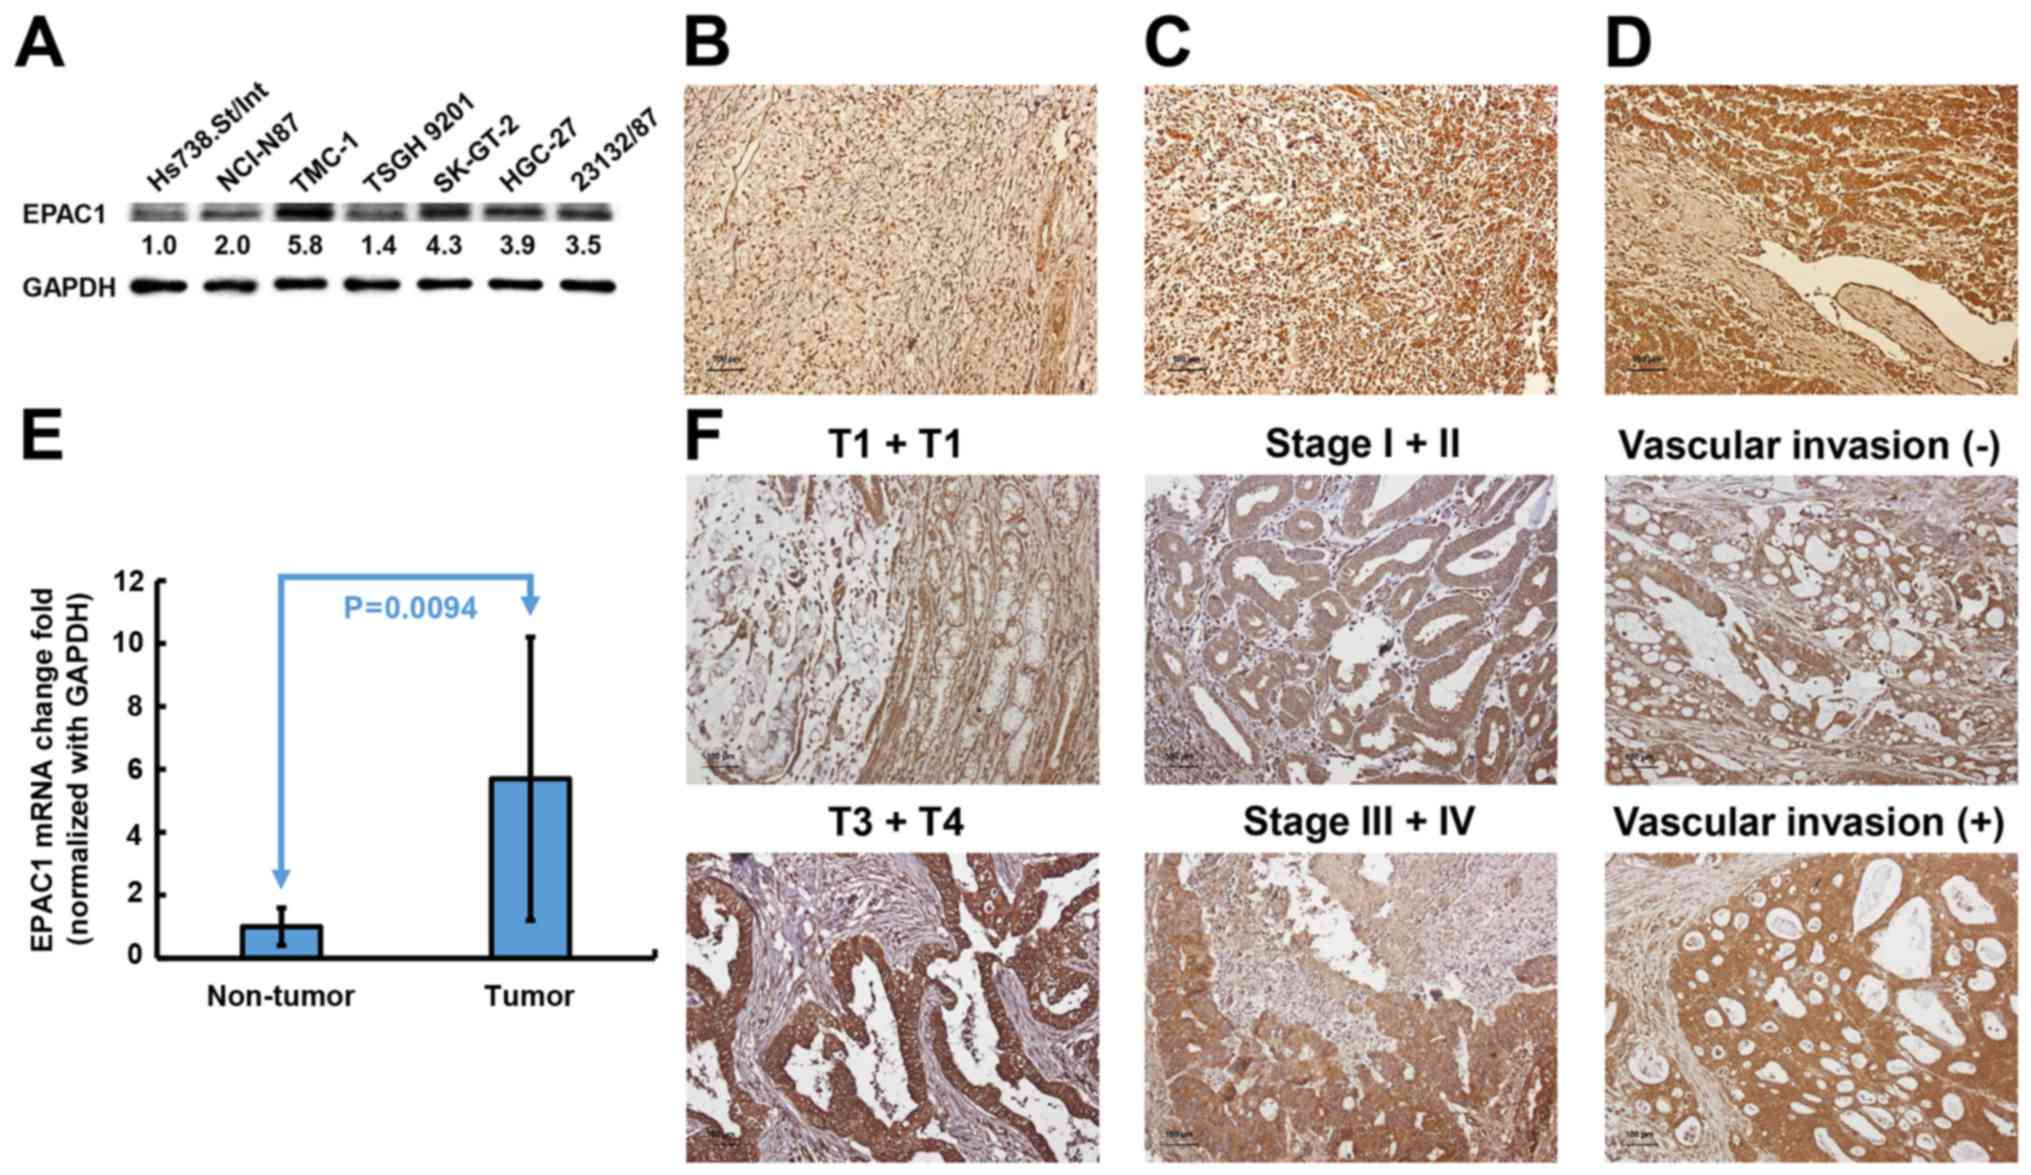
expression of EPAC1 in gastric cell lines. As shown in Fig. 1A, immunoblotting revealed that EPAC1
protein expression was markedly increased in all 6 GC cell lines
compared with Hs738.St/Int cells. An independent cohort comprised
of 141 GC patients was enrolled to validate the results from
cellular study. Immunohistochemical analysis showed that EPAC1 was
expressed at higher levels in tumor tissues compared with non-tumor
tissues (P<0.001) (Fig. 1B).
Eleven percent of the tumors were completely negative for EPAC1
(score 0), and 35% of the tumors showed weak staining in <50% of
the tumor cells (score 1) (Fig.
1C). Fifty-four percent of the tumors revealed high expression
or overexpression of EPAC1 (48% had a score of 2, and 6% had a
score 4, Fig. 1D). Quantitative
real-time PCR analysis also indicated that EPAC1 mRNA was
ubiquitously expressed at higher levels in GC tissues compared with
normal gastric tissues (Fig. 1E).
These data strongly suggested that EPAC1 expression is
significantly elevated in GC.
The observed upregulated expression of EPAC1 in GC
prompted us to further investigate the clinical relevance of EPAC1
in the progression of GC. As shown in Table III, the overexpression of EPAC1
was closely associated with depth of invasion (P=0.0021), stage
(P=0.0429), and vascular invasion (P=0.0049). Representative
photomicrographs of EPAC1 expression for the different parameters
are shown in Fig. 1F. No
significant association was found between the overexpression of
EPAC1 and the other clinicopathological parameters examined.
| Table III.EPAC1 expression in GC and its
correlation with clinicopathological parameters. |
Table III.
EPAC1 expression in GC and its
correlation with clinicopathological parameters.
|
|
| EPAC1
expression |
|
|---|
|
|
|
|
|
|---|
| Variables | n | Score 0 or 1
(n=65) | Score 2 or 4
(n=76) |
P-valuea |
|---|
| Age (yrs.) |
|
|
| 0.2974 |
|
≥66 | 91 | 39 | 52 |
|
|
<66 | 50 | 26 | 24 |
|
| Gender |
|
|
| 0.6005 |
|
Male | 90 | 40 | 50 |
|
|
Female | 51 | 25 | 26 |
|
| Lauren
classification |
|
|
| 0.7747 |
|
Intestinal | 95 | 43 | 52 |
|
|
Diffuse | 46 | 22 | 24 |
|
| Depth of
invasion |
|
|
| 0.0021 |
| T1 +
T2 | 35 | 24 | 11 |
|
| T3 +
T4 | 106 | 41 | 65 |
|
| Nodal status |
|
|
| 0.2381 |
| N0 | 45 | 24 | 21 |
|
| N1 + N2
+ N3 | 96 | 41 | 55 |
|
| Distant
metastasis |
|
|
| 0.0629 |
|
Absent | 122 | 60 | 62 |
|
|
Present | 19 | 5 | 14 |
|
| Stage |
|
|
| 0.0429 |
| I +
II | 63 | 35 | 28 |
|
| III +
IV | 78 | 30 | 48 |
|
| Degree of
differentiation |
|
|
| 0.4696 |
|
Poor | 61 | 26 | 35 |
|
| Well to
moderate | 80 | 39 | 41 |
|
| Vascular
invasion |
|
|
| 0.0049 |
|
Absent | 44 | 28 | 16 |
|
|
Present | 97 | 37 | 60 |
|
Overexpression of EPAC1 as a
prognostic marker for GC
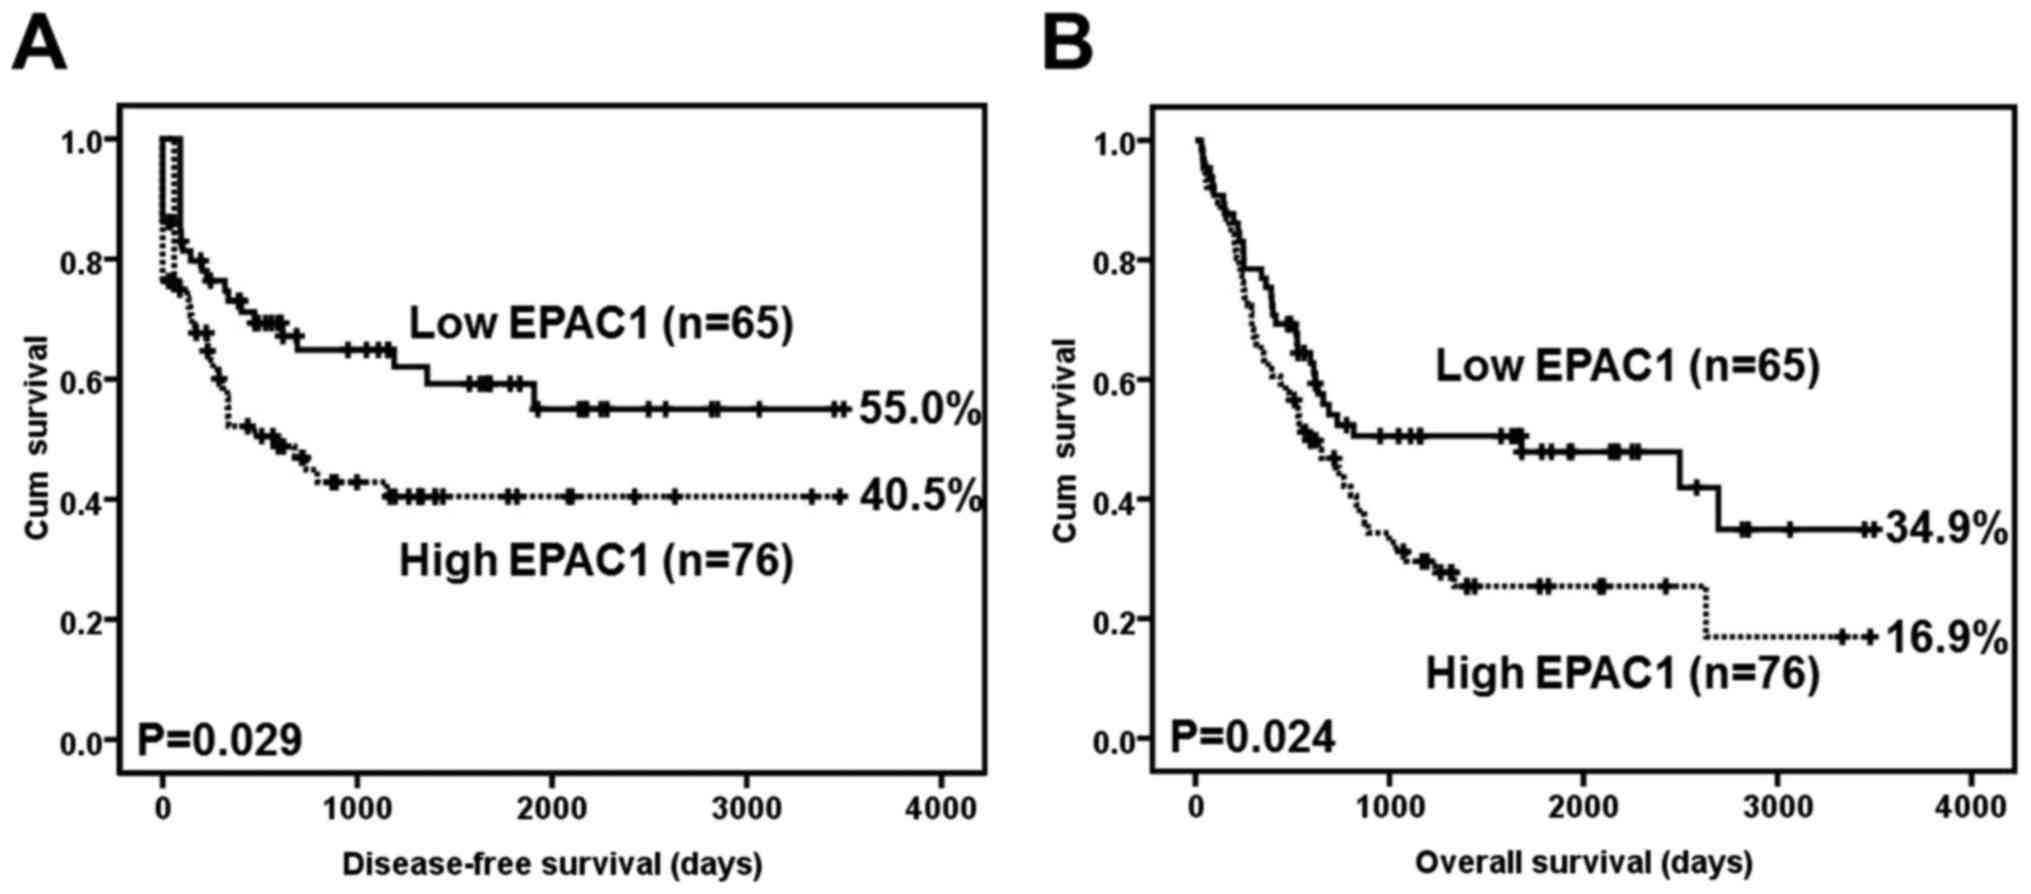
A Kaplan-Meier analysis using the log-rank test
showed that EPAC1 overexpression was significantly associated with
inferior disease-free survival (P=0.029) (Fig. 2A). At 5 years, 15 EPAC1-low patients
were at risk, and the disease-free survival rate was 0.592 [95%
confidence interval (CI) 0.4568–0.7272]; moreover, 6 EPAC1-high
patients were at risk, and the disease-free survival rate was 0.405
(95% CI, 0.2815–0.5285).
EPAC1 overexpression was also significantly
associated with inferior overall survival (P=0.024) (Fig. 2B). At 5 years, 16 EPAC1-low patients
were at risk, and the overall survival rate was 0.479 (95% CI,
0.3496–0.6084); moreover, 6 EPAC1-high patients were at risk, and
the overall survival rate was 0.254 (95% CI, 0.3618–0.8698).
Table IV summarizes
the univariate analysis of prognostic markers and patient survival.
The following parameters were significantly correlated with
disease-free survival: EPAC1 overexpression (HR, 1.714; 95% CI,
1.031–2.850; P=0.038), Lauren classification (HR, 1.743; 95% CI,
1.060–2.865; P=0.029), depth of invasion (HR, 5.158; 95% CI,
2.064–12.890; P<0.001), nodal status (HR, 8.656; 95% CI,
3.456–21.680; P<0.001), distant metastasis (HR, 14.607; 95% CI,
6.440–33.133; P<0.001), stage (HR, 8.098; 95% CI, 3.973–16.510;
P<0.001), degree of differentiation (HR, 0.464; 95% CI,
0.282–0.762; P=0.002), and vascular invasion (HR, 5.332; 95% CI,
2.419–11.571; P<0.001). In the multivariate analysis, distant
metastasis (HR, 8.647; 95% CI, 3.603–20.751; P<0.001) was still
an independent prognostic marker. EPAC1 overexpression, however,
was not prognostically independent (HR, 1.087; 95% CI, 0.626–1.890;
P=0.766) (Table V).
| Table IV.Univariate analysis of prognostic
markers in 141 patients with GC. |
Table IV.
Univariate analysis of prognostic
markers in 141 patients with GC.
| Variables | HR (95%
CI)a |
P-valuea |
|---|
| EPAC1 | 1.714
(1.031–2.850) | 0.038 |
| Low
expression |
|
|
| High
expression |
|
|
| Age (yrs.) | 0.804
(0.489–1.323) | 0.391 |
|
≥66 |
|
|
|
<66 |
|
|
| Gender | 0.709
(0.417–1.204) | 0.203 |
|
Male |
|
|
|
Female |
|
|
| Lauren
classification | 1.743
(1.060–2.865) | 0.029 |
|
Intestinal |
|
|
|
Diffuse |
|
|
| Depth of
invasion | 5.158
(2.064–12.890) | <0.001 |
| T1 +
T2 |
|
|
| T3 +
T4 |
|
|
| Nodal status | 8.656
(3.456–21.680) | <0.001 |
| N0 |
|
|
| N1 + N2
+ N3 |
|
|
| Distant
metastasis | 14.607
(6.440–33.133) | <0.001 |
|
Absent |
|
|
|
Present |
|
|
| Stage | 8.098
(3.973–16.510) | <0.001 |
| I +
II |
|
|
| III +
IV |
|
|
| Degree of
differentiation | 0.464
(0.282–0.762) | 0.002 |
|
Poor |
|
|
| Well to
moderate |
|
|
| Vascular
invasion | 5.332
(2.419–11.571) | <0.001 |
|
Absent |
|
|
|
Present |
|
|
| Table V.Multivariate analysis of prognostic
markers in 141 patients with GC. |
Table V.
Multivariate analysis of prognostic
markers in 141 patients with GC.
| Variables | HR (95%
CI)a |
P-valuea |
|---|
| EPAC1 | 1.087
(0.626–1.890) | 0.766 |
| Low
expression |
|
|
| High
expression |
|
|
| Lauren
classification | 0.694
(0.319–1.510) | 0.357 |
|
Intestinal |
|
|
|
Diffuse |
|
|
| Depth of
invasion | 1.424
(0.479–4.231) | 0.525 |
| T1 +
T2 |
|
|
| T3 +
T4 |
|
|
| Nodal status | 2.614
(0.775–8.819) | 0.121 |
| N0 |
|
|
| N1 + N2
+ N3 |
|
|
| Distant
metastasis | 8.647
(3.603–20.751) | <0.001 |
|
Absent |
|
|
|
Present |
|
|
| Stage | 2.293
(0.810–6.495) | 0.118 |
| I +
II |
|
|
| III +
IV |
|
|
| Degree of
differentiation | 0.609
(0.276–1.341) | 0.218 |
|
Poor |
|
|
| Well to
moderate |
|
|
| Vascular
invasion | 1.808
(0.752–4.344) | 0.186 |
|
Absent |
|
|
|
Present |
|
|
Silencing EPAC1 suppresses GC cell
proliferation and invasion
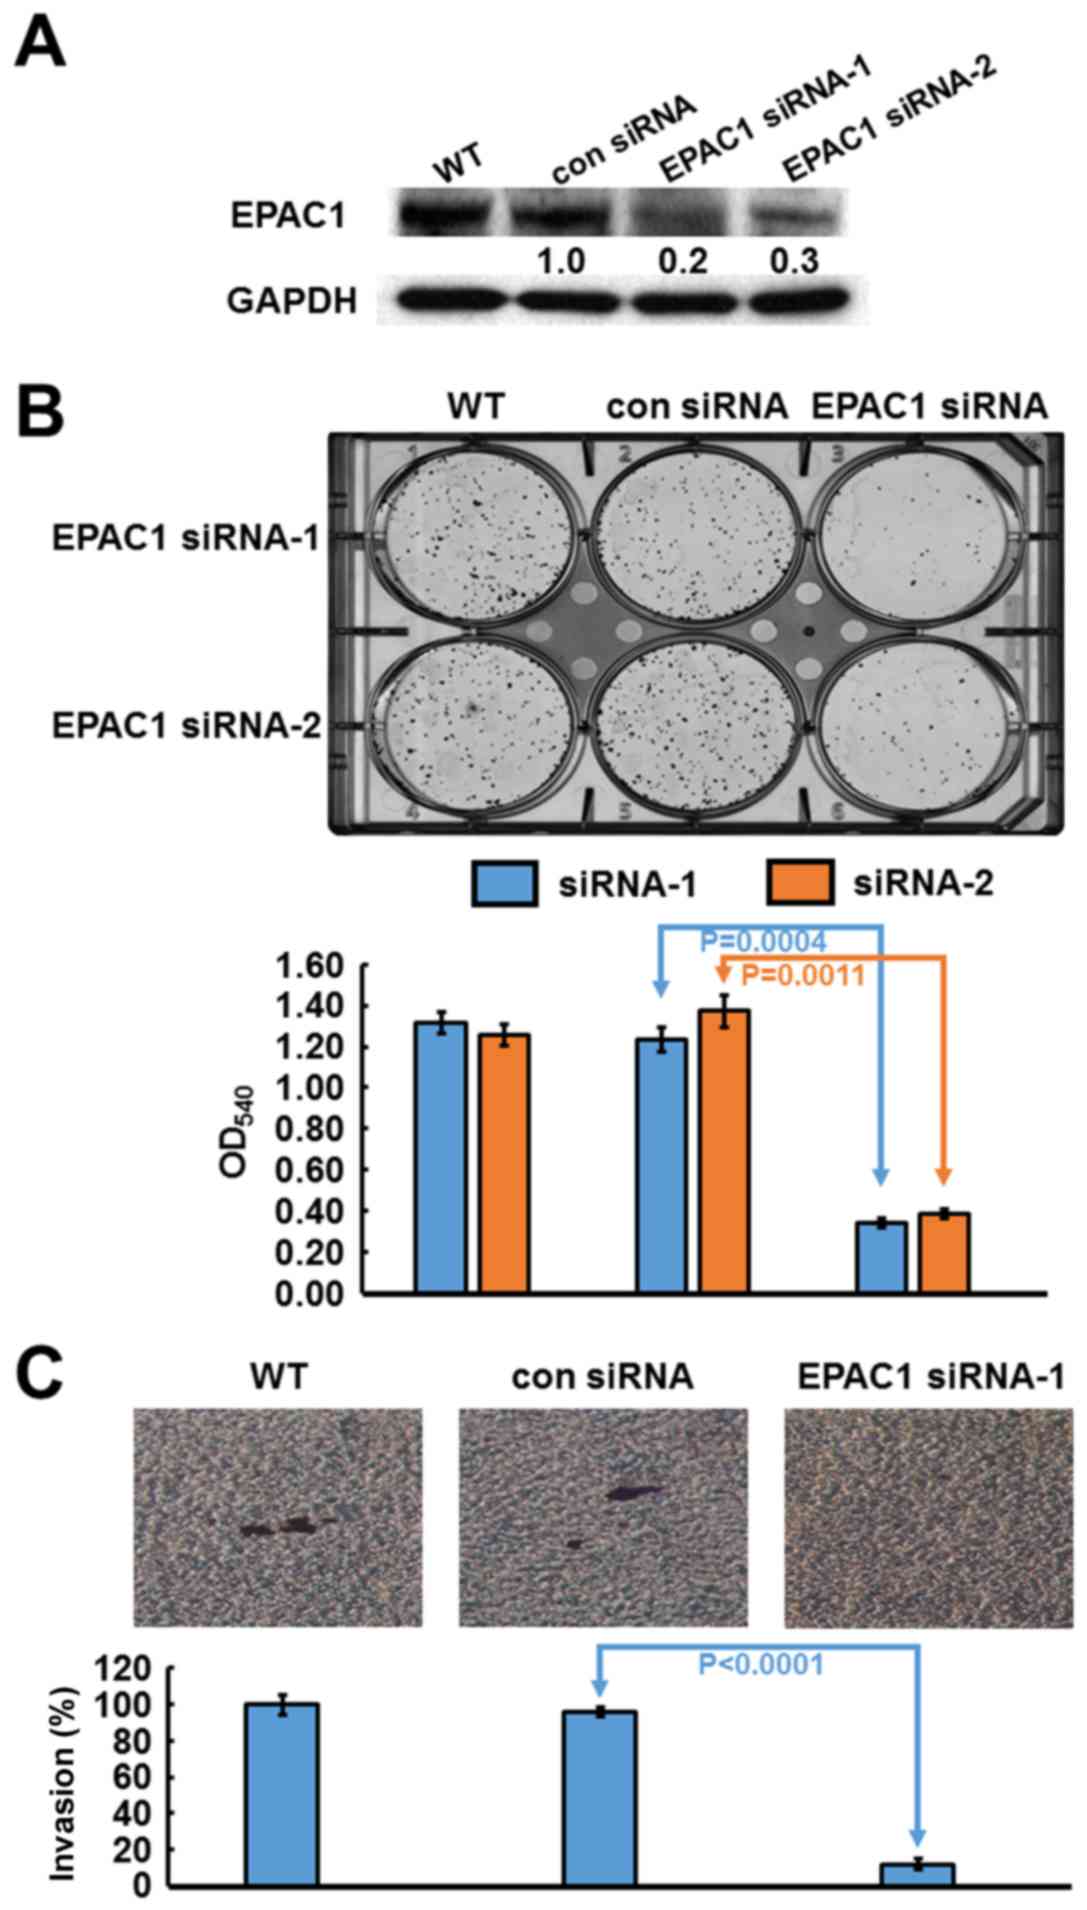
Based on their high expression level of EPAC1,
SK-GT-2 GC cells were selected to investigate the role of
endogenous EPAC1 in the modulation of cell proliferation. SK-GT-2
cells were transfected with EPAC1-siRNA to generate EPAC1-knockdown
SK-GT-2 cells (Fig. 3A). As shown
in Fig. 3B, the ability of SK-GT-2
cells to form colonies was compromised by EPAC1 knockdown compared
with the corresponding control cells. These results suggested that
the knockdown of EPAC1 suppresses the ability of GC cells to
proliferate in vitro.
Furthermore, according to the results of the
clinicopathologic correlation study, which showed that EPAC1
overexpression was closely associated with depth of invasion and
vascular invasion, the effect of EPAC1 knockdown on the
invasiveness of SK-GT-2 GC cells was examined. In the cell invasion
assay, EPAC1 knockdown significantly suppressed SK-GT-2 cell
invasion compared with the control cells (Fig. 3C).
Discussion
Surgical resection is generally considered the best
treatment to improve prognosis when the early diagnosis of gastric
cancer (GC) is successful (24).
Unfortunately, most cases of GC are already locally advanced and
are thus at a late stage at the time of diagnosis. Greater
knowledge of the molecular mechanisms underlying the development of
this deadly neoplasm is required if novel strategies for prevention
and treatment of GC are to be developed. In particular, the
identification of molecules that are altered during cancer
progression may lead to the use of those molecules as prognostic
markers or therapeutic targets.
After sensing cAMP, EPAC activates the small G
proteins Rap1 and Rap2, which in turn regulate a wide array of
biologic properties, including cell adhesion, migration and
proliferation, in different cell types (25,26).
The expression of EPAC1 in human cancers varies according to cancer
type. A survey of a public human protein atlas database indicated
that the protein level of EPAC1 is increased in numerous human
cancers, including pancreatic cancer and melanoma, whereas it is
decreased in endometrial cancer. To our knowledge, no study has
investigated the expression of EPAC1 in human GC. In the present
study, we assessed the expression level of EPAC1 in gastric cells
and tissues. The immunoblotting and immunohistochemistry data
indicated that EPAC1 expression was significantly elevated in
gastric tumor tissues and cells compared with non-tumor gastric
tissues and cells, which was consistent with results in pancreatic
cancer and melanoma. The proliferation of cancer cells is a key
event in cancer progression (27).
Furthermore, RNA silencing experiments have also shown that the
abrogation of EPAC1 could suppress cancer cell proliferation, which
indicates that EPAC1 is necessary for GC progression. However, the
mechanism by which EPAC1 is overexpressed in GC remain to be
investigated.
Cancer cell invasion is mandatory for cancer
metastasis, and therefore, it is vital to understand the underlying
molecular mechanisms of interest to develop possible treatment
options (28). In this study, we
found that the overexpression of EPAC1 in GC tissues was closely
correlated with depth of invasion and vascular invasion. An in
vitro cell invasion assay also demonstrated that the silencing
of EAPC1 repressed GC cell invasion. Studies that have explored the
role of EPAC1 in cancer invasion are scarce. The expression,
distribution, trafficking, and function of integrins are frequently
altered in cancer cells in a manner that promotes cancer cell
migration (29). Almahariq et
al reported that when the expression of EPAC1 in pancreatic
cancer cells was knocked down, the ability of the cells to migrate
and invade was impaired through the inhibition of the Itgβ1-related
cell adhesion pathway (30,31). Baljinnyam et al conducted a
study on melanoma cells and found that EPAC1 could increase
Ca2+ release from the endoplasmic reticulum via the
activation of inositol triphosphate receptors. The increased
Ca2+ then activated G protein βγ subunits and promoted
cell migration and invasion (32).
Whether the mechanism by which EPAC1 promotes GC cell invasion is
the same as that in pancreatic cancer and melanoma requires further
exploration.
The precise prediction of the risk of recurrence
would assist in the minimization of the adverse effects of GC and
the maximization of the therapeutic effects of treatment. Of the
available prognostic markers for GC, the AJCC stage is the most
important. However, the prognosis varies even among patients with
the same disease stage; hence, alternative prognostic markers for
GC are sought. The role of EPAC1 in tumor prognosis is still
unknown. Our results demonstrated that EPAC1 overexpression was
associated with poor disease-free and overall survival and that
EPAC1 overexpression was a prognostic marker for GC. Our study was
the first to report that the overexpression of EPAC1 can predict
poorer outcomes of patients with GC. The overexpression of EPAC1
appears to be a useful marker to predict outcomes of patients with
GC who have undergone surgical resection of their tumors. Thus,
patients with GC who display overexpression of EPAC1 should be
followed up carefully.
A better understanding of the etiology of GC can
facilitate the development of new drugs that may be used to treat
GC. According to our functional study, the knockdown of EPAC1
inhibited cell invasion. Previous studies have indicated that
3-(5-tert-butylisoxazol-3-yl)-2-[(3-chloro-phenyl)-hydrazono]-3-oxo-propionitrile,
which is an EPAC-specific antagonist, decreased pancreatic cancer
cell migration and invasion (30,31).
In the near future, we intend to explore whether this compound has
the ability to inhibit GC cell invasion. One limitation of this
study was the small sample size of the GC cohort. Accordingly,
additional cohort studies would be helpful to confirm our
findings.
In summary, this study provides evidence for the
clinical significance of EPAC1 overexpression in patients with GC.
Our findings indicate that the targeting of EPAC1 might provide a
new therapeutic modality for the treatment of GC.
Acknowledgements
This study was support by the research grant
CMFHR10320 from Chi Mei Medical Center, Tainan, Taiwan (K.-Y.L.).
The sponsor had no role in the design of the study and collection,
analysis, and interpretation of data or in writing the
manuscript.
Glossary
Abbreviations
Abbreviations:
|
EPAC
|
exchange protein directly activated by
cAMP
|
|
GC
|
gastric cancer
|
References
|
1
|
Torre LA, Bray F, Siegel RL, Ferlay J,
Lortet-Tieulent J and Jemal A: Global cancer statistics, 2012. CA
Cancer J Clin. 65:87–108. 2015. View Article : Google Scholar : PubMed/NCBI
|
|
2
|
Fuchs CS and Mayer RJ: Gastric carcinoma.
N Engl J Med. 333:32–41. 1995. View Article : Google Scholar : PubMed/NCBI
|
|
3
|
Hartgrink HH, Jansen EPM, van Grieken NCT
and van de Velde CJ: Gastric cancer. Lancet. 374:477–490. 2009.
View Article : Google Scholar : PubMed/NCBI
|
|
4
|
Vogiatzi P, Vindigni C, Roviello F,
Renieri A and Giordano A: Deciphering the underlying genetic and
epigenetic events leading to gastric carcinogenesis. J Cell
Physiol. 211:287–295. 2007. View Article : Google Scholar : PubMed/NCBI
|
|
5
|
Lin KY, Fang CL, Chen Y, Li CF, Chen SH,
Kuo CY, Tai C and Uen YH: Overexpression of nuclear protein kinase
CK2 β subunit and prognosis in human gastric carcinoma. Ann Surg
Oncol. 17:1695–1702. 2010. View Article : Google Scholar : PubMed/NCBI
|
|
6
|
Lin KY, Wang LH, Hseu YC, Fang CL, Yang
HL, Kumar KJS, Tai C and Uen YH: Clinical significance of increased
guanine nucleotide exchange factor Vav3 expression in human gastric
cancer. Mol Cancer Res. 10:750–759. 2012. View Article : Google Scholar : PubMed/NCBI
|
|
7
|
Fang CL, Hseu YC, Lin YF, Hung ST, Tai C,
Uen YH and Lin KY: Clinical and prognostic association of
transcription factor SOX4 in gastric cancer. PLoS One.
7:e528042012. View Article : Google Scholar : PubMed/NCBI
|
|
8
|
Wang XT, Kong FB, Mai W, Li L and Pang LM:
MUC1 immunohistochemical expression as a prognostic factor in
gastric cancer: Meta-analysis. Dis Markers. 2016:94215712016.
View Article : Google Scholar : PubMed/NCBI
|
|
9
|
Ren C, Chen H, Han C, Fu D, Wang F, Wang
D, Ma L, Zhou L and Han D: The anti-apoptotic and prognostic value
of fibroblast growth factor 9 in gastric cancer. Oncotarget.
7:36655–36665. 2016.PubMed/NCBI
|
|
10
|
Burdyga A, Conant A, Haynes L, Zhang J,
Jalink K, Sutton R, Neoptolemos J, Costello E and Tepikin A: cAMP
inhibits migration, ruffling and paxillin accumulation in focal
adhesions of pancreatic ductal adenocarcinoma cells: Effects of PKA
and EPAC. Biochim Biophys Acta. 1833:2664–2672. 2013. View Article : Google Scholar : PubMed/NCBI
|
|
11
|
Cheng X, Ji Z, Tsalkova T and Mei F: Epac
and PKA: A tale of two intracellular cAMP receptors. Acta Biochim
Biophys Sin (Shanghai). 40:651–662. 2008. View Article : Google Scholar : PubMed/NCBI
|
|
12
|
Bos JL: Epac proteins: Multi-purpose cAMP
targets. Trends Biochem Sci. 31:680–686. 2006. View Article : Google Scholar : PubMed/NCBI
|
|
13
|
Grandoch M, Rose A, ter Braak M,
Jendrossek V, Rübben H, Fischer JW, Schmidt M and Weber AA: Epac
inhibits migration and proliferation of human prostate carcinoma
cells. Br J Cancer. 101:2038–2042. 2009. View Article : Google Scholar : PubMed/NCBI
|
|
14
|
Lorenz R, Aleksic T, Wagner M, Adler G and
Weber CK: The cAMP/Epac1/Rap1 pathway in pancreatic carcinoma.
Pancreas. 37:102–103. 2008. View Article : Google Scholar : PubMed/NCBI
|
|
15
|
Baljinnyam E, De Lorenzo MS, Xie LH,
Iwatsubo M, Chen S, Goydos JS, Nowycky MC and Iwatsubo K: Exchange
protein directly activated by cyclic AMP increases melanoma cell
migration by a Ca2+-dependent mechanism. Cancer Res.
70:5607–5617. 2010. View Article : Google Scholar : PubMed/NCBI
|
|
16
|
Baljinnyam E, Umemura M, De Lorenzo MS,
Iwatsubo M, Chen S, Goydos JS and Iwatsubo K: Epac1 promotes
melanoma metastasis via modification of heparan sulfate. Pigment
Cell Melanoma Res. 24:680–687. 2011. View Article : Google Scholar : PubMed/NCBI
|
|
17
|
Baljinnyam E, Umemura M, Chuang C, De
Lorenzo MS, Iwatsubo M, Chen S, Goydos JS, Ishikawa Y, Whitelock JM
and Iwatsubo K: Epac1 increases migration of endothelial cells and
melanoma cells via FGF2-mediated paracrine signaling. Pigment Cell
Melanoma Res. 27:611–620. 2014. View Article : Google Scholar : PubMed/NCBI
|
|
18
|
Misra UK and Pizzo SV: Epac1-induced
cellular proliferation in prostate cancer cells is mediated by
B-Raf/ERK and mTOR signaling cascades. J Cell Biochem.
108:998–1011. 2009. View Article : Google Scholar : PubMed/NCBI
|
|
19
|
Misra UK and Pizzo SV: Upregulation of
mTORC2 activation by the selective agonist of EPAC, 8-CPT-2Me-cAMP,
in prostate cancer cells: Assembly of a multiprotein signaling
complex. J Cell Biochem. 113:1488–1500. 2012.PubMed/NCBI
|
|
20
|
Menon J, Doebele RC, Gomes S, Bevilacqua
E, Reindl KM and Rosner MR: A novel interplay between Rap1 and PKA
regulates induction of angiogenesis in prostate cancer. PLoS One.
7:e498932012. View Article : Google Scholar : PubMed/NCBI
|
|
21
|
Rangarajan S, Enserink JM, Kuiperij HB, de
Rooij J, Price LS, Schwede F and Bos JL: Cyclic AMP induces
integrin-mediated cell adhesion through Epac and Rap1 upon
stimulation of the beta 2-adrenergic receptor. J Cell Biol.
160:487–493. 2003. View Article : Google Scholar : PubMed/NCBI
|
|
22
|
Bastian P, Balcarek A, Altanis C, Strell
C, Niggemann B, Zaenker KS and Entschladen F: The inhibitory effect
of norepinephrine on the migration of ES-2 ovarian carcinoma cells
involves a Rap1-dependent pathway. Cancer Lett. 274:218–224. 2009.
View Article : Google Scholar : PubMed/NCBI
|
|
23
|
Uen YH, Fang CL, Hseu YC, Shen PC, Yang
HL, Wen KS, Hung ST, Wang LH and Lin KY: VAV3 oncogene expression
in colorectal cancer: Clinical aspects and functional
characterization. Sci Rep. 5:93602015. View Article : Google Scholar : PubMed/NCBI
|
|
24
|
Oliveira FJ, Ferrão H, Furtado E, Batista
H and Conceição L: Early gastric cancer: Report of 58 cases.
Gastric Cancer. 1:51–56. 1998. View Article : Google Scholar : PubMed/NCBI
|
|
25
|
de Rooij J, Zwartkruis FJ, Verheijen MH,
Cool RH, Nijman SM, Wittinghofer A and Bos JL: Epac is a Rap1
guanine-nucleotide-exchange factor directly activated by cyclic
AMP. Nature. 396:474–477. 1998. View
Article : Google Scholar : PubMed/NCBI
|
|
26
|
Kawasaki H, Springett GM, Mochizuki N,
Toki S, Nakaya M, Matsuda M, Housman DE and Graybiel AM: A family
of cAMP-bindinG proteins that directly activate Rap1. Science.
282:2275–2279. 1998. View Article : Google Scholar : PubMed/NCBI
|
|
27
|
Abate-Shen C and Shen MM: Molecular
genetics of prostate cancer. Genes Dev. 14:2410–2434. 2000.
View Article : Google Scholar : PubMed/NCBI
|
|
28
|
Hao F, Tan M, Xu X, Han J, Miller DD,
Tigyi G and Cui MZ: Lysophosphatidic acid induces prostate cancer
PC3 cell migration via activation of LPA(1), p42 and p38alpha.
Biochim Biophys Acta. 1771:883–892. 2007. View Article : Google Scholar : PubMed/NCBI
|
|
29
|
Caswell PT and Norman JC: Integrin
trafficking and the control of cell migration. Traffic. 7:14–21.
2006. View Article : Google Scholar : PubMed/NCBI
|
|
30
|
Almahariq M, Chao C, Mei FC, Hellmich MR,
Patrikeev I, Motamedi M and Cheng X: Pharmacological inhibition and
genetic knockdown of exchange protein directly activated by cAMP 1
reduce pancreatic cancer metastasis in vivo. Mol Pharmacol.
87:142–149. 2015. View Article : Google Scholar : PubMed/NCBI
|
|
31
|
Almahariq M, Tsalkova T, Mei FC, Chen H,
Zhou J, Sastry SK, Schwede F and Cheng X: A novel EPAC-specific
inhibitor suppresses pancreatic cancer cell migration and invasion.
Mol Pharmacol. 83:122–128. 2013. View Article : Google Scholar : PubMed/NCBI
|
|
32
|
Baljinnyam E, Umemura M, De Lorenzo MS,
Xie LH, Nowycky M, Iwatsubo M, Chen S, Goydos JS and Iwatsubo K:
Gβγ subunits inhibit Epac-induced melanoma cell migration. BMC
Cancer. 11:2562011. View Article : Google Scholar : PubMed/NCBI
|