Introduction
Oral lichen planus (OLP) is a common chronic
inflammatory disease of the oral mucosa, which is classified into
oral potential malignant disorders (OPMDs) by World Health
Organization (WHO) (1). OPMD is the
general name of diseases occurring in oral mucosa and with
cancerous potential (2). The
incidence of OLP is 0.1–4% (3), and
its canceration rate is close to 1% (4). The carcinogenesis mechanisms of OLP
have been explored by many studies, but it is still not clear. Oral
squamous cell carcinoma (OSCC) occurs in the mucosa of the
oropharynx and oral cavity (5). In
the United States, OSCC ranks 14th among cancers in women and 8th
among cancers in men (6). OSCC is
reported to take up >90% of all oral cancers (7), and its incidence is increasing
especially among white women (8).
Previous studies report that OLP may transform to OSCC, though the
incidence is low and the carcinogenesis mechanisms are not known
(9,10). Thus, investigating the mechanisms of
malignant transformation of OLP to OSCC is important for further
decreasing the incidence.
In recent years, malignant transformation of OLP has
been widely studied. The matrix metalloproteinase-tissue inhibitor
of matrix metalloproteinase (MMP-TIMP) imbalance may affect
cancerization of OLP, additionally, MMP-9, MMP-2, and
membrane-type 1 MMP (MT1-MMP) may serve as promising
prognostic markers for malignant transformation of OLP (11,12).
The expression levels of ATP-binding cassette, G2 subfamily
(ABCG2) and podoplanin are significantly related to
malignant potential of OLP, suggesting that ABCG2 and
podoplanin may be used for assessing the risk of malignant
transformation in OLP patients (13). Rhodus et al demonstrated that
the abnormal expression levels of nuclear factor κB
(NF-κB)-dependent cytokines (such as interleukin-1α, IL-1α; and
tumor necrosis factor-α, TNF-α) in general, unstimulated saliva may
reflect the malignant potential of OLP (14,15).
Overexpression of cyclin-dependent kinase 4 (cdk4) and p16 indicate
the cell arrest and hyperproliferative state of epithelial cells in
OLP, and offer evidence for the malignant transformation risk of
OLP (16). However, the malignant
transformation of OLP has not been comprehensively
investigated.
RNA-sequencing is a powerful tool for expression
profiling, genome annotation, and transcript discovery, which has
been widely utilized in biology fields involving development, gene
regulation and disease (17). In
this study, the high-throughput sequencing data of OLP, OSCC and
normal oral mucosa were obtained by RNA-sequencing technique.
Followed by the differently expressed genes (DEGs) in OLP vs.
normal and OSCC vs. normal comparison groups were identified.
Subsequently, weighted gene co-expression network analysis (WGCNA)
was conducted for the DEGs to screen disease-associated modules.
Moreover, co-expression networks were constructed for the genes
involved in the disease-associated modules. In addition, functional
enrichment analysis was conducted for the genes involved in the
co-expression networks. Finally, the identified key genes were
further confirmed.
Materials and methods
Sample source
A total of 3 OLP samples, 3 OSCC samples, and 3
normal samples were isolated from buccal mucosa of patients from
Huashan Hospital. The isolated samples were washed by phosphate
buffer and then stored at −80°C for following experiments. The
patients had not received immune stimulants (including
corticosteroids) within 3 months, and were without systemic
diseases such as diabetes and immunodeficiency. Based on the
diagnostic criteria of World Trade Organization (WTO), the patients
were diagnosed by tissue biopsy. All patients gave their informed
consent, and this study was approved by the ethics review committee
of Huashan Hospital of Fudan University.
RNA extraction and library
construction
Total RNA of the samples were extracted by the
TRIzol total RNA extraction kit (Invitrogen, Shanghai, China)
according to the manufacturer's manual. Subsequently, the integrity
and purity of RNA were detected by 2% Agarose Gel Electrophoresis
and spectrophotometer (Merinton, Beijing, China), respectively. The
cDNA library was prepared using NEBNext® Ultra™ RNA
Library Prep kit for Illumina® (New England Biolabs,
Ipswich, MA, USA). Firstly, the isolated mRNAs were fractured into
short fragments (~200 nt) through heating. Secondly, the first- and
second-strand of cDNA were synthesized and then modified. Followed
by PCR amplification. The cDNA library was sequenced on Illumina
Hiseq 2500 v4 100PE (Illumina Inc., San Diego, CA, USA) to obtained
the raw data.
Sequence alignment and DEG
screening
Reads with adaptor sequences, and with >50% low
quality bases and/or with >10% unknown nucleotides were defined
as low quality sequences. Using NGSQC Toolkit (http://www.nipgr.res.in/ngsqctoolkit.html) (18), the raw data were pre-processed by
filtering out the low quality sequences. Afterwards, the high
quality sequences were aligned to human genome (version hg19) using
tophat2 software (http://ccb.jhu.edu/software/tophat/index.shtml)
(19), with default parameters.
Furthermore, the DEGs in OLP vs. normal and OSCC vs. normal
comparison groups, respectively, were screened by the limma package
(http://www.bioconductor.org/packages/release/bioc/html/limma.html)
(20,21) in R language. The thresholds for
screening DEGs were |log2fold change (FC)| >0.5 and
P-value <0.05.
Euclidean distance, which can be calculated by the
Pythagorean formula, refers to the true distance between two points
(22). The expression values of the
DEGs in each sample were extracted. By the Pheatmap package
(http://cran.r-project.org/web/packages/pheatmap/index.html)
(23) in R language, bidirectional
hierarchical clustering analysis (24,25)
were performed to cluster gene expression values and samples based
on the Euclidean distance (22).
After that, genes with close expression were clustered together,
and genes with sample specificity can be identified.
Screening disease-associated module
using WGCNA
WGCNA is a typical systems biology method for
constructing gene co-expression network, which is based on
high-throughput gene expression data (26,27).
Firstly, the Pearson's correlation matrices were calculated for
each gene pair, and the correlation coefficient
Smn|cor(m,n)| was defined for m and n gene
pairs. Secondly, the Pearson's correlation matrices were converted
into adjacent matrices by an adjacent function amn power
(Smn, β). Then, the weighting coefficient β was
determined based on the principle of scale-free network. The
weighting coefficient β, which was the correlation coefficient
between log2 k and log2 p(k) (k represented
the number of connected nodes, and p stood for appearing
probability of nodes) should be no less than 0.9. Subsequently, the
adjacent matrices were transformed into topology matrices using Ω =
Wmn = (lmn + amn) /
(min{km, kn} + 1 - amn). The
lmn represented the total area of correlation
coefficients of the nodes linked with both gene m and gene n. The
km indicated the sum of correlation coefficients of the
nodes linked with gene m. Wmn was equal to 0, when gene
m did not connect with gene n, and no genes linked with both gene m
and gene n. The dissimilarity degree of a node, which was the basis
for constructing the network, was defined as dmn = 1 -
Wmn. WGCNA for the DEGs was conducted as described
previously (26,27), and gene modules were identified by
hybrid dynamic shear tree (28,29).
Besides, T-test was applied to calculate the significant P-value of
each gene between different groups, and the mediated P-value (lgP)
was defined as the gene significance (GS) of each gene. The module
significance (MS) was considered as the mean GS of the genes
included in the module. Among the identified modules, the one with
the highest MS value was selected as disease-associated module.
Construction of co-expression network
for genes involved in the disease-associated module
The correlation coefficients of genes involved in
the OLP-associated module and OSCC-associated module separately
were extracted from the modules. Then, the co-expression networks
were visualized by Cytoscape software (http://www.cytoscape.org/) (30). Besides, the genes associated with
both OLP and OSCC were identified by comparing the genes involved
in OLP-associated module and OSCC-associated module. Moreover, the
genes associated with both OLP and OSCC were mapped to the
co-expression networks.
Functional enrichment analysis
GOstats (available at: http://bioconductor.org) is usually utilized to
perform functional enrichment analysis and test gene ontology (GO)
terms for genes in a specific gene list (31). GO can be used to analyze the
biological process, molecular function and cellular component
involved gene products (32). Using
the GOstat package (31) in R
language, GO enrichment analysis was conducted for the
disease-associated genes involved in the co-expression network. The
terms with P-value <0.05 were taken as statistically
significant.
qRT-PCR analysis
After the primer sequences for qRT-PCR amplification
were designed using Primer Premier 6.0 software (Premier Software
Inc., Cherry Hill, NJ, USA) (Table
I), they were synthesized by Sangon Biotech Co., Ltd (Shanghai,
China). The expression of critical genes in OLP, OSCC and normal
samples were measured by SYBR Green master mix kit (Applied
Biosystems, Foster City, CA), respectively. The 20 µl reaction
system was composed of the following reagents: 10 µl SYBR Premix Ex
Taq (2X), 1 µl forward primer (10 µM), and 1 µl reverse primer (10
µM), and 8 µl cDNA template (being diluted by ddH2O to
keep a certain concentration). Then, the mixture reacted under the
following conditions: 50°C for 3 min; 95°C for 3 min; 95°C for 10
sec and 60°C for 30 sec for 40 cycles; melt curve 60–95°C:
increment 0.5°C for 10 sec plate read. All samples had three
repeats, with GAPDH as the reference gene.
 | Table I.The primers used for quantitative
real-time PCR (qRT-PCR) experiments. |
Table I.
The primers used for quantitative
real-time PCR (qRT-PCR) experiments.
| Primer name | Primer sequence
(5′-3′) |
|---|
| BCL9L | F:
CACAATGCCATCAAGACCATC |
|
| R:
AGTTCAGGTGCATCTGGCTG |
| GMPS | F:
CATAGACCGAAGAGTGAGGGAAC |
|
| R:
GAACAGGCTTGCCAATAGTGAATA |
| HES1 | F:
CAGCGAGTGCATGAACGAGGTGA |
|
| R:
AGGTGCCGCTGTTGCTGGTGTAGA |
| PER2 | F:
TCCAGATACCTTTAGCCTGATGA |
|
| R:
TTTGTGTGTGTCCACTTTCGA |
| TSPAN33 | F:
GGCAAGCCTCATAAACGAAC |
|
| R:
CCTTCTGCCCATCTGGAGTT |
| GAPDH | F:
TGACAACTTTGGTATCGTGGAAGG |
|
| R:
AGGCAGGGATGATGTTCTGGAGAG |
Statistical analysis
Using the 2−∆∆Ct method (33), the gene expression values were
calculated. All results are presented as mean ± SEM (standard error
of mean). SPSS 22.0 (SPSS Inc., Chicago, IL, USA) and Graphpad
prism 5 (Graphpad Software, San Diego, CA, USA) software was used
also for statistic analysis and drawing pictures, with the
P<0.05 as the screening criteria for significant difference.
Results
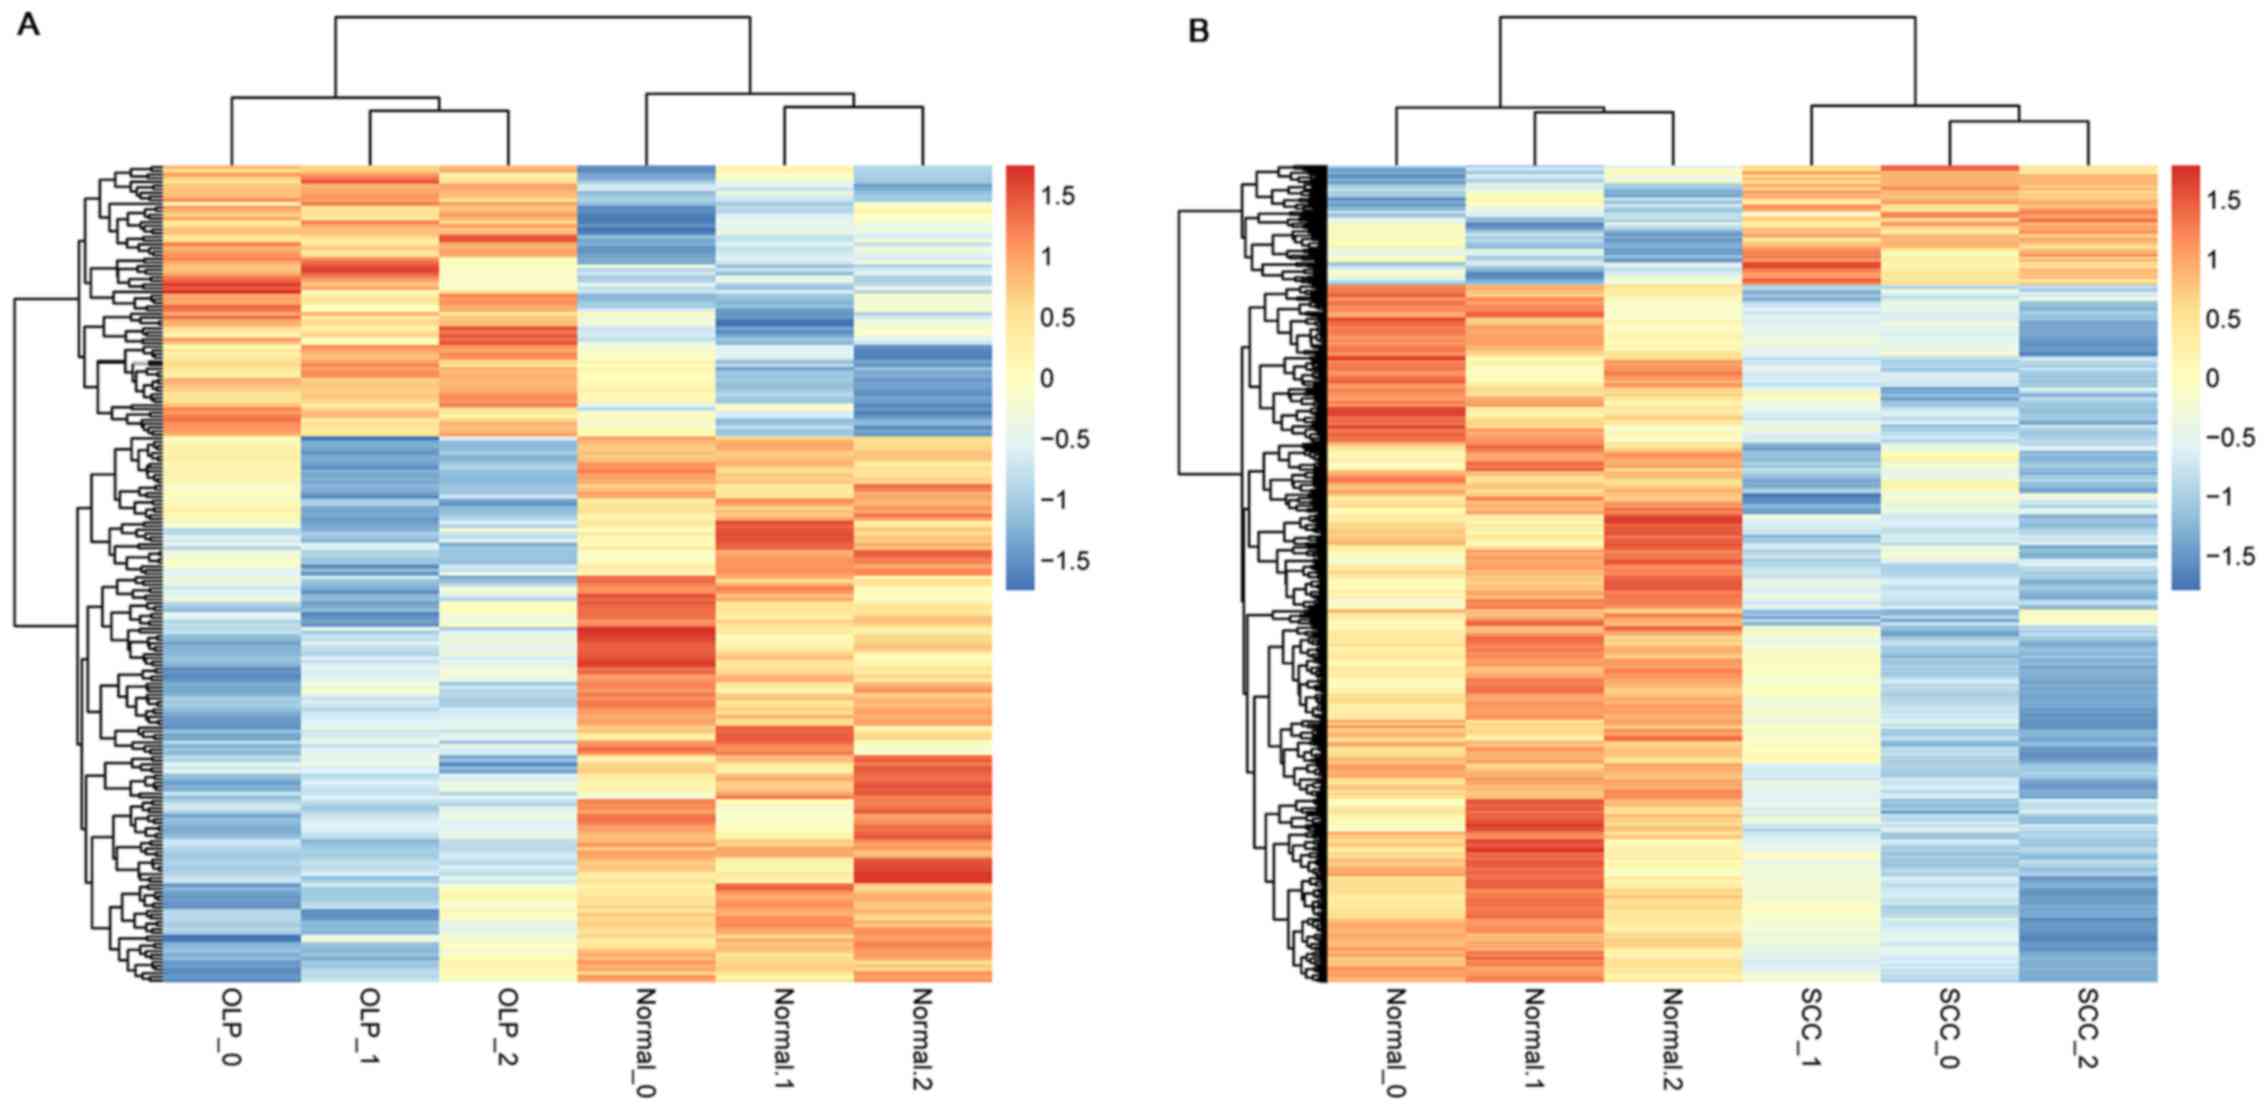
DEG screening and bidirectional
hierarchical clustering
The raw data were preprocessed, and the quality
control results and the comparison results of the raw
RNA-sequencing data, respectively, are shown in Table IIA and Table IIB. Followed by a total of 223
(including 74 up- and 149 down-regulated genes) and 548 (including
80 up- and 468 down-regulated genes) DEGs separately were
identified in OLP vs. normal and OSCC vs. normal comparison groups.
Subsequently, the expression values of the DEGs in each sample were
extracted and bidirectional hierarchical clustering analysis was
carried out. The dendrogram of clustering analysis showed that the
DEGs could separate the OLP or OSCC samples from normal samples
completely, indicating that the expression differences of the DEGs
were significant (Fig. 1).
| Table II.The quality control results and the
comparison results of the raw RNA-sequencing data. |
Table II.
The quality control results and the
comparison results of the raw RNA-sequencing data.
| A, Quality control
results |
|---|
| Sample | Raw reads | Raw bases | Trim reads |
| Trim bases | Average length | Trim reads (%) | Trim bases (%) |
|---|
| OLP | 87356096 | 8822965696 | 77746400 |
| 7331570314 | 94.30109065 | 0.889993985 | 0.830964391 |
| OSCC | 79835924 | 8063428324 | 66754732 |
| 6087961474 | 91.19895012 | 0.83614905 | 0.755009064 |
| Normal | 100217370 | 10121954370 | 81959072 |
| 7494718324 | 91.44464598 | 0.81781304 | 0.740441821 |
|
| B, Comparison
results |
|
| Sample | Total reads | Total mapped | Mapped ratio
(%) | Multiple
mapped | Unique mapped | Reads mapping to
positive-sense | Reads mapping to
antisense strand | Reads proper
pair |
|
| OLP | 77746400 | 63674055 | 81.90 | 2979371 | 60694684 | 30207215 | 30487469 | 52761594 |
| OSCC | 66754732 | 48292145 | 72.30 | 3068746 | 45223399 | 22535431 | 22687968 | 38605610 |
| Normal | 81959072 | 53529855 | 65.30 | 3492342 | 50037513 | 24873837 | 25163676 | 42128686 |
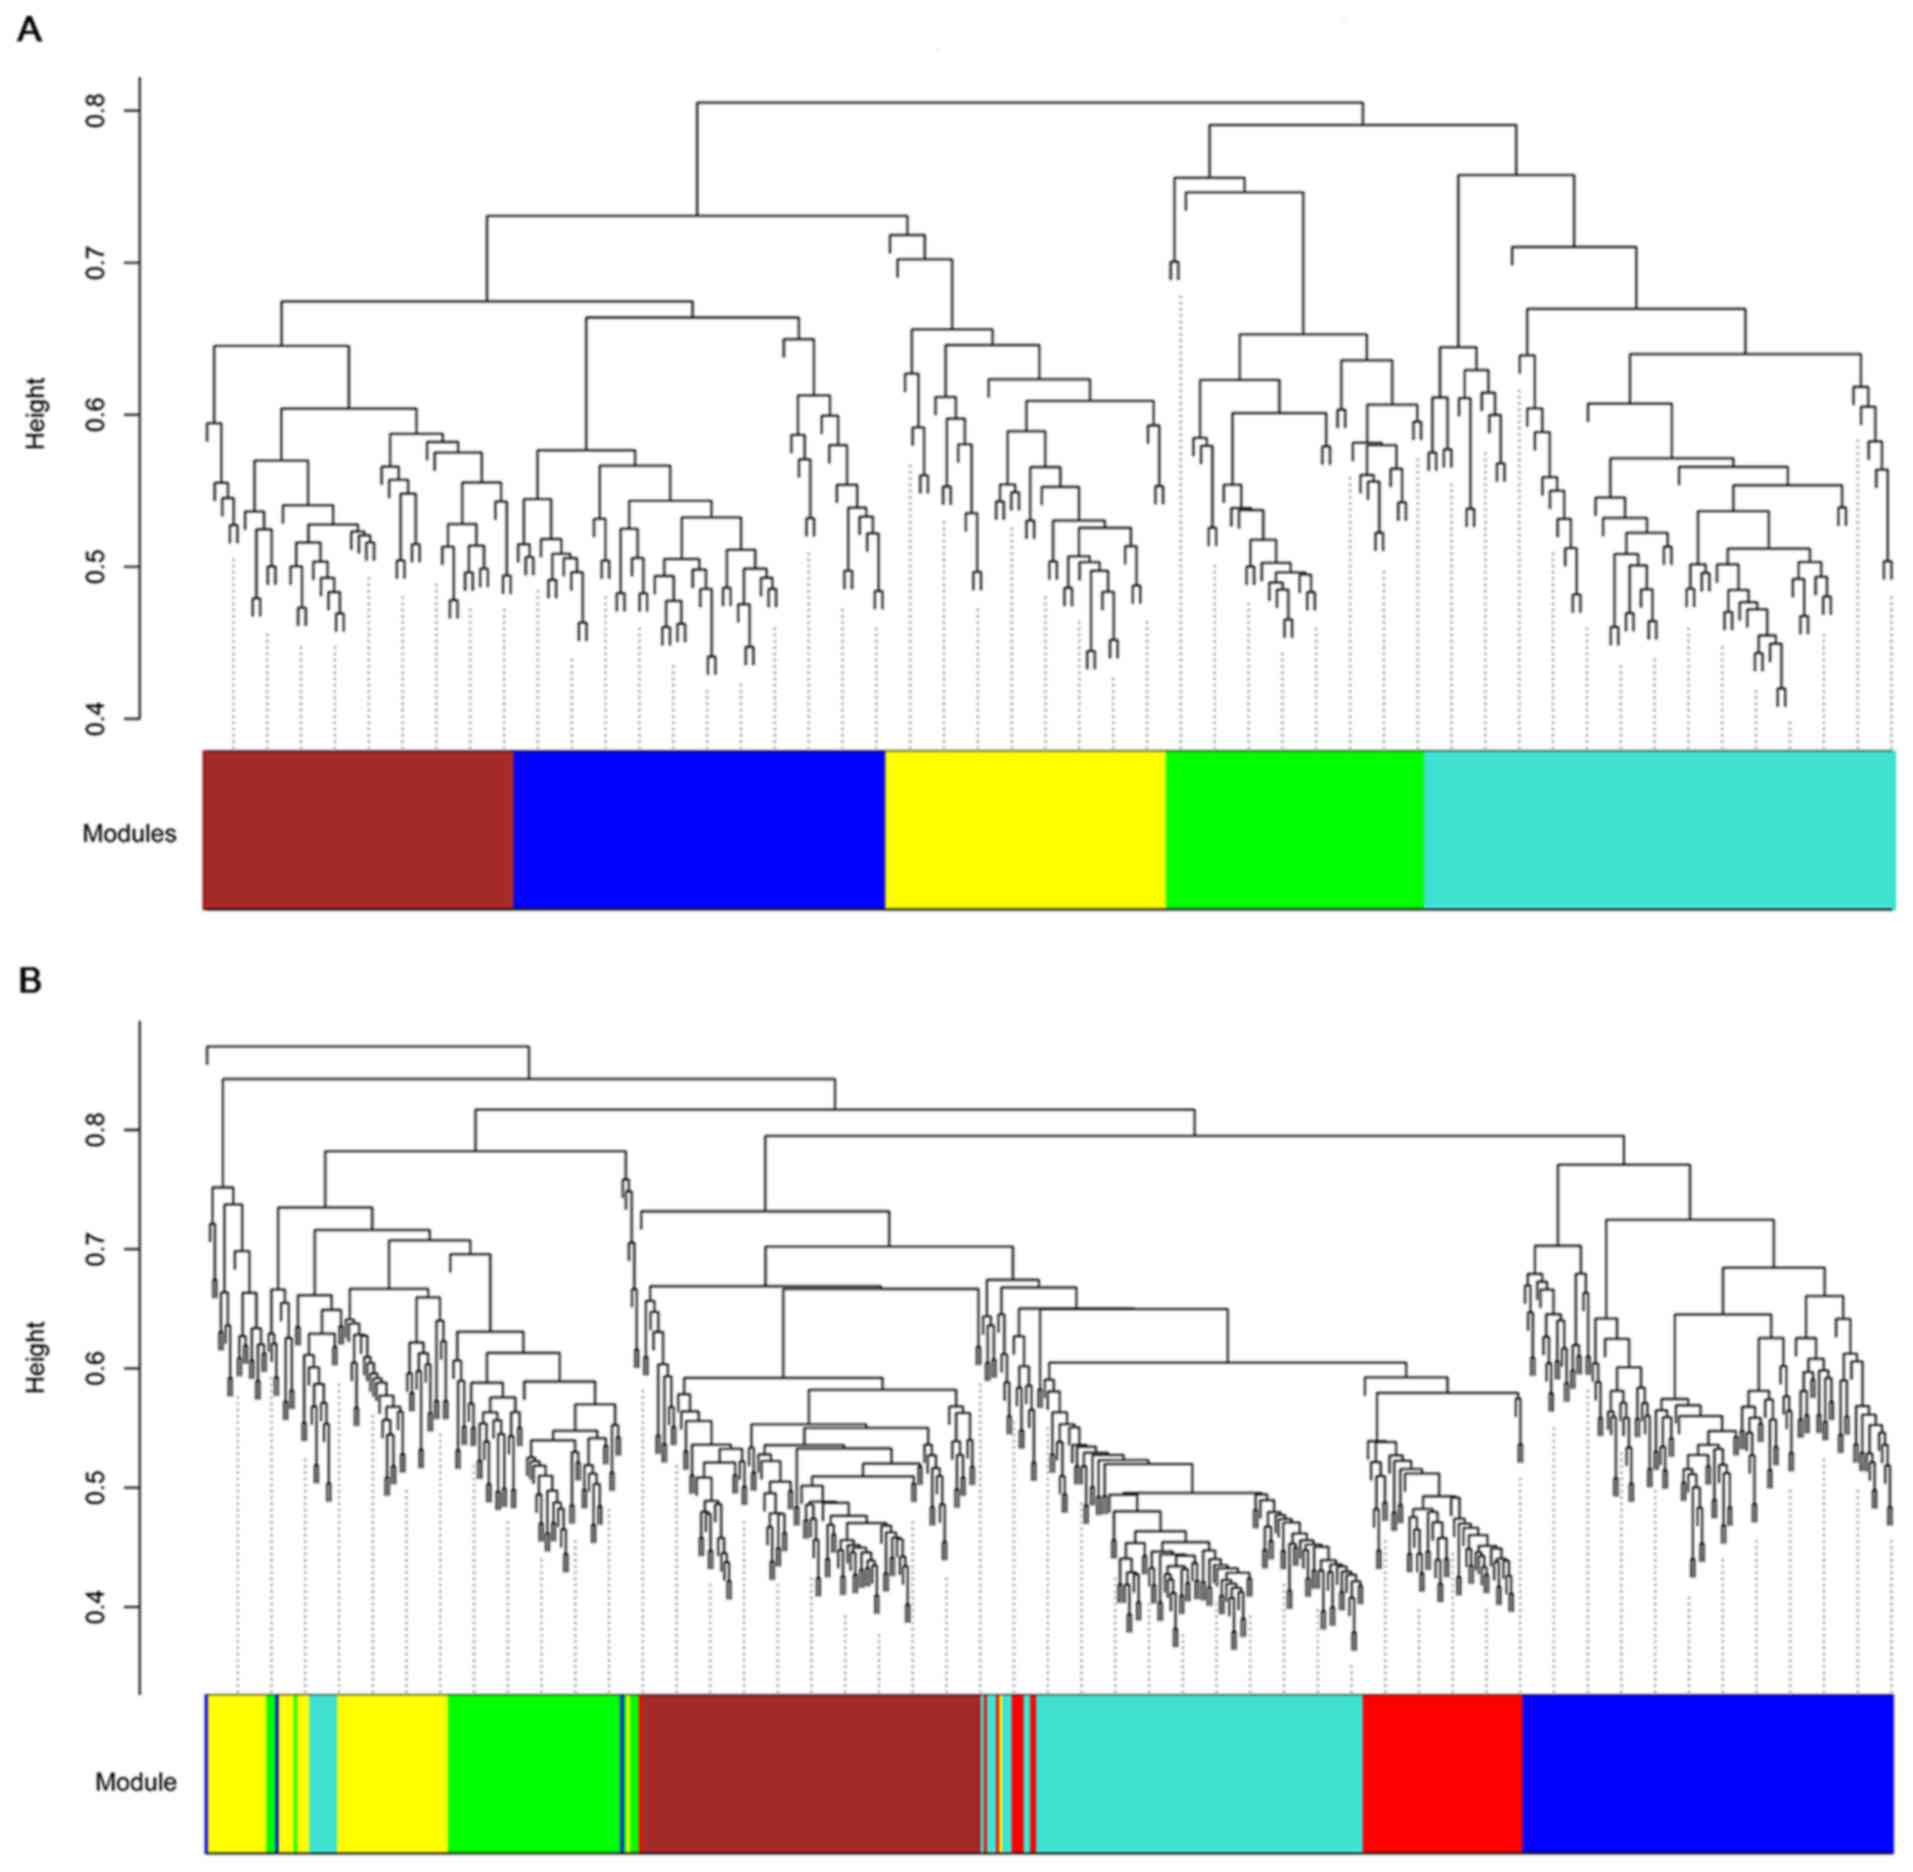
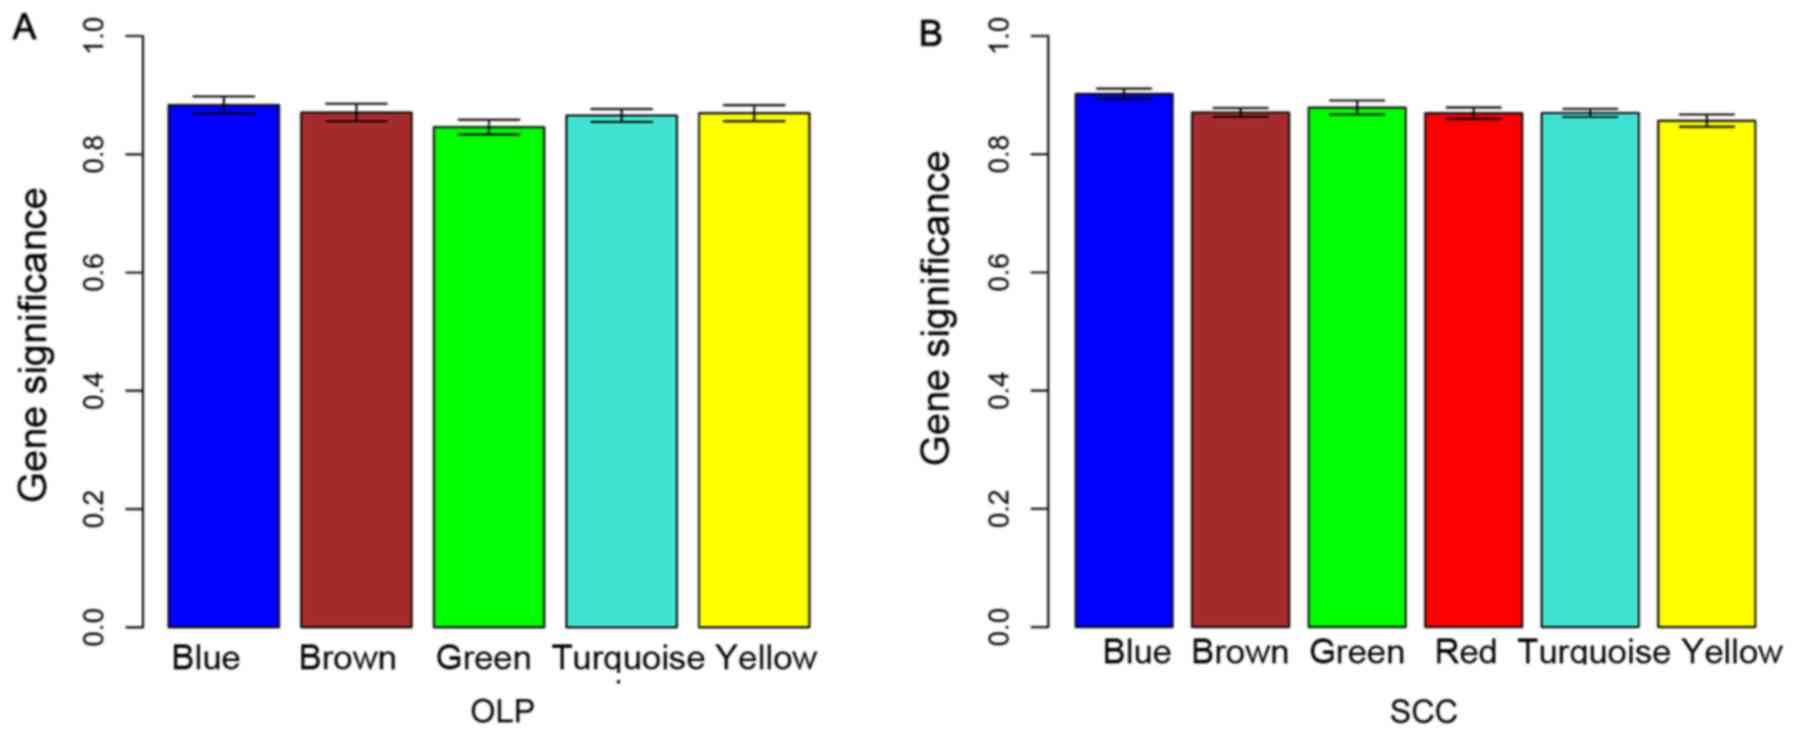
Screening disease-associated module
using WGCNA
Based on hybrid dynamic shear tree, modules for the
DEGs in the two comparison groups were identified and exhibited by
different colors (Fig. 2).
According to the MS value of modules, the blue modules for the DEGs
in OLP vs. normal (MS=0.88) and in OSCC vs. normal (MS=0.90)
comparison groups were selected as disease-associated modules for
they had the highest MS values (Fig.
3).
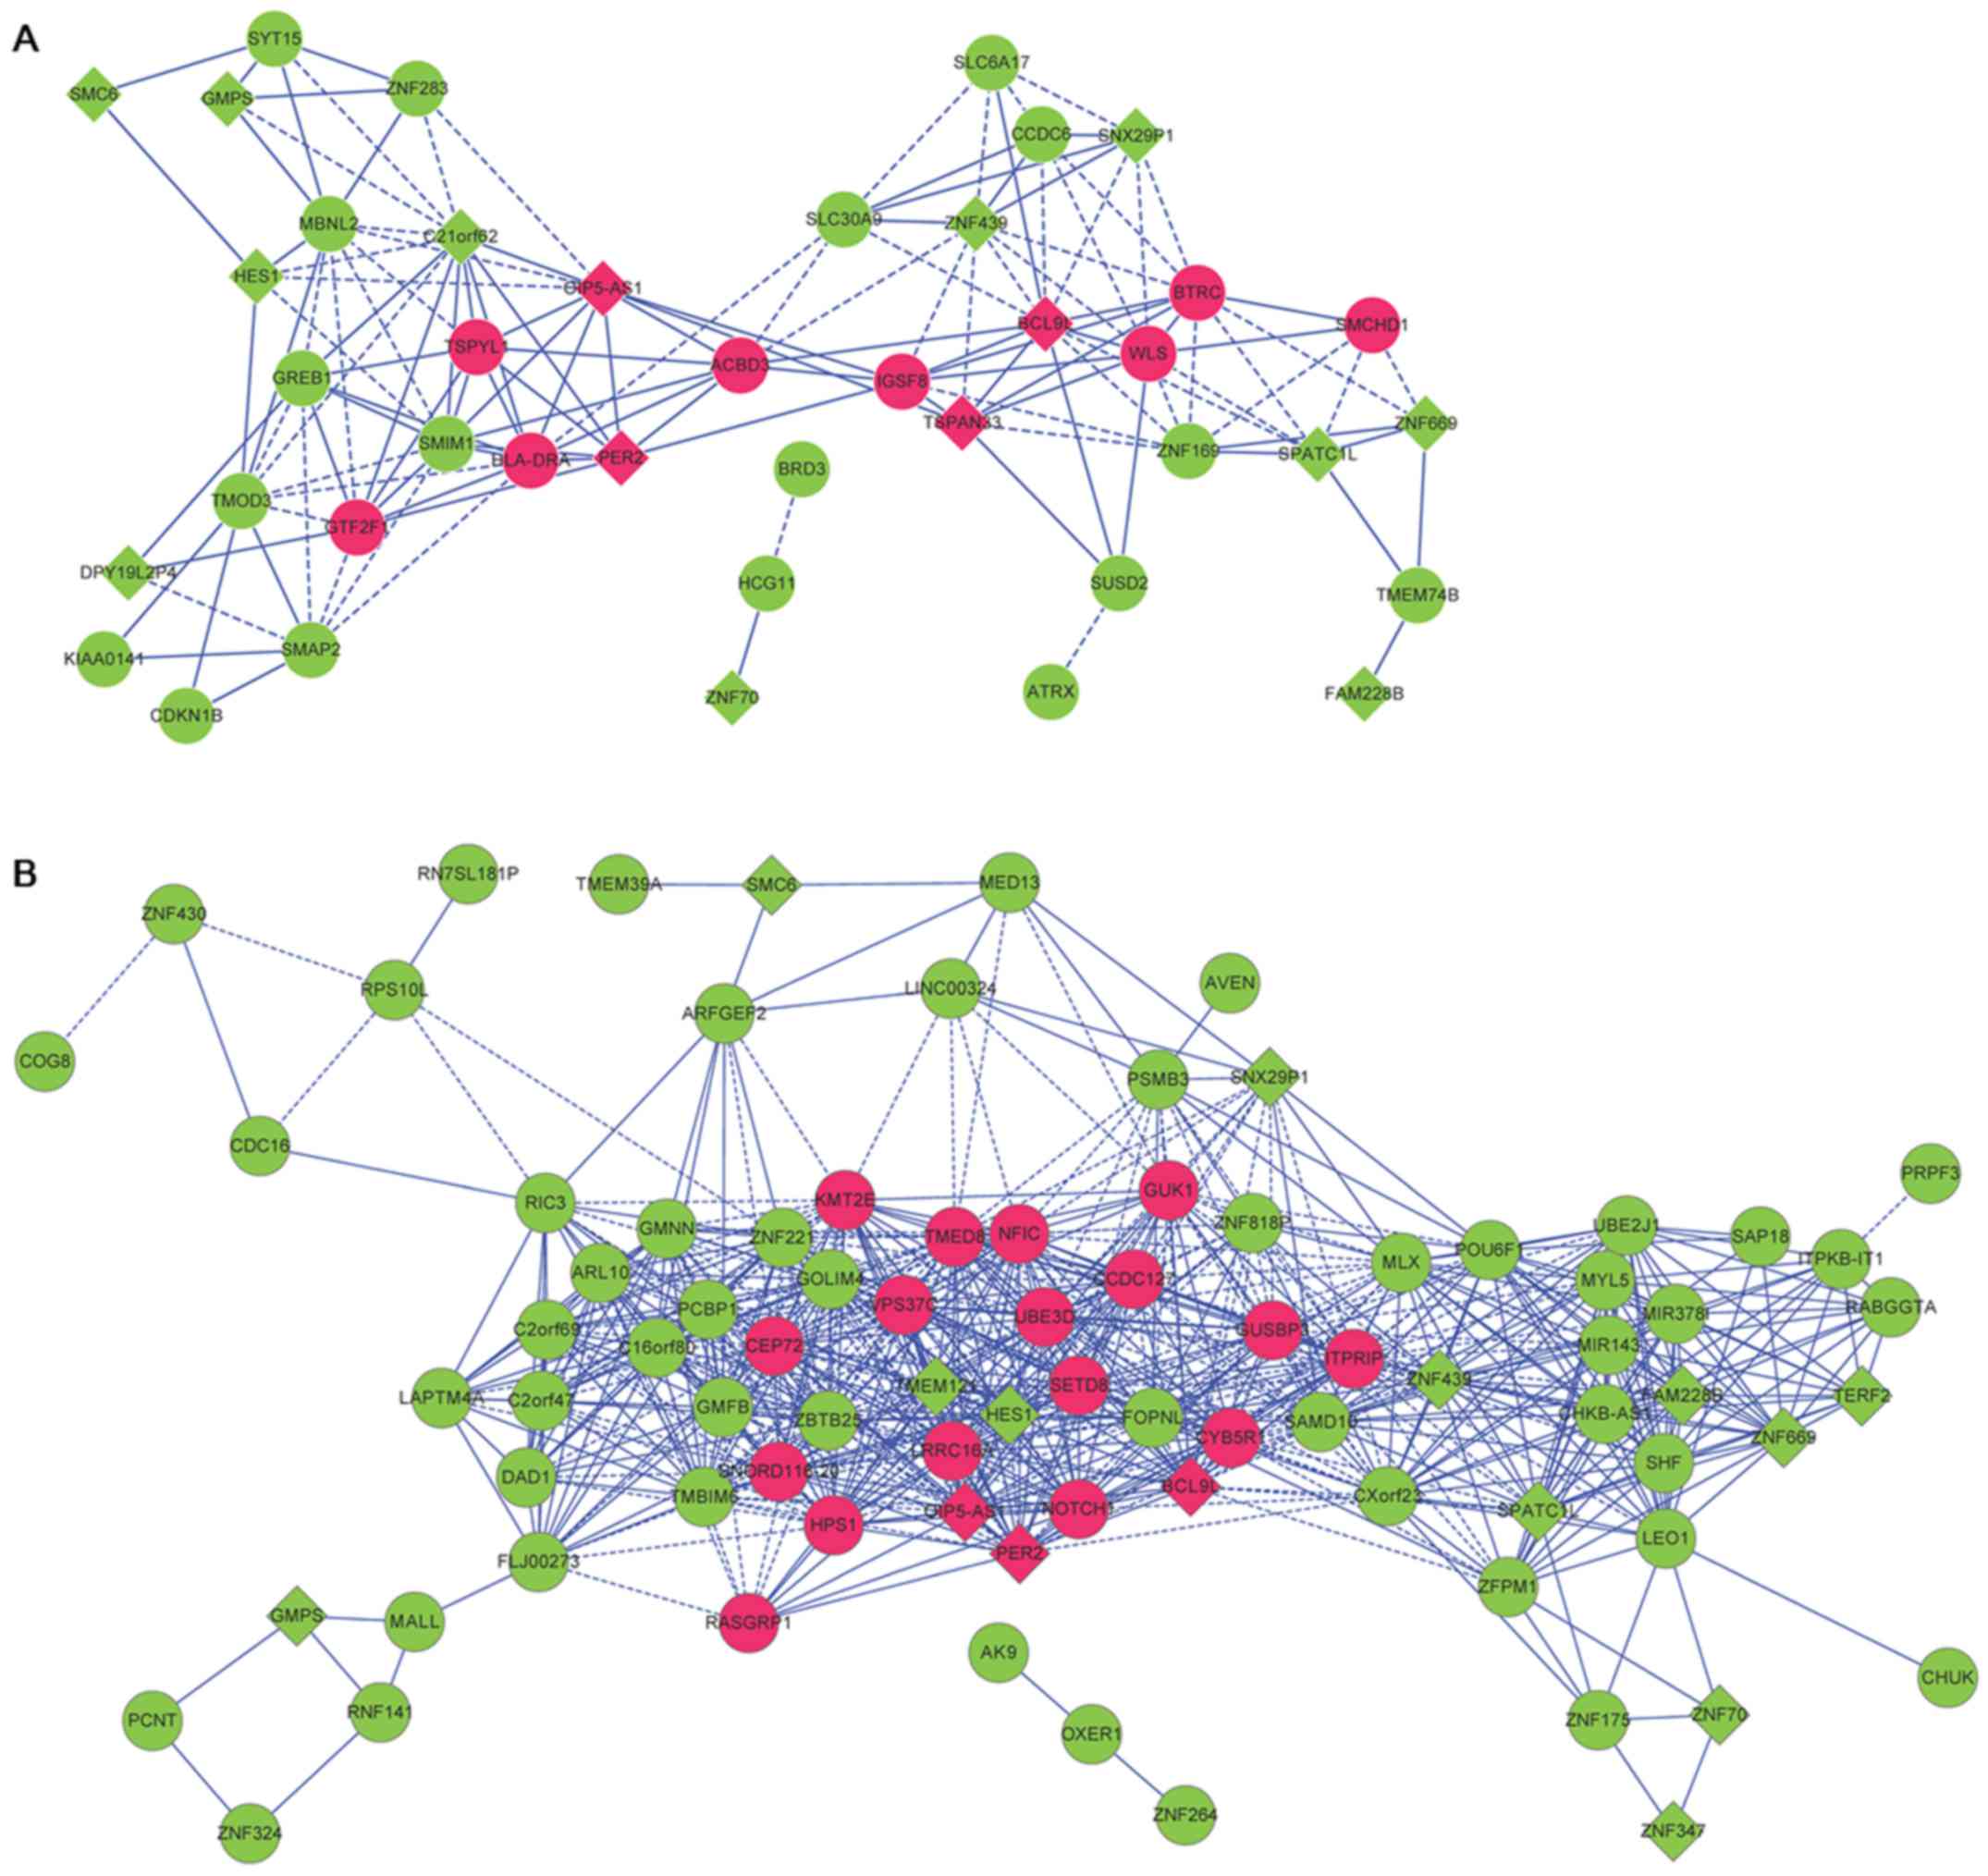
Construction of co-expression network
for genes involved in the disease-associated module
There were 49 and 123 DEGs, respectively, in the
blue modules for the DEGs in OLP vs. normal and in OSCC vs. normal
comparison groups. The correlation coefficients of genes involved
in the blue modules were extracted, and the co-expression networks
were visualized. Through comparing the genes involved in the blue
modules, a total of 19 common DEGs (including 4 upregulated genes
and 15 downregulated genes) associated with both OLP and OSCC were
identified and mapped to the co-expression networks (Table III), including upregulated B-cell
CLL/lymphoma 9-like (BCL9L), period circadian clock 2
(PER2) and tetraspanin 33 (TSPAN33), as well as
downregulated guanine monphosphate synthase (GMPS) and Hes
family bHLH transcription factor 1 (HES1). The co-expression
network for OLP vs. normal comparison group had 138 interactions
and 41 nodes, and that for OSCC vs. normal comparison group had 757
interactions and 85 nodes (Fig. 4).
Especially, BCL9L, HES1, PER2 and TSPAN33 might be
involved in OLP through interactions in the co-expression networks
for OLP vs. normal (such as BCL9L-TSPAN33) and OSCC vs.
normal comparison groups (such as BCL9L-PER2, and
HES1-PER2).
| Table III.The common differentially expressed
genes (DEGs) between OLP vs. normal and OSCC vs. normal comparison
groups. |
Table III.
The common differentially expressed
genes (DEGs) between OLP vs. normal and OSCC vs. normal comparison
groups.
|
| OLP | SCC |
|---|
|
|
|
|
|---|
| Gene | logFC | P-value | logFC | P-value |
|---|
| BCL9L | 0.866268 | 0.027103 | 0.87862 | 0.011379 |
|
C21orf62 | −0.87082 | 0.034486 | −0.87537 | 0.025741 |
| CHGA | −0.87469 | 0.030446 | −0.89057 | 0.009506 |
|
DPY19L2P4 | −0.84725 | 0.003033 | −0.87498 | 0.006929 |
| FAM228B | −0.89934 | 0.048295 | −0.91674 | 0.025529 |
| GMPS | −0.87338 | 0.001723 | −0.86493 | 0.008399 |
| HES1 | −0.88283 | 0.010514 | −0.87028 | 0.004662 |
|
OIP5-AS1 | 0.880789 | 0.000374 | 0.881847 | 0.000254 |
| PER2 | 0.882885 | 0.011876 | 0.886616 | 0.004227 |
| SMC6 | −0.8837 | 0.016755 | −0.88647 | 0.048216 |
| SNX29P1 | −0.92343 | 0.019689 | −0.94756 | 0.01687 |
| SPATC1L | −0.86816 | 0.020417 | −0.87373 | 0.015081 |
| TERF2 | −0.87686 | 0.038943 | −0.8964 | 0.012173 |
| TMEM121 | −0.90655 | 0.045068 | −0.87188 | 0.033126 |
| TSPAN33 | 0.843168 | 0.005186 | 0.835443 | 0.046788 |
| ZNF347 | −0.8933 | 0.0388 | −0.89562 | 0.023093 |
| ZNF439 | −0.9103 | 0.019051 | −0.90591 | 0.014761 |
| ZNF669 | −0.87 | 0.018227 | −0.86737 | 0.01926 |
| ZNF70 | −0.86138 | 0.007926 | −0.8725 | 0.00475 |
Functional enrichment analysis
GO enrichment analysis was performed for the DEGs
involved in the co-expression networks for OLP vs. normal and OSCC
vs. normal comparison groups, respectively. In total, 7 and 6 GO
terms, respectively, were enriched for the DEGs involved in the
co-expression networks for OLP vs. normal and OSCC vs. normal
comparison groups (Fig. 5 and
Table IV). Importantly, the
functions enriched for the DEGs involved in the two co-expression
networks both included transcription, regulation of transcription,
regulation of transcription, DNA-dependent, and regulation of RNA
metabolic process.
| Table IV.The gene ontology (GO) terms enriched
for the differentially expressed genes (DEGs) involved in the
co-expression networks for OLP vs. normal and OSCC vs. normal
comparison groups. |
Table IV.
The gene ontology (GO) terms enriched
for the differentially expressed genes (DEGs) involved in the
co-expression networks for OLP vs. normal and OSCC vs. normal
comparison groups.
| A, The functions
enriched for the DEGs involved in the co-expression network for OLP
vs. normal comparison group |
|---|
| Description | P-value | Gene no. | Gene symbol |
|---|
|
GO:0045449~regulation of
transcription | 1.78E-03 | 12 | ZNF169, ATRX,
HES1, ZNF439, ZNF283, CDKN1B, GTF2F1, PER2, BCL9L, ZNF669, ZNF70,
SLC30A9 |
|
GO:0006350~transcription | 5.32E-03 | 10 | ZNF169, HES1,
ZNF439, ZNF283, GTF2F1, PER2, BCL9L, ZNF669, ZNF70,
SLC30A9 |
|
GO:0006355~regulation of transcription,
DNA-dependent | 6.78E-03 | 9 | ZNF169, ATRX,
HES1, ZNF439, ZNF283, CDKN1B, PER2, ZNF669, ZNF70 |
|
GO:0051252~regulation of RNA metabolic
process | 7.76E-03 | 9 | ZNF169, ATRX,
HES1, ZNF439, ZNF283, CDKN1B, PER2, ZNF669, ZNF70 |
| GO:0008270~zinc ion
binding | 1.65E-02 | 9 | ZNF169, ATRX,
SMAP2, ZNF439, ZNF283, ZNF669, MBNL2, ZNF70, SLC30A9 |
| GO:0003677~DNA
binding | 1.74E-02 | 9 | ZNF169, ATRX,
HES1, ZNF439, ZNF283, GTF2F1, ZNF669, ZNF70, SLC30A9 |
|
GO:0046914~transition metal ion
binding | 4.68E-02 | 9 | ZNF169, ATRX,
SMAP2, ZNF439, ZNF283, ZNF669, MBNL2, ZNF70, SLC30A9 |
|
| B, The functions
enriched for the DEGs involved in the co-expression network for
OSCC vs. normal comparison group |
|
| Description | P-value | Gene no. | Gene symbol |
|
|
GO:0006350~transcription | 3.41E-06 | 23 | POU6F1, ZNF430,
ZNF264, ZNF818P, SAP18, ZNF669, MED13, ZNF221, ZNF347, ZNF175,
ZBTB25, HES1, ZNF439, NOTCH1, ZNF324, MLX, PER2, LEO1, BCL9L,
SETD8, ZFPM1, NFIC, ZNF70 |
|
GO:0045449~regulation of
transcription | 9.08E-06 | 25 | POU6F1, ZNF430,
ZNF264, ZNF818P, SAP18, ZNF669, MED13, ZNF221, ZNF347, ZNF175,
ZBTB25, HES1, ZNF439, NOTCH1, RNF141, ZNF324, MLX, PER2, LEO1,
BCL9L, SETD8, ZFPM1, NFIC, ZNF70, TERF2 |
|
GO:0006355~regulation of transcription,
DNA-dependent | 2.16E-04 | 18 | POU6F1, ZNF430,
ZNF264, SAP18, ZNF669, MED13, ZNF221, ZNF347, ZNF175, HES1, NOTCH1,
ZNF439, RNF141, ZNF324, MLX, PER2, NFIC, ZNF70 |
|
GO:0051252~regulation of RNA metabolic
process | 2.83E-04 | 18 | POU6F1, ZNF430,
ZNF264, SAP18, ZNF669, MED13, ZNF221, ZNF347, ZNF175, HES1, NOTCH1,
ZNF439, RNF141, ZNF324, MLX, PER2, NFIC, ZNF70 |
| GO:0010605~negative
regulation of macromolecule metabolic process | 2.15E-02 | 8 | HES1, PSMB3,
MLX, GMNN, SETD8, CDC16, NFIC, TERF2 |
| GO:0051172~negative
regulation of nitrogen compound metabolic process | 4.83E-02 | 6 | HES1, MLX, GMNN,
SETD8, NFIC,TERF2 |
qRT-PCR analysis
Through qRT-PCR experiments, the expression levels
of BCL9L, GMPS, HES1, PER2 and TSPAN33 in OLP, OSCC
and normal samples were detected. Compared with normal samples,
BCL9L (P<0.05, Fig. 6A),
PER2 (P<0.05, Fig. 6B)
and TSPAN33 (P<0.05, Fig.
6C) were significantly upregulated in both OLP and OSCC
samples. GMPS (P<0.05, Fig.
6D) in both OLP and OSCC samples, and HES1 (P<0.05,
Fig. 6E) in OSCC samples were
significantly downregulated relative to normal samples.
Discussion
In OLP subepithelial infiltrate, cytokine networks
and inflammatory cells may contribute to squamous tumorigenesis
through affecting cell survival, proliferation, differentiation,
growth and movement (34). Conway
et al analyzed the transcriptomes of matched OSCC, oral
dysplasia and normal oral mucosa samples, finding that IL36G and
adherens junction components play potential roles in malignant
transformation, and lincRNA RP11-351J23.1 acts in
de-differentiation of OSCCs (35).
Jakhesara et al investigated the aberrant transcriptional
events in buccal mucosal cancer (BMC) through high throughput
RNA-Seq analysis, and obtain 588 DEGs and 747 dysregulated isoforms
that may be used for therapeutic intervention and biomarker
evaluation (36). Tang et al
compared the gene expression changes between a late stage and an
early stage of tongue carcinogenesis, and reveal ALDH1A3, PTGS2 and
KRT1 transcripts, as well as pathways of ‘degradation of basement
membrane and ECM pathways’ and ‘cell cycle progression’ may
function in early diagnosis and prevention of human tongue squamous
cell carcinomas (37).
Somoza-Martín et al analyzed the gene expression profile of
OSCC, and identified 322 upregulated genes and 104 downregulated
genes in tumoral tissue (38).
However, these findings were different from our results. In this
study, total 223 (including 74 up- and 149 down-regulated genes)
and 548 (including 80 up- and 468 down-regulated genes) DEGs,
respectively, were identified in OLP vs. normal and OSCC vs. normal
comparison groups. The dendrogram of clustering analysis showed
that the DEGs completely separated the OLP or OSCC samples from
normal samples. Besides, the blue modules for the DEGs in OLP vs.
normal and in OSCC vs. normal comparison groups were
disease-associated modules. Moreover, total 19 common DEGs
(including BCL9L, GMPS, HES1, PER2 and TSPAN33)
associated with both OLP and OSCC were identified. It was clear
that some novel genes might function in the malignant
transformation of OLP.
BCL6, which mediates B cell differentiation
and inflammation, is implicated in malignant transformation via
inhibiting differentiation and promoting proliferation (39). Previous study declares that
BCL2 suppresses the apoptosis of immune process-associated
lymphocytes and the upregulated BCL2-associated X protein
(Bax) has correlation with the apoptosis of epithelial cells
in patients with OLP (40). The
expression alterations of BCL2, Bax, proliferating cell nuclear
antigen (PCNA) and p53 proteins are observed in OLP and epithelial
dysplasia, indicating the malignant potential in both lesions
(41,42). As a nuclear Wnt pathway component,
BCL9 is important for tumor progression and may be used for
therapeutic intervention in several Wnt signaling-associated
malignancies (43). These indicated
that BCL9L might be associated with the malignant potential
of OLP.
Cyclic guanosine monophosphate (cGMP) plays a
critical role in cell differentiation, proliferation and apoptosis,
and functions in inflammation, angiogenesis and synaptic plasticity
(44). Through the nitric
oxide/cGMP/protein kinase G/KATP intracellular signaling pathway,
inflammatory hypernociception can be inhibited by the peripheral
activation of A1 adenosine receptors (A1Rs) (45). The Notch and Toll-like receptor
(TLR) signaling pathways have been demonstrated to cooperately
activate the expression of Notch target genes (such as
Hairy/E(spl)-related with YRPW motif, HEY; and HES1)
and promote the production of TLR-triggered cytokines (such as
IL-6, IL-12 and TNF-α) (46). Several studies have suggested that
the Notch signaling is related to inflammatory disorders (47,48).
HES1 may be implicated in OSCC progression and cancer
stem-like cell (CSC) phenotype in vivo, in addition, the
Notch-HES1 pathway activated by inflammatory cytokine exposure may
promote the phenotype in OSCC (49). Therefore, GMPS and
HES1 might be involved in squamous tumorigenesis in OLP.
The mRNA and protein expression of PER1 was
significantly decreased in OSCC, which may be essential in the
occurrence, development and invasion of OSCC (50). The tumor suppressor gene PER1
acts in the development and progression of OSCC, and may be used as
a molecular target for the treatment of the disease (51). Previous study reported that
PER2 is important for regulating natural killer (NK) cell
function, which shows the direct link between innate immune
responses and the circadian clock system (52). Using de novo mouse cancer
models, Hemler et al found that select tetraspanin proteins
play important roles in tumor initiation, metastasis and promotion
(53). TSPAN33 shows a
restricted expression pattern in activated B cells, and may serve
as a therapeutic target or diagnostic biomarker for B cell
lymphomas or autoimmune diseases (54). The above suggest that PER2
and TSPAN33 might function in the malignant transformation
of OLP to OSCC. In the co-expression networks, BCL9L, HES1,
PER2 and TSPAN33 had interactions (such as
BCL9L-TSPAN33, BCL9L-PER2, and HES1-PER2), indicating
that PER2 and TSPAN33 might also function in OLP via
interacting with other genes. qRT-PCR analysis showed that
BCL9L, PER2 and TSPAN33 were significantly
upregulated in both OLP and OSCC samples. Whereas, GMP in
both OLP and OSCC samples, and HES1 in OSCC samples were
significantly downregulated. The results of qRT-PCR were consistent
with those of bioinformatics analysis, confirming the roles of
BCL9L, GMPS, HES1, PER2 and TSPAN33 in the malignant
transformation of OLP to OSCC.
In conclusion, 223 and 548 DEGs, respective, were
identified in OLP vs. normal and OSCC vs. normal comparison groups
through bioinformatics analysis. Furthermore, BCL9L, GMPS, HES1,
PER2 and TSPAN33 acted in the malignant transformation
of OLP to OSCC. However, these findings need to be further
confirmed.
Acknowledgements
The present study was supported by the Medical
Guiding Project, Science and Technology Commission of Shanghai
Municipality, China (grant no. 134119a8700), the National Natural
Science Foundation of China (grant no. 81470736), and The Shanghai
Natural Science Foundation (grant no. 13ZR1405300).
References
|
1
|
van der Waal I: Potentially malignant
disorders of the oral and oropharyngeal mucosa; terminology,
classification and present concepts of management. Oral Oncol.
45:317–323. 2009. View Article : Google Scholar : PubMed/NCBI
|
|
2
|
Warnakulasuriya S, Johnson NW and van der
Waal I: Nomenclature and classification of potentially malignant
disorders of the oral mucosa. J Oral Pathol Med. 36:575–580. 2007.
View Article : Google Scholar : PubMed/NCBI
|
|
3
|
Shen Z-Y, Liu W, Feng J-Q, Zhou H-W and
Zhou Z-T: Squamous cell carcinoma development in previously
diagnosed oral lichen planus: De novo or transformation? Oral Surg
Oral Med Oral Pathol Oral Radiol Endod. 112:592–596. 2011.
View Article : Google Scholar : PubMed/NCBI
|
|
4
|
Au J, Patel D and Campbell JH: Oral lichen
planus. Oral Maxillofac Surg Clin North Am. 25:93–100, vii. 2013.
View Article : Google Scholar : PubMed/NCBI
|
|
5
|
Gillison ML: Current topics in the
epidemiology of oral cavity and oropharyngeal cancers. Head Neck.
29:779–792. 2007. View Article : Google Scholar : PubMed/NCBI
|
|
6
|
Edwards BK, Brown ML, Wingo PA, Howe HL,
Ward E, Ries LA, Schrag D, Jamison PM, Jemal A, Wu XC, et al:
Annual report to the nation on the status of cancer, 1975–2002,
featuring population-based trends in cancer treatment. J Natl
Cancer Inst. 97:1407–1427. 2005. View Article : Google Scholar : PubMed/NCBI
|
|
7
|
Choi S and Myers JN: Molecular
pathogenesis of oral squamous cell carcinoma: Implications for
therapy. J Dent Res. 87:14–32. 2008. View Article : Google Scholar : PubMed/NCBI
|
|
8
|
Patel SC, Carpenter WR, Tyree S, Couch ME,
Weissler M, Hackman T, Hayes DN, Shores C and Chera BS: Increasing
incidence of oral tongue squamous cell carcinoma in young white
women, age 18 to 44 years. J Clin Oncol. 29:1488–1494. 2011.
View Article : Google Scholar : PubMed/NCBI
|
|
9
|
Mollaoglu N: Oral lichen planus: A review.
Br J Oral Maxillofac Surg. 38:370–377. 2000. View Article : Google Scholar : PubMed/NCBI
|
|
10
|
Mignogna MD, Lo Russo L, Fedele S, Ruoppo
E, Califano L and Lo Muzio L: Clinical behaviour of malignant
transforming oral lichen planus. Eur J Surg Oncol. 28:838–843.
2002. View Article : Google Scholar : PubMed/NCBI
|
|
11
|
Chen Y, Zhang W, Geng N, Tian K and
Windsor Jack L: MMPs, TIMP-2, and TGF-β1 in the cancerization of
oral lichen planus. Head Neck. 30:1237–1245. 2008. View Article : Google Scholar : PubMed/NCBI
|
|
12
|
Mazzarella N, Femiano F, Gombos F, De Rosa
A and Giuliano M: Matrix metalloproteinase gene expression in oral
lichen planus: Erosive vs. reticular forms. J Eur Acad Dermatol
Venereol. 20:953–957. 2006.PubMed/NCBI
|
|
13
|
Shi P, Liu W, Zhou Z-T, He Q-B and Jiang
W-W: Podoplanin and ABCG2: Malignant transformation risk markers
for oral lichen planus. Cancer Epidemiol Biomarkers Prev.
19:844–849. 2010. View Article : Google Scholar : PubMed/NCBI
|
|
14
|
Rhodus NL, Cheng B, Myers S, Miller L, Ho
V and Ondrey F: The feasibility of monitoring NF-kappaB associated
cytokines: TNF-α, IL-1α, IL-6, and IL-8 in whole saliva for the
malignant transformation of oral lichen planus. Mol Carcinog.
44:77–82. 2005. View Article : Google Scholar : PubMed/NCBI
|
|
15
|
Zhang Y, Lin M, Zhang S, Wang Z, Jiang L,
Shen J, Bai J, Gao F, Zhou M and Chen Q: NF-kappaB-dependent
cytokines in saliva and serum from patients with oral lichen
planus: A study in an ethnic Chinese population. Cytokine.
41:144–149. 2008. View Article : Google Scholar : PubMed/NCBI
|
|
16
|
Poomsawat S, Buajeeb W, Khovidhunkit SO
and Punyasingh J: Overexpression of cdk4 and p16 in oral lichen
planus supports the concept of premalignancy. J Oral Pathol Med.
40:294–299. 2011. View Article : Google Scholar : PubMed/NCBI
|
|
17
|
Anders S, McCarthy DJ, Chen Y, Okoniewski
M, Smyth GK, Huber W and Robinson MD: Count-based differential
expression analysis of RNA sequencing data using R and
Bioconductor. Nat Protoc. 8:1765–1786. 2013. View Article : Google Scholar : PubMed/NCBI
|
|
18
|
Patel RK and Jain M: NGS QC Toolkit: A
toolkit for quality control of next generation sequencing data.
PLoS One. 7:e306192012. View Article : Google Scholar : PubMed/NCBI
|
|
19
|
Kim D, Pertea G, Trapnell C, Pimentel H,
Kelley R and Salzberg SL: TopHat2: Accurate alignment of
transcriptomes in the presence of insertions, deletions and gene
fusions. Genome Biol. 14:R362013. View Article : Google Scholar : PubMed/NCBI
|
|
20
|
Smyth GK: Limma: linear models for
microarray data. Bioinformatics and Computational Biology Solutions
Using R and Bioconductor. Springer, Verlag New York Inc.; NY: pp.
397–420. 2005, View Article : Google Scholar
|
|
21
|
Ritchie ME, Phipson B, Wu D, Hu Y, Law CW,
Shi W and Smyth GK: limma powers differential expression analyses
for RNA-sequencing and microarray studies. Nucleic Acids Res.
43:e472015. View Article : Google Scholar : PubMed/NCBI
|
|
22
|
Deza MM and Deza E: Encyclopedia of
distances. Springer; 2009, doi: 10.1007/978-3-642-00234–2.
View Article : Google Scholar
|
|
23
|
Kolde R and Kolde MR: Package ‘pheatmap’.
2015.http://cran.r-project.org/web/packages/pheatmap/index.html
|
|
24
|
Szekely GJ and Rizzo ML: Hierarchical
clustering via joint between-within distances: Extending Ward's
minimum variance method. J Classif. 22:151–183. 2005. View Article : Google Scholar
|
|
25
|
Press W, Teukolsky S, Vetterling W and
Flannery B: Section 16.4. Hierarchical clustering by phylogenetic
trees. Numerical Recipes: The Art of Scientific Computing.
Cambridge University Press; New York: pp. 868–881. 2007
|
|
26
|
Oldham MC, Konopka G, Iwamoto K,
Langfelder P, Kato T, Horvath S and Geschwind DH: Functional
organization of the transcriptome in human brain. Nat Neurosci.
11:1271–1282. 2008. View Article : Google Scholar : PubMed/NCBI
|
|
27
|
Liao Q, Liu C, Yuan X, Kang S, Miao R,
Xiao H, Zhao G, Luo H, Bu D, Zhao H, et al: Large-scale prediction
of long non-coding RNA functions in a coding-non-coding gene
co-expression network. Nucleic Acids Res. 39:3864–3878. 2011.
View Article : Google Scholar : PubMed/NCBI
|
|
28
|
Langfelder P, Zhang B and Horvath S:
Defining clusters from a hierarchical cluster tree: The Dynamic
Tree Cut package for R. Bioinformatics. 24:719–720. 2008.
View Article : Google Scholar : PubMed/NCBI
|
|
29
|
Dong J and Horvath S: Understanding
network concepts in modules. BMC Syst Biol. 1:242007. View Article : Google Scholar : PubMed/NCBI
|
|
30
|
Smoot ME, Ono K, Ruscheinski J, Wang P-L
and Ideker T: Cytoscape 2.8: New features for data integration and
network visualization. Bioinformatics. 27:431–432. 2011. View Article : Google Scholar : PubMed/NCBI
|
|
31
|
Falcon S and Gentleman R: Using GOstats to
test gene lists for GO term association. Bioinformatics.
23:257–258. 2007. View Article : Google Scholar : PubMed/NCBI
|
|
32
|
Tweedie S, Ashburner M, Falls K, Leyland
P, McQuilton P, Marygold S, Millburn G, Osumi-Sutherland D,
Schroeder A, Seal R, et al: FlyBase Consortium: FlyBase: Enhancing
Drosophila gene ontology annotations. Nucleic Acids Res.
37:D555–D559. 2009. View Article : Google Scholar : PubMed/NCBI
|
|
33
|
Arocho A, Chen B, Ladanyi M and Pan Q:
Validation of the 2-DeltaDeltaCt calculation as an alternate method
of data analysis for quantitative PCR of BCR-ABL P210 transcripts.
Diagn Mol Pathol. 15:56–61. 2006. View Article : Google Scholar : PubMed/NCBI
|
|
34
|
Mignogna MD, Fedele S, Lo Russo L, Lo
Muzio L and Bucci E: Immune activation and chronic inflammation as
the cause of malignancy in oral lichen planus: Is there any
evidence? Oral Oncol. 40:120–130. 2004. View Article : Google Scholar : PubMed/NCBI
|
|
35
|
Conway C, Graham JL, Chengot P, Daly C,
Chalkley R, Ross L, Droop A, Rabbitts P and Stead LF: Elucidating
drivers of oral epithelial dysplasia formation and malignant
transformation to cancer using RNAseq. Oncotarget. 6:40186–40201.
2015.PubMed/NCBI
|
|
36
|
Jakhesara SJ, Koringa PG, Bhatt VD, Shah
TM, Vangipuram S, Shah S and Joshi CG: RNA-Seq reveals
differentially expressed isoforms and novel splice variants in
buccal mucosal cancer. Gene. 516:24–32. 2013. View Article : Google Scholar : PubMed/NCBI
|
|
37
|
Tang X-H, Urvalek AM, Osei-Sarfo K, Zhang
T, Scognamiglio T and Gudas LJ: Gene expression profiling
signatures for the diagnosis and prevention of oral cavity
carcinogenesis-genome-wide analysis using RNA-seq technology.
Oncotarget. 6:24424–24435. 2015. View Article : Google Scholar : PubMed/NCBI
|
|
38
|
Somoza-Martín JM, García-García A,
Barros-Angueira F, Otero-Rey E, Torres-Español M, Gándara-Vila P,
Reboiras-López MD, Blanco-Carrión A and Gándara-Rey JM: Gene
expression profile in oral squamous cell carcinoma: A pilot study.
J Oral Maxillofac Surg. 63:786–792. 2005. View Article : Google Scholar : PubMed/NCBI
|
|
39
|
Shaffer AL, Yu X, He Y, Boldrick J, Chan
EP and Staudt LM: BCL-6 represses genes that function in lymphocyte
differentiation, inflammation, and cell cycle control. Immunity.
13:199–212. 2000. View Article : Google Scholar : PubMed/NCBI
|
|
40
|
Fan Y, Zhan Z, Peng T, Song XL and Feng
ZQ: The expression of apoptosis-associated proteins Bcl-2, Bax in
oral leukoplakia and lichen planus. Shanghai Kou Qiang Yi Xue.
13:497–501. 2004.(In Chinese). PubMed/NCBI
|
|
41
|
Hadzi-Mihailovic M, Raybaud H, Monteil R,
Cakic S, Djuric M and Jankovic L: Bcl-2 expression and its possible
influence on malignant transformation of oral lichen planus. J
BUON. 15:362–368. 2009.
|
|
42
|
Sousa FA, Paradella TC, Carvalho YR and
Rosa LE: Immunohistochemical expression of PCNA, p53, bax and bcl-2
in oral lichen planus and epithelial dysplasia. J Oral Sci.
51:117–121. 2009. View Article : Google Scholar : PubMed/NCBI
|
|
43
|
Mani M, Carrasco DE, Zhang Y, Takada K,
Gatt ME, Dutta-Simmons J, Ikeda H, Diaz-Griffero F, Pena-Cruz V,
Bertagnolli M, et al: BCL9 promotes tumor progression by conferring
enhanced proliferative, metastatic, and angiogenic properties to
cancer cells. Cancer Res. 69:7577–7586. 2009. View Article : Google Scholar : PubMed/NCBI
|
|
44
|
Pilz RB and Broderick KE: Role of cyclic
GMP in gene regulation. Front Biosci. 10:1239–1268. 2005.
View Article : Google Scholar : PubMed/NCBI
|
|
45
|
Lima FO, Souza GR, Verri WA Jr, Parada CA,
Ferreira SH, Cunha FQ and Cunha TM: Direct blockade of inflammatory
hypernociception by peripheral A1 adenosine receptors: Involvement
of the NO/cGMP/PKG/KATP signaling pathway. Pain. 151:506–515. 2010.
View Article : Google Scholar : PubMed/NCBI
|
|
46
|
Hu X, Chung AY, Wu I, Foldi J, Chen J, Ji
JD, Tateya T, Kang YJ, Han J, Gessler M, et al: Integrated
regulation of Toll-like receptor responses by Notch and
interferon-γ pathways. Immunity. 29:691–703. 2008. View Article : Google Scholar : PubMed/NCBI
|
|
47
|
Okamoto M, Takeda K, Joetham A, Ohnishi H,
Matsuda H, Swasey CH, Swanson BJ, Yasutomo K, Dakhama A and Gelfand
EW: Essential role of Notch signaling in effector memory
CD8+ T cell-mediated airway hyperresponsiveness and
inflammation. J Exp Med. 205:1087–1097. 2008. View Article : Google Scholar : PubMed/NCBI
|
|
48
|
Niranjan T, Bielesz B, Gruenwald A, Ponda
MP, Kopp JB, Thomas DB and Susztak K: The Notch pathway in
podocytes plays a role in the development of glomerular disease.
Nat Med. 14:290–298. 2008. View
Article : Google Scholar : PubMed/NCBI
|
|
49
|
Lee SH, Hong HS, Liu ZX, Kim RH, Kang MK,
Park NH and Shin KH: TNFα enhances cancer stem cell-like phenotype
via Notch-Hes1 activation in oral squamous cell carcinoma cells.
Biochem Biophys Res Commun. 424:58–64. 2012. View Article : Google Scholar : PubMed/NCBI
|
|
50
|
Chen R, Yang K, Zhao N-B, Zhao D, Chen D,
Zhao CR and Tang H: Abnormal expression of PER1 circadian-clock
gene in oral squamous cell carcinoma. Onco Targets Ther. 5:403–407.
2012.PubMed/NCBI
|
|
51
|
Fu X-J, Li H-X, Yang K, Chen D and Tang H:
The important tumor suppressor role of PER1 in regulating the
cyclin-CDK-CKI network in SCC15 human oral squamous cell carcinoma
cells. Onco Targets Ther. 9:2237–2245. 2016.PubMed/NCBI
|
|
52
|
Liu J, Malkani G, Shi X, Meyer M,
Cunningham-Runddles S, Ma X and Sun ZS: The circadian clock Period
2 gene regulates gamma interferon production of NK cells in host
response to lipopolysaccharide-induced endotoxic shock. Infect
Immun. 74:4750–4756. 2006. View Article : Google Scholar : PubMed/NCBI
|
|
53
|
Hemler ME: Tetraspanin proteins promote
multiple cancer stages. Nat Rev Cancer. 14:49–60. 2014. View Article : Google Scholar : PubMed/NCBI
|
|
54
|
Luu VP, Hevezi P, Vences-Catalan F,
Maravillas-Montero JL, White CA, Casali P, Llorente L, Jakez-Ocampo
J, Lima G, Vilches-Cisneros N, et al: TSPAN33 is a novel marker of
activated and malignant B cells. Clin Immunol. 149:388–399. 2013.
View Article : Google Scholar : PubMed/NCBI
|