Introduction
Neuroblastoma (NB) is a paediatric solid tumour
arising from neural crest-derived precursors, and it accounts for
8–10% of all malignancies and 12–15% of cancer-related deaths in
children (1). It is characterized
by marked clinical heterogeneity, and the assessment of NB-related
genetic abnormalities has been helpful in predicting clinical
outcome, stratifying patients into different risk classes and
designing appropriate treatments (2,3). MYCN
amplification at 2p24 is a well-known genetic alteration associated
with NB development and progression (4–8),
irrespective of age at diagnosis and clinical stage, whose
examination is required in NB tumours before treatment begins
(9). Indeed, approximately half of
high-risk aggressive tumours are characterized by amplification of
the MYCN gene, an oncogene of the MYC family of transcription
factors that controls the expression of many target genes, which in
turn regulates fundamental cellular processes including
proliferation, cell growth, apoptosis and differentiation (10).
MicroRNAs (miRNAs) are a class of small non-coding
RNAs that regulate gene expression at the post-transcriptional
level, by binding to the complementary sites in the 3-untranslated
region (3-UTR) of target messenger RNAs (11–13).
Currently, more than 1,800 miRNA genes have been identified in the
human genome (miRBase release 21.0) (14), and bioinformatic predictions
indicate that up to 60% of protein-coding genes may be regulated by
miRNAs (15). miRNAs play a central
role in many cellular processes and their aberrant expression has
been reported in childhood solid tumours, including NB (16,17).
In the latter, by applying miRNA microarrays and high-throughput
sequencing technologies, a series of miRNAs have been reported to
play a role as oncogenes or tumour suppressors, as reviewed by Mei
et al (18). For example,
dysregulation of miR-542-5p is highly correlated with tumour
aggressiveness and poor survival (19), while miRNA-34a was found to be a
potent tumour-suppressor molecule (20). Moreover, some miRNA levels appear to
have the potential to increase the efficacy of treatment by
regulating the sensitivity of NB cells to cisplatin (21,22).
In the present study, we investigated the expression
of miRNAs in NB by using next generation sequencing (NGS)
technology, which allows for a comprehensive assessment of the
miRNA transcriptome and has the potential to detect miRNA length
variations or sequence modifications (isomiRs) as well as novel
miRNA sequences. The SOLiD System was used to sequence small RNA
(sRNA) libraries from NB tumours with and without
MYCN-amplification and from human dorsal root ganglia (DRG) as a
control, in order to detect the genome-wide differences in miRNA
levels in these two subtypes of NB. The analysis showed that 128
known miRNAs were significantly dysregulated in the NB tumours in
comparison to DRG, utilised as a normal control. Notably, 23 miRNAs
were differentially expressed in MYCN-amplified vs. MYCN-non
amplified tumours. Furthermore, 18 new miRNA candidates were
detected in NB samples: 10 in the MNAs, 6 in the MNnA samples and 2
in both tumour subtypes; 2 putative novel miRNAs were found in the
DRG. Notably, the Gene Ontology (GO) analysis of the potential
targets of the upregulated and downregulated miRNAs indicated that
many genes belong to biological processes and cellular components
that are involved in cell growth, cell shape, protein activity and
genomic instability necessary for cancer initiation and
progression. Furthermore, analysis with Kyoto Encyclopaedia of
Genes and Genomes (KEGG) web tools revealed significant enrichment
in several cancer-related signalling pathways.
The present study provides valuable information
concerning the mechanisms in NB of the miRNA-associated MYCN
network that may contribute to the development of novel diagnostic
biomarkers and effective therapeutic strategies for this
cancer.
Materials and methods
Patient features and normal
controls
Twenty-two NB primary tumour samples, equally
distributed between MYCN-amplified (MNA) and MYCN-non amplified
(MNnA) samples, were obtained at diagnosis before any treatment
from children admitted to the Department of Oncology at Alder Hey
Children's NHS Trust, Liverpool. Histopathological diagnosis was
confirmed using immunohistochemistry. Details of the patients are
described in Table I. Institutional
written informed consent was obtained from the patients parents or
legal guardians.
 | Table I.Clinicopathological features of the
analysed tumour cases. |
Table I.
Clinicopathological features of the
analysed tumour cases.
| Case | Age at
diagnosis | MYCN status | Primary site | Clinical stage |
|---|
| NB1a | 36 |
<3 | Adrenal | 4 |
| NB2a | 65 |
<3 | Adrenal | 4 |
| NB3a | 69 |
<3 | Adrenal | 4 |
| NB4a | 53 |
<3 | Abdomen | 4 |
| NB22 | 199 |
<3 | Abdomen | 4 |
| NB45 |
3 |
<3 | Adrenal | 4 |
| NB54 |
6 |
<3 | Adrenal | 1 |
| NB70 | 22 |
<3 | Abdomen | 4 |
| NB80 | 25 |
<3 | Abdomen | 4 |
| NB96 | 111 |
<3 | Adrenal | 3 |
| NB106 |
7 |
<3 | Thorax | 2 |
| NB5a | 10 | >10 | Adrenal | 4 |
| NB6a |
8 | >10 | Adrenal | 4 |
| NB7a | 37 | >10 | Adrenal | 4 |
| NB8a | 16 | >10 | Abdomen | 4 |
| NB57 | 44 | >10 | Adrenal | 2 |
| NB68 | 13 | >10 | Abdomen | 4 |
| NB79 | 29 | >10 | Abdomen | 4 |
| NB81 | 37 | >10 | Adrenal | 2B |
| NB97 | 40 | >10 | Abdomen | 4 |
| NB100 | 179 | >10 | Abdomen | 4 |
| NB105 | 16 | >10 | Adrenal | 4 |
The study underwent ethical review and approval
according to the local institutional guidelines (Alder Hey
Children's NHS Foundation Trust Ethics Committee, approval number
09/H1002/88).
Human DRG total RNA (Clontech Laboratories, Inc.,
Mountain View, CA, USA), pooled from normal tissues of 21
male/female Caucasians who had died suddenly, was used as a normal
control. DRG were utilised as a normal control because of their
neural crest-derived histogenesis (23) and since NB can occasionally arise
from these organs (24).
RNA isolation
Tumour samples were frozen in liquid nitrogen
immediately after surgical removal and stored at −80°C. Total RNA
was isolated by tissues ground under liquid nitrogen using 1 ml of
TRIzol LS reagent (Life Technologies, Carlsbad, CA, USA) per 50–100
mg of sample according to the manufacturers protocol. RNA
concentration and purity were measured by NanoDrop 2000 (Thermo
Fisher Scientific, Inc., Waltham, MA, USA), having 260/280 ratio
values in the range of 1.9–2.1.
Small RNA library construction and
high-throughput sequencing
Total RNA samples (5 µg) were enriched for small
RNAs up to 200 bp by size selection using PureLink miRNA Isolation
kit (Life Technologies) and RNA quality was assessed, before and
after RNA enrichment, by the Agilent 2100 Bioanalyzer (Agilent
Technologies, Santa Clara, CA, USA) using a Agilent RNA 6000 Nano
and a Agilent Small RNA kit, respectively. Enriched RNA samples
were processed using the Small RNA Expression kit according to the
manufacturers protocol (Small RNA Expression kit, rev. B; Applied
Biosystems, Foster City, CA, USA). Briefly, 20 ng of RNA was first
hybridized and ligated with the adapter mix ‘A’, subsequently
reverse transcribed and treated with RNAse H. The cDNA libraries
were then PCR amplified, purified and size-selected by PAGE,
resulting in libraries containing inserted small RNA sequences of
20–40 bp length. Size, integrity and purity of the libraries were
verified by the Agilent 2100 Bioanalyzer, Agilent DNA 1000 kit. The
cDNA libraries were barcoded using the SOLiD RNA barcoding kit and
amplified onto beads using emulsion PCR. Templated beads were
deposited on slides and analysed using the Applied Biosystems SOLiD
4 sequencer.
Quantification of known microRNAs
The qualified clean reads were mapped and analysed
with the ‘small RNA’ bioinformatics pipeline from the Thermo Fisher
LifeScope version 2.5.1 software (https://www.thermofisher.com/it/en/home/technical-resources/software-downloads/lifescope-genomic-analysis-software.html),
using as a target the human genome GRCh38/hg38 and the dataset of
mature and precursor miRNA sequences (miRBase, release 21.0)
(25). Any sequence match against
repetitive elements of the genome (SINEs and LINEs), and against
non-miRNA small RNAs (snoRNAs, piRNAs, tRNAs and rRNA fragments)
were filtered out from the results.
Sequence counts were extracted and reformatted with
Genomnia Perl scripts from the pipeline output. Differential
expression analysis was performed with the edgeR Bioconductor
statistical library version 3.1.0 on R (26) incorporated in a proprietary Genomnia
pipeline. TMM-normalized sequence counts in the libraries were
transformed in counts per millions (CPM) according to the formula:
CPM = (transcript normalized counts/total miRNA matches) ×
1,000,000. After having estimated the tagwise dispersion, genewise
exact test (26) as implemented in
edgeR was used to measure the significance of differential
expression, using the miRNA ‘Pseudo-counts’. Sequences were
filtered out to remove poorly expressed microRNAs (i.e. miRNAs with
<10 CPM in more than half of the samples). miRNAs were
considered significantly differentially expressed if the false
discovery rate (FDR; P-value corrected for multiple comparison with
the Benjamini-Hochberg procedure) obtained with this method was
<0.05. The MNA vs. MNnA comparison was also performed with the
edgeR generalized linear model (GLM) mode optimised for the
analysis of data with sequence spikes (27), in order to confirm the obtained
results with a second robust statistical approach well suited to
handle outlier data.
miRNA target prediction, functional
annotation and promoter motif discovery
For each differentially expressed miRNA, a list of
experimentally validated targets was extracted from miRTarBase
release 6 (http://mirtarbase.mbc.nctu.edu.tw/) (28). In addition, de novo target
prediction was performed using the miRanda software (29) on selected downregulated and
upregulated microRNAs from the comparison MNA vs. MNnA. The 3UTR
sequences of all human transcripts present in Ensembl (release 78)
were used as a target set for this analysis, and only predictions
with total score ≥155 and total energy ≤-20 were considered as
putative miRNA targets. Annotation and enrichment of functional
pathways and ontology terms associated with the selected target
genes were evaluated using DAVID Bioinformatics Resources 6.7
(30). The same target gene list
was used as the starting dataset for the generation of a Functional
Interaction network analysis and related Gene Ontology enrichment
analysis with the Cytoscape Reactome FI plugin (31,32).
Promoter regions of the differentially expressed miRNAs in the
comparison MNA vs. MNnA were scanned for motifs by FIMO 4.10.2
software (http://meme-suite.org/tools/fimo) (33). A sequence of 5 Kb was considered as
putative upstream regulatory region for each miRNA or miRNA cluster
based on the histone acetylation track (H3K27Ac) reported in UCSC.
Finally, the MYCN binding motifs available in JASPAR CORE database
(http://jaspar.genereg.net/) were used in
the promoter analysis.
Identification of isomiRs and
prediction of novel microRNAs
The alignment files in BAM format corresponding to
the same biological group (MNA, MNnA and Control) were merged and
converted to sequence alignment/map (SAM) format with samtools
(34). The files were then
processed and analysed with the miRDeep2 software for miRNA
prediction (35). The differential
expression analysis for isomiRs was carried out with edgeR from
Bioconductor, with the same analytical strategy previously
described. A set of potentially novel microRNAs was also
identified, by selecting among miRDeep2 predictions the hairpins
with a probability >60% to be a true positive. Their expression
was also evaluated in all samples. miRNA extraction, library
preparation, sequencing and bioinformatics analysis were performed
by Genomnia s.r.l.
Quantitative real-time PCR (qPCR)
Quantitative real-time PCR (qPCR) was performed to
validate some results obtained from the high-throughput sequencing.
In brief, step-loop reverse transcription and qPCR were carried out
using TaqMan MicroRNA assays (Life Technologies) specific for human
miR-18a-5p, miR-217, miR-491-5p and miR-628-3p, according to the
manufacturers protocol. Ct values for miRNAs were normalized
against U6 small nuclear RNA (RNU6) levels, used as an internal
control. The relative expression of each miRNA was calculated by
the comparative Ct method and expressed as fold-change. All samples
were run in triplicate reactions in the StepOnePlus Real-Time
system (Life Technologies) instrument. Results are expressed as
means ± standard deviation (SD), and a P<0.05 was considered
statistically significant.
Cell lines
The MYCN-amplified KCNR cell line was grown in
RPMI-1640 medium supplemented with 10% fetal bovine serum (FBS), 1%
v/v non-essential amino acid solution, 2 mM glutamine, 100 U/ml
penicillin and 100 µg/ml streptomycin. HEK (human embryonic kidney)
293T cells were cultured in high-glucose DMEM, supplemented with
10% FBS, 2 mM L-glutamine, 100 U/ml penicillin and 100 µg/ml
streptomycin. All cell lines were maintained in a humidified
incubator at 37°C and 5% CO2, and appropriately
sub-cultured before confluence was reached.
Plasmid construction and luciferase
assays
The 3UTR region of the human MYCN gene (3HSAR055440
derived from http://utrdb.ba.itb.cnr.it/) was amplified from
genomic DNA using a proof reading Phusion High-Fidelity PCR Master
Mix (Finnzymes, Espoo, Finland) with the following primers: MYCN
3UTR-F 5-GCTCTAGAACGCTTCTCAAAACTG
GACAGTCAC-3 and MYCN 3UTR-R 5-GCTCTAGAAACATGAGGTATTTCAAAGTGCTATAAGATGC-3.
The 880-bp amplified product was inserted into the XbaI site
(underlined primer sequences) of the pRLTK vector (Promega,
Madison, WI, USA) immediately downstream of the Renilla
luciferase gene. The luciferase reporter construct, termed
pMYCN-3UTR, was validated by specific restriction digestions as
well as bi-directional sequencing by Bio-Fab Research (Rome,
Italy). HEK293T cells were plated at a density of
1.5×10⁵/well in 24-well plates and co-transfected after
24 h with 50 ng of pMYCN-3UTR Renilla luciferase construct,
10 ng of reference firefly luciferase reporter (pGL3-SV40; Promega)
and 100 nM of mir-628-3p (mirVana miRNA mimic -
MI0003642/MIMAT0003297 by Thermo Fisher Scientific) or miR-Ctr
(miRIDIAN microRNA Mimic Negative Control #1; Dharmacon, Lafayette,
CO, USA) molecules using 2 µl of Lipofectamine 2000 (Invitrogen).
Cells were lysed 72 h after transfection and luciferase signals
were detected by the Dual-luciferase reporter assay (Promega) using
the GloMax Discover System (Promega), following the manufacturers
instructions. Renilla luciferase activity was normalized to
the firefly luciferase activity for each reaction. Two independent
experiments were carried out, each in triplicate. All the
luciferase data are expressed as the mean ± SD normalized to the
negative control miRNA.
Protein extracts and western blot
analysis
KCNR cells were seeded at 6.0×10⁵/well in
12-well plates and transfected the day after with miR-628-3p or
miR-Ctr (50 mM final concentration) using Lipofectamine 2000,
according to the manufacturer's instructions. After 72 h, protein
expression was determined by western blotting as previously
described (36) with a primary
antibodies against MYCN (1:1,000; Santa Cruz Biotechnology, Santa
Cruz, CA, USA). Tubulin (Sigma-Aldrich, St. Louis, MO, USA) was
used as a normalization control for equal loading. Chemiluminescent
signals were revealed by ChemiDoc XRS+ System (Bio-Rad
Laboratories, Hercules, CA, USA) and densitometric analysis was
performed by Image Lab 5.1 software (Bio-Rad Laboratories).
Results and Discussion
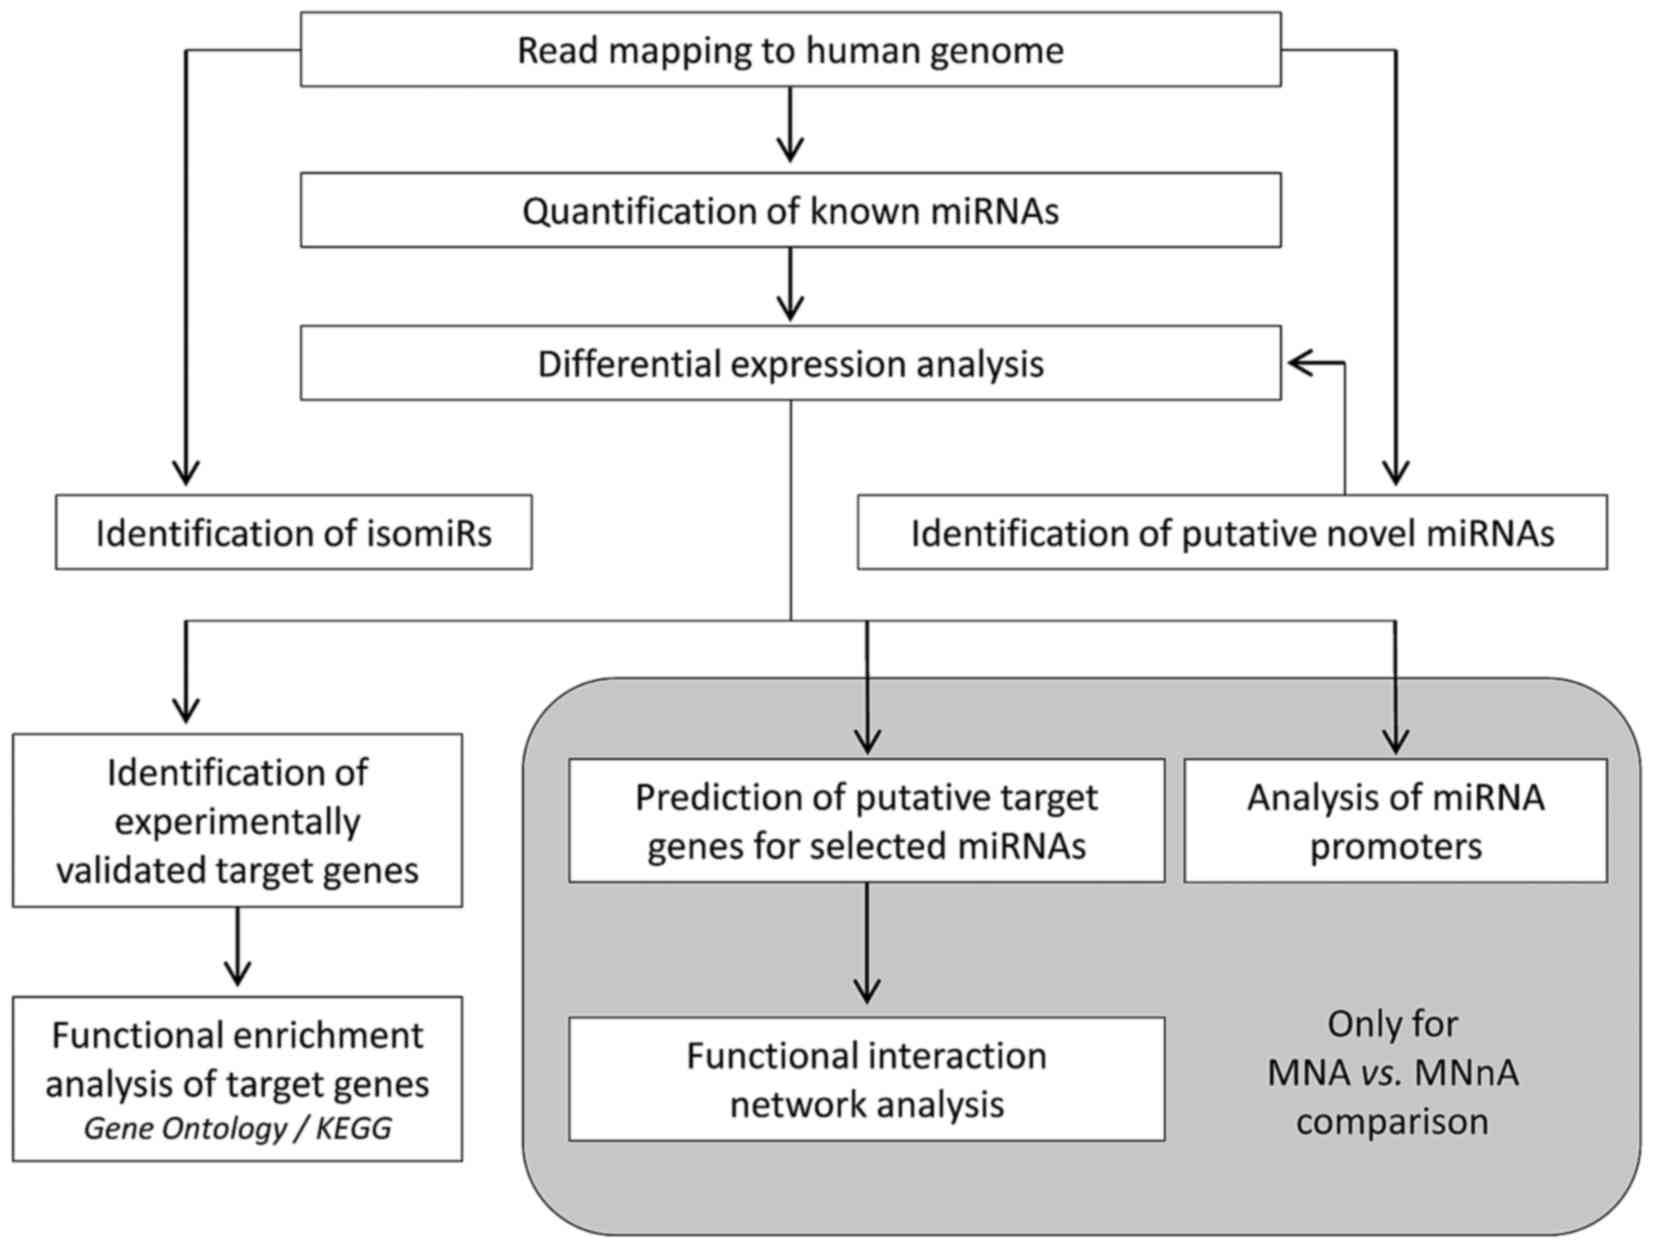
Identification and quantification of
annotated miRNAs
Comprehensive miRNA, isomiR and novel miRNA
identification, annotation and analysis were developed in the
framework of this project and are summarized in Fig. 1. The miRNA transcriptome was
profiled by sequencing of mature miRNA molecules in a panel of
primary NB tumours, 4 with MYCN-amplification (MNA) and 4 without
MYCN-amplification (MNnA) and from normal dorsal root ganglia
(DRG). The clinical characteristics of the patients are reported in
Table I. Small RNA libraries were
prepared and deep sequenced by using a SOLiD 4 sequencer platform.
Approximately 71 million reads mapped with high quality against the
human reference genome (GRCh38/hg38, repeat masked), with an
average of 8 million reads per library. The reads corresponding to
annotated miRNAs were identified by mapping all reads against the
human precursor and mature sequences included in miRBase v21.0.
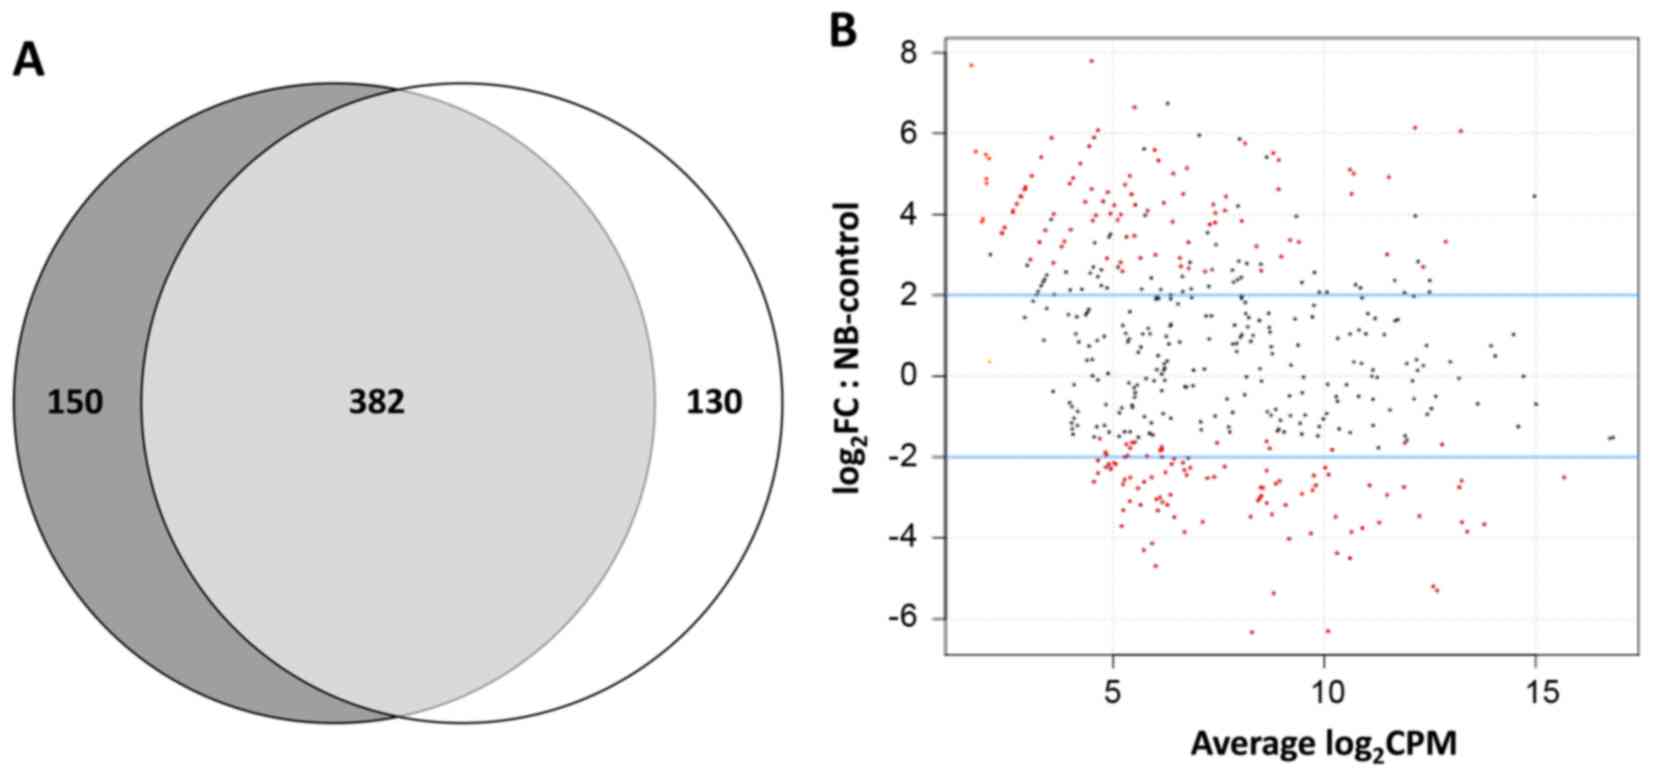
Fig. 2A shows that a total of 532
distinct known miRNAs had on average at least 10 read counts in the
NB tumour samples, while 512 miRNAs were detected in the DRG
sample; 382 of these were expressed in both conditions, with a 72%
overlap for NB miRNAs and 75% overlap for DRG miRNAs. Thus, about a
quarter of the identified known microRNAs were uniquely expressed
in NB or control samples. NB-specific miRNAs might therefore play
an important functional role in tumour development and progression,
through the regulation of downstream targets and the biological
pathways affected by these genes.
Differential expression analysis of
miRNAs in NB vs. DRG and functional annotation analysis
Based on the high-throughput sequencing of small
RNAs, we performed differential expression analysis of miRNAs
comparing the two libraries from NB tumours (MNA and MNnA
collectively considered) and DRG, after removing poorly expressed
miRNAs. Of a total of 198 differentially expressed miRNAs in the
dataset, 128 (64.6%) displayed statistically significant
differential levels in NB tumours in comparison with DRG, after FDR
correction. Notably, out of these 128, 47 miRNAs (36.7%) were
expressed at higher levels in NBs (Table IIA), while 81 (63.3%) were
expressed at lower levels (Table
IIB). Fig. 2B shows the
distribution of the different mature miRNA species in abundance
classes comparing NB tumours (MNA and MNnA collectively considered)
against DRG, allowing a survey of the entire miRNA population.
Significantly dysregulated miRNAs are indicated in red. Among the
differentially expressed miRNAs, some have been previously
associated with NB development, such as upregulated miR-876-5p,
miR-19a, as well as downregulated miR-183-5p, miR-423-3p and
miR-92b-3p (18,36–39).
Other miRNAs have been implicated in the pathogenesis of many types
of human cancer but not in NB malignancy to date. In particular, of
main interest are upregulated miR-127-5p, miR-369-3p and miR-655-3p
encoded in the large 14q32 miRNA cluster and associated with
oligometastases through suppression of shared target genes involved
in cytoskeletal organization, cell motility and TGF-β signalling
pathways (40). Also the marked
downregulation of miR-328-3p in NB samples in comparison to DRG
suggests its possible role as a tumour suppressor also in this
malignancy as already observed in other types of cancers, such as
acute myeloid leukaemia, chronic myelogenous leukaemia and
glioblastoma (41,42). Therefore, future experiments will
address the role of this miRNA in the proliferation, invasion and
metastasis of NB tumour cells. Another new attractive result is the
significant downregulation of miR-1247-5p, whose suppression has
been demonstrated to play an important role in pancreatic cancer
(43,44). Notably, the molecular mechanisms
underlying the role of miR-1247-5p have been correlated with its
capacity to directly target and silence the expression of
neuropilins (44), which are
transmembrane glycoproteins recently implicated in tumour functions
and found as promising drug target candidates in leukaemia and
lymphoma (45). Furthermore,
miR-1247-5p also belongs to the 14q32 miRNA cluster (but in reverse
strand in respect to the above mentioned miR-127-5p, miR-369-3p and
miR-655-3p) and its aberrant expression in colorectal cancer has
been linked to hypermethylation, confirming the importance of
epigenetic modifications in miRNA-mediated cancer development
(46). Since alterations in DNA
methylation are frequent in NB and can also modulate sensitivity to
cytotoxic agents (47), the
analysis of the miR-1247-5p promoter region in NB samples could
provide new insight into the mechanisms that correlate epigenetic
processes and NB development.
| Table II.miRNA expression in NB tumours. |
Table II.
miRNA expression in NB tumours.
| A, miRNA species
expressed at higher levels in NBs (MNA and MNnA are collectively
considered) vs. DRG |
|---|
|
|---|
| miRNA_ID |
log2FC | FDR | miRNA_ID |
log2FC | FDR |
|---|
| hsa-miR-876-5p | 13.31 | 0.01104 |
hsa-let-7f-2-3p | 4.75 | 0.01169 |
|
hsa-miR-3117-3p | 11.02 | 0.01191 | hsa-miR-495-3p | 4.62 | 0.00587 |
| hsa-miR-655-3p | 10.93 | 0.00220 |
hsa-miR-450a-5p | 4.61 | 0.01676 |
| hsa-miR-215-5p | 10.83 | 0.00271 | hsa-miR-656-3p | 4.54 | 0.01232 |
| hsa-miR-25-5p | 10.19 | 0.03121 | hsa-miR-101-3p | 4.51 | 0.00866 |
| hsa-miR-153-5p | 10.06 | 0.01678 | hsa-miR-411-5p | 4.51 | 0.02650 |
| hsa-miR-377-3p |
8.75 | 0.02109 | hsa-miR-142-3p | 4.49 | 0.04022 |
| hsa-miR-495-5p |
8.64 | 0.02699 | hsa-miR-7-1-3p | 4.44 | 0.04325 |
| hsa-miR-490-3p |
7.76 | 0.04137 | hsa-miR-98-3p | 4.42 | 0.02650 |
| hsa-miR-218-5p |
6.14 | 0.01242 | hsa-miR-1197 | 4.42 | 0.01817 |
| hsa-miR-369-3p |
6.07 | 0.00372 | hsa-miR-127-5p | 4.31 | 0.01817 |
| hsa-miR-21-5p |
6.06 | 0.01817 | hsa-miR-590-3p | 4.23 | 0.01893 |
| hsa-miR-9-3p |
5.88 | 0.03226 |
hsa-miR-3613-5p | 4.23 | 0.03121 |
| hsa-miR-7-5p |
5.75 | 0.00231 | hsa-miR-136-3p | 4.22 | 0.01676 |
|
hsa-miR-218-2-3p |
5.67 | 0.03121 | hsa-miR-192-5p | 4.09 | 0.03226 |
| hsa-miR-873-5p |
5.58 | 0.02699 | hsa-miR-424-5p | 4.04 | 0.02701 |
| hsa-miR-19a-3p |
5.52 | 0.03767 | hsa-miR-454-3p | 3.99 | 0.03238 |
| hsa-miR-32-5p |
5.38 | 0.01518 | hsa-miR-299-3p | 3.97 | 0.03666 |
|
hsa-miR-301a-3p |
5.35 | 0.02699 | hsa-miR-590-5p | 3.83 | 0.03315 |
| hsa-miR-137 |
5.33 | 0.00499 | hsa-miR-154-3p | 3.81 | 0.03767 |
| hsa-miR-153-3p |
5.24 | 0.01676 |
hsa-miR-374a-5p | 3.44 | 0.03121 |
| hsa-miR-142-5p |
5.14 | 0.03121 | hsa-miR-30e-5p | 3.32 | 0.03121 |
|
hsa-miR-106b-5p |
5.10 | 0.04325 | hsa-miR-337-3p | 3.31 | 0.04571 |
| hsa-miR-380-3p |
4.95 | 0.01749 |
|
|
|
|
| B, miRNA species
expressed at lower levels in NBs (MNA and MNnA are collectively
considered) vs. DRG |
|
| miRNA_ID |
log2FC | FDR | miRNA_ID |
log2FC | FDR |
|
| hsa-miR-6079 | −6.33 | 1.19E-20 |
hsa-miR-1307-3p | −2.91 | 0.00127 |
| hsa-let-7d-3p | −6.30 | 9.76E-18 | hsa-miR-320e | −2.81 | 0.00175 |
|
hsa-miR-1247-5p | −5.36 | 3.79E-06 |
hsa-miR-193b-5p | −2.77 | 0.00219 |
| hsa-miR-4301 | −5.31 | 1.41E-13 |
hsa-miR-1180-3p | −2.76 | 0.00512 |
| hsa-miR-328-3p | −5.19 | 1.9E-11 |
hsa-miR-1306-5p | −2.75 | 0.00271 |
| hsa-miR-6074 | −4.71 | 6.15E-09 | hsa-let-7b-5p | −2.75 | 0.00200 |
|
hsa-miR-193a-5p | −4.50 | 5.22E-09 | hsa-miR-204-5p | −2.74 | 0.03416 |
| hsa-miR-874-3p | −4.38 | 3.46E-09 | hsa-miR-197-3p | −2.69 | 0.00133 |
|
hsa-miR-2277-3p | −4.31 | 5.28E-10 | hsa-miR-744-5p | −2.69 | 0.00763 |
| hsa-miR-760 | −4.13 | 0.00001 |
hsa-miR-3605-3p | −2.66 | 0.00118 |
| hsa-miR-504-5p | −4.02 | 0.00009 | hsa-miR-99b-3p | −2.66 | 0.00286 |
| hsa-miR-532-3p | −3.89 | 0.00001 |
hsa-miR-146b-3p | −2.62 | 0.00590 |
| hsa-miR-338-5p | −3.85 | 0.00053 |
hsa-miR-3177-3p | −2.61 | 0.00487 |
| hsa-miR-2110 | −3.85 | 0.00000 | hsa-miR-211-5p | −2.59 | 0.03315 |
|
hsa-miR-193b-3p | −3.84 | 0.00003 | hsa-miR-149-5p | −2.59 | 0.02363 |
| hsa-miR-3974 | −3.76 | 0.00001 |
hsa-miR-6803-3p | −2.56 | 0.00175 |
|
hsa-miR-3620-3p | −3.68 | 0.00000 | hsa-miR-133b | −2.52 | 0.00722 |
| hsa-miR-574-3p | −3.66 | 0.00014 |
hsa-miR-3940-3p | −2.52 | 0.01649 |
| hsa-miR-320b | −3.61 | 0.00010 |
hsa-miR-125a-5p | −2.50 | 0.00499 |
| hsa-miR-320a | −3.61 | 0.00072 |
hsa-miR-6511b-3p | −2.49 | 0.00883 |
| hsa-miR-3615 | −3.60 | 0.00000 | hsa-miR-671-3p | −2.49 | 0.00512 |
| hsa-miR-23b-5p | −3.48 | 0.00009 | hsa-miR-324-3p | −2.46 | 0.01152 |
| hsa-miR-92b-3p | −3.48 | 0.00009 | hsa-miR-1270 | −2.46 | 0.00831 |
| hsa-miR-183-5p | −3.47 | 0.03136 | hsa-miR-320d | −2.43 | 0.00957 |
| hsa-miR-423-3p | −3.46 | 0.00002 |
hsa-miR-6511a-3p | −2.38 | 0.00590 |
| hsa-miR-940 | −3.42 | 0.00005 |
hsa-miR-92a-1-5p | −2.38 | 0.04931 |
| hsa-miR-1257 | −3.33 | 0.00118 |
hsa-miR-1296-5p | −2.33 | 0.02650 |
| hsa-miR-4532 | −3.33 | 0.00002 | hsa-miR-3975 | −2.33 | 0.02850 |
| hsa-miR-589-5p | −3.19 | 0.00009 | hsa-miR-3178 | −2.31 | 0.03121 |
| hsa-miR-615-3p | −3.19 | 0.00372 |
hsa-miR-1227-3p | −2.28 | 0.00936 |
| hsa-miR-210-5p | −3.19 | 0.00118 |
hsa-miR-1226-3p | −2.27 | 0.02737 |
| hsa-miR-423-5p | −3.13 | 0.00015 | hsa-miR-326 | −2.27 | 0.03136 |
|
hsa-miR-487a-5p | −3.11 | 0.00020 | hsa-miR-1281 | −2.25 | 0.01676 |
|
hsa-miR-1343-3p | −3.07 | 0.00492 | hsa-miR-380-5p | −2.18 | 0.02911 |
|
hsa-miR-133a-3p | −3.07 | 0.00092 | hsa-miR-4272 | −2.18 | 0.03136 |
|
hsa-miR-4787-3p | −3.03 | 0.00219 |
hsa-miR-203a-3p | −2.17 | 0.03985 |
| hsa-miR-320c | −3.02 | 0.00071 | hsa-miR-4516 | −2.10 | 0.03315 |
| hsa-miR-483-5p | −2.99 | 0.03136 | hsa-miR-431-3p | −2.03 | 0.03862 |
| hsa-miR-874-5p | −2.95 | 0.00200 | hsa-miR-4429 | −2.00 | 0.03416 |
| hsa-miR-455-3p | −2.94 | 0.00111 |
hsa-miR-1229-3p | −1.94 | 0.03066 |
| hsa-miR-769-3p | −2.93 | 0.00123 |
|
|
|
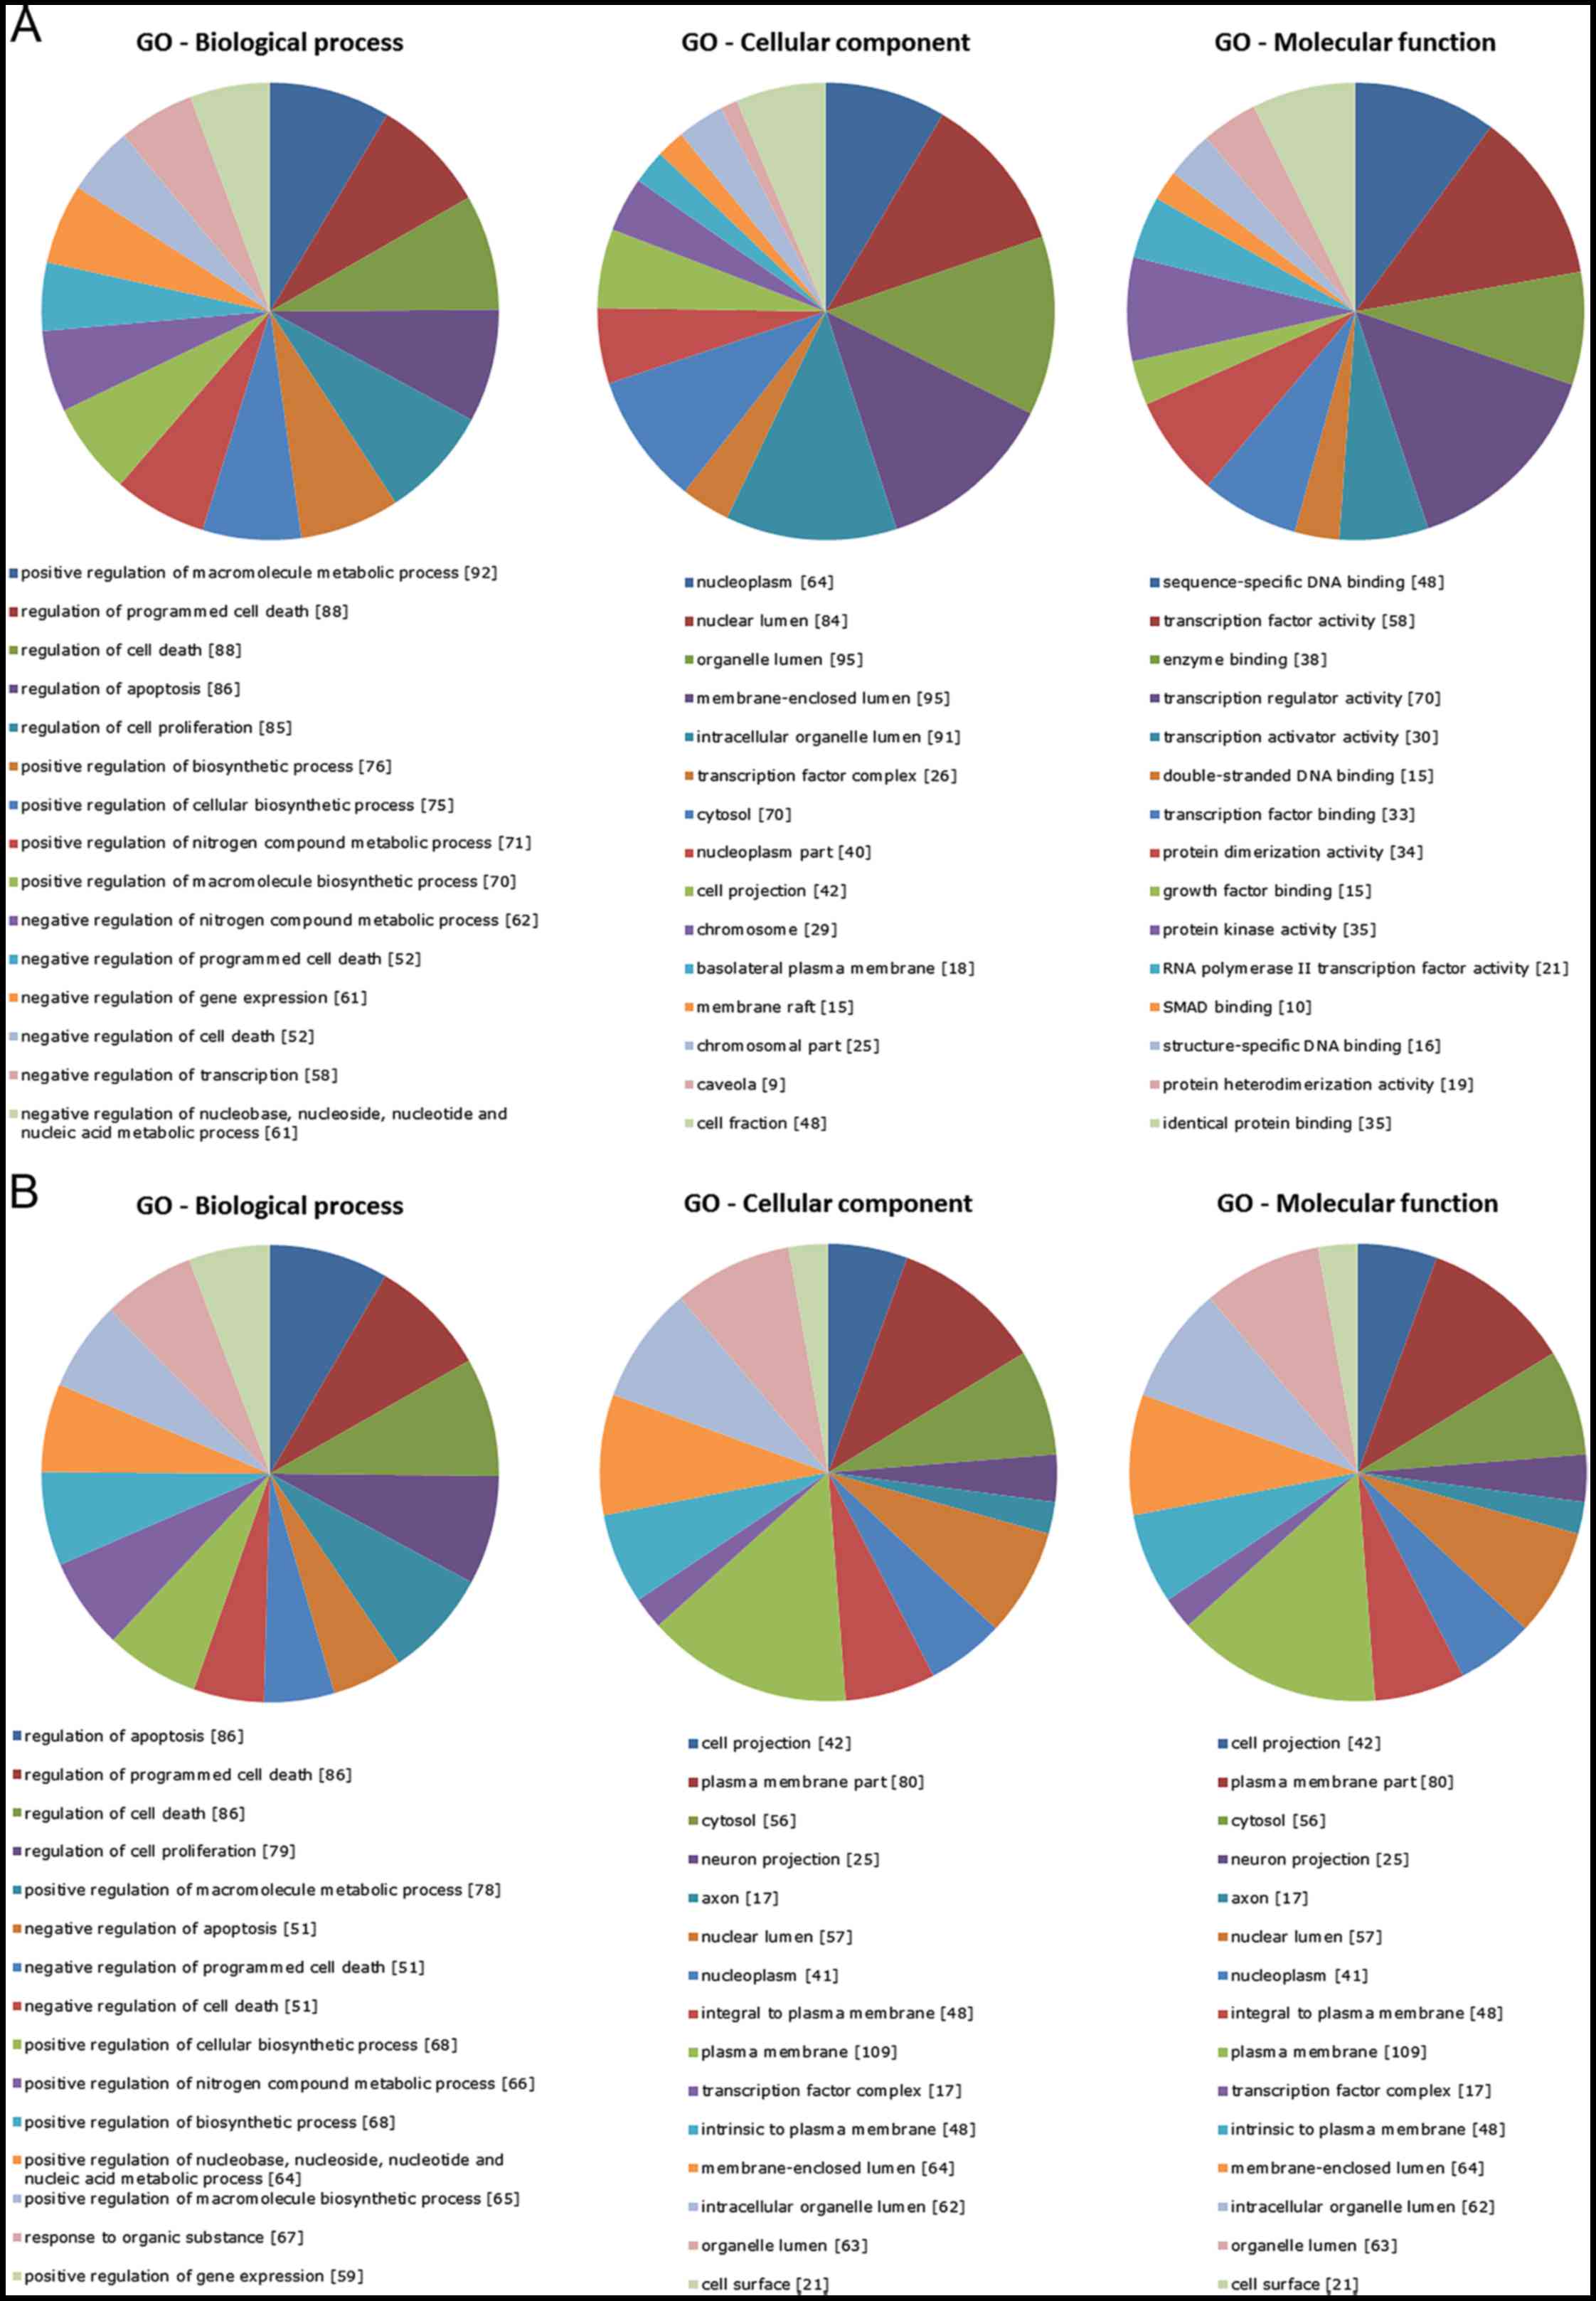
To investigate the biological implications of the
dysregulated miRNAs, we assessed miRNA target genes within the
regulatory network for enrichment in Gene Ontology (GO), one of the
most useful methods for functional annotation and classification of
gene products. GO categories of the targets of the differentially
upregulated and downregulated miRNAs (NB vs. DRG) were organized
into three different functional groups, i.e. Biological process,
Cellular component and Molecular function (Fig. 3), among which a significant
over-representation of transcription factor activity/binding,
protein kinase activity, chromatin modifications, metabolic
processes, cell communication, plasma membrane,
cytoplasm/intracellular organelle part, cell proliferation and
programmed cell death regulation were found. To further explore the
biological pathways potentially affected in NB development, targets
of the differentially upregulated and downregulated miRNAs (NB vs.
DRG) were subjected to KEGG pathway analysis. Several
cancer-related networks, including TGF-β, neurotrophin, MAPK, ErbB,
Toll-like receptor and p53 signalling pathways, were significantly
enriched (Tables III–IV). Indeed, the expression levels of
TGFBR2, SMAD2 and SMAD4, three important components along the TGF-β
cascade, were found to be downregulated in NB cells (48). VEGF, Wnt, JAK-STAT and GnRH pathways
were found among the targets of the underexpressed miRNAs in
accordance with their growth-inhibitory potential on NB (49–51).
Moreover, some biological processes linked to cell cycle, adherents
junction and focal adhesion could have also been altered. KEGG
database interrogation also suggested that many of the miRNA
targets contribute to the development of other human tumours,
including colorectal, pancreatic cancer, melanoma and gliomas.
| Table III.Enriched KEGG pathways of the target
genes of the differentially upregulated miRNAs. |
Table III.
Enriched KEGG pathways of the target
genes of the differentially upregulated miRNAs.
| KEGG pathway | No of genes | FDR |
|---|
| hsa05200:Pathways
in cancer | 70 | 1.92E-29 |
| hsa05212:Pancreatic
cancer | 27 | 1.58E-15 |
| hsa05222:Small cell
lung cancer | 28 | 1.05E-14 |
| hsa05215:Prostate
cancer | 28 | 5.60E-14 |
| hsa05210:Colorectal
cancer | 26 | 1.51E-12 |
|
hsa05218:Melanoma | 23 | 3.46E-11 |
| hsa05220:Chronic
myeloid leukaemia | 23 | 1.24E-10 |
|
hsa05214:Glioma | 20 | 3.72E-09 |
| hsa04110:Cell
cycle | 27 | 4.45E-09 |
| hsa04010:MAPK
signalling pathway | 39 | 9.24E-09 |
| hsa04510:Focal
adhesion | 33 | 2.52E-08 |
|
hsa04210:Apoptosis | 21 | 2.36E-07 |
| hsa04115:p53
signalling pathway | 18 | 1.42E-06 |
| hsa05211:Renal cell
carcinoma | 18 | 2.31E-06 |
| hsa05221:Acute
myeloid leukaemia | 16 | 8.40E-06 |
| hsa04620:Toll-like
receptor signalling pathway | 20 | 2.42E-05 |
| hsa05223:Non-small
cell lung cancer | 15 | 2.62E-05 |
| hsa05219:Bladder
cancer | 13 | 8.39E-05 |
|
hsa05213:Endometrial cancer | 14 | 1.36E-04 |
|
hsa04722:Neurotrophin signalling
pathway | 21 | 1.51E-04 |
| hsa04012:ErbB
signalling pathway | 16 | 0.002529 |
| hsa04520:Adherens
junction | 15 | 0.002890 |
| hsa04350:TGF-β
signalling pathway | 15 | 0.012845 |
| hsa04930:Type II
diabetes mellitus | 11 | 0.019442 |
| hsa04062:Chemokine
signalling pathway | 22 | 0.030059 |
| Table IV.Enriched KEGG pathways of the target
genes of the differentially downregulated miRNAs. |
Table IV.
Enriched KEGG pathways of the target
genes of the differentially downregulated miRNAs.
| KEGG pathway | No. of genes | FDR |
|---|
| hsa05200:Pathways
in cancer | 66 | 4.11E-30 |
| hsa05215:Prostate
cancer | 31 | 3.56E-19 |
| hsa05210:Colorectal
cancer | 29 | 1.40E-17 |
| hsa05212:Pancreatic
cancer | 26 | 6.02E-16 |
| hsa05220:Chronic
myeloid leukaemia | 26 | 1,88E-15 |
|
hsa05218:Melanoma | 24 | 1.33E-13 |
| hsa04520:Adherens
junction | 24 | 7.66E-13 |
| hsa05219:Bladder
cancer | 18 | 1.82E-11 |
|
hsa05214:Glioma | 21 | 1.91E-11 |
|
hsa05213:Endometrial cancer | 19 | 7.55E-11 |
| hsa05223:Non-small
cell lung cancer | 19 | 1.61E-10 |
| hsa05211:Renal cell
carcinoma | 20 | 2.15E-09 |
|
hsa04722:Neurotrophin signalling
pathway | 25 | 6.68E-09 |
| hsa04510:Focal
adhesion | 31 | 1.37E-08 |
| hsa04110:Cell
cycle | 24 | 5.71E-08 |
| hsa05222:Small cell
lung cancer | 20 | 7.21E-08 |
| hsa04370:VEGF
signalling pathway | 18 | 7.50E-07 |
| hsa04012:ErbB
signalling pathway | 19 | 1.13E-06 |
| hsa04310:Wnt
signalling pathway | 24 | 2.90E-06 |
| hsa04010:MAPK
signalling pathway | 31 | 1.62E-05 |
| hsa05216:Thyroid
cancer | 11 | 3.64E-05 |
| hsa04115:p53
signalling pathway | 15 | 9.64E-05 |
| hsa05221:Acute
myeloid leukaemia | 14 | 9.79E-05 |
| hsa04660:T cell
receptor signalling pathway | 18 | 2.45E-04 |
| hsa04662:B cell
receptor signalling pathway | 15 | 3.51E-04 |
| hsa04350:TGF-β
signalling pathway | 16 | 3.89E-04 |
| hsa04360:Axon
guidance | 19 | 6.88E-04 |
|
hsa04320:Dorso-ventral axis formation | 9 | 0.001784 |
|
hsa04914:Progesterone oocyte
maturation | 15 | 0.002008 |
|
hsa04916:Melanogenesis | 15 | 0.011147 |
| hsa04620:Toll-like
receptor signalling pathway | 15 | 0.014125 |
| hsa04630:Jak-STAT
signalling pathway | 18 | 0.039146 |
| hsa04912:GnRH
(gonadotropin-releasing hormone) signalling pathway | 14 | 0.047092 |
Differential expression analysis of
miRNAs in NB with or without MYCN amplification
The miRNA expression profiles of MNA and MNnA
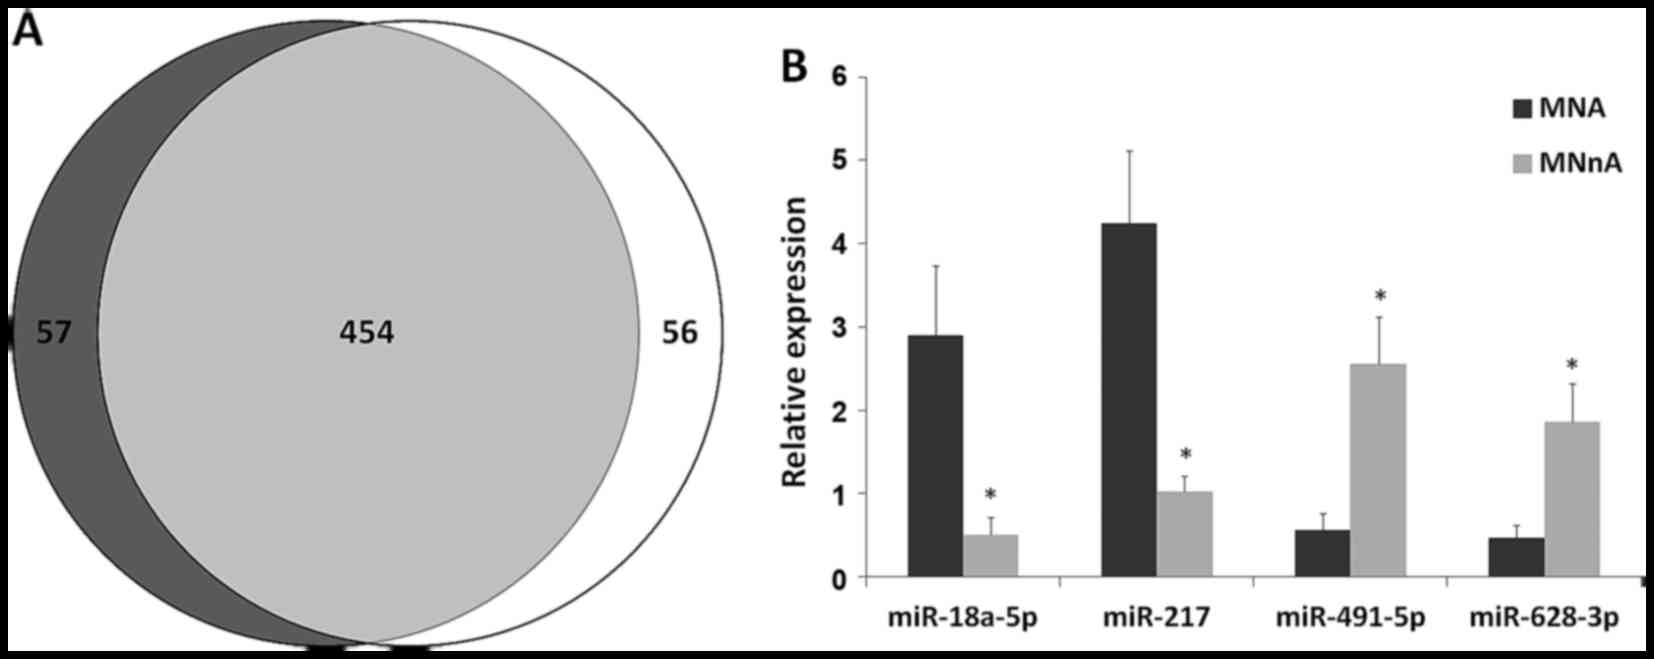
tumours largely overlapped as shown by a Venn diagram (Fig. 4A), suggesting that only a small
number of miRNAs are specific for each subgroup. After removing
poorly expressed miRNAs, 70 molecules were found to be
differentially expressed between MNA and MNnA tumours. Of these, 23
had a P<0.05 after FDR correction: 17 miRNAs were significantly
upregulated in MNA samples, while 6 miRNAs were significantly
downregulated (Table V). The most
homogeneously expressed molecules among different tumours inside
each subgroup were miR-16-2-3p, miR-18a-5p, miR-217, miR-338-5p,
miR-489-3p, miR-491-5p, miR-628-3p, miR-628-5p and miR-3065-3p
(data not shown). Among these, miR-18a-5p, miR-217, miR-491-5p and
miR-628-3p were selected as candidates to validate the miRNA
expression data by qPCR experiments in the 8
deep-sequencing-analysed NB tumours and in 14 additional NB samples
as well as in 4 human NB cell lines (MNA LAN5 and KCNR and MNnA
SH-SY5Y and SK-N-SH). qPCR demonstrated that the expression levels
of the selected dysregulated miRNAs showed strong overlap with the
deep-sequencing findings, thus confirming the overexpression of
miR-18a-5p and miR-217 as well as the downregulation of miR-491-5p
and miR-628-3p in the MNA (Fig. 4B)
in comparison with the MNnA tumours. The same trend was found in
MNA vs. MNnA NB cell lines (data not shown). The differential
expression of a substantial number of miRNAs between favourable and
unfavourable NBs was consistent with previous reports (Table V), reinforcing their fundamental
role in NB development (18,48,52,53,56,62,63,74,76).
In particular, the present study confirms how the majority of the
differentially expressed miRNAs positively correlate with MYCN
amplification, suggesting that miRNA induction might be a general
mechanism caused by MYCN oncogene in high-risk NB tumours.
Additionally, bioinformatic analysis of the promoter regions of the
overexpressed miRNAs identified MYCN-binding sites (38,54) in
5 out of 17 miRNAs (Table V), and
this is consistent with a direct transcriptional regulation of
these molecules by MYCN. Overexpression of miR-17-5p, miR-18a-5p,
miR-20a-5p and miR-92a-3p, belonging to the polycistronic miR-17-92
cluster at 13q31.3, was consistently higher in MNA cell lines
compared to the MNnA tumours as previously reported (55,56)
and in line with the evidence that MYCN directly activates
miR-17-92 expression in NB cell lines (55). Indeed, the miR-17-92 cluster has a
unique promoter control region and encodes for a precursor
transcript that contains six tandem-loop hairpin structures, which
in turn produce the six mature molecules miR-17, miR-18a, miR-19a,
miR-20a, miR-19b-1 and miR-92a-1 (57,58).
These miRNAs may act independently or synergistically to target
multiple mRNAs encoding for proteins implicated in cancer-related
pathways (57,58). Given the miR-17-92 oncogenic role,
inhibition of the clustered oncomiRs by delivering single-stranded
antisense oligonucleotides (59)
may represent a novel and attractive treatment approach for NB
therapy. Regarding this aspect, Fontana et al (60) demonstrated that in vitro and
in vivo treatment of MNA NB cells with a specific antagomiR
against miR-17-5p was able to dramatically reduce proliferation and
to activate massive apoptosis through p21 and BIM over-expression,
respectively. Concerning some downregulated miRNAs in MNA tumours,
our data are in agreement with recently published studies. In
particular, miR-491-5p was found to be significantly downregulated
at NB metastatic sites compared with primary tumours by Guo et
al (61), and miR-628 was
confirmed to be moderately expressed in favourable NBs and nearly
absent in unfavourable cases, thus, supporting its
tumour-suppressive function and its potential as a good candidate
in discriminating between these two NB subsets (38,62,63).
Indeed, among the downregulated miRNAs, miR-628-3p has one pairing
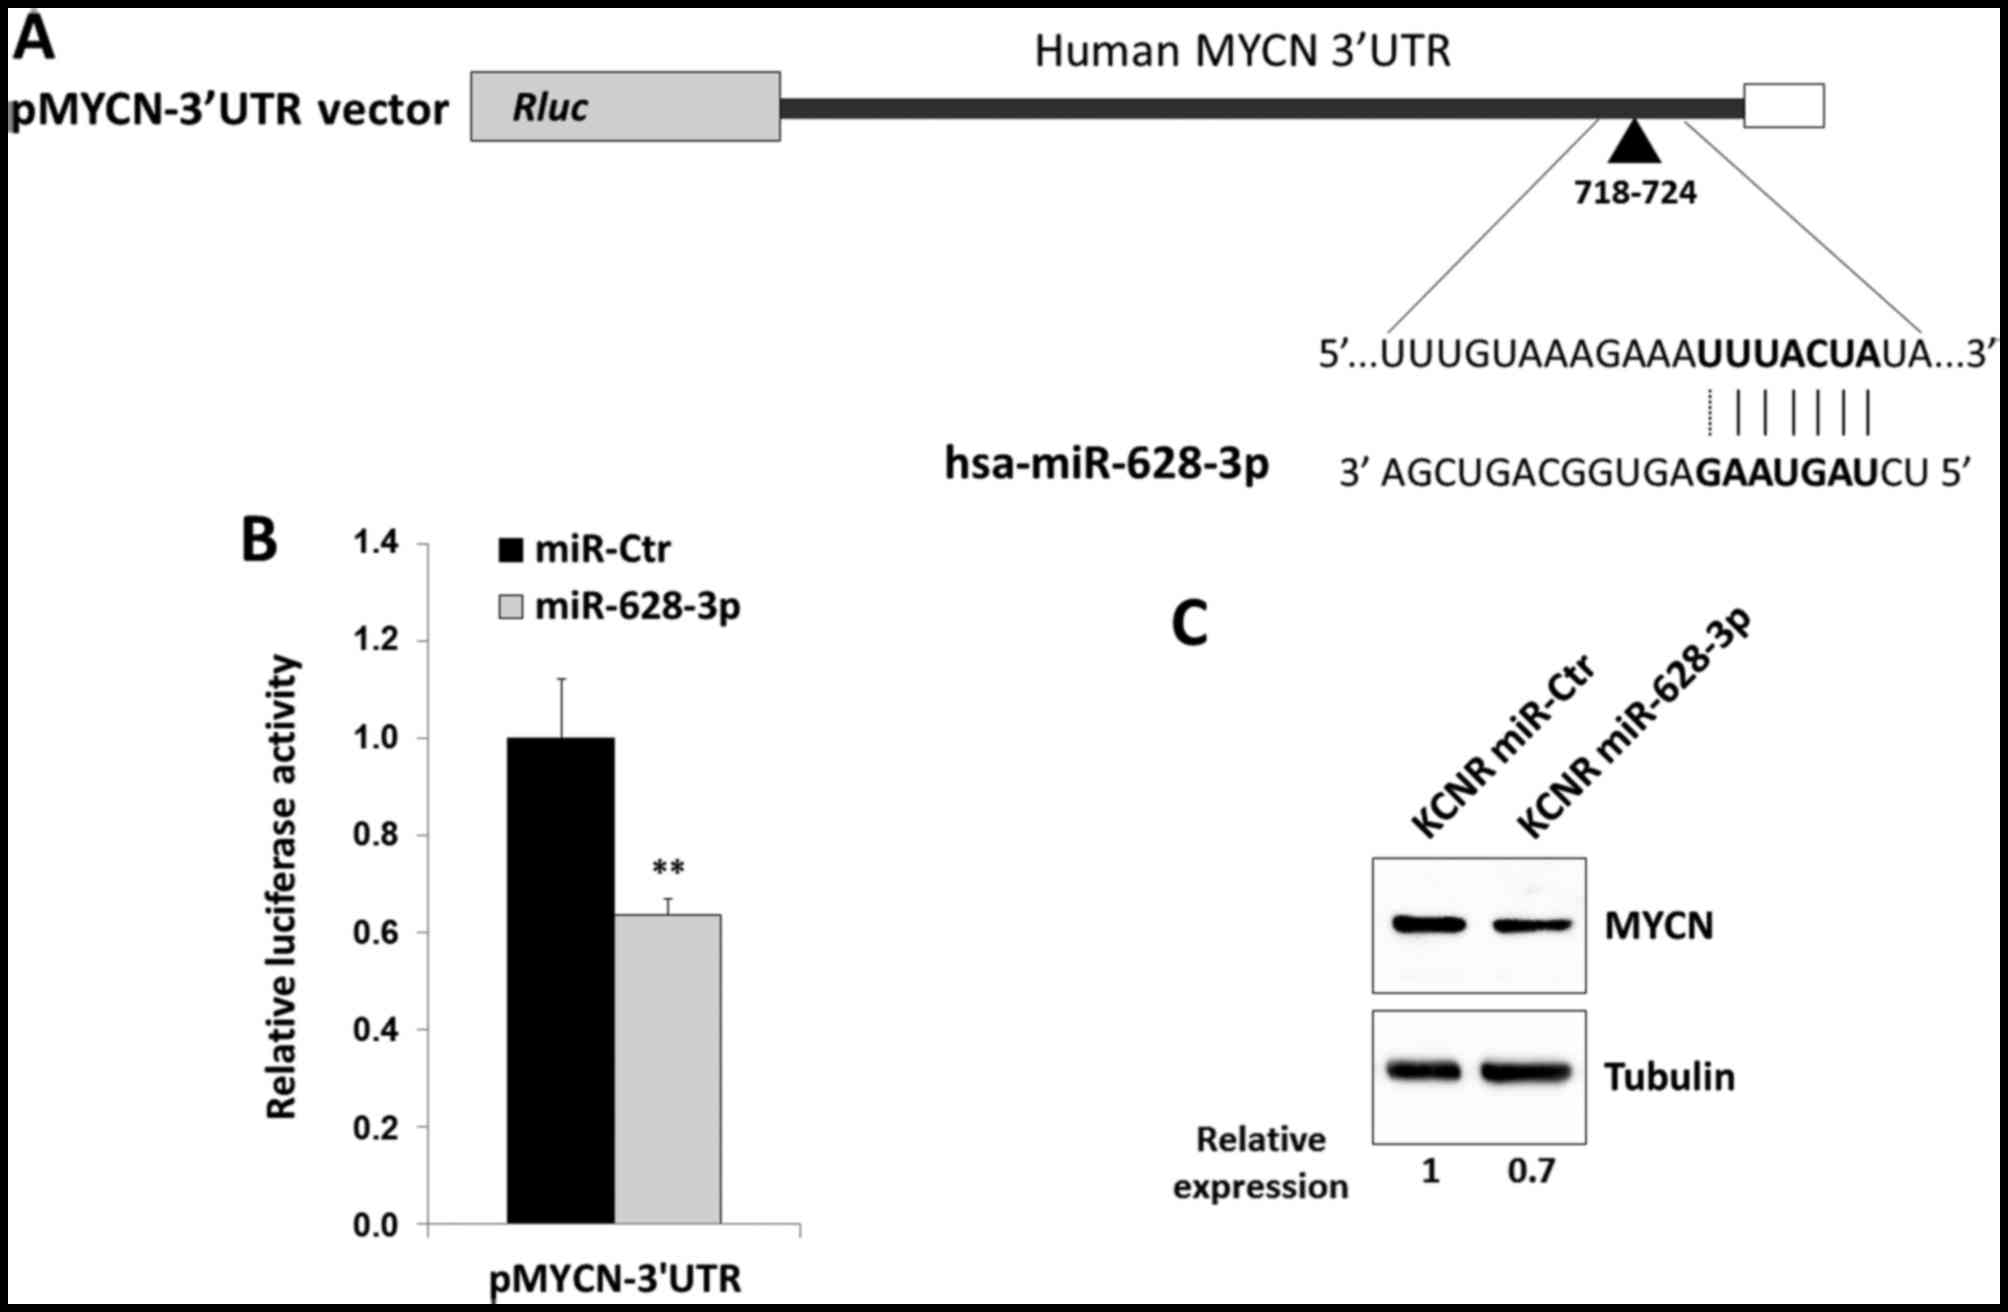
region at position 718–724 of the MYCN 3 untranslated region (3UTR;
Fig. 5A), as predicted by Miranda
software (best score ≥120). To verify whether miR-628-3p was able
to directly target MYCN mRNA, HEK293T cells were co-transfected
either with a reporter construct containing 880 base pairs of the
human MYCN 3UTR downstream of the Renilla luciferase open
reading frame (Fig. 5A) with either
miR-628-3p mimic or negative control miRNA (miR-Ctr).
Overexpression of miR-628-3p upon transfection was confirmed by
qPCR assays (data not shown). Luciferase activity was specifically
reduced to ~35% (P<0.01) in cells transfected with miR-628-3p
compared to the control group (Fig.
5B), thus indicating that miR-628-3p functionally interacts
with the MYCN 3′UTR and decreases the expression of the
corresponding protein. Indeed, miR-628-3p mimics transiently
introduced into KCNR cells, an in vitro model of MNA NB,
were able to slightly reduce endogenous MYCN protein levels as
compared with miR-Ctr positive samples (Fig. 5C), suggesting a functional role of
miR-628-3p in MYCN gene expression. Finally, our analysis
identified a set of differentially expressed miRNAs, such as
miR-130b-5p, miR-217, miR-3065-3p and miR-3182, known as oncomiRs
in several other tumours (64–67),
but whose role in NB has not yet been investigated (Table V). Notably, miR-130b and miR-301b
belong to the same genomic cluster located on chromosome 22 and are
significantly upregulated in triple-negative (lacking the
expression of the oestrogen receptor, the progesterone receptor and
the human epidermal growth factor receptor 2) breast cancer
(64), having a direct role in
cyclin G2 regulation. miR-338 and miR-3065 belong to the
brain-specific genomic cluster located on chromosome 17 in an
intronic region within the apoptosis-associated tyrosine kinase
(AATK) gene, thus having a tumour-suppressor function (68). Accordingly, it was described that
miR-338-3p strand has the potential to inhibit cell proliferation,
cell migration and invasion in human NB cells by affecting the
PTEN/Akt pathway (69). miR-3065
was recently mapped to the antisense strand of miR-338 (70) and regarded as a novel promising
candidate contributing to clear cell renal cell development
(71). Furthermore, our miRNA
promoter in silico analysis showed that downregulated
miR-338-5p, miR-489-3p, miR-628-3p and miR-3065 harbour putative
MYCN binding motifs in their regulatory regions (Table V), suggesting an inverse correlation
and possible feedback regulatory circuits between MYCN
amplification and the reduced levels of these miRNAs. To this
concern, recent studies have supported the dual role of MYCN in
controlling gene expression, being not only a transcriptional
activator but also a mediator of transcriptional silencing by
facilitating DNA methylation (54,72,73).
Thus, it will be interesting to characterise the molecular
mechanisms that regulate miRNA expression.
| Table V.Differentially expressed miRNAs in
MNA vs. MNnA NB tumours. |
Table V.
Differentially expressed miRNAs in
MNA vs. MNnA NB tumours.
| miRNA |
log2FC | FDR | Status | Refs. | MYCN-binding
motif |
|---|
| miR-517b-3p |
7.40 | 0.01263 | Upregulated | Novel in NB | 0 |
| miR-183-5p |
4.07 | 0.01311 | Upregulated | (52) | 0 |
| miR-182-5p |
3.93 | 0.01263 | Upregulated | (53) | 0 |
| miR-451a |
3.45 | 0.01851 | Upregulated | (61) | 0 |
| miR-217 |
3.29 | 0.00962 | Upregulated | Novel in NB | 0 |
| miR-18b-5p |
3.18 | 0.01137 | Upregulated | (18) | 2 |
| miR-3182 |
2.85 | 0.02742 | Upregulated | Novel in NB | 0 |
| miR-105-5p |
2.84 | 0.03751 | Upregulated | (62) | 0 |
| miR-20a-5p |
2.80 | 0.01263 | Upregulated | (18,48,62,63,74) | 1 |
| miR-130b-3p |
2.79 | 0.01263 | Upregulated | (61) | 0 |
| miR-935 |
2.69 | 0.02807 | Upregulated | (62) | 0 |
| miR-18a-5p |
2.64 | 0.01263 | Upregulated | (56,62,63,74) | 1 |
| miR-130b-5p |
2.64 | 0.01440 | Upregulated | Novel in NB | 0 |
| miR-17-5p |
2.57 | 0.01851 | Upregulated | (18,48,55,62) | 1 |
| miR-301b-3p |
2.44 | 0.03073 | Upregulated | Novel in NB | 0 |
| miR-16-2-3p |
2.38 | 0.01263 | Upregulated | Novel in NB | 0 |
| miR-92a-3p |
2.12 | 0.04003 | Upregulated | (18,55,62,63,76) | 1 |
| miR-489-3p | −3.25 | 0.01263 | Downregulated | Novel in NB | 2 |
| miR-628-5p | −2.53 | 0.01137 | Downregulated | (62,63) | 0 |
| miR-338-5p | −2.40 | 0.01263 | Downregulated | Novel in NB | 1 |
| miR-491-5p | −2.23 | 0.01263 | Downregulated | (76) | 0 |
| miR-628-3p | −2.16 | 0.01851 | Downregulated | (18,48,62,63) | 1 |
| miR-3065-3p | −2.10 | 0.03073 | Downregulated | Novel in NB | 1 |
miRNA target prediction and functional
annotation in NBs with or without MYCN amplification
Using the miRTarBase web tool, we found a relevant
number of cancer-related genes, such as PTEN, KRAS and EZH2 among
the validated target genes for the differentially expressed miRNAs.
Indeed, since the availability of experimentally validated targets
in miRTarBase was variable and possibly biased towards the more
extensively investigated miRNAs, we decided to extend our analysis
and perform a de novo target prediction using the miRanda
software. In particular, we considered miRNAs with a homogeneous
expression level between tumours inside each group: upregulated
miR-16-2-3p, miR-18a-5p, miR-217 and downregulated miR-338-5p,
miR-489-3p, miR-491-5p, miR-628-3p, miR-628-5p and miR-3065-3p. The
3UTR sequences of all human transcripts present in Ensembl were
screened for the identification of putative microRNA binding sites:
a total of 867 putative target genes were identified for the
upregulated miRNAs, while 2148 target genes were identified as
potentially modulated by the downregulated miRNAs. The predicted
targets were grouped into functional modules on the basis of their
functional interactions, and for each module an enrichment analysis
was performed with the Cytoscape Reactome FI plugin. Fig. 6 shows the main functional module
putatively regulated by miR-16-2-3p, miR-18a-5p and miR-217, which
are overexpressed in MNA tumours. The different interaction
networks are enriched in gene products implicated in cancer-related
biological processes, such as DNA-repair and apoptosis, as well as
axon guidance, adenylate cyclase activity and the FGFR signalling
pathway. Target genes associated to each specific overexpressed
miRNA are reported in Table VI.
The GO categories associated with the predicted miRNA targets
showed significant overlap with biological processes that are
over-represented in the MYCN target genes (38), confirming the existence in NB of a
miRNA:MYCN related network able to broadly perturb gene expression
(38,74,75).
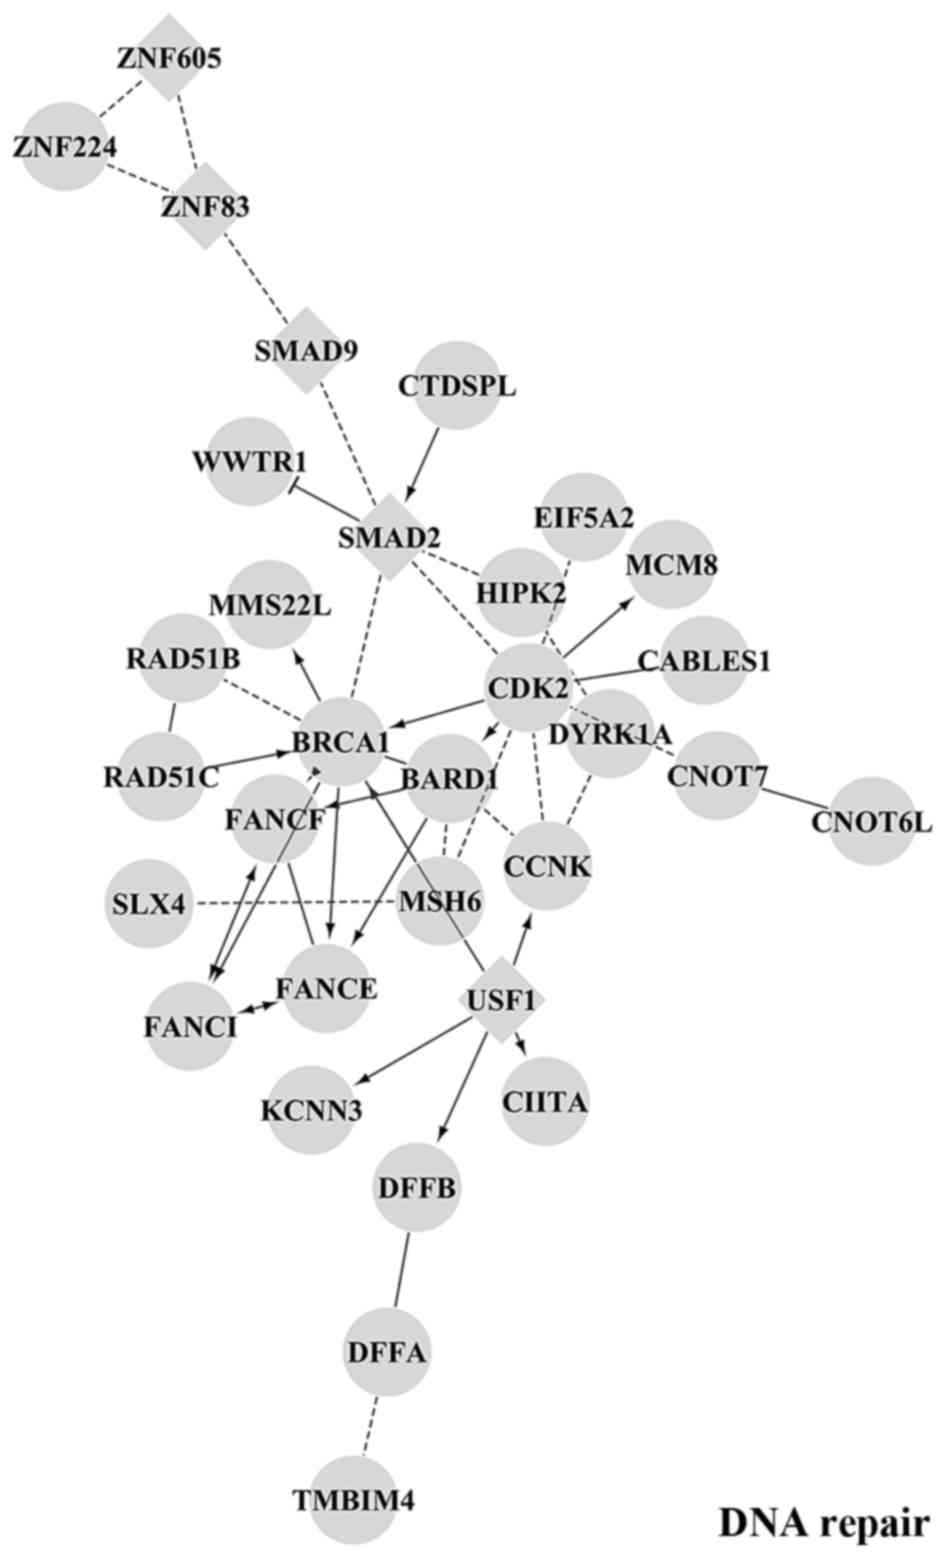
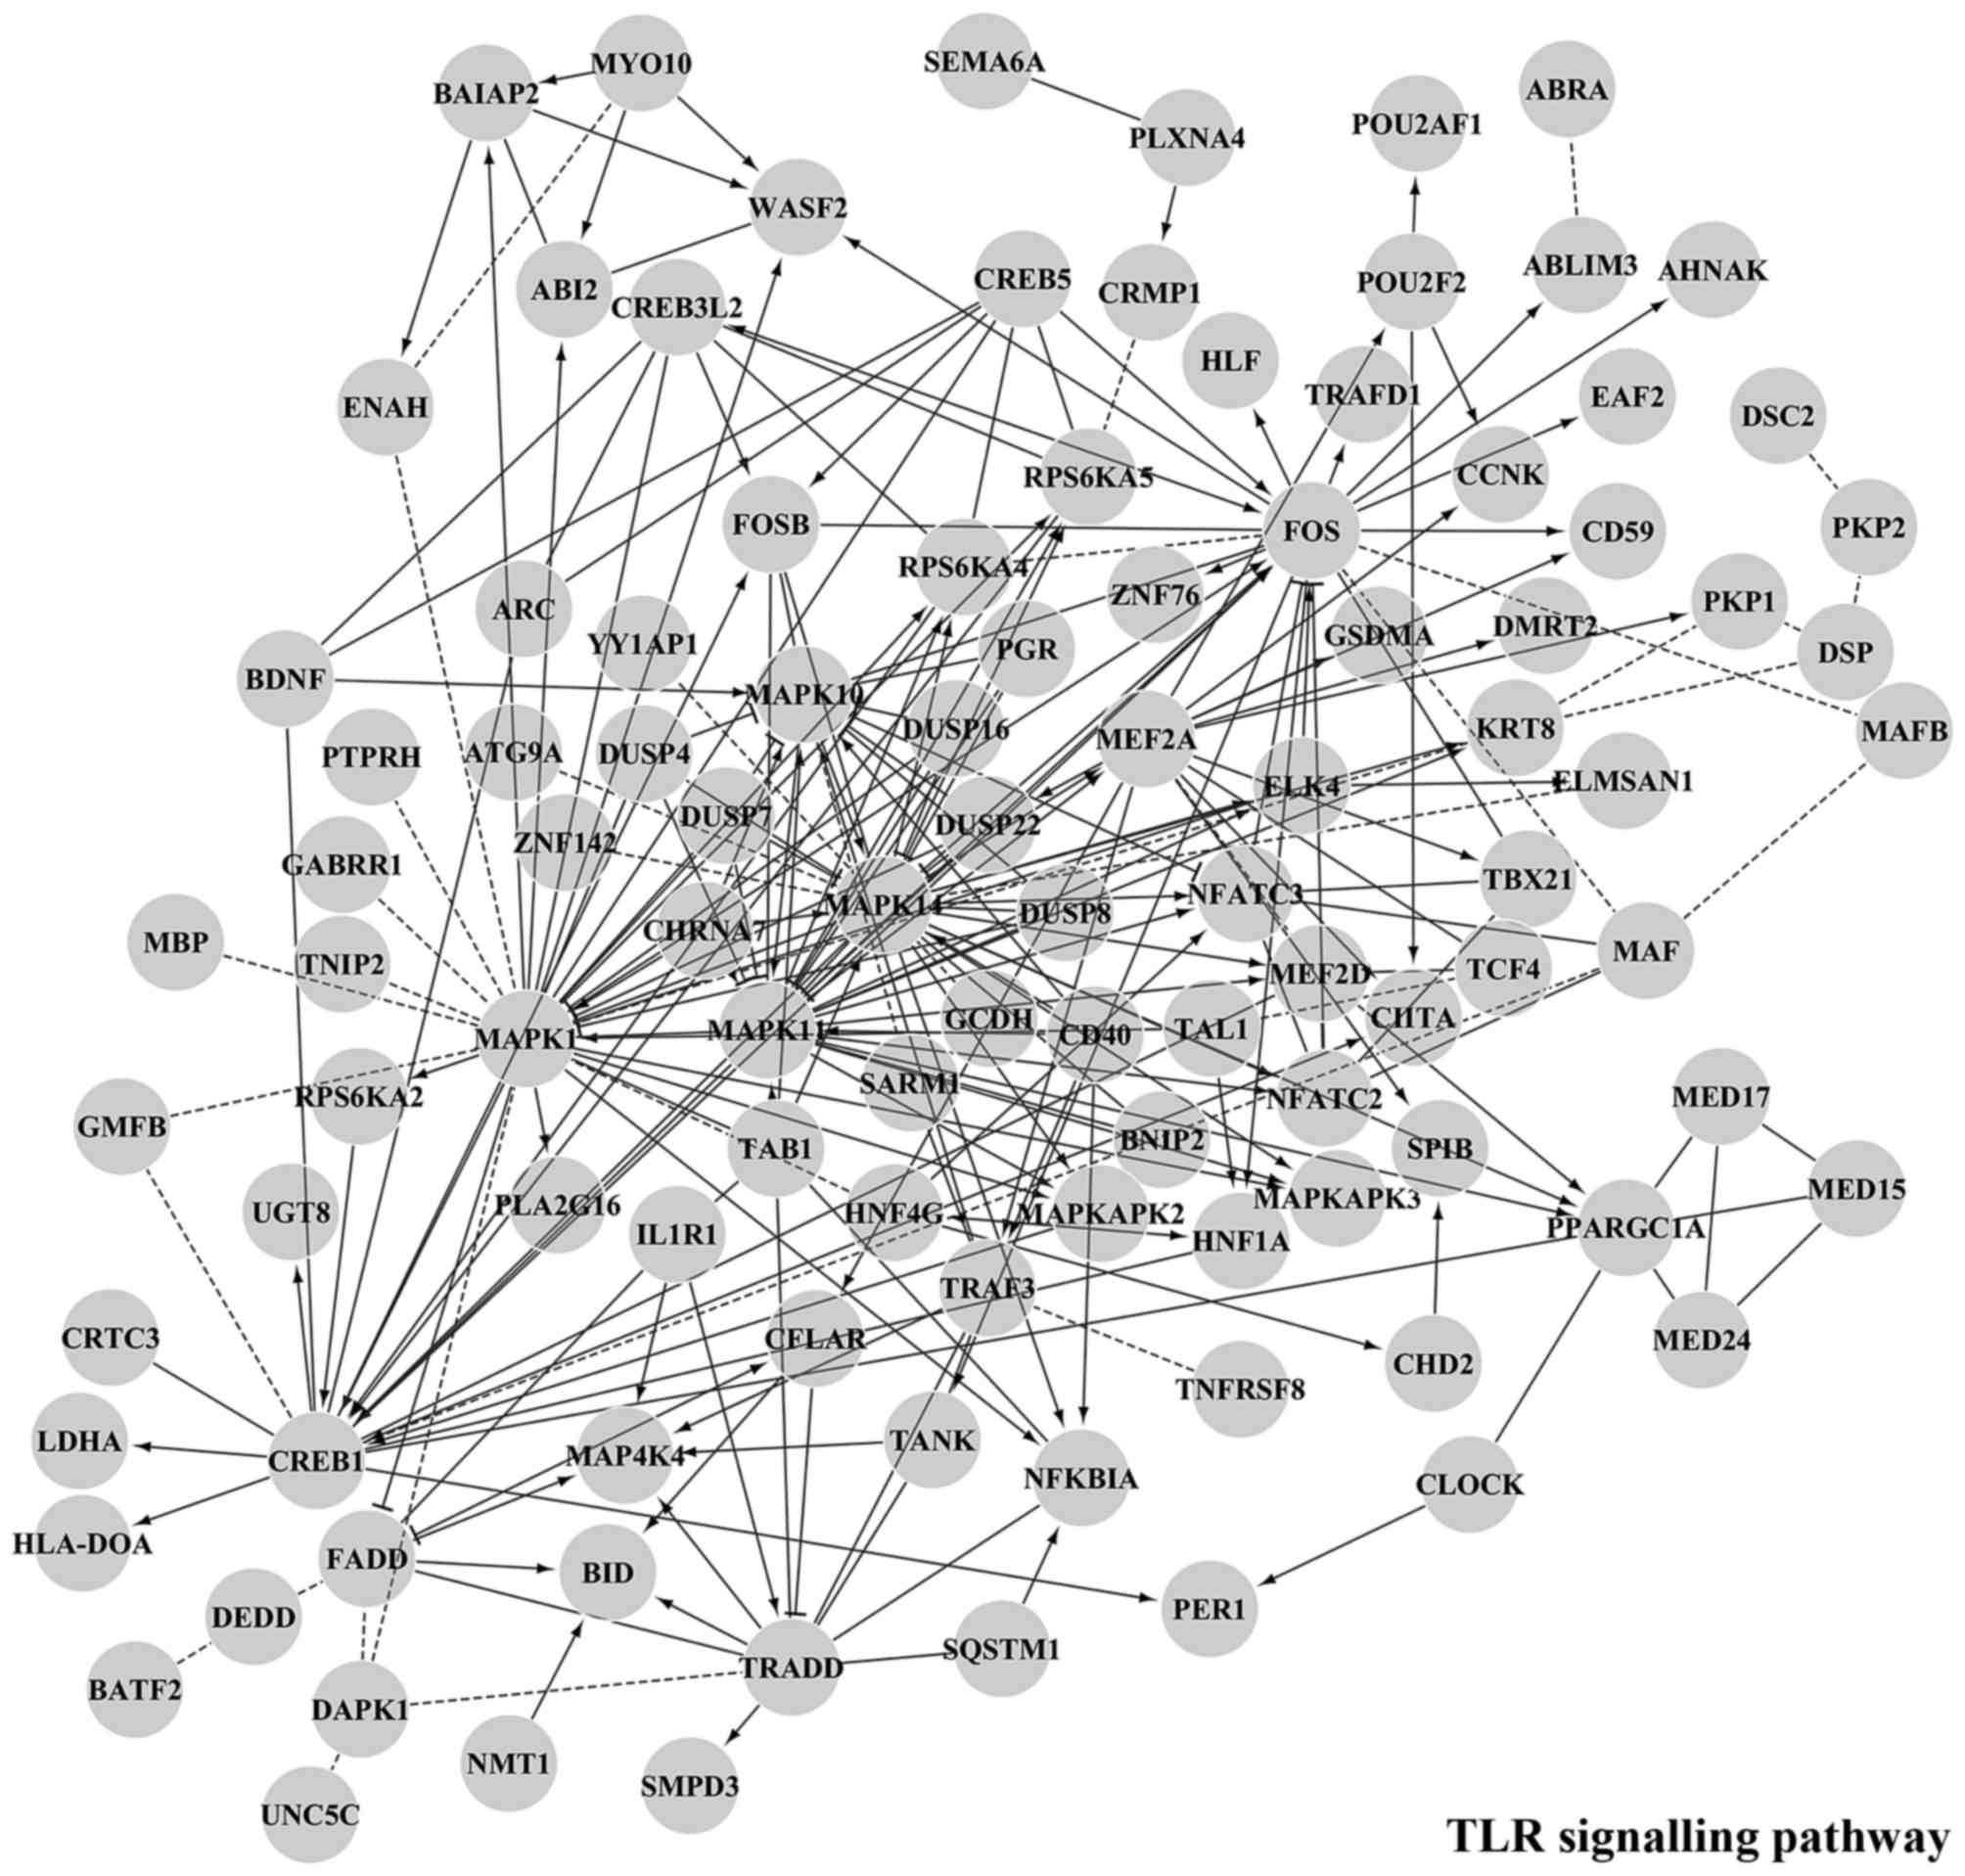
Fig. 7 shows the main functional
module putatively regulated by miR-338-5p, miR-489-3p, miR-491-5p,
miR-628-3p, miR-628-5p and miR-3065-3p which are underexpressed in
MNA samples. The enriched interactions consist of proteins involved
in synaptic transmission as well as TLR and EGFR signalling
pathways. Target genes associated to each specific downregulated
miRNA are reported in Table VII.
The complete list of network modules and GO BP - pathway enrichment
is included in the Table VIII.
Our results suggest that the selected differentially expressed
miRNAs are relevant in NB biology and could be of potential
importance to stratify high-risk and low-risk tumours. Further
investigations will be necessary to validate the specific target
genes and to assess the downstream effects.
| Table VI.Predicted targets of overexpressed
miRNAs, involved in DNA repair, apoptotic signalling pathway, FGF
receptor signalling pathway, axon guidance and negative regulation
of adenylate cyclase activity. |
Table VI.
Predicted targets of overexpressed
miRNAs, involved in DNA repair, apoptotic signalling pathway, FGF
receptor signalling pathway, axon guidance and negative regulation
of adenylate cyclase activity.
| miRNA | Target genes |
|---|
| miR-16-2-3p | AATK, ATP2A2,
BCL2, BNIP2, BRCA1, CASP10, CNOT7, FANCE, FANCF, FRS2, GALR1,
GNAI3, IL16, KCNN3, KLRD1, MAPK8, MDM2, PRKX, PTGER3, RAD51C,
RICTOR, RPS6KA5, SCN7A, SLC8A1, SMAD2, SOS1, SRGAP1, STX7, WASF3,
ZNF83 |
| miR-18a-5p | ACAP2, ACTR3,
ADRBK2, ANGPT2, ATP2A2, BNIP2, CABLES1, CACNA2D2, CACNB3, CASP10,
CASP2, CCNK, CCR2, CD47, CD59, CDK2, CDK5R1, CHRM2, CIITA, CNOT7,
CTDSPL, DAB1, DFFA, DFFB, EIF5A2, EPHA5, ESR1, FANCI, FRS2, FZD4,
GNAI3, GNB5, GRM1, GRM4, HEBP1, HIPK2, HOMER2, INSR, ITGA2, KCNN3,
KIF3B, KIF5A, KLRD1, LCK, MAPK8, MAVS, MDM2, MMS22L, MYLK, NEO1,
NEURL1B, NOTCH2, NTRK2, OPRL1, OTUD7B, PCSK2, PDGFRB, PRKX, RAD51B,
RAD51C, RAP1A, RPS6KA5, SH3KBP1, SLC6A2, SMAD2, SOS1, SRGAP1,
TNFSF12, TUBB3, WASF3, WHSC1, WNT9A, WWTR1 |
| miR-217 | ACAP2, ADAM12,
ADRBK2, ARHGEF7, BARD1, BCL2, BNIP2, BTC, CD59, CFLAR, CIITA,
CNOT6L, CNOT7, COL21A1, CREB5, DAB1, DMRTB1, DOCK4, DYNLL2, DYRK1A,
EPHA5, ERC1, FGF16, FZD4, GALR1, GFRA1, GNAI3, HOMER2, HOXD8,
HSD17B2, IL16, ITGA2, ITGA9, KCNN3, MAP1B, MAP4K4, MAVS, MCM8,
MDM2, MMS22L, MSH6, MYLK, NOTCH2, NTRK2, OSBPL1A, OTUD7B, PDCD1,
PFDN1, PRKCA, PRKX, RASGRP3, RGS6, RICTOR, ROBO2, RPS6KA5, SCN7A,
SIPA1L2, SLC8A1, SLX4, SMAD2, SMAD9, SOS1, STX1A, STX7, STXBP5, TG,
TMBIM4, TNFSF10, USF1, WHSC1, ZNF224, ZNF605 |
| Table VII.Predicted targets of underexpressed
miRNAs, involved in TLR signalling pathway, EGFR signalling pathway
and synaptic transmission. |
Table VII.
Predicted targets of underexpressed
miRNAs, involved in TLR signalling pathway, EGFR signalling pathway
and synaptic transmission.
| miRNA | Target genes |
|---|
| miR-338-5p | BNIP2, C5AR1,
CD28, CLOCK, CNR1, CREB1, CX3CR1, DGKI, DSC2, ELK4, ENAH, EPN1,
GNB5, GRIN2B, IMPAD1, INPP4B, INSR, KCNJ15, KCNJ6, KLRD1, KRAS,
LEPR, MAFB, MAP3K2, MBP, MYLK, NFAT5, NPFFR1, NTRK3, PAG1, PEAK1,
PGR, PKN2, PPARGC1A, PRKCB, RPS6KA5, SNTB1, SSTR2, UGT8,
UNC5C |
| miR-489-3p | ABI2, ABLIM3,
ADCY6, ATP6AP1, CACNA1B, CACNA1D, CACNG8, CDS2, CFLAR, CLOCK,
CREB1, CREB5, CRKL, DBNL, DGKI, DUSP4, ELK4, EPN1, GNA11, GNAI1,
GNB5, GRB10, GRIA4, GRIK2, GRIN2B, HNF4G, IGF1R, KCNJ15, KCNJ6,
KLRD1, MAP2K1, MAP3K2, MAPK1, MAPK14, MBP, MEF2A, MYLK, MYO10,
NFAT5, NFKBIA, NTRK3, PAK3, PAQR5, PDE3A, PHLPP2, PIK3C3, PKP1,
PLXNA4, PPP2R2C, PTGFR, PTPN23, RALGAPA2, RAPGEF3, RASGRF1,
RPS6KA5, SCN4B, SEMA6A, SHC4, SIRPA, SNX17, SSTR2, TANK, TNK1,
UNC5C |
| miR-491-5p | ADCY1, ADCY5,
AKT2, BATF2, CACNA1C, CACNA2D1, CAMK2B, CCNK, CDS2, CFLAR, CREB1,
CREB3L2, CRKL, CRTC2, CX3CR1, DBNL, DEDD, DGKG, DISC1, DOCK5, DSC2,
DUSP4, DUSP7, DUSP8, EFS, ELMSAN1, EPN1, EPS15L1, FGFR3, FOSB,
GAB3, GABBR1, GABRR1, GALR1, GLP2R, GNA11, GNAO1, GNG7, GPR132,
GRIK4, HLA-A, HNF1A, IL16, INPP4B, INPP5E, IQGAP1, KCNJ12, KRAS,
MAPK1, MBP, MED15, MED17, MED24, MEF2D, MYLK, NMT1, NTRK3, PAG1,
PAQR5, PEAK1, PGR, PI4K2A, PLXNA4, POU2F2, PRKCB, PTPN23, RALGAPA2,
RAPGEF3, RASD1, RGS11, RGS19, RIN3, RORC, RPS6KA2, RPS6KA5, RUSC1,
S1PR4, SARM1, SEMA6A, SH3GL1, SIRPA, SNX17, SPIB, SQSTM1, SSTR2,
SSTR5, STAT6, TRAF3, TSHR, VIPR1, ZNF76 |
| miR-628-3p | ABI2, ABRA,
CACNA2D1, CHRNA7, CREB3L2, CXCL12, CXCR2, DGKI, DSC2, DSP, DUSP16,
ENAH, EPS15L1, GRIA3, GRIK4, HLF, IGF1R, IMPAD1, IRS1, KCNJ15,
KCNJ6, KLRD1, KRAS, MCHR2, PAK3, PEAK1, PGR, PIAS2, PLA2G16, PRKCB,
PTEN, RET, RPS6KA5, SARM1, SH3BP5 |
| miR-628-5p | ABI2, ATP6AP1,
CACNA1C, CALM2, CAMK2G, CD72, CFLAR, CHRNA7, CREB1, DGKZ, DOCK5,
DSC2, EDN1, ENAH, FSHB, GMFB, HNF4G, IGF1R, IL16, IL1R1, IL4R,
INPP4A, IQGAP1, KCNJ6, MAPK1, MED24, MYO18Av NTRK3, PAG1, PAK3,
PCCB, PEAK1, PGR, PPP1R3D, RALGAPA2, RET, SHC4, SLC23A1, TCF4,
TRAF3, VLDLR, WNT2B, YY1AP1 |
| miR-3065-3p | ABI2, AHNAK,
ARC, ATG9A, BAIAP2, BATF2, BDNF, BID, CD40, CD59, CHD2, CHRNA7,
CIITA, CLOCK, CREB1, CREB5, CRMP1, CRTC3, DAPK1, ABI2, AHNAK, ARC,
ATG9A, BAIAP2, BATF2, BDNF, BID, CD40, CD59, CHD2, CHRNA7, CIITA,
CLOCK, CREB1, CREB5, CRMP1, CRTC3, DAPK1, DMRT2, DSC2, DUSP22,
EAF2, ELK4, ELMSAN1, ENAH, FADD, FOS, FOSB, GABRR1, GCDH, GSDMA,
HLA-DOA, HLF, HNF1A, IL1R1, KRT8, LDHA, MAF, MAFB, MAP4K4, MAPK10,
MAPK11, MAPKAPK2, MAPKAPK3, MBP, MED15, MED24, MEF2D, NFATC2,
NFATC3, NFKBIA, PER1, PKP1, PKP2, PLXNA4, POU2AF1, POU2F2, PTPRH,
RPS6KA4, RPS6KA5, SARM1, SMPD3, TAB1, TAL1, TBX21, TNFRSF8, TNIP2,
TRADD, TRAF3, TRAFD1, WASF2, ZNF142 |
| Table VIII.Main modules involved in the
functional interaction network built with Cytoscape from the
predicted target genes of the selected microRNAs. |
Table VIII.
Main modules involved in the
functional interaction network built with Cytoscape from the
predicted target genes of the selected microRNAs.
| Enriched term | DNA repair | FGF signalling
pathway | Apoptotic
signalling pathway | Axon guidance | Negative regulation
of adenylate cyclase activity |
|---|
| Number of target
genes annotated with this term | 10 | 5 | 5 | 6 | 4 |
| P-value | 0 | 0 | 0 | 0 | 0 |
| FDR | <1.000e-03 | 1.90E+01 | 1.00E+00 | 1.30E+01 | <1.000e-03 |
| Gene list | RAD51C | BTC | CFLAR | ITGA2 | PRKCA |
|
| RAD51B | FGF16 | TNFSF12 | CACNB3 | GNAI3 |
|
| SLX4 | FRS2 | CASP10 | NEO1 | GALR1 |
|
| FANCI | LCK | TNFSF10 | RPS6KA5 | CCR2 |
|
| FANCE | PDGFRB | CASP2 | ROBO2 |
|
|
| FANCF |
|
| SRGAP1 |
|
|
| MSH6 |
|
|
|
|
|
| CDK2 |
|
|
|
|
|
| BRCA1 |
|
|
|
|
|
| BARD1 |
|
|
|
|
|
| Enriched term | TLR signalling
pathway | EGFR signalling
pathway | Synaptic
transmission |
|
| Number of target
genes annotated with this term | 18 | 13 | 27 |
| P-value | 0 | 0 | 0 |
| FDR | <2.000e-04 | <1.000e-03 | <1.000e-03 |
| Gene list | CREB1 | BCAR1 | ADCY1 |
|
| DUSP4 | CD28 | ADCY6 |
|
| DUSP7 | EPN1 | ADCY7 |
|
| FADD | EPS15L1 | CACNA1B |
|
| FOS | FGFR3 | CACNA1C |
|
| MAPK1 | IRS1 | CACNA1E |
|
| MAPK10 | KRAS | CACNG8 |
|
| MAPK11 | MAP2K1 | CAMK2B |
|
| MAPK14 | PAG1 | CAMK2G |
|
| MAPKAPK2 | PHLPP2 | GABBR1 |
|
| MAPKAPK3 | PLCG1 | GJD2 |
|
| MEF2A | PTEN | GNAI1 |
|
| NFKBIA | TRIB3 | GNG7 |
|
| RPS6KA2 |
| GRIA3 |
|
| RPS6KA5 |
| GRIA4 |
|
| SARM1 |
| GRIK2 |
|
| TAB1 |
| GRIK4 |
|
| TRAF3 |
| GRIN1 |
|
|
|
| GRIN2B |
|
|
|
| GRM4 |
|
|
|
| KCNJ12 |
|
|
|
| KCNJ15 |
|
|
|
| KCNJ6 |
|
|
|
| LRP6 |
|
|
|
| MTNR1B |
|
|
|
| PRKCB |
|
|
|
| VIRP1 |
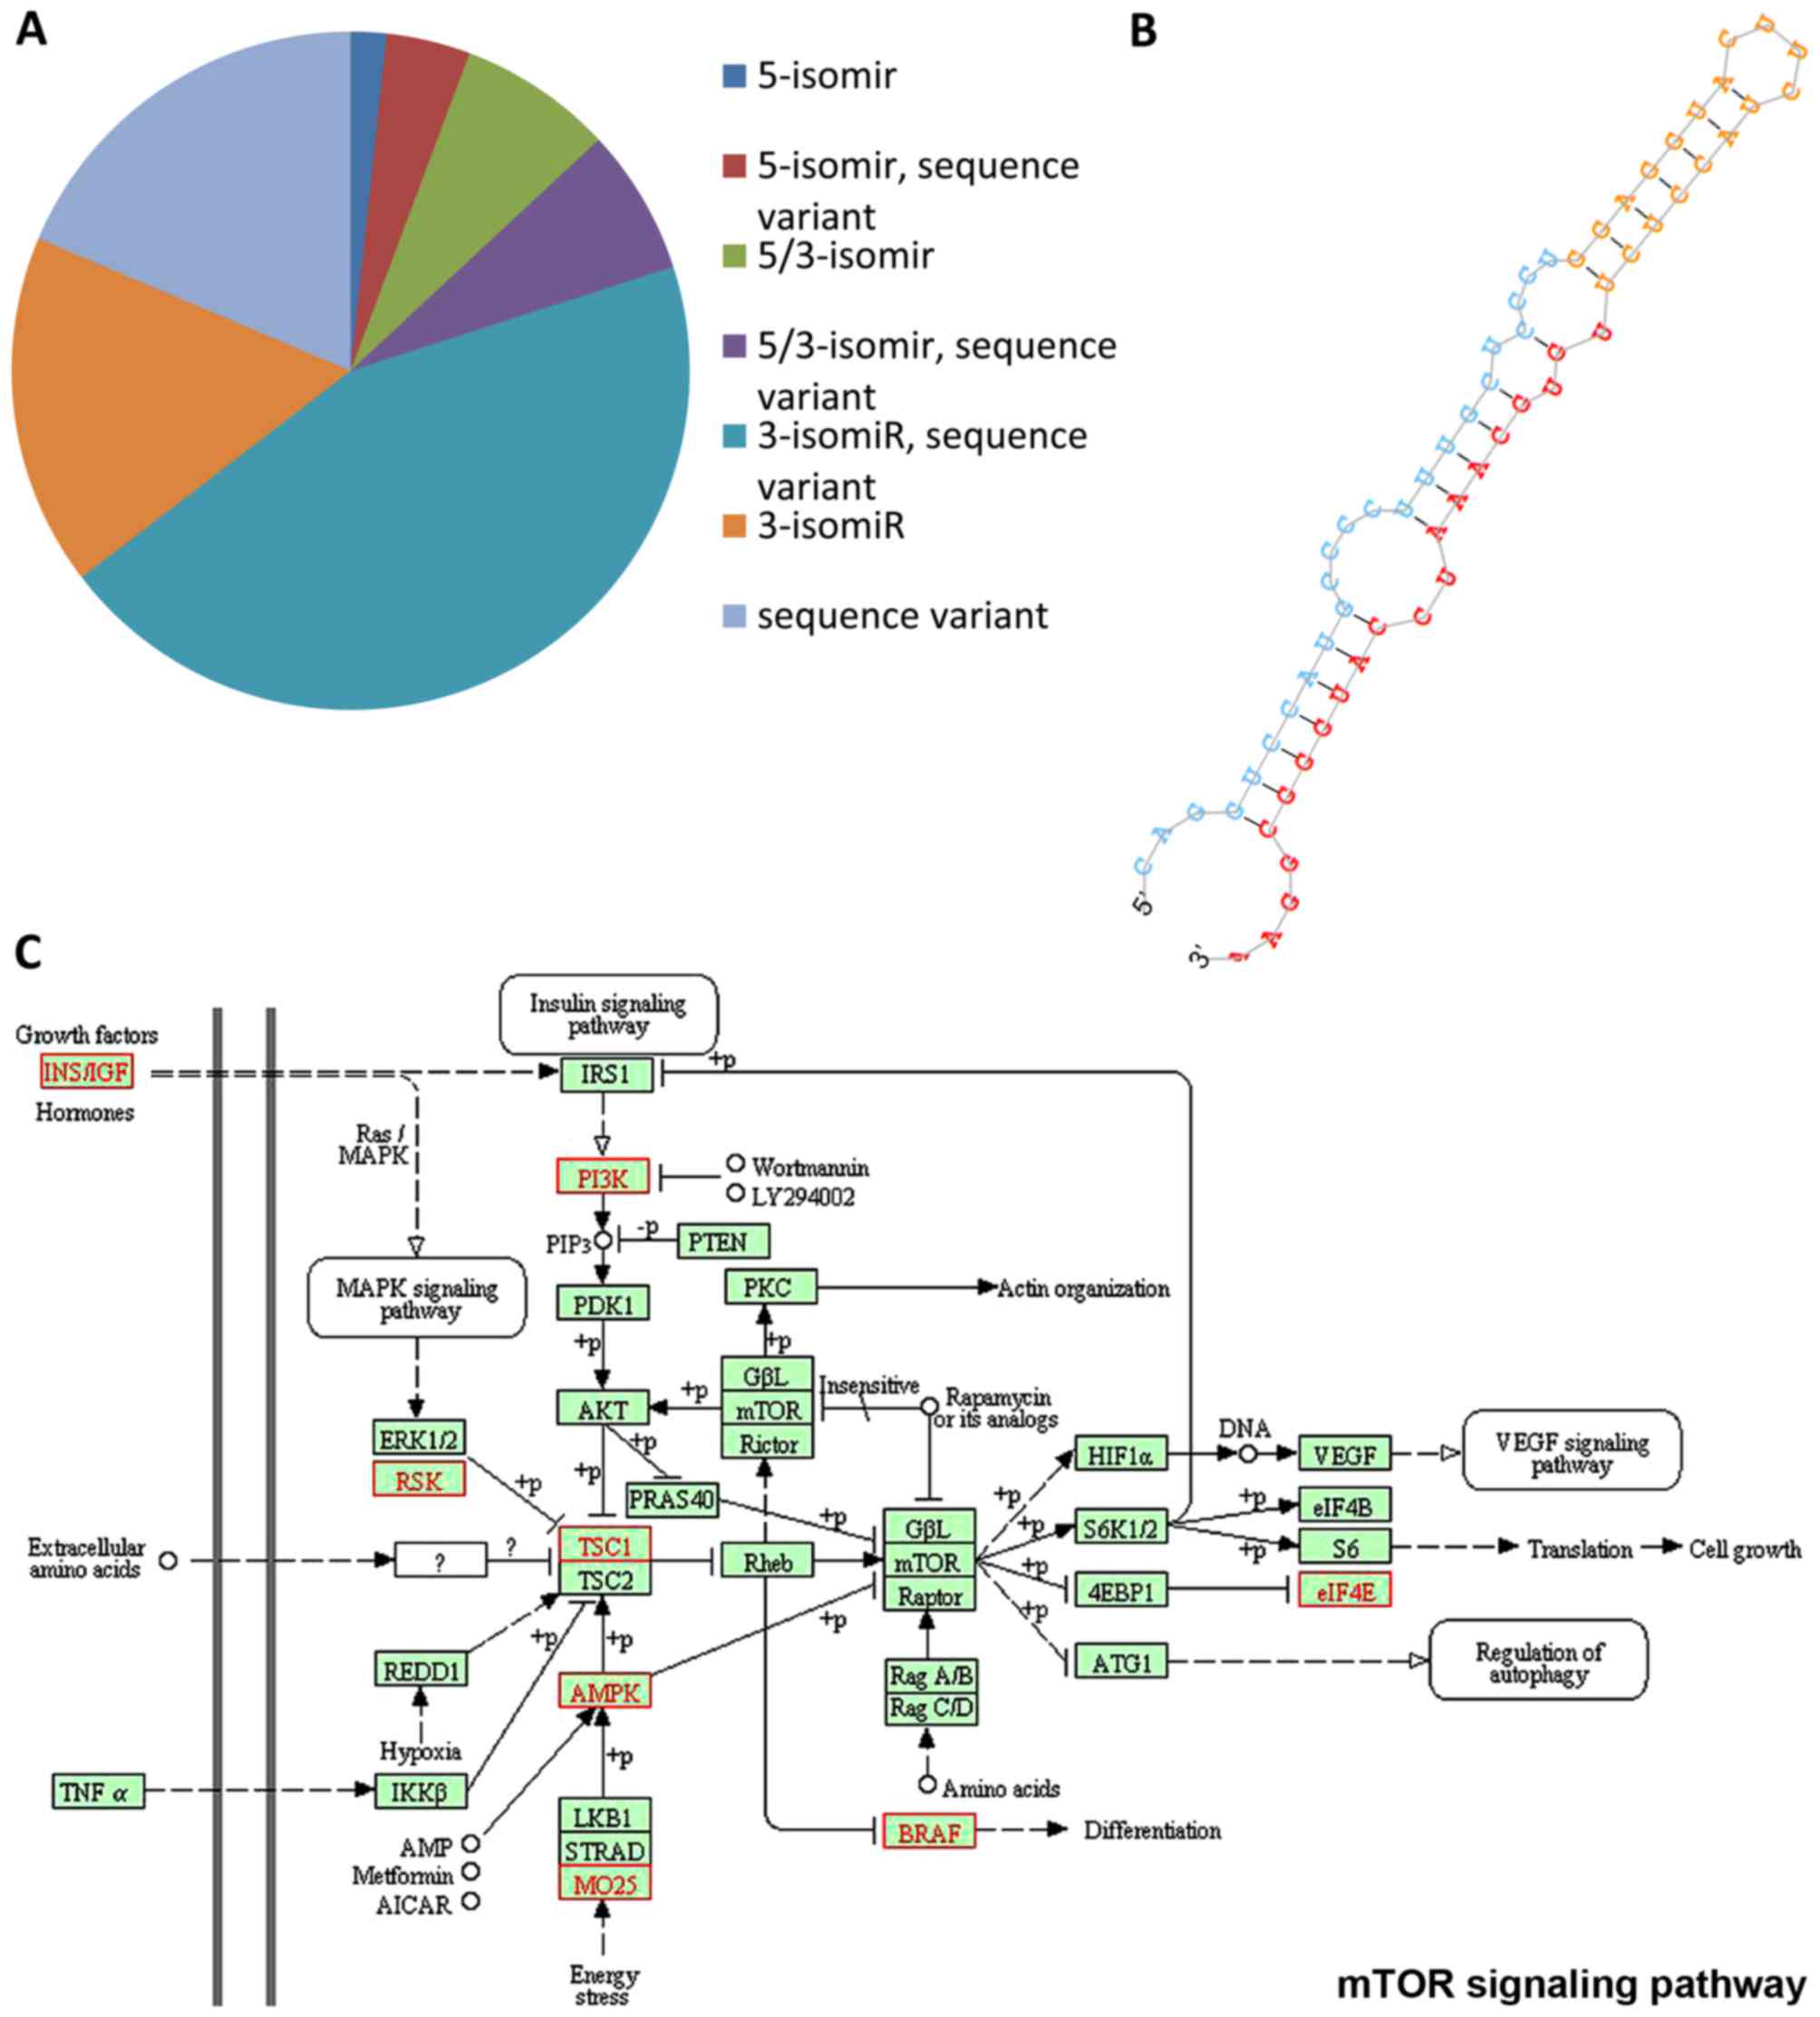
IsomiRs and novel miRNAs
Recent findings identified a large number of
sequences with different 5 or 3 flanking regions, called isomiRs
(76). From a biological point of
view, the most interesting isomiRs are the 5′-isomiRs (having
different 5-ends compared to their corresponding canonical miRNAs)
as they are potentially able to recognize different targets with
respect to the main isoform. A list of isomiRs (length and sequence
variants) was generated from the miRDeep2 output with proprietary
scripts, and their expression was evaluated in all samples. As
expected, compared to the total number of isomiRs detected in our
dataset, 5-isomiRs were less frequent: out of 18,809 isomiRs with
at least 10 read counts in at least one library, 3,769 were
5-isomiRs (20%), as described in Fig.
8A. The presence of miRNA length variants suggests that these
isomiRs might have different regulatory functions or efficiencies,
this allowing a finely tuned control of global gene expression.
Furthermore, in silico data analysis identified 18 putative
novel miRNAs expressed in the tumour samples. Two of these were
differentially expressed in MNA vs. MNnA tumours. In particular, a
hairpin with genomic coordinates chr4:180531388-180531451 was
detected as significantly overexpressed in the MNA tumours
(P=0.001; FDR=0.02) using the ‘GLM’ analysis, and it demonstrated a
uniform expression within each biological subgroup. The secondary
stem-loop structure of this putative novel miRNA is shown in
Fig. 8B. According to the miRanda
predictions, this candidate miRNA has ~900 putative targets, which
are enriched in transcriptional regulation and protein
phosphorylation ontology terms. Interestingly, a significant number
of putative target genes, highlighted in red in Fig. 8C, are correlated with the mTOR
signalling cascade, outlining the evidence for the aberrant
activation of this pathway in NB (77–79).
For this reason, the putative new miRNA may be an interesting
candidate for future functional studies in order to determine its
biological relevance in mTOR signalling, which in turn might lead
to the identification of further molecular targets in NB
tumour.
In conclusion, in the present study, NGS technology
and bioinformatics analysis allowed the identification of a
specific set of miRNAs that are differentially expressed in NB
tumours compared to DRG, or in NB tumours with or without MYCN
amplification. A relevant percentage of these microRNAs has been
already found to be involved in NB, another percentage has been
shown to be involved in the pathogenesis/progression of other
tumours, while other miRNAs are new. Target prediction and
functional annotation highlighted the possible roles of the
identified microRNAs, and in vitro assays provide initial
evidence of the contribution of miR-628-3p to MYCN regulation. New
potential miRNA candidates not previously reported were also found,
but further studies are needed to clarify their role in NB
development.
Altogether, these findings may provide further
insight concerning NB development and may also contribute to the
identification of novel potential therapeutic targets in this
highly lethal childhood tumour.
Acknowledgements
The present study was supported by the ‘Associazione
Onlus Fabrizio Procaccini’, ‘IO, domani…Associazione Onlus per la
Lotta contro i Tumori Infantili’ (ALTI), ‘Isle of Man Anti-Cancer
Association’, Italian ‘Ministero dell'Istruzione, dell'Università e
della Ricerca’ (MIUR) and Genomnia Srl R&D funds.
References
|
1
|
Irwin MS and Park JR: Neuroblastoma:
Paradigm for precision medicine. Pediatr Clin North Am. 62:225–256.
2015. View Article : Google Scholar : PubMed/NCBI
|
|
2
|
Cohn SL, Pearson AD, London WB, Monclair
T, Ambros PF, Brodeur GM, Faldum A, Hero B, Iehara T, Machin D, et
al: INRG Task Force: The International Neuroblastoma Risk Group
(INRG) classification system: An INRG Task Force report. J Clin
Oncol. 27:289–297. 2009. View Article : Google Scholar : PubMed/NCBI
|
|
3
|
Maris JM: Recent advances in
neuroblastoma. N Engl J Med. 362:2202–2211. 2010. View Article : Google Scholar : PubMed/NCBI
|
|
4
|
Schwab M, Varmus HE, Bishop JM, Grzeschik
KH, Naylor SL, Sakaguchi AY, Brodeur G and Trent J: Chromosome
localization in normal human cells and neuroblastomas of a gene
related to c-myc. Nature. 308:288–291. 1984. View Article : Google Scholar : PubMed/NCBI
|
|
5
|
Weiss WA, Aldape K, Mohapatra G,
Feuerstein BG and Bishop JM: Targeted expression of MYCN causes
neuroblastoma in transgenic mice. EMBO J. 16:2985–2995. 1997.
View Article : Google Scholar : PubMed/NCBI
|
|
6
|
Yoshimoto M, De Toledo SR Caminada, Caran
EM Monteiro, de Seixas MT, de Martino Lee ML, de Campos Vieira Abib
S, Vianna SM, Schettini ST and Andrade J Anderson Duffles: MYCN
gene amplification. Identification of cell populations containing
double minutes and homogeneously staining regions in neuroblastoma
tumors. Am J Pathol. 155:1439–1443. 1999. View Article : Google Scholar : PubMed/NCBI
|
|
7
|
Guglielmi L, Cinnella C, Nardella M,
Maresca G, Valentini A, Mercanti D, Felsani A and DAgnano I: MYCN
gene expression is required for the onset of the differentiation
programme in neuroblastoma cells. Cell Death Dis. 5:e10812014.
View Article : Google Scholar : PubMed/NCBI
|
|
8
|
Kaneko Y, Suenaga Y, Islam SM, Matsumoto
D, Nakamura Y, Ohira M, Yokoi S and Nakagawara A: Functional
interplay between MYCN, NCYM, and OCT4 promotes aggressiveness of
human neuroblastomas. Cancer Sci. 106:840–847. 2015. View Article : Google Scholar : PubMed/NCBI
|
|
9
|
Lau DT, Flemming CL, Gherardi S, Perini G,
Oberthuer A, Fischer M, Juraeva D, Brors B, Xue C, Norris MD, et
al: MYCN amplification confers enhanced folate dependence and
methotrexate sensitivity in neuroblastoma. Oncotarget.
6:15510–15523. 2015. View Article : Google Scholar : PubMed/NCBI
|
|
10
|
Beltran H: The N-myc Oncogene: Maximizing
its targets, regulation, and therapeutic potential. Mol Cancer Res.
12:815–822. 2014. View Article : Google Scholar : PubMed/NCBI
|
|
11
|
Zeng Y, Yi R and Cullen BR: MicroRNAs and
small interfering RNAs can inhibit mRNA expression by similar
mechanisms. Proc Natl Acad Sci USA. 100:9779–9784. 2003. View Article : Google Scholar : PubMed/NCBI
|
|
12
|
Bartel DP: MicroRNAs: Genomics,
biogenesis, mechanism, and function. Cell. 116:281–297. 2004.
View Article : Google Scholar : PubMed/NCBI
|
|
13
|
He L and Hannon GJ: MicroRNAs: Small RNAs
with a big role in gene regulation. Nat Rev Genet. 5:522–531. 2004.
View Article : Google Scholar : PubMed/NCBI
|
|
14
|
Kozomara A and Griffiths-Jones S: miRBase:
Integrating microRNA annotation and deep-sequencing data. Nucleic
Acids Res. 39(Database): D152–D157. 2011. View Article : Google Scholar : PubMed/NCBI
|
|
15
|
Friedman RC, Farh KK, Burge CB and Bartel
DP: Most mammalian mRNAs are conserved targets of microRNAs. Genome
Res. 19:92–105. 2009. View Article : Google Scholar : PubMed/NCBI
|
|
16
|
Domingo-Fernandez R, Watters K, Piskareva
O, Stallings RL and Bray I: The role of genetic and epigenetic
alterations in neuroblastoma disease pathogenesis. Pediatr Surg
Int. 29:101–119. 2013. View Article : Google Scholar : PubMed/NCBI
|
|
17
|
Leichter AL, Sullivan MJ, Eccles MR and
Chatterjee A: MicroRNA expression patterns and signalling pathways
in the development and progression of childhood solid tumours. Mol
Cancer. 16:152017. View Article : Google Scholar : PubMed/NCBI
|
|
18
|
Mei H, Lin ZY and Tong QS: The roles of
microRNAs in neuroblastoma. World J Pediatr. 10:10–16. 2014.
View Article : Google Scholar : PubMed/NCBI
|
|
19
|
Bray I, Tivnan A, Bryan K, Foley NH,
Watters KM, Tracey L, Davidoff AM and Stallings RL: MicroRNA-542-5p
as a novel tumor suppressor in neuroblastoma. Cancer Lett.
303:56–64. 2011. View Article : Google Scholar : PubMed/NCBI
|
|
20
|
Tivnan A, Tracey L, Buckley PG, Alcock LC,
Davidoff AM and Stallings RL: MicroRNA-34a is a potent tumor
suppressor molecule in vivo in neuroblastoma. BMC Cancer.
11:332011. View Article : Google Scholar : PubMed/NCBI
|
|
21
|
Chen Y, Tsai YH, Fang Y and Tseng SH:
Micro-RNA-21 regulates the sensitivity to cisplatin in human
neuroblastoma cells. J Pediatr Surg. 47:1797–1805. 2012. View Article : Google Scholar : PubMed/NCBI
|
|
22
|
Ryan J, Tivnan A, Fay J, Bryan K, Meehan
M, Creevey L, Lynch J, Bray IM, O'Meara A, Tracey L, et al:
MicroRNA-204 increases sensitivity of neuroblastoma cells to
cisplatin and is associated with a favourable clinical outcome. Br
J Cancer. 107:967–976. 2012. View Article : Google Scholar : PubMed/NCBI
|
|
23
|
Teillet MA, Kalcheim C and Le Douarin NM:
Formation of the dorsal root ganglia in the avian embryo: Segmental
origin and migratory behavior of neural crest progenitor cells. Dev
Biol. 120:329–347. 1987. View Article : Google Scholar : PubMed/NCBI
|
|
24
|
Beckwith JB and Martin RF: Observations on
the histopathology of neuroblastomas. J Pediatr Surg. 3:106–110.
1968. View Article : Google Scholar : PubMed/NCBI
|
|
25
|
Griffiths-Jones S, Saini HK, van Dongen S
and Enright AJ: miRBase: Tools for microRNA genomics. Nucleic Acids
Res. 36(Database): D154–D158. 2008. View Article : Google Scholar : PubMed/NCBI
|
|
26
|
Robinson MD and Oshlack A: A scaling
normalization method for differential expression analysis of
RNA-seq data. Genome Biol. 11:R252010. View Article : Google Scholar : PubMed/NCBI
|
|
27
|
Bullard JH, Purdom E, Hansen KD and Dudoit
S: Evaluation of statistical methods for normalization and
differential expression in mRNA-Seq experiments. BMC
Bioinformatics. 11:942010. View Article : Google Scholar : PubMed/NCBI
|
|
28
|
Hsu SD, Tseng YT, Shrestha S, Lin YL,
Khaleel A, Chou CH, Chu CF, Huang HY, Lin CM, Ho SY, et al:
miRTarBase update 2014: An information resource for experimentally
validated miRNA-target interactions. Nucleic Acids Res. 42(D1):
D78–D85. 2014. View Article : Google Scholar : PubMed/NCBI
|
|
29
|
Enright AJ, John B, Gaul U, Tuschl T,
Sander C and Marks DS: MicroRNA targets in Drosophila. Genome Biol.
5:R12003. View Article : Google Scholar : PubMed/NCBI
|
|
30
|
Huang W, Sherman BT and Lempicki RA:
Systematic and integrative analysis of large gene lists using DAVID
bioinformatics resources. Nat Protoc. 4:44–57. 2009. View Article : Google Scholar : PubMed/NCBI
|
|
31
|
Wu G, Feng X and Stein L: A human
functional protein interaction network and its application to
cancer data analysis. Genome Biol. 11:R532010. View Article : Google Scholar : PubMed/NCBI
|
|
32
|
Wang J, Huang Q, Liu ZP, Wang Y, Wu LY,
Chen L and Zhang XS: NOA: A novel network ontology analysis method.
Nucleic Acids Res. 39:e872011. View Article : Google Scholar : PubMed/NCBI
|
|
33
|
Grant CE, Bailey TL and Noble WS: FIMO:
Scanning for occurrences of a given motif. Bioinformatics.
27:1017–1018. 2011. View Article : Google Scholar : PubMed/NCBI
|
|
34
|
Li H, Handsaker B, Wysoker A, Fennell T,
Ruan J, Homer N, Marth G, Abecasis G and Durbin R: 1000 Genome
Project Data Processing Subgroup: The Sequence Alignment/Map format
and SAMtools. Bioinformatics. 25:2078–2079. 2009. View Article : Google Scholar : PubMed/NCBI
|
|
35
|
Friedländer MR, Chen W, Adamidi C,
Maaskola J, Einspanier R, Knespel S and Rajewsky N: Discovering
microRNAs from deep sequencing data using miRDeep. Nat Biotechnol.
26:407–415. 2008. View Article : Google Scholar : PubMed/NCBI
|
|
36
|
Megiorni F, Camero S, Ceccarelli S,
McDowell HP, Mannarino O, Marampon F, Pizer B, Shukla R, Pizzuti A,
Marchese C, et al: DNMT3B in vitro knocking-down is able to reverse
embryonal rhabdomyosarcoma cell phenotype through inhibition of
proliferation and induction of myogenic differentiation.
Oncotarget. 7:79342–79356. 2016.PubMed/NCBI
|
|
37
|
Afanasyeva EA, Hotz-Wagenblatt A, Glatting
KH and Westermann F: New miRNAs cloned from neuroblastoma. BMC
Genomics. 9:522008. View Article : Google Scholar : PubMed/NCBI
|
|
38
|
Mestdagh P, Fredlund E, Pattyn F, Schulte
JH, Muth D, Vermeulen J, Kumps C, Schlierf S, De Preter K, Van Roy
N, et al: MYCN/c-MYC-induced microRNAs repress coding gene networks
associated with poor outcome in MYCN/c-MYC-activated tumors.
Oncogene. 29:1394–1404. 2010. View Article : Google Scholar : PubMed/NCBI
|
|
39
|
Bienertova-Vasku J, Mazanek P, Hezova R,
Curdova A, Nekvindova J, Kren L, Sterba J and Slaby O: Extension of
microRNA expression pattern associated with high-risk
neuroblastoma. Tumour Biol. 34:2315–2319. 2013. View Article : Google Scholar : PubMed/NCBI
|
|
40
|
Uppal A, Wightman SC, Mallon S, Oshima G,
Pitroda SP, Zhang Q, Huang X, Darga TE, Huang L, Andrade J, et al:
14q32-encoded microRNAs mediate an oligometastatic phenotype.
Oncotarget. 6:3540–3552. 2015. View Article : Google Scholar : PubMed/NCBI
|
|
41
|
Liu L, Chen R, Zhang Y, Fan W, Xiao F and
Yan X: Low expression of circulating microRNA-328 is associated
with poor prognosis in patients with acute myeloid leukemia. Diagn
Pathol. 10:1092015. View Article : Google Scholar : PubMed/NCBI
|
|
42
|
Yuan J, Zheng Z, Zheng Y, Lu X, Xu L and
Lin L: microRNA-328 is a favorable prognostic marker in human
glioma via suppressing invasive and proliferative phenotypes of
malignant cells. Int J Neurosci. 126:145–153. 2015. View Article : Google Scholar : PubMed/NCBI
|
|
43
|
Anwar SL, Albat C, Krech T, Hasemeier B,
Schipper E, Schweitzer N, Vogel A, Kreipe H and Lehmann U:
Concordant hypermethylation of intergenic microRNA genes in human
hepatocellular carcinoma as new diagnostic and prognostic marker.
Int J Cancer. 133:660–670. 2013. View Article : Google Scholar : PubMed/NCBI
|
|
44
|
Shi S, Lu Y, Qin Y, Li W, Cheng H, Xu Y,
Xu J, Long J, Liu L, Liu C, et al: miR-1247 is correlated with
prognosis of pancreatic cancer and inhibits cell proliferation by
targeting neuropilins. Curr Mol Med. 14:316–327. 2014. View Article : Google Scholar : PubMed/NCBI
|
|
45
|
Karjalainen K, Jaalouk DE, Bueso-Ramos CE,
Zurita AJ, Kuniyasu A, Eckhardt BL, Marini FC, Lichtiger B, OBrien
S, Kantarjian HM, et al: Targeting neuropilin-1 in human leukemia
and lymphoma. Blood. 117:920–927. 2011. View Article : Google Scholar : PubMed/NCBI
|
|
46
|
Yan H, Choi AJ, Lee BH and Ting AH:
Identification and functional analysis of epigenetically silenced
microRNAs in colorectal cancer cells. PLoS One. 6:e206282011.
View Article : Google Scholar : PubMed/NCBI
|
|
47
|
Charlet J, Schnekenburger M, Brown KW and
Diederich M: DNA demethylation increases sensitivity of
neuroblastoma cells to chemotherapeutic drugs. Biochem Pharmacol.
83:858–865. 2012. View Article : Google Scholar : PubMed/NCBI
|
|
48
|
Mestdagh P, Boström AK, Impens F, Fredlund
E, Van Peer G, De Antonellis P, von Stedingk K, Ghesquière B,
Schulte S, Dews M, et al: The miR-17-92 microRNA cluster regulates
multiple components of the TGF-β pathway in neuroblastoma. Mol
Cell. 40:762–773. 2010. View Article : Google Scholar : PubMed/NCBI
|
|
49
|
Miao T, Wu D, Zhang Y, Bo X, Xiao F, Zhang
X, Magoulas C, Subang MC, Wang P and Richardson PM: SOCS3
suppresses AP-1 transcriptional activity in neuroblastoma cells
through inhibition of c-Jun N-terminal kinase. Mol Cell Neurosci.
37:367–375. 2008. View Article : Google Scholar : PubMed/NCBI
|
|
50
|
Morgan K, Stewart AJ, Miller N, Mullen P,
Muir M, Dodds M, Medda F, Harrison D, Langdon S and Millar RP:
Gonadotropin-releasing hormone receptor levels and cell context
affect tumor cell responses to agonist in vitro and in vivo. Cancer
Res. 68:6331–6340. 2008. View Article : Google Scholar : PubMed/NCBI
|
|
51
|
Weng WC, Lin KH, Wu PY, Lu YC, Weng YC,
Wang BJ, Liao YF, Hsu WM, Lee WT and Lee H: Calreticulin regulates
VEGF-A in neuroblastoma cells. Mol Neurobiol. 52:758–770. 2015.
View Article : Google Scholar : PubMed/NCBI
|
|
52
|
Lodrini M, Oehme I, Schroeder C, Milde T,
Schier MC, Kopp-Schneider A, Schulte JH, Fischer M, De Preter K,
Pattyn F, et al: MYCN and HDAC2 cooperate to repress miR-183
signaling in neuroblastoma. Nucleic Acids Res. 41:6018–6033. 2013.
View Article : Google Scholar : PubMed/NCBI
|
|
53
|
Rihani A, Van Goethem A, Ongenaert M, De
Brouwer S, Volders PJ, Agarwal S, De Preter K, Mestdagh P, Shohet
J, Speleman F, et al: Genome wide expression profiling of p53
regulated miRNAs in neuroblastoma. Sci Rep. 5:90272015. View Article : Google Scholar : PubMed/NCBI
|
|
54
|
Murphy DM, Buckley PG, Bryan K, Das S,
Alcock L, Foley NH, Prenter S, Bray I, Watters KM, Higgins D, et
al: Global MYCN transcription factor binding analysis in
neuroblastoma reveals association with distinct E-box motifs and
regions of DNA hypermethylation. PLoS One. 4:e81542009. View Article : Google Scholar : PubMed/NCBI
|
|
55
|
Schulte JH, Horn S, Otto T, Samans B,
Heukamp LC, Eilers UC, Krause M, Astrahantseff K, Klein-Hitpass L,
Buettner R, et al: MYCN regulates oncogenic MicroRNAs in
neuroblastoma. Int J Cancer. 122:699–704. 2008. View Article : Google Scholar : PubMed/NCBI
|
|
56
|
Lovén J, Zinin N, Wahlström T, Müller I,
Brodin P, Fredlund E, Ribacke U, Pivarcsi A, Påhlman S and
Henriksson M: MYCN-regulated microRNAs repress estrogen
receptor-alpha (ESR1) expression and neuronal differentiation in
human neuroblastoma. Proc Natl Acad Sci USA. 107:1553–1558. 2010.
View Article : Google Scholar : PubMed/NCBI
|
|
57
|
He L, Thomson JM, Hemann MT,
Hernando-Monge E, Mu D, Goodson S, Powers S, Cordon-Cardo C, Lowe
SW, Hannon GJ, et al: A microRNA polycistron as a potential human
oncogene. Nature. 435:828–833. 2005. View Article : Google Scholar : PubMed/NCBI
|
|
58
|
Mogilyansky E and Rigoutsos I: The
miR-17/92 cluster: A comprehensive update on its genomics,
genetics, functions and increasingly important and numerous roles
in health and disease. Cell Death Differ. 20:1603–1614. 2013.
View Article : Google Scholar : PubMed/NCBI
|
|
59
|
Thorsen SB, Obad S, Jensen NF, Stenvang J
and Kauppinen S: The therapeutic potential of microRNAs in cancer.
Cancer J. 18:275–284. 2012. View Article : Google Scholar : PubMed/NCBI
|
|
60
|
Fontana L, Fiori ME, Albini S, Cifaldi L,
Giovinazzi S, Forloni M, Boldrini R, Donfrancesco A, Federici V,
Giacomini P, et al: Antagomir-17-5p abolishes the growth of
therapy-resistant neuroblastoma through p21 and BIM. PLoS One.
3:e22362008. View Article : Google Scholar : PubMed/NCBI
|
|
61
|
Guo J, Dong Q, Fang Z, Chen X, Lu H, Wang
K, Yin Y, Cai X, Zhao N, Chen J, et al: Identification of miRNAs
that are associated with tumor metastasis in neuroblastoma. Cancer
Biol Ther. 9:446–452. 2010. View Article : Google Scholar : PubMed/NCBI
|
|
62
|
Schulte JH, Marschall T, Martin M,
Rosenstiel P, Mestdagh P, Schlierf S, Thor T, Vandesompele J,
Eggert A, Schreiber S, et al: Deep sequencing reveals differential
expression of microRNAs in favorable versus unfavorable
neuroblastoma. Nucleic Acids Res. 38:5919–5928. 2010. View Article : Google Scholar : PubMed/NCBI
|
|
63
|
Rahmann S, Martin M, Schulte JH, Köster J,
Marschall T and Schramm A: Identifying transcriptional miRNA
biomarkers by integrating high-throughput sequencing and real-time
PCR data. Methods. 59:154–163. 2013. View Article : Google Scholar : PubMed/NCBI
|
|
64
|
Chang YY, Kuo WH, Hung JH, Lee CY, Lee YH,
Chang YC, Lin WC, Shen CY, Huang CS, Hsieh FJ, et al: Deregulated
microRNAs in triple-negative breast cancer revealed by deep
sequencing. Mol Cancer. 14:362015. View Article : Google Scholar : PubMed/NCBI
|
|
65
|
Zhang Y, Hu Y, Fang JY and Xu J:
Gain-of-function miRNA signature by mutant p53 associates with poor
cancer outcome. Oncotarget. 7:11056–11066. 2016.PubMed/NCBI
|
|
66
|
Pehserl AM, Ress AL, Stanzer S, Resel M,
Karbiener M, Stadelmeyer E, Stiegelbauer V, Gerger A, Mayr C,
Scheideler M, et al: Comprehensive analysis of miRNome alterations
in response to sorafenib treatment in colorectal cancer cells. Int
J Mol Sci. 17:E20112016. View Article : Google Scholar : PubMed/NCBI
|
|
67
|
Wang H, Zhi H, Ma D and Li T: MiR-217
promoted the proliferation and invasion of glioblastoma by
repressing YWHAG. Cytokine. 92:93–102. 2017. View Article : Google Scholar : PubMed/NCBI
|
|
68
|
Kos A, Loohuis NF Olde, Wieczorek ML,
Glennon JC, Martens GJ, Kolk SM and Aschrafi A: A potential
regulatory role for intronic microRNA-338-3p for its host gene
encoding apoptosis-associated tyrosine kinase. PLoS One.
7:e310222012. View Article : Google Scholar : PubMed/NCBI
|
|
69
|
Chen X, Pan M, Han L, Lu H, Hao X and Dong
Q: miR-338-3p suppresses neuroblastoma proliferation, invasion and
migration through targeting PREX2a. FEBS Lett. 587:3729–3737. 2013.
View Article : Google Scholar : PubMed/NCBI
|
|
70
|
Chiang HR, Schoenfeld LW, Ruby JG, Auyeung
VC, Spies N, Baek D, Johnston WK, Russ C, Luo S, Babiarz JE, et al:
Mammalian microRNAs: Experimental evaluation of novel and
previously annotated genes. Genes Dev. 24:992–1009. 2010.
View Article : Google Scholar : PubMed/NCBI
|
|
71
|
Müller S and Nowak K: Exploring the
miRNA-mRNA regulatory network in clear cell renal cell carcinomas
by next-generation sequencing expression profiles. BioMed Res Int.
2014:9484082014. View Article : Google Scholar : PubMed/NCBI
|
|
72
|
Murphy DM, Buckley PG, Das S, Watters KM,
Bryan K and Stallings RL: Co-localization of the oncogenic
transcription factor MYCN and the DNA methyl binding protein MeCP2
at genomic sites in neuroblastoma. PLoS One. 6:e214362011.
View Article : Google Scholar : PubMed/NCBI
|
|
73
|
Corvetta D, Chayka O, Gherardi S, DAcunto
CW, Cantilena S, Valli E, Piotrowska I, Perini G and Sala A:
Physical interaction between MYCN oncogene and polycomb repressive
complex 2 (PRC2) in neuroblastoma: Functional and therapeutic
implications. J Biol Chem. 288:8332–8341. 2013. View Article : Google Scholar : PubMed/NCBI
|
|
74
|
Buechner J and Einvik C: N-myc and
noncoding RNAs in neuroblastoma. Mol Cancer Res. 10:1243–1253.
2012. View Article : Google Scholar : PubMed/NCBI
|
|
75
|
Jackstadt R and Hermeking H: MicroRNAs as
regulators and mediators of c-MYC function. Biochim Biophys Acta.
1849:544–553. 2015. View Article : Google Scholar : PubMed/NCBI
|
|
76
|
Guo L and Chen F: A challenge for miRNA:
Multiple isomiRs in miRNAomics. Gene. 544:1–7. 2014. View Article : Google Scholar : PubMed/NCBI
|
|
77
|
Iżycka-Świeszewska E, Drożyńska E, Rzepko
R, Kobierska-Gulida G, Grajkowska W, Perek D and Balcerska A:
Analysis of PI3K/AKT/mTOR signalling pathway in high risk
neuroblastic tumours. Pol J Pathol. 61:192–198. 2010.PubMed/NCBI
|
|
78
|
King D, Yeomanson D and Bryant HE: PI3King
the lock: Targeting the PI3K/Akt/mTOR pathway as a novel
therapeutic strategy in neuroblastoma. J Pediatr Hematol Oncol.
37:245–251. 2015. View Article : Google Scholar : PubMed/NCBI
|
|
79
|
Vaughan L, Clarke PA, Barker K, Chanthery
Y, Gustafson CW, Tucker E, Renshaw J, Raynaud F, Li X, Burke R, et
al: Inhibition of mTOR-kinase destabilizes MYCN and is a potential
therapy for MYCN-dependent tumors. Oncotarget. 7:57525–57544.
2016.PubMed/NCBI
|