Introduction
Colorectal cancer is one of the most malignant
cancers and the third cause of cancer-related mortality worldwide
(1). Patients with colon cancer
(10–30%) have the tendency to develop lung metastasis (2). Due to the lung metastasis of colon
cancer, the 5-year survival rate of colon cancer patients is very
low. The prevention and early identification of lung metastasis in
colorectal cancer patients may significantly enhance survival
rates. Therefore, biomarkers that facilitate the early diagnosis of
lung metastasis are highly valuable, and investigating the
potential biomarkers, which are closely associated with the
progression of lung metastasis from colorectal cancer, is an urgent
aim of research.
Although distant metastasis is the major cause of
colorectal cancer-related mortality and a large number of
colorectal cancer patients develop lung metastasis after treatment,
little research has focused on the biomarker detection of lung
metastasis from colon cancer. Gorlick et al showed that
colorectal cancer metastasis to the lung has a higher thymidylate
synthase (TS) level than liver metastasis (3), and increased levels of E2F lead to
increased TS expression in the lung metastasis of colorectal cancer
(4). In addition, overexpression of
HOXB9 was found to promote metastasis in colon cancer and stable
knockdown of HOXB9 reduced the liver and lung metastasis of colon
cancer in vivo (5).
Increasing evidence suggests that cancer stem cells (CSCs) play a
crucial role in cancer metastasis (6). Cancer metastasis requires the seeding
and successful colonization of CSCs at distant organs (7), and cell surface marker CDCP1 promotes
the adhesion of CRC cells to the lung endothelium (8). Although there are various studies that
have investigated the biomarkers for colorectal cancer lung
metastasis, the underlying mechanism remains unclear.
Metabonomics is a relatively new technique that is
rapidly gaining importance. It is an emerging field of research
downstream of transcriptomics, genomics and proteomics. The
critical purpose of metabonomics is to determine thousands of small
molecules in cells, tissues, organs or biological fluids followed
by the application of a series of analytical methods such as
nuclear magnetic resonance, color spectrum and mass spectrogram
(9). Among these analytical
technologies, NMR is an ideal instrumental platform for metabolic
analysis since it offers essentially universal detection, excellent
quantitative precision, and the potential for high throughput
screening (>100 samples/day is attainable). In contrast to
classical biochemical approaches, which often focus on a single
metabolite or single metabolic reaction, metabonomics involves the
collection of quantitative data on a broad series of metabolites in
an attempt to acquire an overall understanding of metabolism or
metabolic dynamics associated with diseases or different stages of
diseases. NMR-based metabonomics is widely applied to identify
potential biomarkers of cancers, such as gastric (10), breast (11), esophageal (12), colorectal (13,14)
and bladder cancer (15). However,
little research has focused on the metabonomic profiling of cancer
metastasis. To date, only 3 NMR-based metabonomic studies
concerning metastasis have been reported including advanced
metastatic breast cancer (11), rat
hepatocellular carcinoma (16) and
renal cell carcinoma metastasis (17), which suggest that alterations in
metabolism such as glycolysis, the choline pathway, TCA cycle and
glutamine metabolism occur during cancer metastasis. No research
has reported the metabolic profiling of colon cancer with the lung
metastasis process, to date.
In the present study, we established a murine lung
metastasis model of colorectal cancer by an intravenous injection
of the murine colorectal cancer cell line CT26 into mice. We
applied 1H-NMR to study the metabonomic profiling of
mouse lung tissues and identified 42 distinguishing metabolites
between the metastasis and normal control groups. Among the 42
distinguishing metabolites, 12 were closely related with the
progression of metastasis. Our results indicate that tumor
metabolism including glycolysis, glutamine metabolism, and TCA
cycle and choline metabolism play a critical role in the mouse
colon cancer lung metastasis process. The altered metabolites could
be potential biomarkers, which can provide a promising molecular
diagnostic approach for the clinical diagnosis and treatment of
colon cancer patients with lung metastasis.
Materials and methods
Animals
Syngeneic BALB/c mice (6–8 weeks of age) were
obtained from the Beijing Animal Center (Beijing, China) and housed
under controlled environmental conditions. The animals (SPF) were
maintained at 21°C in 55% humidity, on a 12-h light/12-h dark
cycle. All animals were housed in a standard animal laboratory
allowing free activity and were provided with standard food and
water ad libitum. All animal procedures were performed
according to the National Institutes of Health Guide for the Care
and Use of Laboratory Animals. All of the animal protocols were
reviewed and approved by the Experimental Animal Ethics Committee
of Sichuan University (Chengdu, China).
Reagents
Sodium-3-(trimethylsilyl)-2,2,3,3-tetradeuteriopropionate (TSP) was
purchased from Sigma-Aldrich (St. Louis, MO, USA). Deuterium oxide
(99.8% D) was purchased from Norell®, Inc. (Landisville,
NJ, USA). Methanol and chloroform (CDCl3) were purchased
from Fisher Scientific (Fairlawn, NJ, USA). Deionized water was
obtained from an EASYpure II UV water purification system
(Barnstead International, Dubuque, IA, USA).
Cell culture and in vivo lung
metastasis model
CT26 (mouse colorectal carcinoma cell line) was
purchased from the American Type Culture Collection (ATCC;
Manassas, VA, USA), and was cultured in RPMI-1640 medium
supplemented with 10% heat-inactivated fetal bovine serum (FBS)
(Gibco, Grand Island, NY, USA), 100 U/ml penicillin and 100 U/ml
streptomycin at 37°C in a humidified atmosphere with 5%
CO2. Cells were passaged at least 2 or 3 times before
use.
BALB/c mice (6–8 weeks of age) were used in the
present study. Mice in the lung metastasis groups were injected
with CT26 cells (2×10⁶ cells/mouse) via tail vein, and
they were sacrificed, 7, 14 and 21 days after cell injection,
respectively. Mice in the control group were injected with saline
via tail vein. Lung tissues were collected and stored at −80°C in
formalin for subsequent experiments.
Sample preparation for NMR
spectroscopy
Lung tissues of mice were carefully microdissected
to ensure that the analyzed tissue contained cancer cells. An
amount of 200–500 mg of frozen tissue samples was weighed and
suspended in methanol (4 ml/g of tissue) and double distilled water
(0.85 ml/g of tissue). The suspension was homogenized with 20
strokes at 800 rpm, and chloroform (2 ml/g of tissue) was added,
followed by addition of 50% chloroform (2 ml/g of tissue) and
homogenization was repeated. The sample was left on ice for 30 min,
and centrifuged at 1,000 × g for 30 min at 4°C. Then, the sample
was separated to 3 phases: a water phase at the top, a denatured
protein phase in the middle and a lipid phase at the bottom. The
water phase of each specimen was collected and evaporated to
dryness under a stream of nitrogen. The residue was reconstituted
with 580 µl D2O containing 30 µM phosphate-buffered
solution (PBS; pH=7.4) and 0.01 mg/ml
sodium-3-(trimethylsilyl)-2,2,3,3-tetradeuteriopropionate (TSP) as
an internal standard (δ0.0). After centrifugation at 12,000 × g for
5 min, the supernatant was transferred into a 5-mm NMR tube for NMR
spectroscopy (18).
1H-NMR spectroscopic
analysis
All tissue samples were analyzed using
1H-NMR spectroscopy at 600.13 MHz using a Bruker Avance
II 600 spectrometer operating (Bruker BioSpin, Rheinstetten,
Germany) at 300 K. A one-dimensional spectrum was acquired using a
standard (1D) Carr-Purcell-Meiboom-Gill (CPMG) pulse sequence to
suppress the water signal with a relaxation delay of 5 sec.
Sixty-four-free induction decays (FIDs) were collected into 64 K
data points with a spectral width of 12,335.5-Hz spectral, an
acquisition time of 2.66 sec, and a total pulse recycle delay of
7.66 sec. The FIDs were weighted by a Gaussian function with
line-broadening factor 20.3 Hz, Gaussian maximum position 0.1,
prior to Fourier transformation (19).
Data processing
All NMR data acquired above were subjected to
pattern recognition (PR) analysis. Before doing this, the raw data
were manually Fourier transformed using MestReNova-6.1.1–6384
software. After phase adjustment and baseline correction, the NMR
data were referenced to the TSP resonance at δ0.0. The whole
spectrum was divided into 4,500 segments with equal width (0.002
ppm) ranging from 9.5 to 0.5 ppm. The region 5.1–4.7 ppm was
removed to exclude the effect of imperfect water suppression.
Finally, the data were normalized to eliminate the dilution or bulk
mass difference among samples and to give the same total
integration value for each spectrum before analysis.
PR analysis
Multivariate analysis was carried out using SIMCA-P
+ 11 (Umetrics AB, Umeå, Sweden). Principal component analysis
(PCA), the unsupervised PR method, was initially applied to analyze
the NMR data to separate the lung metastasis nodule samples from
normal lung tissues. Partial least squares discriminant analysis
(PLS-DA) and orthogonal partial least squares discriminant analysis
(OPLS-DA), supervised PR method, were used to improve the
separation of the different groups. The PLS-DA model was
cross-validated by permutation analysis (200 times) (20,21).
The default 7-round cross validation was applied
with 1/7 of the samples being excluded from the mathematical model
in each round, in order to guard against over fitting.
R2 and Q2 were acquired from the PLS-DA
model. The variable importance in the projection (VIP) values of
all peaks obtained from the OPLS-DA model was analyzed, and only
VIP >1 were considered relevant for group discrimination
(22). Otherwise, unpaired
Student's t-test (p<0.05) was also used to assess the
significance of each metabolite. With both VIP and p-value meeting
the requirements, the metabolites were identified as distinguishing
metabolites. The corresponding chemical shift of metabolites was
acquired through previous literature and the Human Metabolome
Database (http://www.hmdb.ca/).
Results
Construction of the lung metastasis
model and metabolic profiling of the samples
CT26 cells were injected into the tail vein of
BALB/c mice to construct the metastasis model. Then, the lung
tissues were collected at 7, 14 and 21 days after cell injection;
on the first day of the experiment the specimens of the normal
group were also collected without cell injection.
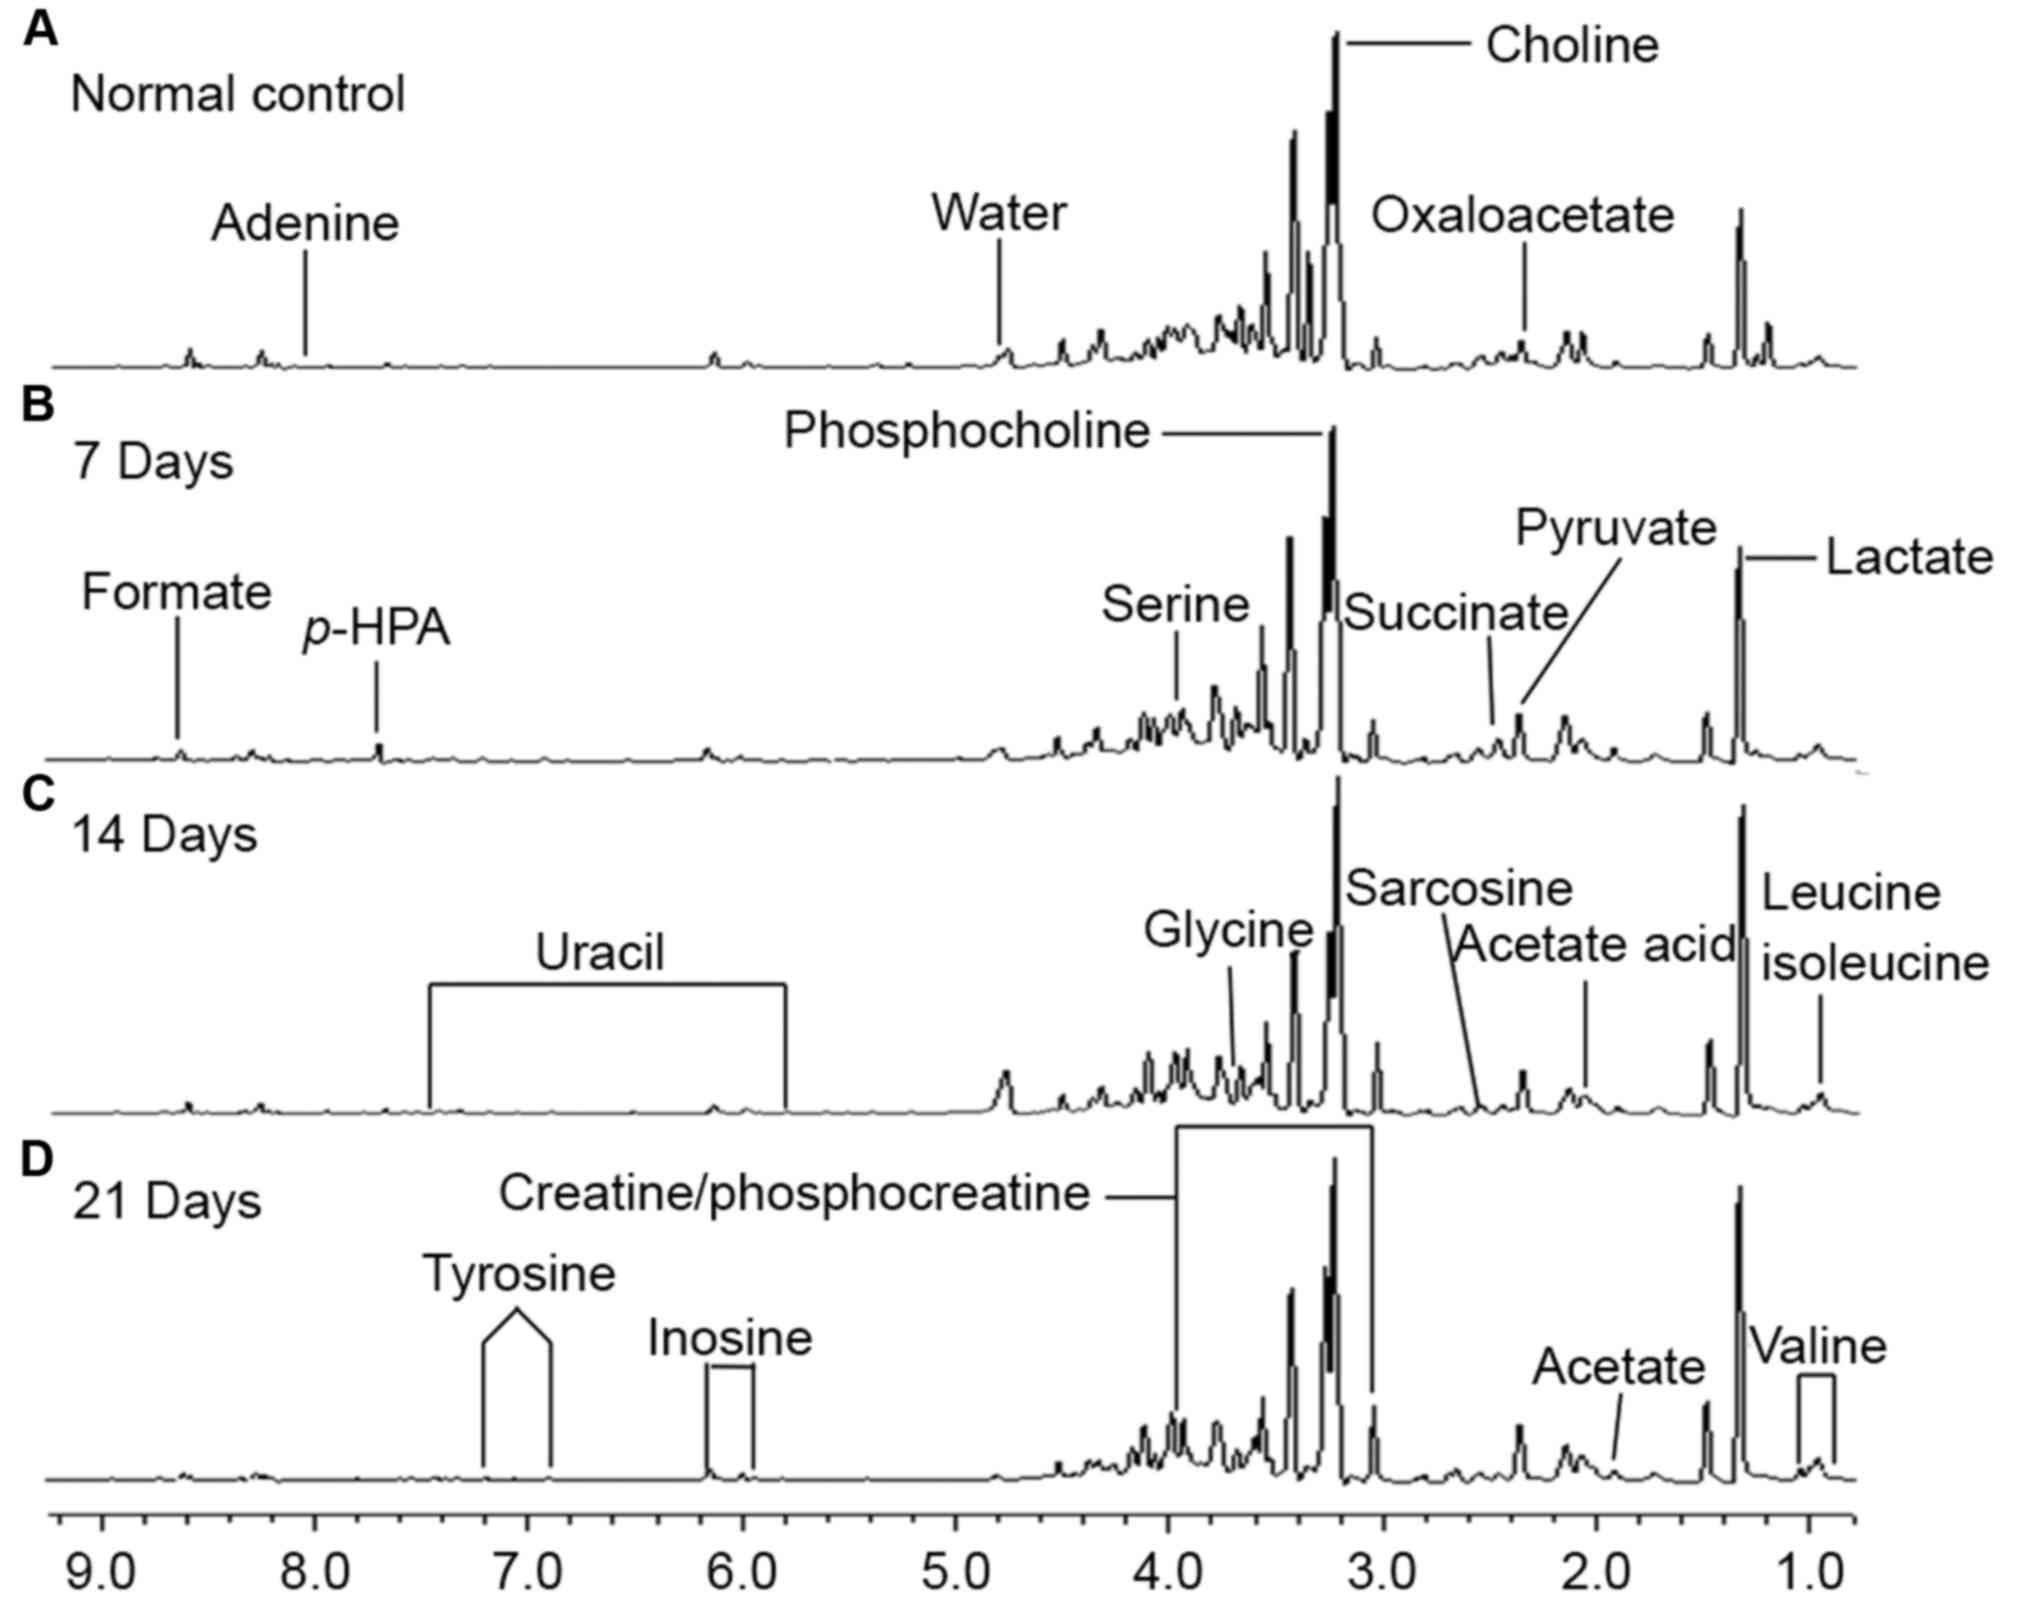
The collected samples underwent extraction, and the
aqueous fractions were investigated using NMR. The typical
1H-NMR spectra of the aqueous phase extracts of lung
tissues of the different groups are shown in Fig. 1. The standard one-dimension spectrum
provided an overview of all and the major metabolites in the
integrated regions were identified according to the literature data
and the Human Metabolome Database (http://www.hmdb.ca/). Finally, a series of metabolites
which were altered at endogenous metabolite levels were observed in
the metastasis groups at 7, 14 and 21 days when compared with the
normal group. The different metabolites included amino acids,
carbohydrates and lipids which are known to be related with
metabolic processes, particularly in energy metabolism (23).
PR analysis of the normal and
different metastasis groups
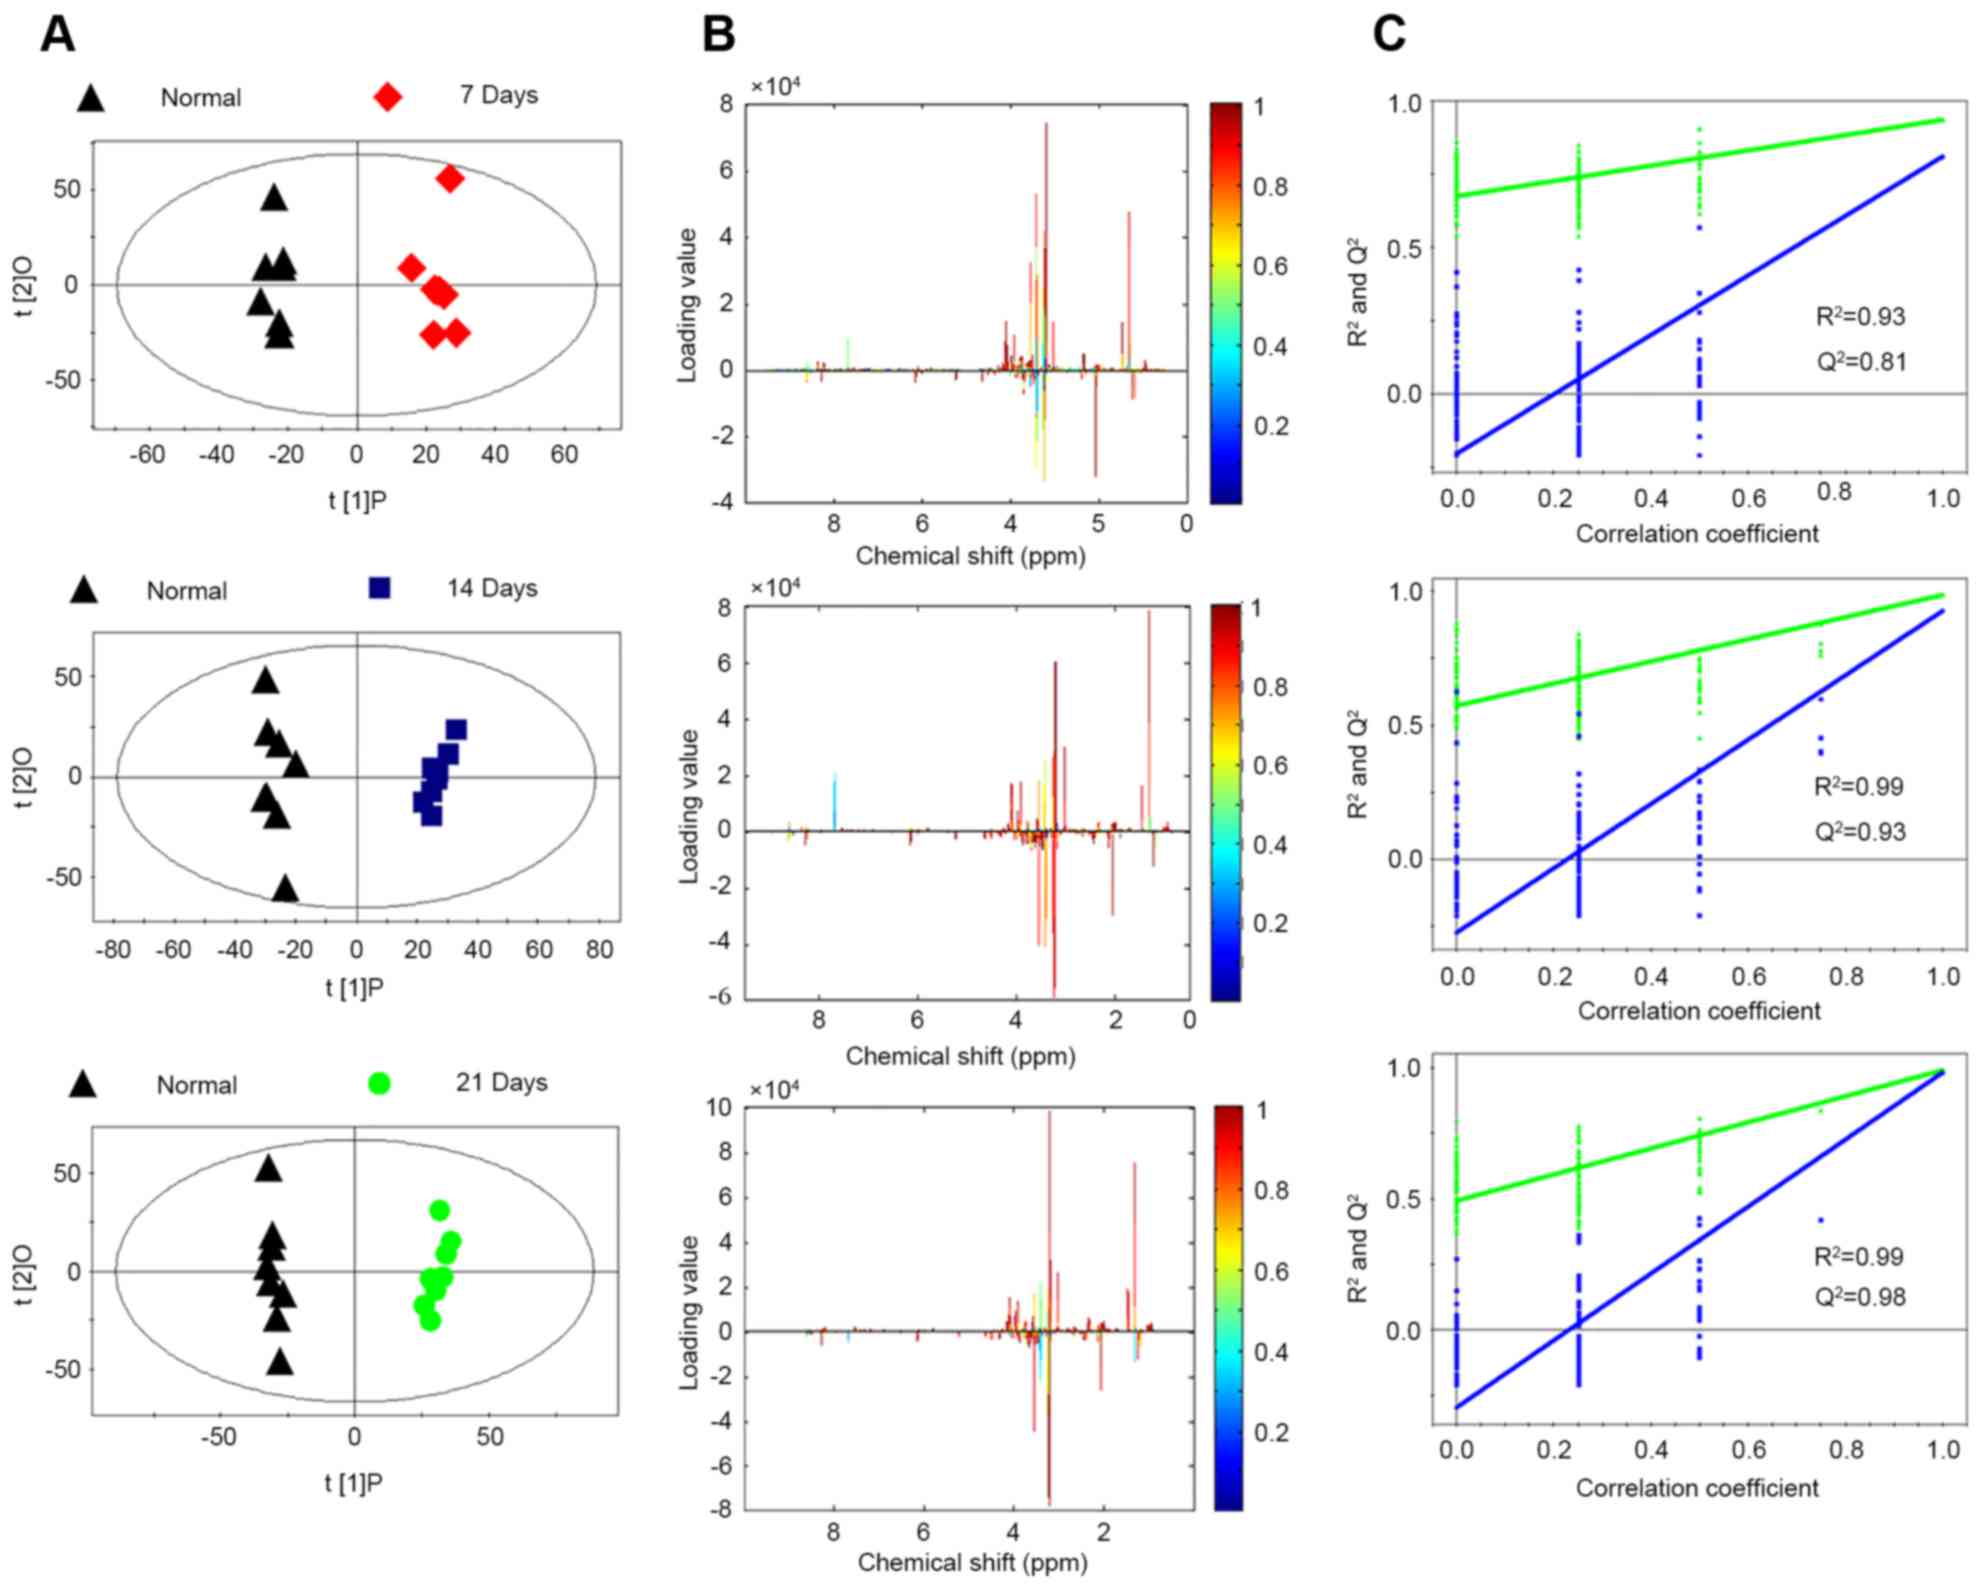
Identification of the different metabolites between
the normal and metastasis groups was critical for identifying
biomarkers that may be useful for diagnosis and therapy of colon
cancer patients who have lung metastasis. OPLS-DA analysis was used
to investigate differences in metabolites between the normal and
metastasis groups. The scores of PC1 and PC2 showed that each
metastasis group including 7, 14 and 21 days after injection were
clearly separated from the normal group (Fig. 2A). To identify the distinguishing
metabolites, their scores and loading plots were obtained from the
OPLS-DA analysis (Fig. 2B). The
loadings were colored according to the UV model variable weights
and the signals in the positive direction indicate upregulated
metabolites, the negative signals represent downregulated
metabolites in the metastasis groups compared to the normal group.
The PLS-DA model was applied and the statistical validation of the
corresponding PLS-DA model was carried out by permutation analysis.
The parameters of the different metastasis groups were as follows:
7 days, R2=0.92 Q2=0.84; 14 days,
R2=0.98 Q2=0.94; 21 days, R2=0.99
Q2=0.98 (Fig. 2C). The
results indicated that each model was suitable for data analysis.
We summarized the distinguishing metabolites between the normal and
metastasis groups (Tables I and
II).
 | Table I.Differential metabolites derived from
the OPLS-DA model of 1H-NMR analysis between the normal
control and metastasis groups. |
Table I.
Differential metabolites derived from
the OPLS-DA model of 1H-NMR analysis between the normal
control and metastasis groups.
|
|
|
|
| Normal vs.
metastasis groups |
|---|
|
|
|
|
|
|
|---|
| No. | Metabolite |
Multiplicitya | Chemical shift
(ppm) | VIPb |
P-valuec | FCd |
|---|
| 1 | VLDL: CH3-(CH2)n- | br | 0.89 | 1.68 | 0.0074 | –1.08 |
| 2 | Acetate | s | 1.93 | 1.67 | 0.0001 | 1.22 |
| 3 | Acetic acid | s | 2.08 | 2.29 | 0.0000 | 1.67 |
| 4 | Acetone | s | 2.23 | 1.27 | \ | –1.04 |
| 5 | Adenine | m | 8.12 | 1.01 | \ | –1.65 |
| 6 | Alanine | d | 1.48 | 1.96 | 0.0000 | 1.61 |
|
|
| d | 3.76 | 1.78 | 0.0018 | 1.06 |
| 7 | Arginine | t | 3.25 | 1.24 | \ | –1.11 |
| 8 |
CH2OCOR | m | 4.17 | 2.33 | 0.0000 | 1.73 |
| 9 | Choline | s | 3.2 | 1.52 | 0.0001 | 1.72 |
| 10 | Creatine | s | 3.04 | 2.02 | 0.0000 | 1.87 |
|
|
| s | 3.94 | 1.90 | 0.0000 | 1.49 |
| 11 | Dimethylamine | s | 2.73 | 2.04 | 0.0012 | –1.29 |
| 12 | D-ribose | s | 2.23 | 1.27 | \ | –1.04 |
| 13 | Ethanol | t | 1.19 | 1.53 | 0.0090 | –2.13 |
|
|
| q | 3.67 | 2.32 | 0.0000 | –1.32 |
| 14 | Formate | s | 8.45 | 1.42 | \ | –1.05 |
| 15 | Fumarate | s | 6.53 | 1.50 | \ | 1.19 |
| 16 | Glutamate | m | 2.35 | 2.01 | 0.0000 | 1.48 |
| 17 | Glutamine | m | 2.14 | 1.81 | 0.0001 | –1.05 |
|
|
| m | 2.45 | 2.05 | 0.0003 | –1.55 |
| 18 | Glutathione | m | 2.96 | 0.90 | \ | 1.16 |
| 19 | Glyceryl | m | 4.17 | 2.33 | 0.0000 | 1.73 |
| 20 | Glycine | s | 3.57 | 1.63 | 0.0492 | –1.04 |
| 21 | Glycolate | s | 3.93 | 1.90 | 0.0000 | 1.49 |
| 22 | Inosine | d | 6.11 | 1.99 | 0.0001 | 2.20 |
|
|
| s | 8.36 | \ | \ | 1.96 |
| 23 | Isoleucine | t | 0.95 | 2.10 | 0.0000 | 1.63 |
| 24 | Lactate | d | 1.33 | 2.12 | 0.0001 | 1.54 |
|
|
| q | 4.11 | 2.03 | 0.0000 | 2.06 |
| 25 | Leucine | t | 0.96 | 2.14 | 0.0000 | 1.78 |
|
|
| d | 1.01 | 2.09 | 0.0003 | 1.81 |
| 26 | Lysine | m | 3.77 | 1.78 | 0.0018 | 1.05 |
| 27 | N-acetyl
glycoprotein | s | 2.04 | 2.20 | 0.0000 | 1.55 |
| 28 | O-acetyl
glycoprotein | s | 2.07 | 1.86 | 0.0001 | –2.80 |
| 29 | Oxaloacetate | s | 2.35 | 2.01 | 0.0000 | 1.61 |
| 30 | Phosphochline | s | 3.21 | 1.52 | 0.0001 | 1.72 |
| 31 |
Phosphocreatine | s | 3.04 | 2.02 | 0.0000 | 1.87 |
|
|
| s | 3.93 | 1.90 | 0.0000 | 1.49 |
| 32 | p-HPA | s | 3.9 | 1.90 | 0.0000 | 1.49 |
|
|
| m | 7.28 | 1.72 | \ | 1.03 |
|
|
| d | 7.51 | 2.36 | 0.0000 | 5.00 |
|
|
| d | 7.71 | 1.95 | 0.0000 | 2.42 |
| 33 | Pyruvate | s | 2.37 | 1.80 | 0.0000 | 1.38 |
| 34 | Sarcosine | s | 2.75 | 1.83 | 0.0082 | –1.36 |
| 35 | Serine | m | 3.98 | 2.35 | 0.0000 | 1.45 |
| 36 | Succinate | s | 2.41 | 1.64 | 0.0102 | –1.63 |
| 37 | Taurine | t | 3.27 | 1.24 | \ | –1.11 |
|
|
| t | 3.43 | 1.24 | 0.0100 | –1.11 |
| 38 | Threonine | m | 4.24 | 2.00 | 0.0008 | 1.21 |
| 39 | Tyrosine | d | 6.9 | 2.15 | 0.0001 | 1.53 |
|
|
| d | 7.2 | 2.20 | 0.0000 | 1.48 |
| 40 | Uracil | d | 5.8 | 2.38 | 0.0000 | 12.15 |
|
|
| d | 7.54 | 2.36 | 0.0000 | 5.00 |
| 41 | Valine | d | 0.99 | 2.02 | 0.0000 | 1.43 |
|
|
| d | 1.05 | 2.21 | 0.0002 | 1.49 |
| 42 |
β-hydroxybutyrate | m | 4.16 | 2.33 | 0.0000 | 1.73 |
| Table II.Summary of the different metabolites
between each metastasis and normal group. |
Table II.
Summary of the different metabolites
between each metastasis and normal group.
|
|
|
| Normal vs. 7
days | Normal vs. 14
days | Normal vs. 21
days |
|---|
|
|
|
|
|
|
|
|---|
| Metabolite |
Multi-plicitya | Chemical shift
(ppm) | VIPb |
P-valuec | FCd | VIPb |
P-valuec | FCd | VIPb |
P-valuec | FCd |
|---|
| VLDL:
CH3-(CH2)n- | br | 0.89 | 1.41 | 0.034 | 1.07 | 1.75 | 0.001 | –1.21 | 1.50 | 0.002 | –1.14 |
| Acetate | s | 1.93 | 1.42 | 0.028 | 1.35 | 1.72 | 0.002 | 1.04 | 1.77 | <0.001 | 1.29 |
| Acetic acid | s | 2.08 | 1.86 | 0.002 | 1.39 | 2.11 | <0.001 | 1.61 | 2.00 | <0.001 | 2.05 |
| Acetone | s | 2.23 | 1.32 | 0.040 | 1.09 | 1.15 | 0.074 | –1.22 | 1.54 | 0.001 | –1.02 |
| Adenine | m | 8.12 | 1.21 | \ | –1.53 | 1.70 | 0.007 | –2.22 | 1.20 | 0.022 | –1.38 |
| Alanine | d | 1.48 | 2.21 | <0.001 | 1.42 | 1.78 | 0.001 | 1.62 | 1.83 | <0.001 | 1.82 |
|
| d | 3.76 | 1.86 | 0.003 | 1.08 | 1.96 | <0.001 | –1.01 | 1.76 | <0.001 | 1.12 |
| Arginine | t | 3.25 | 1.27 | \ | 1.07 | 1.74 | 0.001 | –1.29 | 1.14 | 0.028 | –1.19 |
|
CH2OCOR | m | 4.17 | 2.02 | <0.001 | 1.42 | 2.06 | <0.001 | 1.63 | 2.01 | <0.001 | 2.21 |
| Choline | s | 3.2 | 2.37 | <0.001 | 2.26 | 1.71 | 0.002 | 1.30 | 1.86 | <0.001 | 1.58 |
| Creatine | s | 3.04 | 1.80 | 0.004 | 1.42 | 2.17 | <0.001 | 2.07 | 1.86 | <0.001 | 2.14 |
|
| s | 3.94 | 1.86 | 0.002 | 1.35 | 2.04 | <0.001 | 1.58 | 1.88 | <0.001 | 1.55 |
| Dimethylamine | s | 2.73 | 1.82 | 0.009 | –1.04 | 2.08 | <0.001 | –1.71 | 1.78 | <0.001 | –1.29 |
| D-ribose | s | 2.23 | 1.32 | 0.040 | 1.09 | 1.15 | \ | –1.22 | 1.54 | 0.001 | –1.02 |
| Ethanol | t | 1.19 | 1.54 | 0.036 | –2.30 | 1.67 | 0.007 | –1.93 | 1.52 | 0.004 | –2.19 |
|
| q | 3.67 | 1.69 | 0.018 | –1.04 | 2.01 | <0.001 | –1.37 | 1.99 | <0.001 | –1.78 |
| Formate | s | 8.45 | 1.47 | 0.035 | –1.08 | 1.27 | \ | –1.05 | 1.29 | 0.012 | –1.02 |
| Fumarate | s | 6.53 | 1.96 | 0.001 | 1.33 | 1.51 | 0.007 | 1.06 | 1.73 | <0.001 | 1.18 |
| Glutamate | m | 2.35 | 2.11 | <0.001 | 1.44 | 1.69 | 0.002 | 1.35 | 1.88 | <0.001 | 1.73 |
| Glutamine | m | 2.14 | 1.56 | 0.013 | 1.07 | 2.14 | <0.001 | –1.19 | 1.80 | <0.001 | –1.04 |
|
| m | 2.45 | \ | \ | 1.03 | 2.19 | <0.001 | –2.18 | 1.98 | <0.001 | –2.33 |
| Glutathione | m | 2.96 | 1.87 | 0.002 | 1.29 | 1.25 | 0.038 | 1.08 | \ | \ | 1.10 |
| Glyceryl | m | 4.17 | 2.02 | <0.001 | 1.42 | 2.06 | <0.001 | 1.63 | 2.01 | <0.001 | 2.21 |
| Glycine | s | 3.57 | 1.65 | 0.008 | 1.28 | 1.64 | 0.003 | –1.24 | 1.79 | <0.001 | –1.28 |
| Glycolate | s | 3.93 | 1.86 | 0.002 | 1.35 | 2.04 | <0.001 | 1.58 | 1.88 | <0.001 | 1.55 |
| Inosine | d | 6.11 | 1.99 | 0.001 | 2.24 | 1.90 | <0.001 | 1.96 | 1.98 | <0.001 | 2.41 |
|
| s | 8.36 | 2.27 | <0.001 | 2.50 | 1.45 | 0.011 | 1.56 | 1.38 | 0.006 | 1.82 |
| Isoleucine | t | 0.95 | 2.09 | 0.001 | 1.48 | 1.88 | <0.001 | 1.56 | 1.89 | <0.001 | 1.88 |
| Lactate | d | 1.33 | 1.63 | 0.011 | 1.37 | 2.09 | <0.001 | 1.64 | 1.88 | <0.001 | 1.61 |
|
| q | 4.11 | 2.08 | <0.001 | 1.86 | 2.12 | <0.001 | 2.24 | 1.93 | <0.001 | 2.10 |
| Leucine | t | 0.96 | 2.11 | <0.001 | 1.55 | 1.88 | <0.001 | 1.71 | 1.89 | <0.001 | 2.12 |
|
| d | 1.01 | 1.72 | 0.009 | 1.50 | 1.80 | 0.001 | 1.75 | 1.90 | <0.001 | 2.22 |
| Lysine | m | 3.77 | 2.00 | <0.001 | 1.16 | 1.96 | <0.001 | –1.01 | 1.76 | <0.001 | 1.05 |
| N-acetyl
glycoprotein | s | 2.04 | 1.70 | 0.005 | 1.39 | 1.91 | <0.001 | 1.43 | 1.95 | <0.001 | 1.88 |
| O-acetyl
glycoprotein | s | 2.07 | 2.41 | <0.001 | –2.90 | 2.22 | <0.001 | –3.10 | 1.88 | <0.001 | –2.44 |
| Oxaloacetate | s | 2.35 | 1.96 | 0.001 | 1.37 | 1.67 | 0.002 | 1.50 | 1.88 | <0.001 | 1.94 |
| Phosphochline | s | 3.21 | 2.37 | <0.001 | 2.26 | 1.71 | 0.002 | 1.30 | 1.86 | <0.001 | 1.58 |
|
Phosphocreatine | s | 3.04 | 1.80 | 0.004 | 1.42 | 2.17 | <0.001 | 2.07 | 1.86 | <0.001 | 2.14 |
|
| s | 3.93 | 1.86 | 0.002 | 1.35 | 2.04 | <0.001 | 1.58 | 1.88 | <0.001 | 1.55 |
| p-HPA | s | 3.9 | 1.86 | 0.002 | 1.35 | 2.04 | <0.001 | 1.58 | 1.88 | <0.001 | 1.55 |
|
| m | 7.28 | 1.95 | 0.001 | 1.17 | 1.84 | 0.001 | –1.09 | 1.69 | <0.001 | 1.01 |
|
| d | 7.51 | 2.26 | <0.001 | 3.01 | 2.10 | <0.001 | 5.22 | 2.02 | <0.001 | 6.98 |
|
| d | 7.71 | 2.22 | <0.001 | 2.31 | 1.90 | <0.001 | 3.06 | 1.73 | <0.001 | 1.81 |
| Pyruvate | s | 2.37 | 2.09 | <0.001 | 1.30 | 1.71 | 0.001 | 1.26 | 1.81 | <0.001 | 1.62 |
| Sarcosine | s | 2.75 | 1.03 | \ | 1.02 | 1.92 | 0.001 | –2.10 | 1.57 | 0.003 | –1.44 |
| Serine | m | 3.98 | 2.31 | <0.001 | 1.30 | 2.07 | <0.001 | 1.40 | 2.04 | <0.001 | 1.67 |
| Succinate | s | 2.41 | 1.70 | 0.015 | –1.45 | 1.41 | 0.023 | –1.41 | 1.70 | 0.001 | –2.38 |
| Taurine | t | 3.27 | 1.27 | \ | 1.07 | 1.74 | 0.001 | –1.29 | 1.14 | 0.028 | –1.19 |
|
| t | 3.43 | 1.77 | 0.012 | 1.06 | 1.78 | 0.005 | –1.28 | 1.19 | 0.025 | –1.17 |
| Threonine | m | 4.24 | 1.77 | <0.001 | 1.14 | 2.06 | <0.001 | 1.12 | 1.91 | <0.001 | 1.39 |
| Tyrosine | d | 6.9 | 1.85 | 0.007 | 1.48 | 1.91 | <0.001 | 1.43 | 1.93 | <0.001 | 1.69 |
|
| d | 7.2 | 2.03 | <0.001 | 1.47 | 2.03 | <0.001 | 1.37 | 1.96 | <0.001 | 1.61 |
| Uracil | d | 5.8 | 2.24 | <0.001 | 6.29 | 2.16 | <0.001 | 12.44 | 2.06 | <0.001 | 18.43 |
|
| d | 7.54 | 2.26 | <0.001 | 3.01 | 2.10 | <0.001 | 5.22 | 2.02 | <0.001 | 6.98 |
| Valine | d | 0.99 | 1.49 | 0.018 | 1.24 | 1.68 | 0.003 | 1.43 | 1.87 | <0.001 | 1.65 |
|
| d | 1.05 | 1.59 | 0.011 | 1.21 | 1.78 | 0.001 | 1.42 | 1.93 | <0.001 | 1.89 |
|
β-hydroxybutyrate | m | 4.16 | 2.02 | <0.001 | 1.42 | 2.06 | <0.001 | 1.63 | 2.01 | <0.001 | 2.21 |
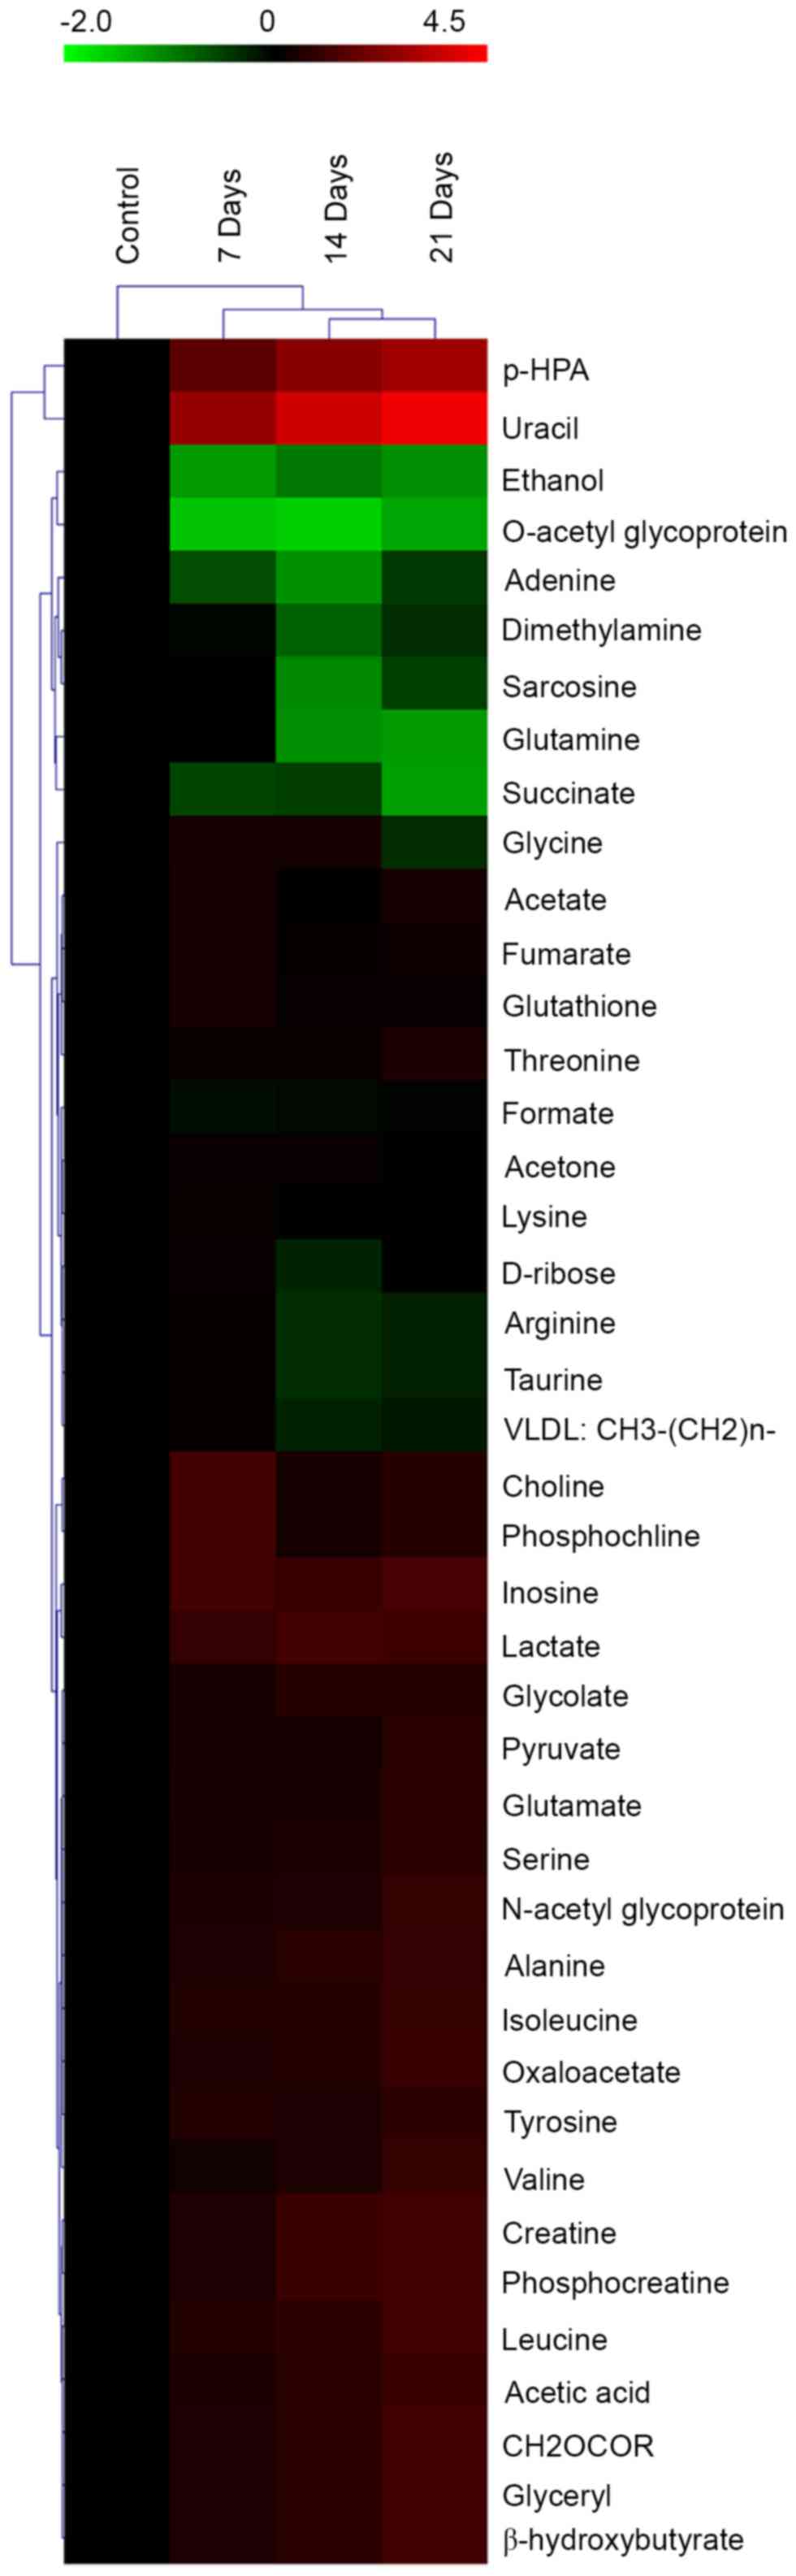
As shown in Table
II, acetic acid, choline, creatine, glutamate, glyceryl,
glycolate, inosine, isoleucine, lactate, leucine, N-acetyl
glycoprotein, oxaloacetate, phosphocholine (PC), phosphocreatine,
p-HPA, pyruvate, serine, threonine, tyrosine, uracil, valine
and β-hydroxybutyrate were upregulated in the metastasis groups
compared with the normal group. While dimethylamine, glutamine,
glycine, O-acetyl glycoprotein, sarcosine and succinate were
downregulated in the metastasis groups. Many of them increased
along with the stage of metastasis. Choline and PC were
significantly high in the 7 day group. In addition, O-acetyl
glycoprotein decreased obviously with a fold-change (FC) >2.5 in
each metastasis group compared to the normal group.
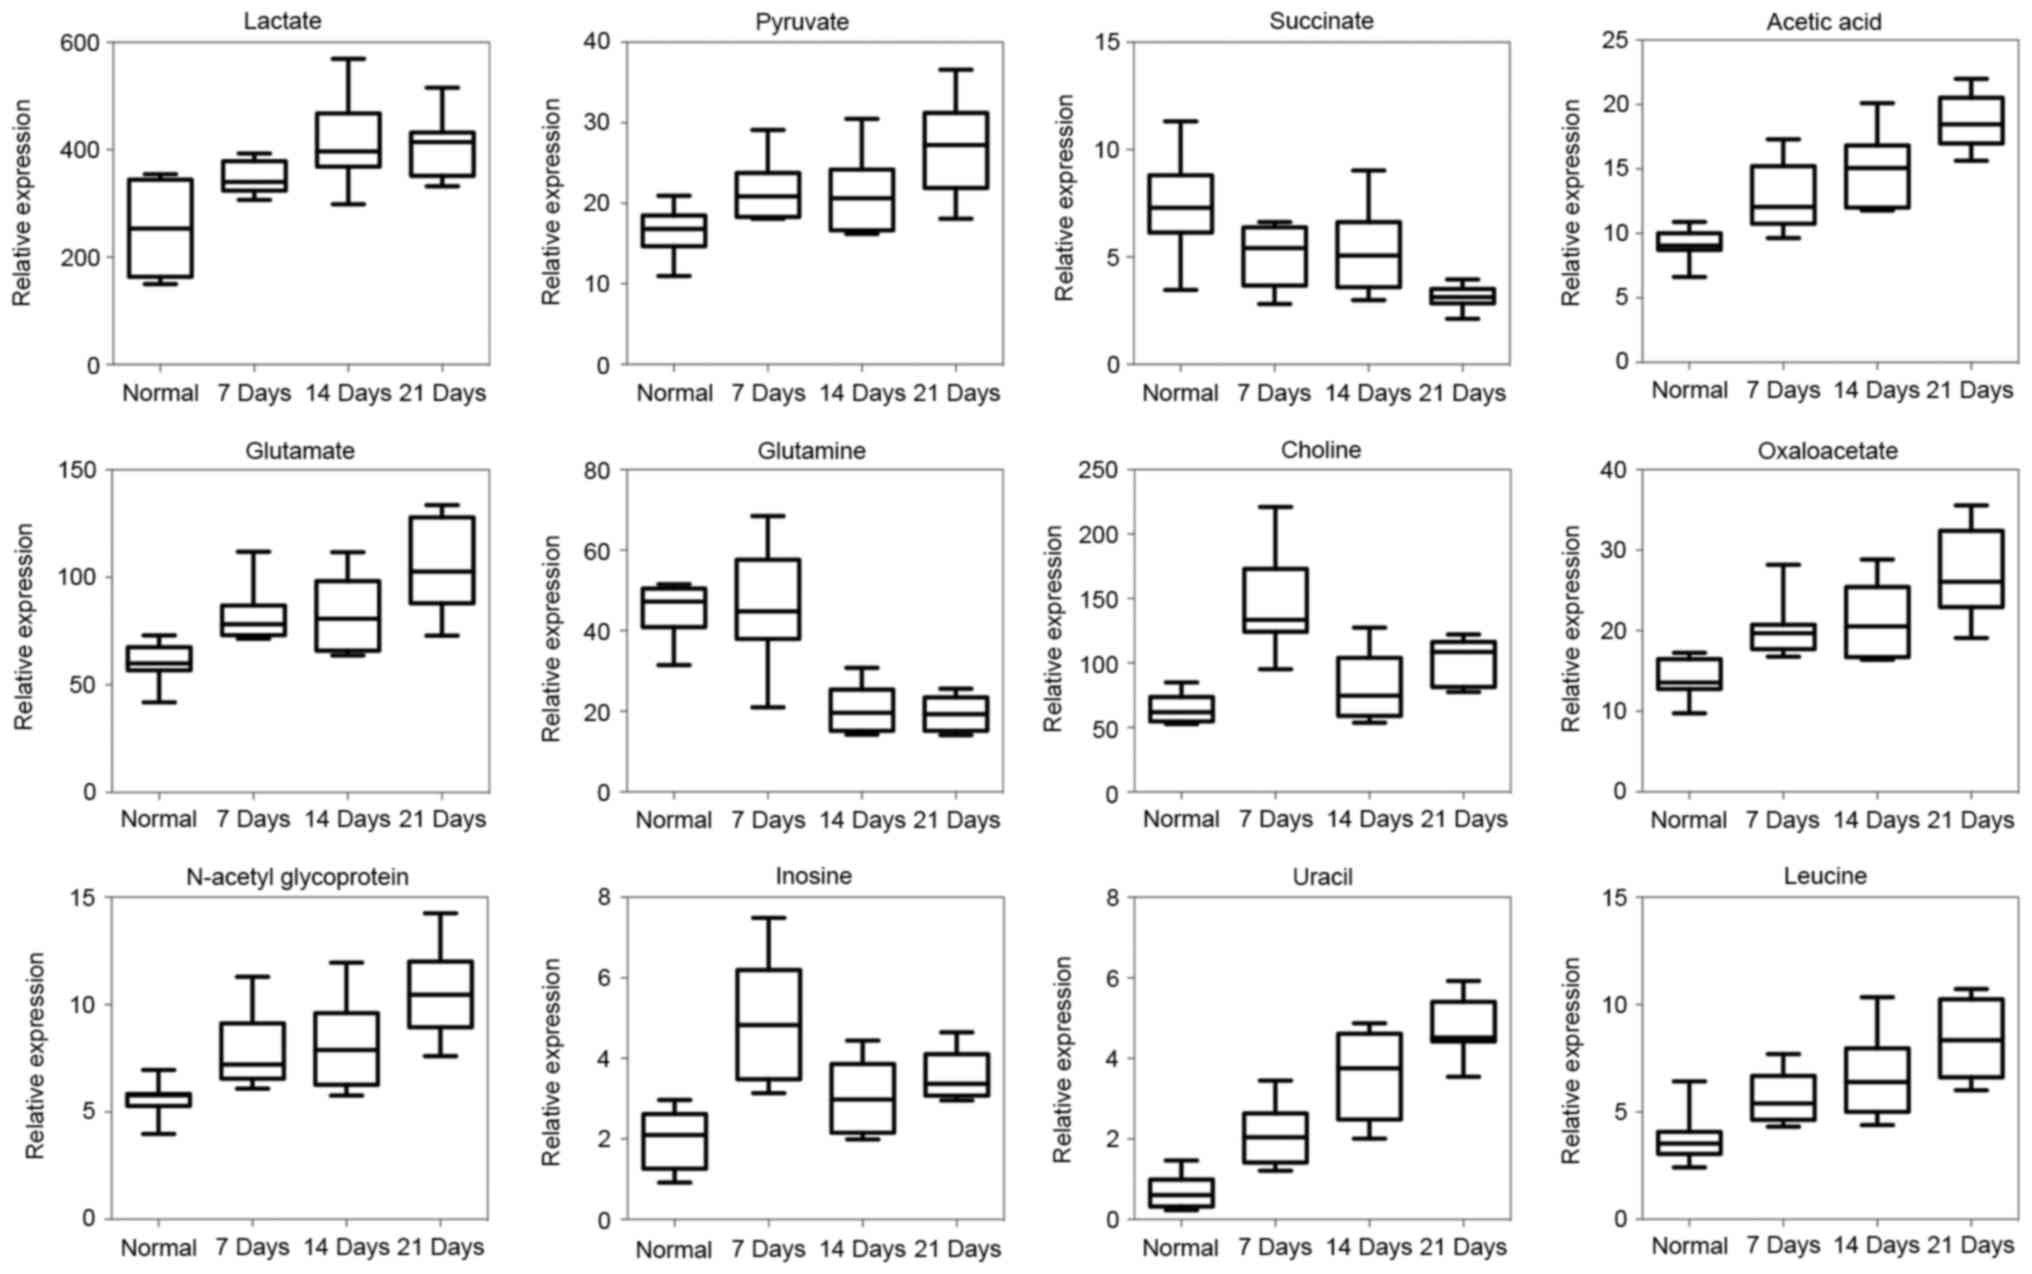
Trending biomarkers
Biomarker identification is important for the
detection, diagnosis and treatment of cancer, and is also
meaningful to investigate the metastatic process of colon cancer to
the lung. We used box-and-whisker plots, which included the
concentration ranges, median quartiles and extremes to show the
representative metabolites of the previously identified 42
metabolites between the normal and metastasis groups (Fig. 3). A heat map showing the relative
abundances of the metabolites is shown in Fig. 4.
Most cancer cells prefer the glycolysis pathway to
generate energy even with an adequate oxygen supply; thus, the
increased level of lactate in the tumor tissue was not surprising.
Furthermore, research has shown that a high lactate concentration
is associated with metastasis of tumors consistent with the present
study (24,25). Pyruvate, an important product of
glycolysis, is increased along with the progression of colon cancer
metastasis to the lung, which is a good indicator of active
glycogenolysis and glycolysis. Oxaloacetate was also found to be
upregulated, which may be due to the activity of pyruvate
carboxylase catalyzing the pyruvate which is converted to
oxaloacetate. Meanwhile, succinate was obviously downregulated,
which suggests that dysregulation of the TCA cycle may be
correlated with the lung metastasis of colorectal cancer.
In the present study, glutamate was significantly
increased in the metastasis group compared with that in the normal
group. It has been reported that glutamate is upregulated in many
types of cancers and high levels of glutamate may be associated
with the activation of glutaminolysis, due to an increased activity
of the mitochondrial enzyme glutaminase in metastatic tumors. In
addition, research has shown that glutamate levels are increased in
pancreatic cancer, which can promote invasion and migration ability
via AMPA receptor activation and Kras-MAPK signaling (26). Thus, elevated glutamate levels may
contribute to the metastasis of colon cancer and glutamate can be a
biomarker for the detection of lung metastasis derived from colon.
Due to the activation of glutaminolysis, glutamine is consumed and
utilized by colon tumors at much higher rates than other amino
acids; thus, glutamine was found to be obviously downregulated in
the metastasis group in our research.
As previously mentioned, there are only 3 literature
studies that have reported NMR-based metabonomics of metastatic
tumors and our results are partly consistent with previous studies.
Choline, a basic constituent of lecithin was upregulated in our
research owing to an increased rate of metabolism of phospholipids
to lipids, or a greater demand for phospholipids to encourage rapid
proliferation and aggression of colon cancer cells (27). Wang et al analyzed the
metabonomics of hepatocellular carcinoma with lung metastasis (HLM)
rat models and found that choline was increased in HLM rat models
compared with the control group (16).
The concentration of N-acetyl glycoproteins
in the metastasis groups was higher than that noted in the
non-metastasis group and was elevated significantly along with
progression. This result was consistent with a previous study
concerning advanced metastatic human breast cancer (11). The obvious upregulation of uracil in
tissues demonstrated the activation of transcriptions in the
process of metastasis to meet the needs of rapid cell
proliferation. Then, the high concentration of inosine indicated
that the purine metabolism was active in metastatic progression.
Leucine, isoleucine and serine were increased in the metastasis
group compared with the normal group that satisfy the requirements
for structural proteins of cancer cells in metastasis.
Discussion
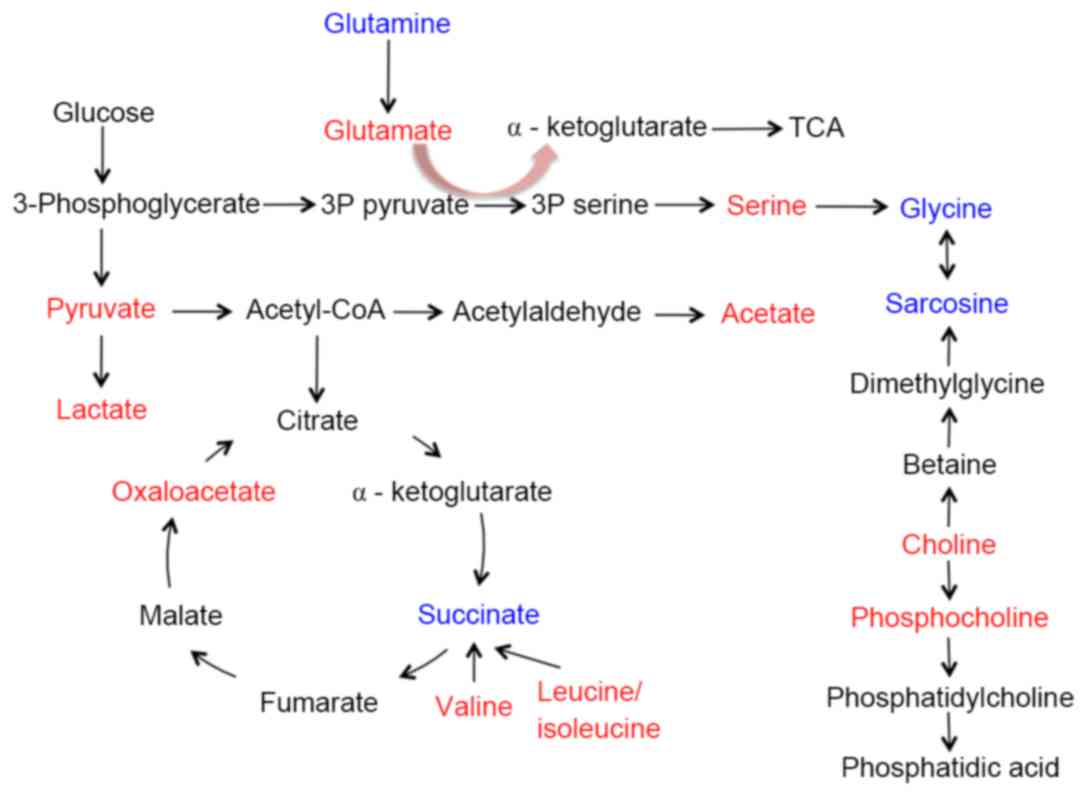
In the present study, we investigated the metabolic
profiling of mouse colorectal cancer with lung metastasis based on
1H-NMR. Forty-two different metabolites were identified
and some of them were significantly correlated with the progression
of colorectal cancer metastasis to the lung. We summarized the
metabolic pathways based on human metabolome database and the Kyoto
Encyclopedia of Genes and Genomes (KEGG) and the main disordered
pathways included glycolysis, TCA cycle, glutaminolysis, choline
metabolism and serine biosynthesis (Fig. 5). To the best of our knowledge,
little research has focused on the metabolic profiling of
colorectal cancer with lung metastasis. The present study is the
first to identify the different metabolites in the lung tissues
during the process of metastasis.
We detected metabolites of whole lung between the
metastasis groups and normal group due to the ‘seed and soil’
hypothesis which was proposed by Paget early in 1889 (28). It is well known that sites of
metastasis are determined not only by the characteristics of the
primary tumor cells, but also by the microenvironment of host
tissues (29). Therapy for
metastasis should be targeted not only against the cancer cells
themselves, but also against the homeostatic factors that promote
tumor-cell invasion and metastasis in the tumor microenvironment of
specific organs (30). Colorectal
cancer patients often develop liver and lung metastasis probably
due to the fact that these organs provide suitable soil for colon
cancer cell colonization. The change in microenvironment may lead
to the disorder of metabolism and we found that the metabolites of
whole lung tissue could better reflect the change in the
microenvironment during the process of metastasis.
Otto Warburg first observed the alteration of cancer
cell metabolism early in 1921. He found that most cancer cells
prefer to use glucose at a high level and convert it to lactate
instead of relying on mitochondrial oxidative phosphorylation to
generate energy even in the presence of abundant oxygen. This is
termed the ‘Warburg effect’ (31).
Recent studies show that aerobic glycolysis is not only crucial for
tumor cell growth, but also essential for tumor cell migration and
invasion, which is consistent with the results that the lactate
level was significantly high in the metastasis groups. Research has
reported that lactate induces secretion of hyaluronan by
tumor-associated fibroblasts which create a milieu favorable for
migration that benefits tumor metastasis. The high level
concentration of lactate leads to normal cell death via
caspase-mediated activation of the p53-dependent apoptotic pathway
(32), but cancer cells can export
lactate by monocarboxylate transporters (MCTs) resulting in the
acidification of the microenvironment (33). The low pH of the extracellular
environment provides a favorable condition for the activation of
proteases, such as matrix metalloproteinases (MMPs) (34), which in turn can help cancer cells
degrade the extracellular matrix (ECM) and facilitate metastasis
(35). Thus, aerobic glycolysis may
increase cancer cell migration and invasiveness due to the
disturbance of the microenvironment which is beneficial for their
proliferation and metastasis but toxic to normal cells (36). Therefore, the increased lactate in
lung tissues could benefit the metastatic ability of colorectal
cancer cells.
Pyruvate, the end product of glycolysis, was
upregulated in our research and a previous study showed that
pyruvate promotes cancer cell metastasis. Anoikis resistance, or
the ability of cells to live detached from the EMC, is a property
of epithelial cancers. Caneba et al found higher pyruvate
uptake and oxygen consumption in more invasive ovarian cancer cells
than their less invasive counterparts under detached conditions,
and pyruvate has an effect on highly invasive ovarian cancer cell
migration ability (37).
However, increased aerobic glycolysis, enhanced
glutamine metabolism is now considered a key feature of cancer
cells and contributes to cancer cell migration. Our research showed
moderate downregulation of glutamine and upregulation of glutamate
in lung tissues in the metastasis groups compared with the normal
group. In cancer cells, glutamine is catabolized to glutamate by
glutaminase. Glutamate is then catabolized by glutamate
dehydrogenase to α-ketoglutarate to feed the TCA cycle (38). Recent studies suggest that glutamine
metabolism contributes to cancer cell migration. Glutamine can
support lipogenesis by providing both acetyl-CoA and NADPH, which,
in turn, regulates the activation of AKT (39), and the AKT pathway is involved in
the migratory and invasive abilities of many cancer cell lines
(40,41). In malignant glioma, a high
extracellular concentration of glutamate is released, and released
glutamate acts as an essential autocrine/paracrine signal that
promotes cell invasion (42).
Glutamate was also found to promote invasion and migration of
pancreatic cancer cells via AMPA receptor activation and K-ras-MAPK
signaling (26). Thus,
downregulation of glutamine and upregulation of glutamate in the
present study was consistent with above study, and may play an
important role in lung metastasis in colorectal cancer.
Abnormal choline metabolism is emerging as a
metabolic hallmark that is associated with oncogenesis and tumor
progression (43). In the present
study, two-choline metabolism pathway-related metabolites
(choline/phosphocholine) were upregulated. Previous studies have
reported the correlation of choline metabolism, cancer metastasis
including breast cancer (44) and
hepatocellular carcinoma (16), and
malignant transformation (43).
Choline is an essential nutrient transported by choline
transporters from plasma to cells that can be a rate-limiting step
in phosphocholine formation. Phosphocholine is synthesized to
phosphatidylcholine, which together with other phospholipids form
the characteristic bilayer structure of cellular membranes and
regulates membrane integrity (45).
When highly malignant breast cancer cells were transfected with
metastasis suppressor gene nm23 (46,47),
it was found that the ratio of phosphocholine/glycerocholine was
lower than that of the empty vector-transfected cells, also an
increase of phosphocholine level was detected in NIH 3T3 cells
transfected with mutant ras oncogene (48). Thus, upregulation of choline and
phosphocholine in our research may be due to the activating genes
that control cell metastasis in the process of metastasis.
The results from our studies showed that serine
biosynthesis was also involved in the process of colorectal cancer
metastasis to the lung, with the serine concentration in the
metastasis groups higher than that in the normal group. A study of
Pollari et al suggested that 3 genes involved in the
L-serine biosynthesis pathway, phosphoglycerate dehydrogenase
(PHGDH), phosphoserine aminotransferase 1 (PSAT1) and phosphoserine
phosphatase (PSPH) were upregulated in highly metastatic breast
cancer cells, which is in agreement with our research (49). PHGDH, which catalyses the first step
in the serine biosynthesis pathway, is elevated in 70% of estrogen
receptor (ER)-negative breast cancers suggesting that serine
biosynthesis is active in malignant tumors (50). Ectopic expression of PHGDH in
mammary epithelial cells was found to disrupt acinar morphogenesis
and induce other phenotypic alterations that may predispose cells
to transformation (51). Similarly,
glycine and related metabolites, or their associated metabolic
pathways, have been identified as central to cancer metastasis
(52) and cellular transformation
(50,53).
In addition, we observed the upregulation of
leucine, isoleucine and valine in the metastasis group relative to
the normal group, which is consistent with published literature
that reported decreased expression for genes involved in valine,
leucine and isoleucine degradation in metastatic colon cancer
(54). However, glucose,
branched-chain amino acids (BCCAs) including valine, leucine and
isoleucine can serve as energy substrates either (38) in brain interstitial space with lower
glucose level than that of blood or when glucose is limited some
cells can use amino acids to support their survival (55). Thus, the upregulation of BCCAs in
our finding may be due to the rapid consumption of glucose, which
meets the energy supply during lung metastasis progression. It is
also reported that, BCCAs, particularly leucine, enhance tumor
invasiveness through activation of the mammalian target of
rapamycin complex 1 (mTORC1). Thus, the increase in BCCAs in the
lung may provide a suitable microenvironment for metastatic
processes.
In conclusion, in the present study, we analyzed the
metabolic profiling of colorectal cancer with lung metastasis
compared with a normal control based on 1H-NMR
spectroscopy combined with multivariate statistical analysis in a
mouse model. We identified the distinguishing metabolites and found
that metabolic pathways such as glycolysis, TCA cycle,
glutaminolysis, choline metabolism and serine biosynthesis, may be
involved in the process of metastasis. The present study provides
evidence that tumor metabolism regulation plays a critical role in
tumor metastasis; the underlying aberrant metabolic pathways could
be considered as novel targets for cancer therapy.
Acknowledgements
The present study was supported by the Project of
the National Natural Sciences Foundation of China (nos. 81272459
and 81322035).
Glossary
Abbreviations
Abbreviations:
|
1H-NMR
|
1H nuclear magnetic
resonance
|
|
PCA
|
principal component analysis
|
|
PLS-DA
|
partial least squares discriminant
analysis
|
|
OPLS-DA
|
orthogonal partial least squares
discriminant analysis
|
|
TCA
|
tricarboxylic acid cycle
|
|
CSCs
|
cancer stem cells
|
|
PC
|
phosphocholine
|
|
FC
|
fold-change
|
References
|
1
|
Siegel R, Ma J, Zou Z and Jemal A: Cancer
statistics, 2014. CA Cancer J Clin. 64:9–29. 2014. View Article : Google Scholar : PubMed/NCBI
|
|
2
|
Mitry E, Guiu B, Cosconea S, Jooste V,
Faivre J and Bouvier AM: Epidemiology, management and prognosis of
colorectal cancer with lung metastases: A 30-year population-based
study. Gut. 59:1383–1388. 2010. View Article : Google Scholar : PubMed/NCBI
|
|
3
|
Gorlick R, Metzger R, Danenberg KD,
Salonga D, Miles JS, Longo GS, Fu J, Banerjee D, Klimstra D,
Jhanwar S, et al: Higher levels of thymidylate synthase gene
expression are observed in pulmonary as compared with hepatic
metastases of colorectal adenocarcinoma. J Clin Oncol.
16:1465–1469. 1998. View Article : Google Scholar : PubMed/NCBI
|
|
4
|
Banerjee D, Gorlick R, Liefshitz A,
Danenberg K, Danenberg PC, Danenberg PV, Klimstra D, Jhanwar S,
Cordon-Cardo C, Fong Y, et al: Levels of E2F-1 expression are
higher in lung metastasis of colon cancer as compared with hepatic
metastasis and correlate with levels of thymidylate synthase.
Cancer Res. 60:2365–2367. 2000.PubMed/NCBI
|
|
5
|
Huang K, Yuan R, Wang K, Hu J, Huang Z,
Yan C, Shen W and Shao J: Overexpression of HOXB9 promotes
metastasis and indicates poor prognosis in colon cancer. Chin J
Cancer Res. 26:72–80. 2014.PubMed/NCBI
|
|
6
|
Visvader JE and Lindeman GJ: Cancer stem
cells in solid tumours: Accumulating evidence and unresolved
questions. Nat Rev Cancer. 8:755–768. 2008. View Article : Google Scholar : PubMed/NCBI
|
|
7
|
Al-Hajj M and Clarke MF: Self-renewal and
solid tumor stem cells. Oncogene. 23:7274–7282. 2004. View Article : Google Scholar : PubMed/NCBI
|
|
8
|
Gao W, Chen L, Ma Z, Du Z, Zhao Z, Hu Z
and Li Q: Isolation and phenotypic characterization of colorectal
cancer stem cells with organ-specific metastatic potential.
Gastroenterology. 145:636–46.e5. 2013. View Article : Google Scholar : PubMed/NCBI
|
|
9
|
Kaddurah-Daouk R, Kristal BS and
Weinshilboum RM: Metabolomics: A global biochemical approach to
drug response and disease. Annu Rev Pharmacol Toxicol. 48:653–683.
2008. View Article : Google Scholar : PubMed/NCBI
|
|
10
|
Jung J, Jung Y, Bang EJ, Cho SI, Jang YJ,
Kwak JM, Ryu DH, Park S and Hwang GS: Noninvasive diagnosis and
evaluation of curative surgery for gastric cancer using NMR-based
metabolomic profiling. Ann Surg Oncol. 21 Suppl 4:S736–S742. 2014.
View Article : Google Scholar : PubMed/NCBI
|
|
11
|
Jobard E, Pontoizeau C, Blaise BJ,
Bachelot T, Elena-Herrmann B and Trédan O: A serum nuclear magnetic
resonance-based metabolomic signature of advanced metastatic human
breast cancer. Cancer Lett. 343:33–41. 2014. View Article : Google Scholar : PubMed/NCBI
|
|
12
|
Wang L, Chen J, Chen L, Deng P, Bu Q,
Xiang P, Li M, Lu W, Xu Y, Lin H, et al: 1H-NMR based
metabonomic profiling of human esophageal cancer tissue. Mol
Cancer. 12:252013. View Article : Google Scholar : PubMed/NCBI
|
|
13
|
Wang H, Wang L, Zhang H, Deng P, Chen J,
Zhou B, Hu J, Zou J, Lu W, Xiang P, et al: ¹H NMR-based metabolic
profiling of human rectal cancer tissue. Mol Cancer. 12:1212013.
View Article : Google Scholar : PubMed/NCBI
|
|
14
|
Farshidfar F, Weljie AM, Kopciuk K, Buie
WD, Maclean A, Dixon E, Sutherland FR, Molckovsky A, Vogel HJ and
Bathe OF: Serum metabolomic profile as a means to distinguish stage
of colorectal cancer. Genome Med. 4:422012. View Article : Google Scholar : PubMed/NCBI
|
|
15
|
Cao M, Zhao L, Chen H, Xue W and Lin D:
NMR-based metabolomic analysis of human bladder cancer. Anal Sci.
28:451–456. 2012. View Article : Google Scholar : PubMed/NCBI
|
|
16
|
Wang J, Zhang S, Li Z, Yang J, Huang C,
Liang R, Liu Z and Zhou R: 1H-NMR-based metabolomics of
tumor tissue for the metabolic characterization of rat
hepatocellular carcinoma formation and metastasis. Tumour Biol.
32:223–231. 2011. View Article : Google Scholar : PubMed/NCBI
|
|
17
|
Gao H, Dong B, Jia J, Zhu H, Diao C, Yan
Z, Huang Y and Li X: Application of ex vivo 1H NMR
metabonomics to the characterization and possible detection of
renal cell carcinoma metastases. J Cancer Res Clin Oncol.
138:753–761. 2012. View Article : Google Scholar : PubMed/NCBI
|
|
18
|
Beckonert O, Keun HC, Ebbels TM, Bundy J,
Holmes E, Lindon JC and Nicholson JK: Metabolic profiling,
metabolomic and metabonomic procedures for NMR spectroscopy of
urine, plasma, serum and tissue extracts. Nat Protoc. 2:2692–2703.
2007. View Article : Google Scholar : PubMed/NCBI
|
|
19
|
Hu Z, Deng Y, Hu C, Deng P, Bu Q, Yan G,
Zhou J, Shao X, Zhao J, Li Y, et al: ¹H NMR-based metabonomic
analysis of brain in rats of morphine dependence and withdrawal
intervention. Behav Brain Res. 231:11–19. 2012. View Article : Google Scholar : PubMed/NCBI
|
|
20
|
Trygg J, Holmes E and Lundstedt T:
Chemometrics in metabonomics. J Proteome Res. 6:469–479. 2007.
View Article : Google Scholar : PubMed/NCBI
|
|
21
|
Martin FP, Wang Y, Sprenger N, Yap IK,
Lundstedt T, Lek P, Rezzi S, Ramadan Z, van Bladeren P, Fay LB, et
al: Probiotic modulation of symbiotic gut microbial-host metabolic
interactions in a humanized microbiome mouse model. Mol Syst Biol.
4:1572008. View Article : Google Scholar : PubMed/NCBI
|
|
22
|
Jansson J, Willing B, Lucio M, Fekete A,
Dicksved J, Halfvarson J, Tysk C and Schmitt-Kopplin P:
Metabolomics reveals metabolic biomarkers of Crohn's disease. PLoS
One. 4:e63862009. View Article : Google Scholar : PubMed/NCBI
|
|
23
|
Lai HS, Lee JC, Lee PH, Wang ST and Chen
WJ: Plasma free amino acid profile in cancer patients. Semin Cancer
Biol. 15:267–276. 2005. View Article : Google Scholar : PubMed/NCBI
|
|
24
|
Brizel DM, Schroeder T, Scher RL, Walenta
S, Clough RW, Dewhirst MW and Mueller-Klieser W: Elevated tumor
lactate concentrations predict for an increased risk of metastases
in head-and-neck cancer. Int J Radiat Oncol Biol Phys. 51:349–353.
2001. View Article : Google Scholar : PubMed/NCBI
|
|
25
|
Walenta S, Schroeder T and Mueller-Klieser
W: Lactate in solid malignant tumors: Potential basis of a
metabolic classification in clinical oncology. Curr Med Chem.
11:2195–2204. 2004. View Article : Google Scholar : PubMed/NCBI
|
|
26
|
Herner A, Sauliunaite D, Michalski CW,
Erkan M, De Oliveira T, Abiatari I, Kong B, Esposito I, Friess H
and Kleeff J: Glutamate increases pancreatic cancer cell invasion
and migration via AMPA receptor activation and Kras-MAPK signaling.
Int J Cancer. 129:2349–2359. 2011. View Article : Google Scholar : PubMed/NCBI
|
|
27
|
Morse DL, Carroll D, Day S, Gray H,
Sadarangani P, Murthi S, Job C, Baggett B, Raghunand N and Gillies
RJ: Characterization of breast cancers and therapy response by MRS
and quantitative gene expression profiling in the choline pathway.
NMR Biomed. 22:114–127. 2009. View Article : Google Scholar : PubMed/NCBI
|
|
28
|
Paget S: The distribution of secondary
growths in cancer of the breast. 1889. Cancer Metastasis Rev.
8:98–101. 1989.PubMed/NCBI
|
|
29
|
Hart IR and Fidler IJ: Role of organ
selectivity in the determination of metastatic patterns of B16
melanoma. Cancer Res. 40:2281–2287. 1980.PubMed/NCBI
|
|
30
|
Fidler IJ: The pathogenesis of cancer
metastasis: The ‘seed and soil’ hypothesis revisited. Nat Rev
Cancer. 3:453–458. 2003. View Article : Google Scholar : PubMed/NCBI
|
|
31
|
Warburg O, Wind F and Negelein E: The
metabolism of tumors in the body. J Gen Physiol. 8:519–530. 1927.
View Article : Google Scholar : PubMed/NCBI
|
|
32
|
Williams AC, Collard TJ and Paraskeva C:
An acidic environment leads to p53 dependent induction of apoptosis
in human adenoma and carcinoma cell lines: Implications for clonal
selection during colorectal carcinogenesis. Oncogene. 18:3199–3204.
1999. View Article : Google Scholar : PubMed/NCBI
|
|
33
|
Porporato PE, Dhup S, Dadhich RK, Copetti
T and Sonveaux P: Anticancer targets in the glycolytic metabolism
of tumors: A comprehensive review. Front Pharmacol. 2:492011.
View Article : Google Scholar : PubMed/NCBI
|
|
34
|
Lardner A: The effects of extracellular pH
on immune function. J Leukoc Biol. 69:522–530. 2001.PubMed/NCBI
|
|
35
|
Gatenby RA, Gawlinski ET, Gmitro AF,
Kaylor B and Gillies RJ: Acid-mediated tumor invasion: A
multidisciplinary study. Cancer Res. 66:5216–5223. 2006. View Article : Google Scholar : PubMed/NCBI
|
|
36
|
Han T, Kang D, Ji D, Wang X, Zhan W, Fu M,
Xin HB and Wang JB: How does cancer cell metabolism affect tumor
migration and invasion? Cell Adhes Migr. 7:395–403. 2013.
View Article : Google Scholar
|
|
37
|
Caneba CA, Bellance N, Yang L, Pabst L and
Nagrath D: Pyruvate uptake is increased in highly invasive ovarian
cancer cells under anoikis conditions for anaplerosis,
mitochondrial function, and migration. Am J Physiol Endocrinol
Metab. 303:E1036–E1052. 2012. View Article : Google Scholar : PubMed/NCBI
|
|
38
|
DeBerardinis RJ, Mancuso A, Daikhin E,
Nissim I, Yudkoff M, Wehrli S and Thompson CB: Beyond aerobic
glycolysis: Transformed cells can engage in glutamine metabolism
that exceeds the requirement for protein and nucleotide synthesis.
Proc Natl Acad Sci USA. 104:pp. 19345–19350. 2007; View Article : Google Scholar : PubMed/NCBI
|
|
39
|
Wang HQ, Altomare DA, Skele KL, Poulikakos
PI, Kuhajda FP, Di Cristofano A and Testa JR: Positive feedback
regulation between AKT activation and fatty acid synthase
expression in ovarian carcinoma cells. Oncogene. 24:3574–3582.
2005. View Article : Google Scholar : PubMed/NCBI
|
|
40
|
Shih MC, Chen JY, Wu YC, Jan YH, Yang BM,
Lu PJ, Cheng HC, Huang MS, Yang CJ, Hsiao M, et al: TOPK/PBK
promotes cell migration via modulation of the PI3K/PTEN/AKT pathway
and is associated with poor prognosis in lung cancer. Oncogene.
31:2389–2400. 2012. View Article : Google Scholar : PubMed/NCBI
|
|
41
|
Walker L, Millena AC, Strong N and Khan
SA: Expression of TGFβ3 and its effects on migratory and invasive
behavior of prostate cancer cells: Involvement of PI3-kinase/AKT
signaling pathway. Clin Exp Metastasis. 30:13–23. 2013. View Article : Google Scholar : PubMed/NCBI
|
|
42
|
Ishiuchi S, Tsuzuki K, Yoshida Y, Yamada
N, Hagimura N, Okado H, Miwa A, Kurihara H, Nakazato Y, Tamura M,
et al: Blockage of Ca2+-permeable AMPA receptors
suppresses migration and induces apoptosis in human glioblastoma
cells. Nat Med. 8:971–978. 2002. View
Article : Google Scholar : PubMed/NCBI
|
|
43
|
Glunde K, Bhujwalla ZM and Ronen SM:
Choline metabolism in malignant transformation. Nat Rev Cancer.
11:835–848. 2011.PubMed/NCBI
|
|
44
|
Gadiya M, Mori N, Cao MD, Mironchik Y,
Kakkad S, Gribbestad IS, Glunde K, Krishnamachary B and Bhujwalla
ZM: Phospholipase D1 and choline kinase-α are interactive targets
in breast cancer. Cancer Biol Ther. 15:593–601. 2014. View Article : Google Scholar : PubMed/NCBI
|
|
45
|
Mountford CE and Wright LC: Organization
of lipids in the plasma membranes of malignant and stimulated
cells: A new model. Trends Biochem Sci. 13:172–177. 1988.
View Article : Google Scholar : PubMed/NCBI
|
|
46
|
Bhujwalla ZM, Aboagye EO, Gillies RJ,
Chacko VP, Mendola CE and Backer JM: Nm23-transfected MDA-MB-435
human breast carcinoma cells form tumors with altered phospholipid
metabolism and pH: A 31P nuclear magnetic resonance
study in vivo and in vitro. Magn Reson Med. 41:897–903. 1999.
View Article : Google Scholar : PubMed/NCBI
|
|
47
|
Glunde K, Jacobs MA and Bhujwalla ZM:
Choline metabolism in cancer: Implications for diagnosis and
therapy. Expert Rev Mol Diagn. 6:821–829. 2006. View Article : Google Scholar : PubMed/NCBI
|
|
48
|
Ronen SM, Jackson LE, Beloueche M and
Leach MO: Magnetic resonance detects changes in phosphocholine
associated with Ras activation and inhibition in NIH 3T3 cells. Br
J Cancer. 84:691–696. 2001. View Article : Google Scholar : PubMed/NCBI
|
|
49
|
Pollari S, Käkönen SM, Edgren H, Wolf M,
Kohonen P, Sara H, Guise T, Nees M and Kallioniemi O: Enhanced
serine production by bone metastatic breast cancer cells stimulates
osteoclastogenesis. Breast Cancer Res Treat. 125:421–430. 2011.
View Article : Google Scholar : PubMed/NCBI
|
|
50
|
Possemato R, Marks KM, Shaul YD, Pacold
ME, Kim D, Birsoy K, Sethumadhavan S, Woo HK, Jang HG, Jha AK, et
al: Functional genomics reveal that the serine synthesis pathway is
essential in breast cancer. Nature. 476:346–350. 2011. View Article : Google Scholar : PubMed/NCBI
|
|
51
|
Locasale JW, Grassian AR, Melman T,
Lyssiotis CA, Mattaini KR, Bass AJ, Heffron G, Metallo CM, Muranen
T, Sharfi H, et al: Phosphoglycerate dehydrogenase diverts
glycolytic flux and contributes to oncogenesis. Nat Genet.
43:869–874. 2011. View
Article : Google Scholar : PubMed/NCBI
|
|
52
|
Sreekumar A, Poisson LM, Rajendiran TM,
Khan AP, Cao Q, Yu J, Laxman B, Mehra R, Lonigro RJ, Li Y, et al:
Metabolomic profiles delineate potential role for sarcosine in
prostate cancer progression. Nature. 457:910–914. 2009. View Article : Google Scholar : PubMed/NCBI
|
|
53
|
Zhang WC, Shyh-Chang N, Yang H, Rai A,
Umashankar S, Ma S, Soh BS, Sun LL, Tai BC, Nga ME, et al: Glycine
decarboxylase activity drives non-small cell lung cancer
tumor-initiating cells and tumorigenesis. Cell. 148:259–272. 2012.
View Article : Google Scholar : PubMed/NCBI
|
|
54
|
Gmeiner WH, Hellmann GM and Shen P:
Tissue-dependent and -independent gene expression changes in
metastatic colon cancer. Oncol Rep. 19:245–251. 2008.PubMed/NCBI
|
|
55
|
Shestov AA, Emir UE, Kumar A, Henry PG,
Seaquist ER and Öz G: Simultaneous measurement of glucose transport
and utilization in the human brain. Am J Physiol Endocrinol Metab.
301:E1040–E1049. 2011. View Article : Google Scholar : PubMed/NCBI
|