Introduction
Ovarian cancer is the most lethal gynecological
cancer (1). Among all ovarian
cancer cases, the histological type in >50% of cases is serous
adenocarcinoma. Although patients with serous ovarian cancer (SOC)
usually exhibit a fairly good response to paclitaxel and
carboplatin at diagnosis, the majority of the patients relapse over
time (2). The 5-year survival rate
of SOC patients has remained extremely low for decades due to the
high rate of delayed diagnosis, bulky residual foci following
primary surgery and secondary chemoresistance (2). Recent studies on the use of poly
(ADP-ribose) polymerase (PARP) inhibitors indicated their utility
in the treatment of ovarian cancer, due to most patients carrying a
pathogenic mutation of BRCA1/2 (3–5).
However, these patients accounted for only a small proportion of
all SOC cases. Thus, a profound understanding of the molecular
mechanisms underlying the progression of ovarian cancer may uncover
new pathways with high clinical relevance.
Cisplatin (CDDP) and carboplatin have been the main
drugs used for the therapy of ovarian cancer for decades.
Unfortunately, ovarian cancer cells, with their unstable genomes,
are initially sensitive to these drugs, but invariably become
resistant (6). Thus, novel
therapeutic strategies are urgently needed (7). Investigating and identifying the
genetic aberrations that participate in the basic molecular
mechanisms of cancer progression and drug resistance in ovarian
cancer may provide innovative therapeutic choices with novel agents
(8).
The identification of novel biomarkers is currently
a promising approach to designing new diagnostic and therapeutic
strategies (9). Various
technologies have been adopted to identify biomarkers. Furthermore,
the use of bioinformatics is growing rapidly in cancer biology
(6). Therefore, the present study
used two gene chips downloaded from the meta-database Gene
Expression Omnibus (GEO). GDS3592 was designed for comparing normal
ovarian tissue and ovarian cancer and GDS1381 for comparing
carboplatin-resistant and carboplatin-sensitive ovarian cancers.
The present study was designed to identify differentially expressed
genes (DEGs) that may affect ovarian cancer development and
platinum sensitivity.
Materials and methods
Data collection
The GEO database is a public functional genomics
dataset that helps users download experiments and create gene
expression profiles. In the present study, the key words ‘ovarian
cancer’ and ‘carboplatin resistance’ were searched in the GEO
datasets (http://www.ncbi.nlm.nih.gov/geo/). After filtering out
repeated experiments, relevant studies were reviewed to screen the
comparison data of control and treated groups. The expression
matrix or CEL file was downloaded for subsequent analysis.
Data pretreatment and identification
of DEGs
All data were processed using the R software
(software for statistical computing and graphics) (https://www.r-project.org/). The logarithm (base 2) of
the expression value was considered for the microarray expression
data. The Affy package (http://www.bioconductor.org/packages/release/bioc/html/affy.html)
was used to read the expression data for CEL files. The limma
package (http://www.bioconductor.org/packages/release/bioc/html/limma.html)
for standardization was used for experimental data. After the limma
analysis, the genes were sorted according to the log fold-change
values. Subsequently, the RANK analysis (adjusted P-value <0.05
using the Bonferroni correction method) was conducted. The null
hypothesis of the rank method was that each gene was randomly
sorted in every experiment; the smaller the P-value of the gene,
the higher ranking it would have. Secondly, the pheatmap package
was used to draw the top 20 genes.
Gene Ontology (GO) analysis
The Gene Ontology Consortium aimed to produce a
dynamic, controlled vocabulary of gene roles in cells (10). The GO enrichment analysis was
performed using the DAVID database (https://david.ncifcrf.gov/). The F-value of the GO
terms of DEGs and the FDR value of the P-value (Q-value) were
calculated through statistical analysis of GO terms, positioning
the most possible GO terms of DEGs. Subsequently, the GOplot R
package was used to draw the chord plot.
Kyoto encyclopedia of genes and
genomes (KEGG) analysis
KEGG is a database resource for understanding the
interactions between molecular biology and the underlying chemical
elements, allowing for analysis of high-level functions and uses of
the biological system (11)
(http://www.kegg.jp/). The KOBAS online tool
(http://kobas.cbi.pku.edu.cn/) was used
for gene annotation and KEGG pathway analyses. A P-value of
<0.05 was considered to indicate statistically significance
differences. Subsequently, the clusterProfiler R package was used
to draw the barplot and dotplot.
Protein-protein interaction (PPI)
network
PPIs are the physical contacts among protein
molecules. Exploring the interactions between proteins is crucial
to achieve a detailed description of their mechanisms and functions
in living organisms (12).
Currently, PPIs are annotated at a number of online resources,
including the STRING database (http://string-db.org/), providing a comprehensive
perspective for several organisms. The PPI network of DEGs was
constructed using the STRING database (https://string-db.org/). Cytoscape (version 3.6.0) is
a bioinformatics software platform for visualizing molecular
interaction networks (13). The PPI
networks were drawn by Cytoscape.
Connectivity map (CMAP) analysis
CMAP is a gene expression database based at the
Broad Institute of MIT and Harvard in Cambridge (MA, USA). It
currently contains data on >1,000 small molecules. CMAP uses the
gene expression differences after treating human cells with small
molecules to establish a biological application database that links
small molecule drugs, gene expression and disease (14). This database suggests gene, disease
and drug relevance, thereby helping in drug research and
development. DEGs were uploaded to the CMAP to identify the
relevance between genes and small-molecule drugs.
Kaplan-Meier survival analysis
The Kaplan-Meier estimator, a non-parametric
statistic, is used to estimate the survival function from lifelong
data. In medical research, it is used to measure a certain amount
of time after patient treatment (15). Each hub gene was entered into the
online tool (http://kmplot.com/analysis/) to assess the overall and
progression-free survival of patients with ovarian cancer for the
Kaplan-Meier curve. This tool was built using gene expression and
survival data of 1,287 patients with ovarian cancer, which were
downloaded from GEO and The Cancer Genome Atlas (Affymetrix
HG-U133A, HG-U133A 2.0 and HG-U133 plus 2.0 microarrays) (16). As every gene mapped to a different
Affy ID, each Affy ID was entered into the online tool to obtain
the survival curves. One was selected for the experiment, while
others were presented as supplementary data.
Immunohistochemistry (IHC)
analysis
An online tool, ‘Human Tissue Proteomes’ (http://www.proteinatlas.org/), was used to assess the
gene expression in the ovaries of patients with ovarian cancer. The
‘Human Tissue Proteomes’ is a database that can provide protein
expression of all protein-coding genes in all major tissues and
organs of the human body (17).
Results
Characteristics of the datasets
GDS1381 and GDS3592 were obtained from the GEO
database. GDS1381 and GDS3592 were based on the GPL8300 and GPL570
platforms, respectively. GDS1381 included 9 carboplatin-sensitive
and 9 carboplatin-resistant ovarian cancer cells from 6 cases with
carboplatin-sensitive (n=3) and carboplatin-resistant (n=3) ovarian
cancers, respectively, each of which included the primary ovarian
cancer cells and metastatic ovarian cancer cells to the liver and
omentum, respectively. Cancer cells were prepared from primary
cultures. The results of GDS1381 provided insight into potential
markers associated with carboplatin-resistant ovarian cancer.
GDS3592 contained 12 normal ovarian surface epithelial (OSE) cells
and 12 ovarian cancer epithelial cells (CEPIs). CEPIs were isolated
from serous papillary ovarian adenocarcinomas (Table I).
 | Table I.Characteristics of the two datasets
of the present analysis. |
Table I.
Characteristics of the two datasets
of the present analysis.
| ID | GSE Acc | GPL | Organism | Control | Case | Country | PMID |
|---|
| 1 | GDS1381 | GPL8300 | Homo
sapiens | 9 | 9 | USA | 16227411 |
| 2 | GDS3592 | GPL570 | Homo
sapiens | 12 | 12 | USA | 20040092 |
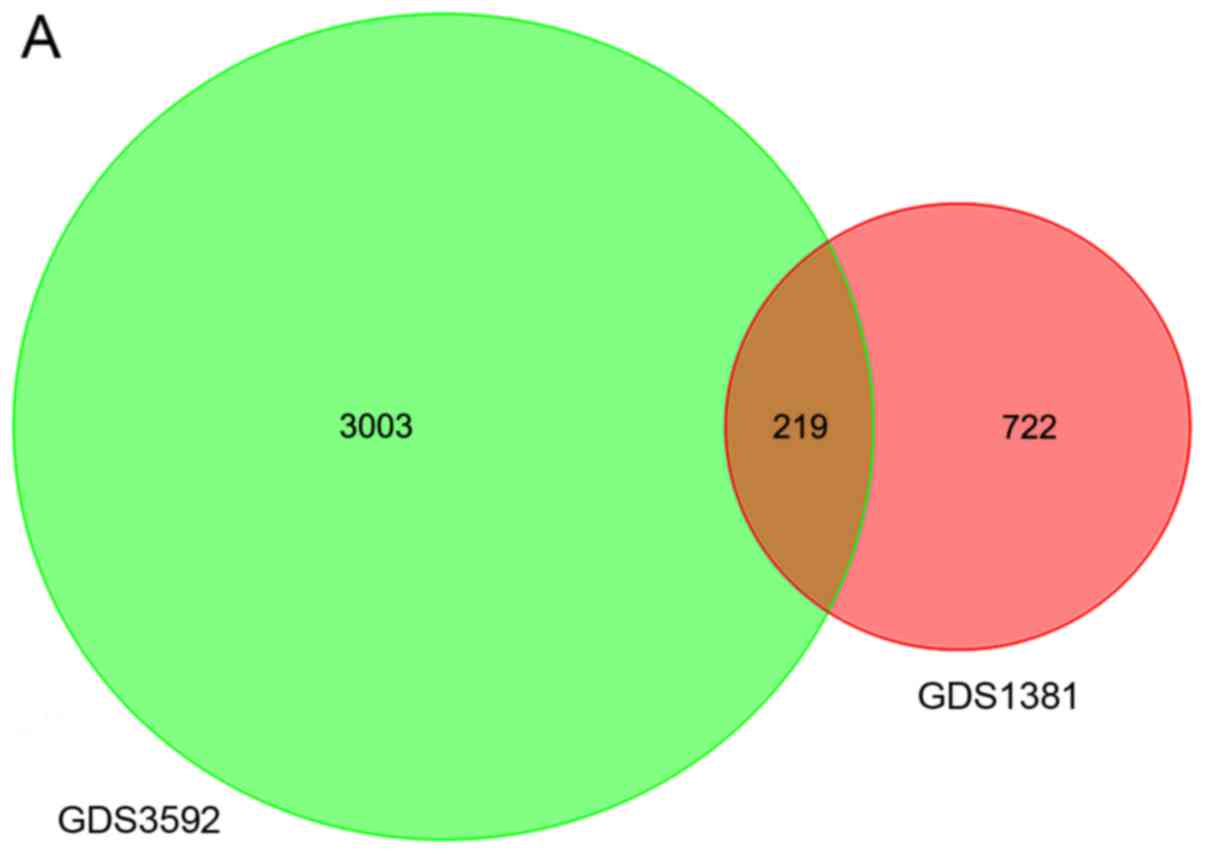
Identification of DEGs
After normalization, 722 DEGs in GDS1381 and 3,003
DEGs in GDS3592 were identified. The intersection of the two
datasets contained 219 genes (Fig.
1A). The heat map for DEG expression (top 15 upregulated and
downregulated genes) is displayed in Fig. 1B.
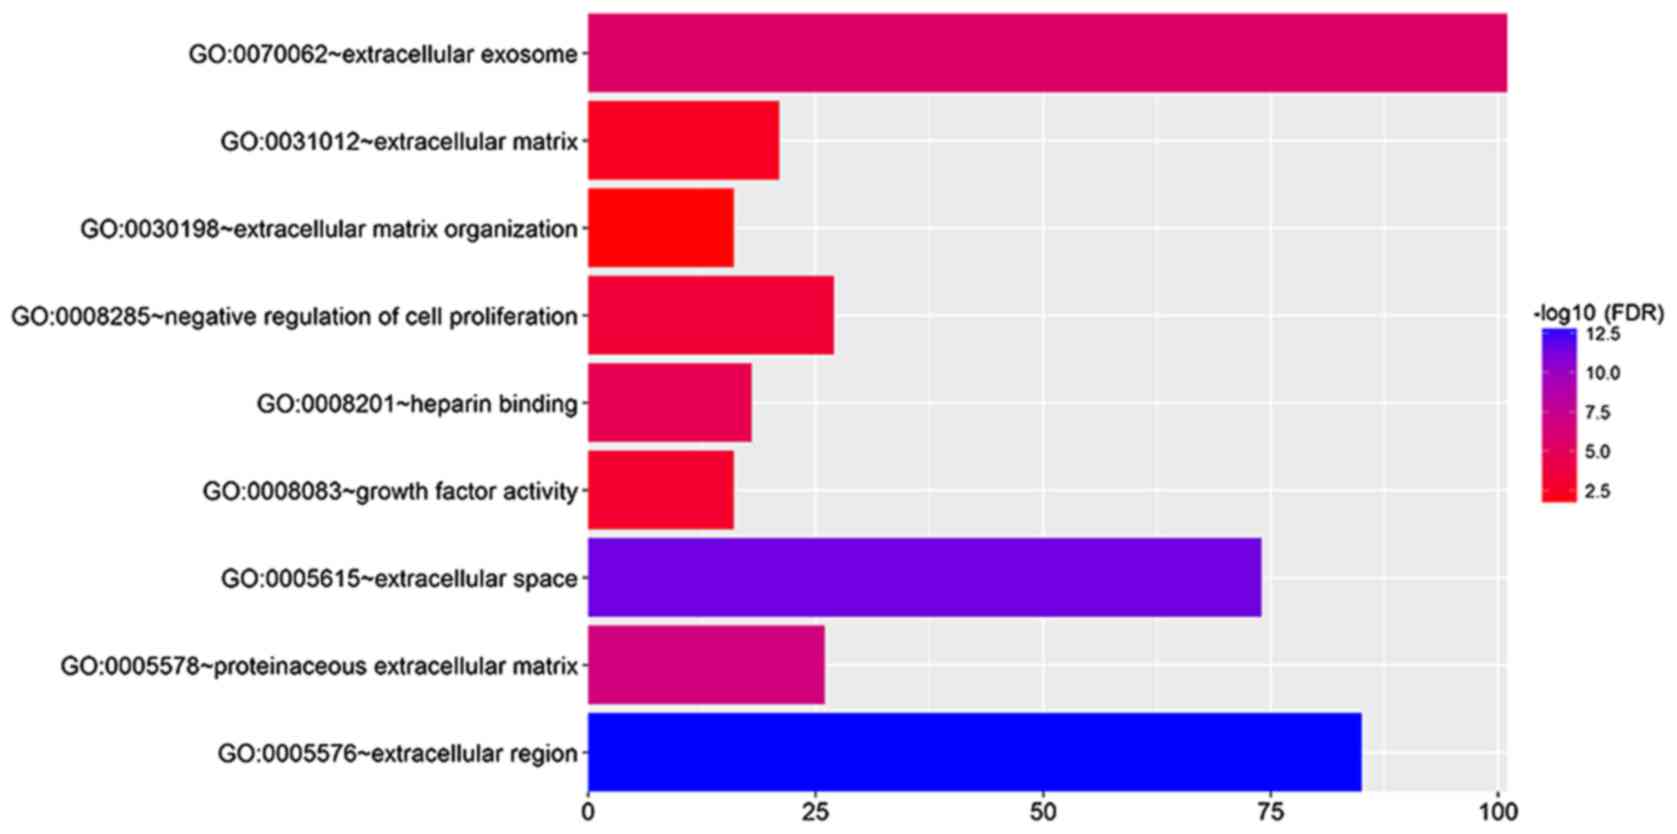
GO analysis of DEGs
DEGs were imported into the online software DAVID to
identify GO categories. According to the result, these DEGs were
found to be mainly enriched in the extracellular region,
extracellular space, extracellular exosome, proteinaceous
extracellular matrix, heparin binding, negative regulation of cell
proliferation, growth factor activity, extracellular matrix and
extracellular matrix organization (Fig.
2).
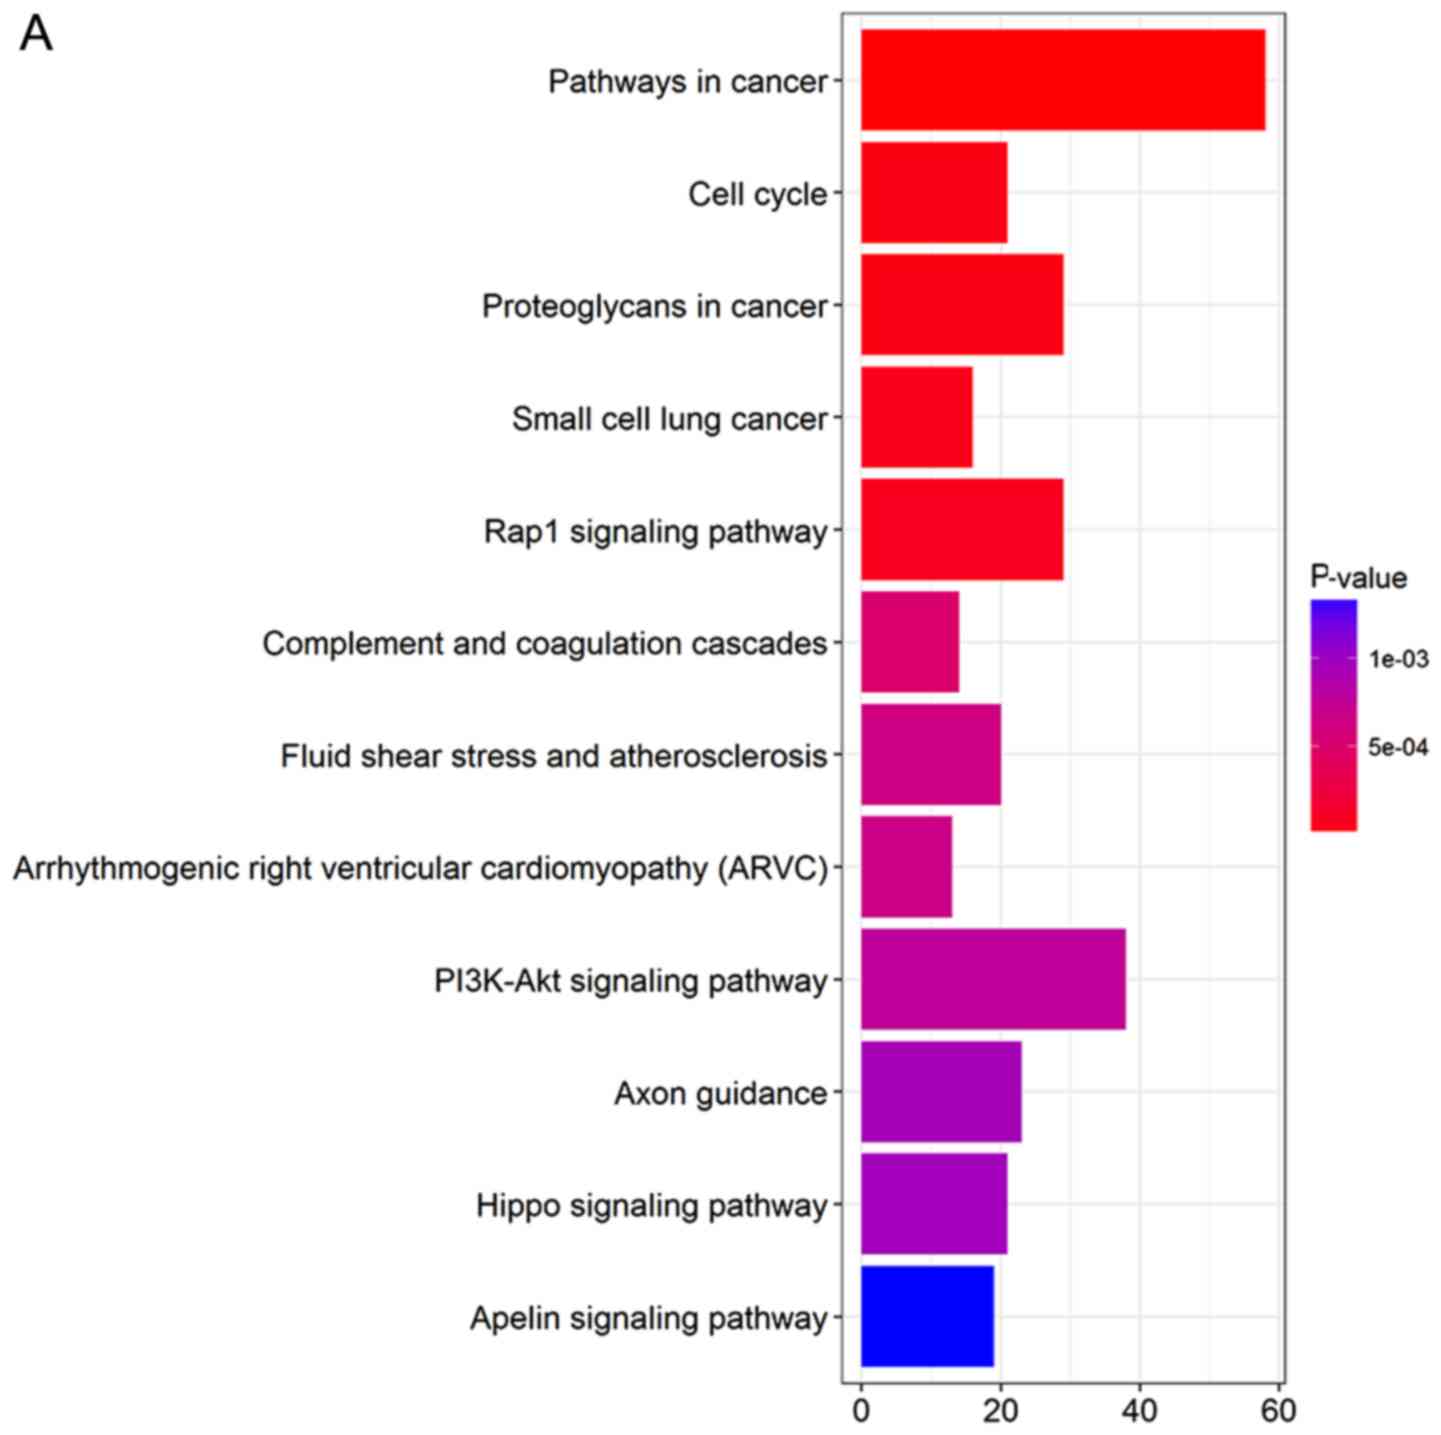
KEGG pathways of DEGs
DEGs were uploaded into the KEGG database to conduct
the KEGG analysis. The significantly enriched KEGG terms were
pathways in cancer, phosphatidylinositol 3′-kinase (PI3K)-Akt
signaling pathway, Rap1 signaling pathway, proteoglycans in cancer,
axon guidance, cell cycle, fluid shear stress and atherosclerosis,
small-cell lung cancer, complement and coagulation cascades, and
arrhythmogenic right ventricular cardiomyopathy (Fig. 3).
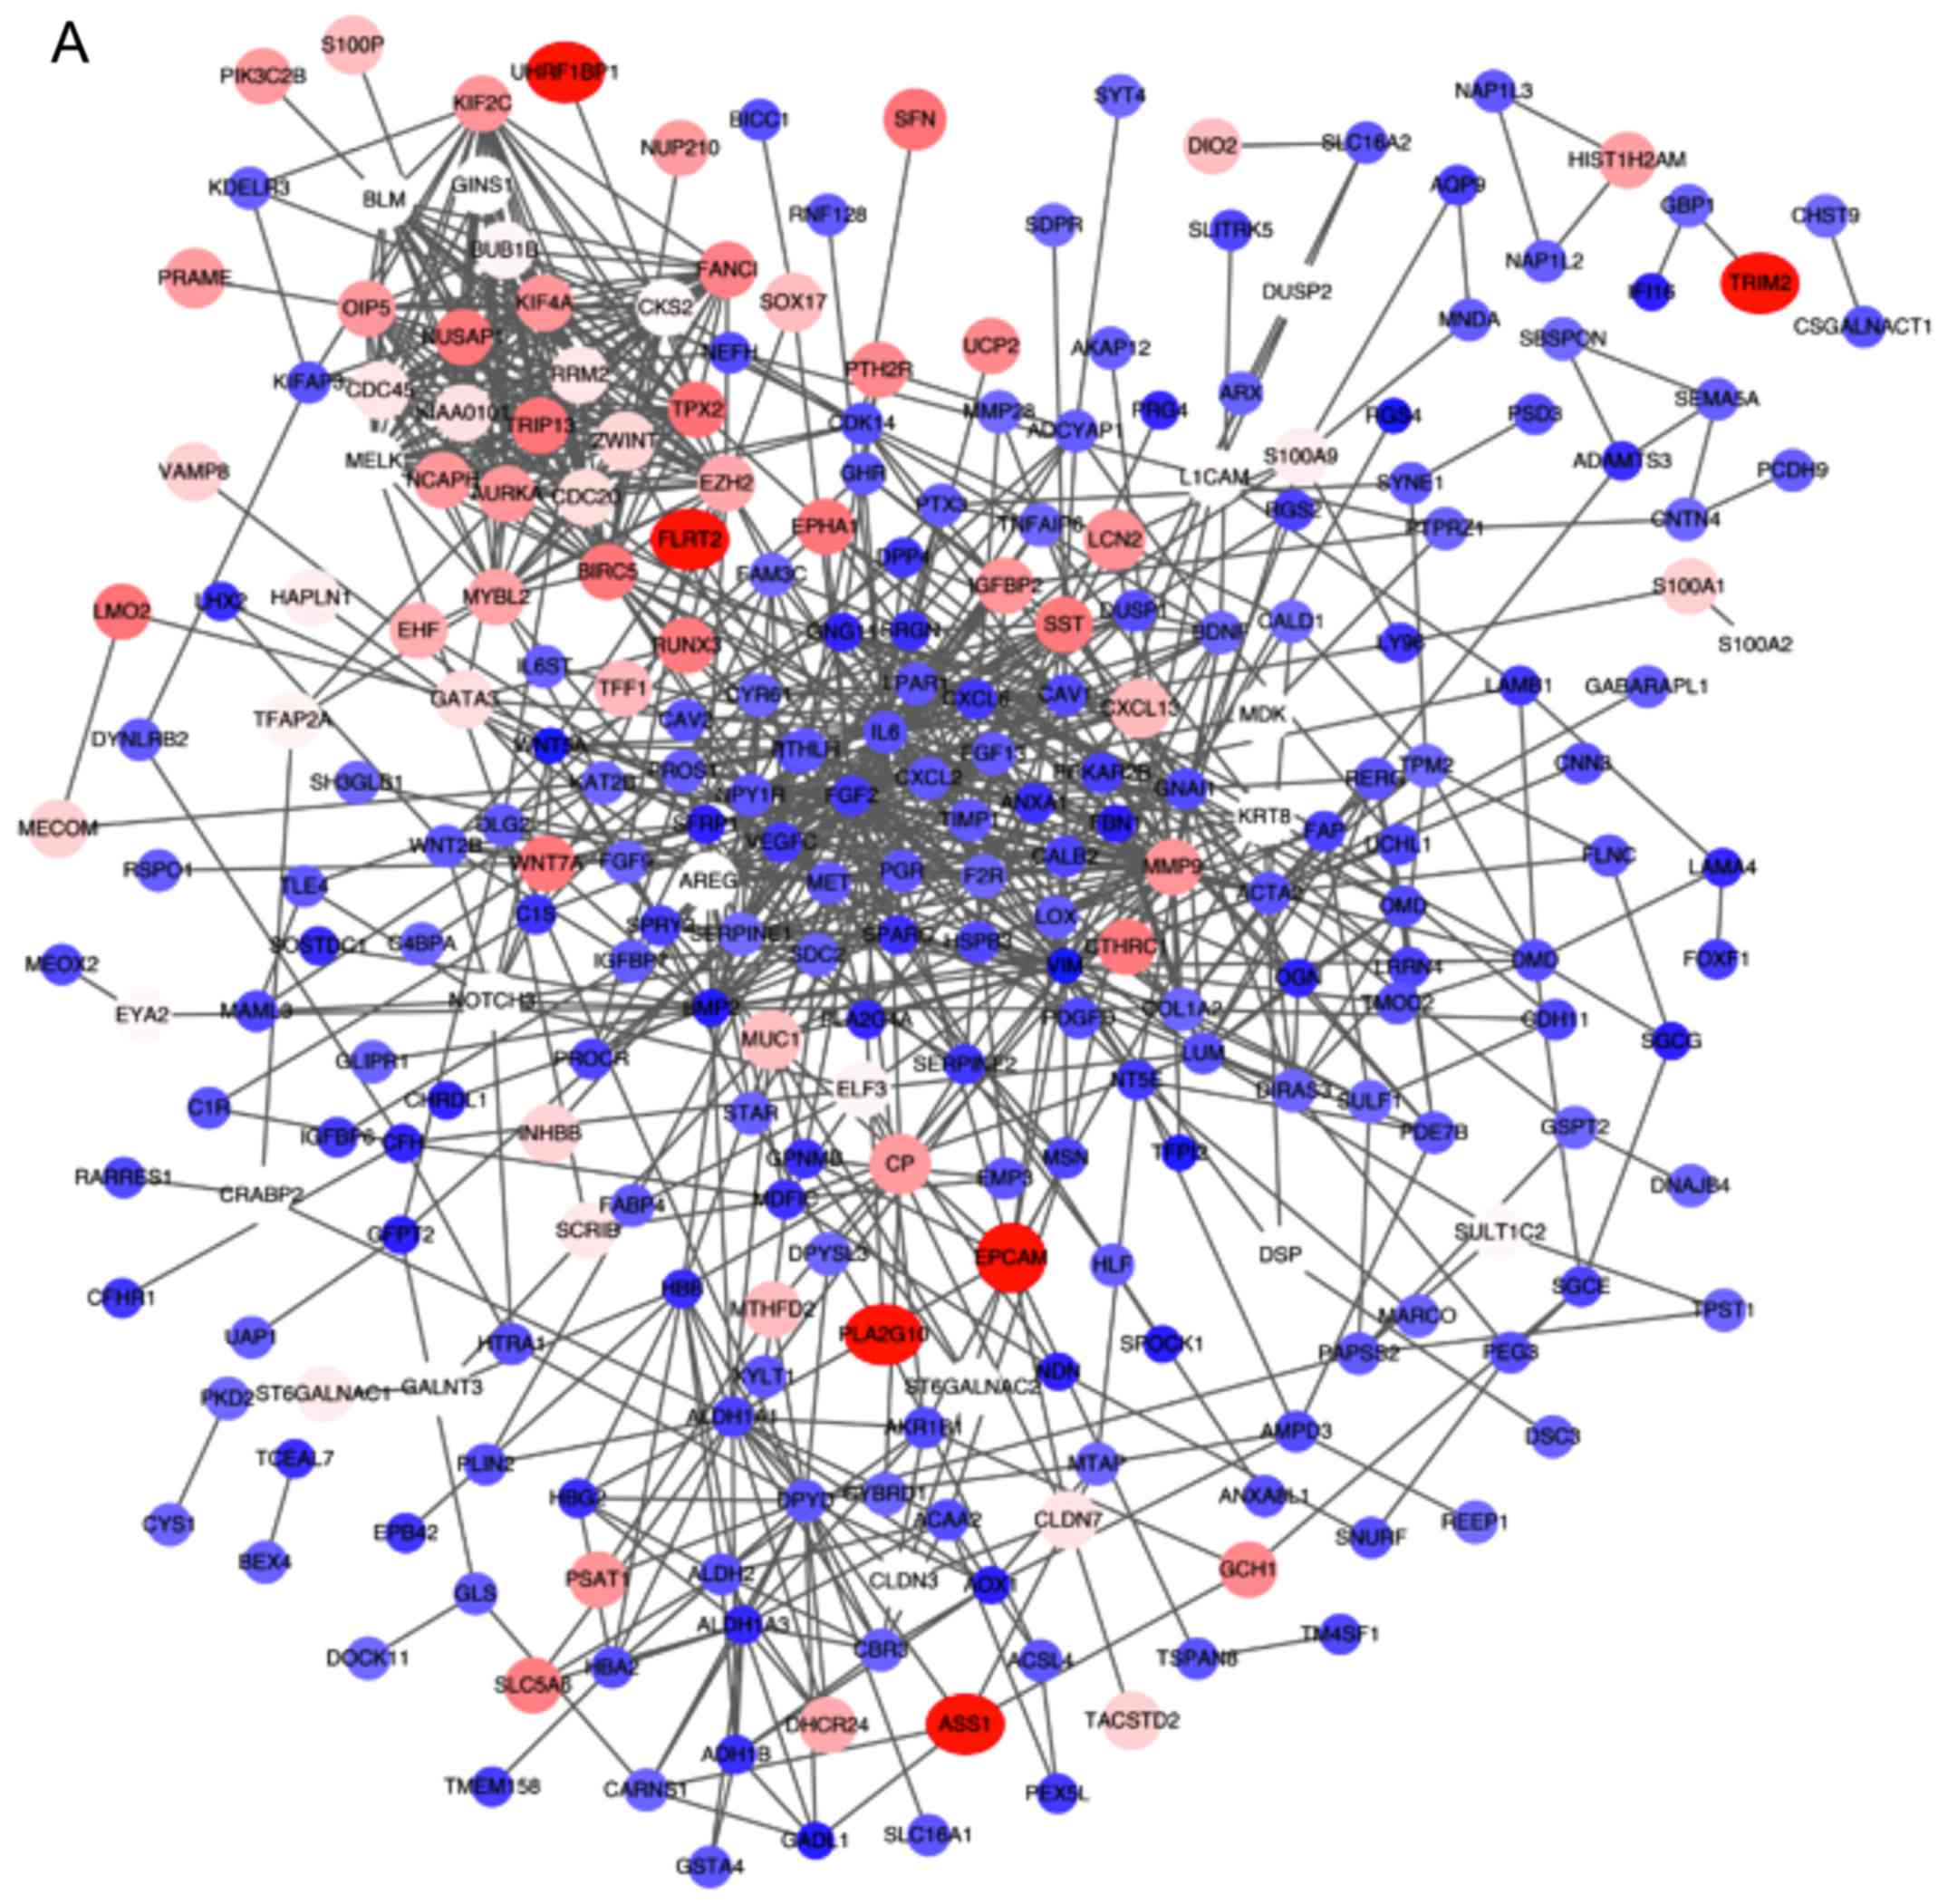
PPI network of DEGs
All the DEGs were screened using the STRING database
to further investigate the property of these distinct genes and the
internal link of DEGs. The PPI network of DEGs was constructed by
Cytoscape (Fig. 4A). The number of
strings for every single gene was counted to identify the hub
genes. The top 30 genes are displayed in the bar chart in Fig. 4B, which helped identify the most
important genes among DEGs.
Related small-molecule drugs
The CMAP is a web-based tool collecting genome-wide
transcriptional expression data that provides insight into
functional connections between drugs, genes and diseases through
the transitory feature of common gene expression changes. Through
comparing microarray data from 1,300 small molecules with selected
genes in a pattern-matching algorithm, those compounds with a gene
expression pattern highly correlated with the selected genes would
be screened, with the aim to identify a novel, potentially
effective treatment for a disease (7). The present study screened the
upregulated and downregulated genes on the CMAP and found 10
related small-molecule drugs. These small molecules may prove to be
beneficial in terms of drug sensitivity in patients with ovarian
cancer (Table II).
| Table II.Top 10 relevant small-molecule
drugs. |
Table II.
Top 10 relevant small-molecule
drugs.
| Rank | Cmap name | Mean | n | Enrichment | P-value | Specificity | Percent
non-null |
|---|
| 1 | Thioridazine | −0.48 | 20 | −0.555 | 0 | 0.0645 | 90 |
| 2 | Tanespimycin | −0.576 | 62 | −0.486 | 0 | 0.0672 | 87 |
| 3 | Trichostatin A | −0.5 | 182 | −0.468 | 0 | 0.2475 | 87 |
| 4 | LY-294002 | −0.344 | 61 | −0.301 | 0.00004 | 0.3436 | 67 |
| 5 |
Etiocholanolone | 0.452 | 6 | 0.817 | 0.00008 | 0 | 100 |
| 6 | Thioperamide | 0.489 | 5 | 0.83 | 0.0003 | 0 | 100 |
| 7 | Geldanamycin | −0.568 | 15 | −0.512 | 0.00034 | 0.0859 | 86 |
| 8 | Carbenoxolone | 0.457 | 4 | 0.87 | 0.0004 | 0 | 100 |
| 9 | Cloxacillin | 0.538 | 4 | 0.856 | 0.00056 | 0 | 100 |
| 10 | 8-Azaguanine | −0.7 | 4 | −0.857 | 0.00072 | 0.007 | 100 |
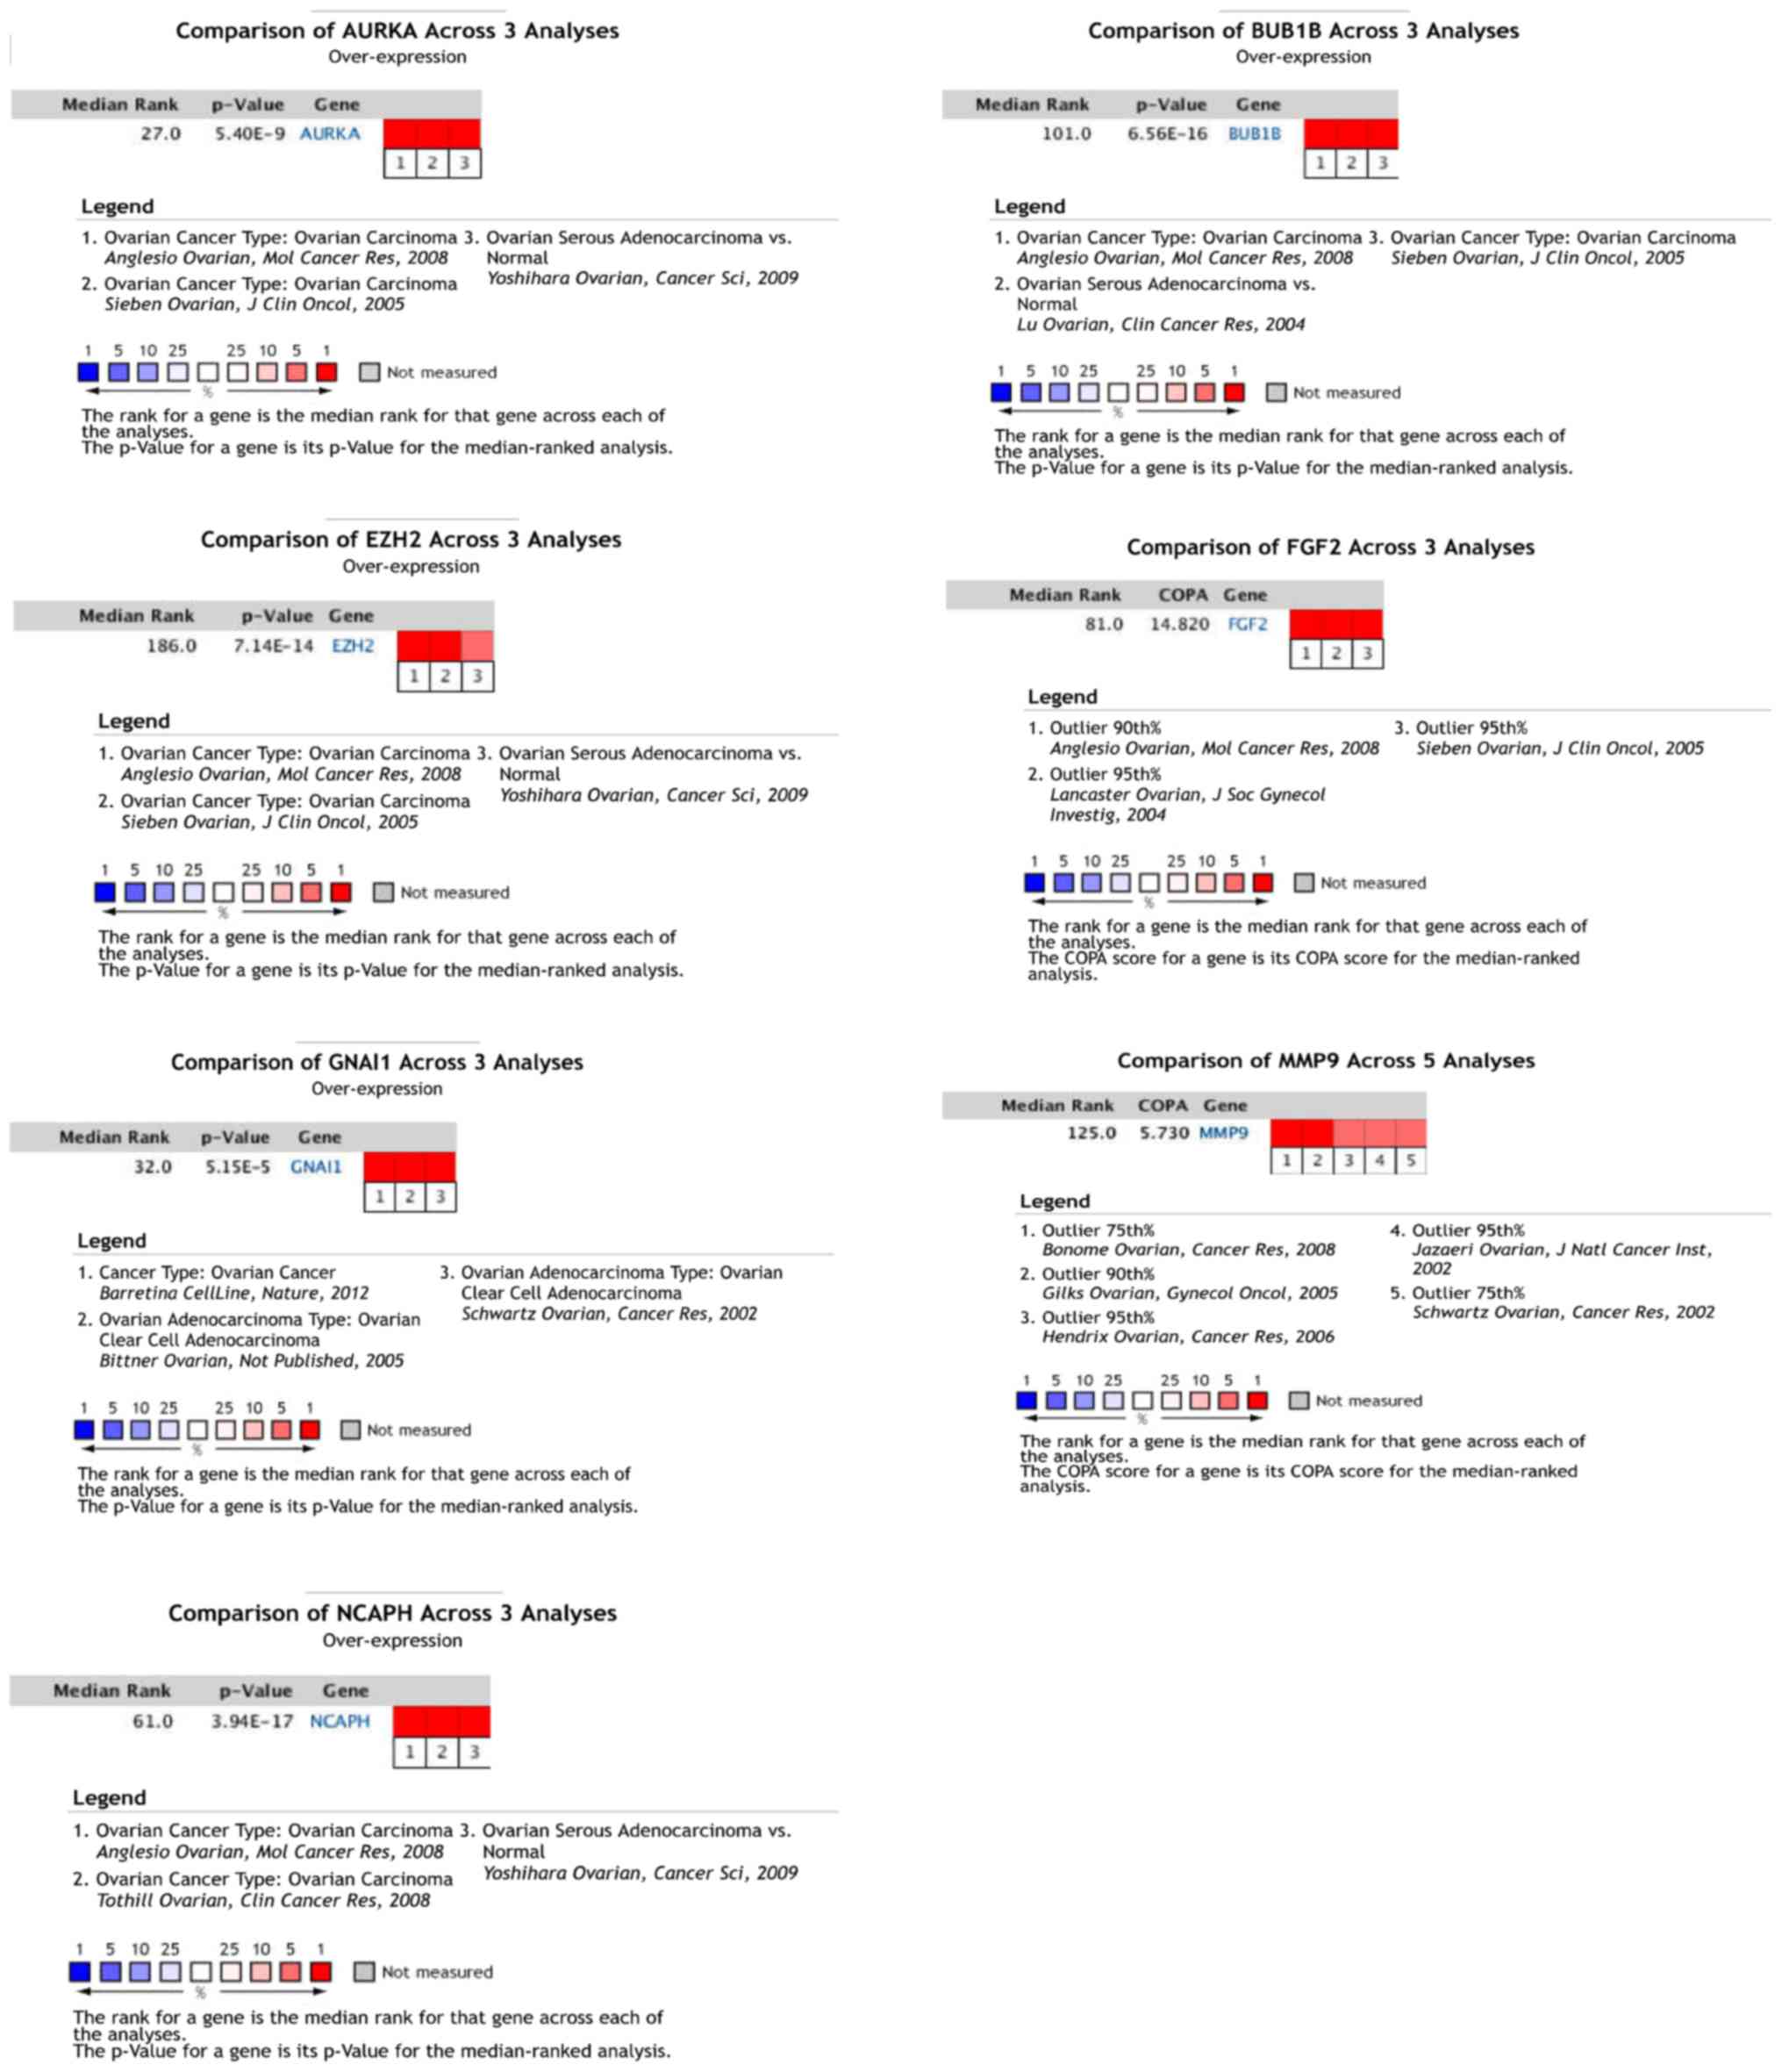
Comparison of hub genes across
numerous analyses
An Oncomine analysis of cancer vs. normal tissue of
hub genes in ovarian cancer was performed. The results revealed
that GANI1, non-structural maintenance of chromosomes (non-SMC)
condensin I complex subunit H (NCAPH), fibroblast growth factor 2
(FGF2), matrix metallopeptidase 9 (MMP9), aurora kinase A (AURKA),
enhancer of zeste 2 polycomb repressive complex 2 subunit (EZH2)
and BUB1 mitotic checkpoint serine/threonine kinase B (BUB1B) were
upregulated among different analysis datasets (Fig. 5).
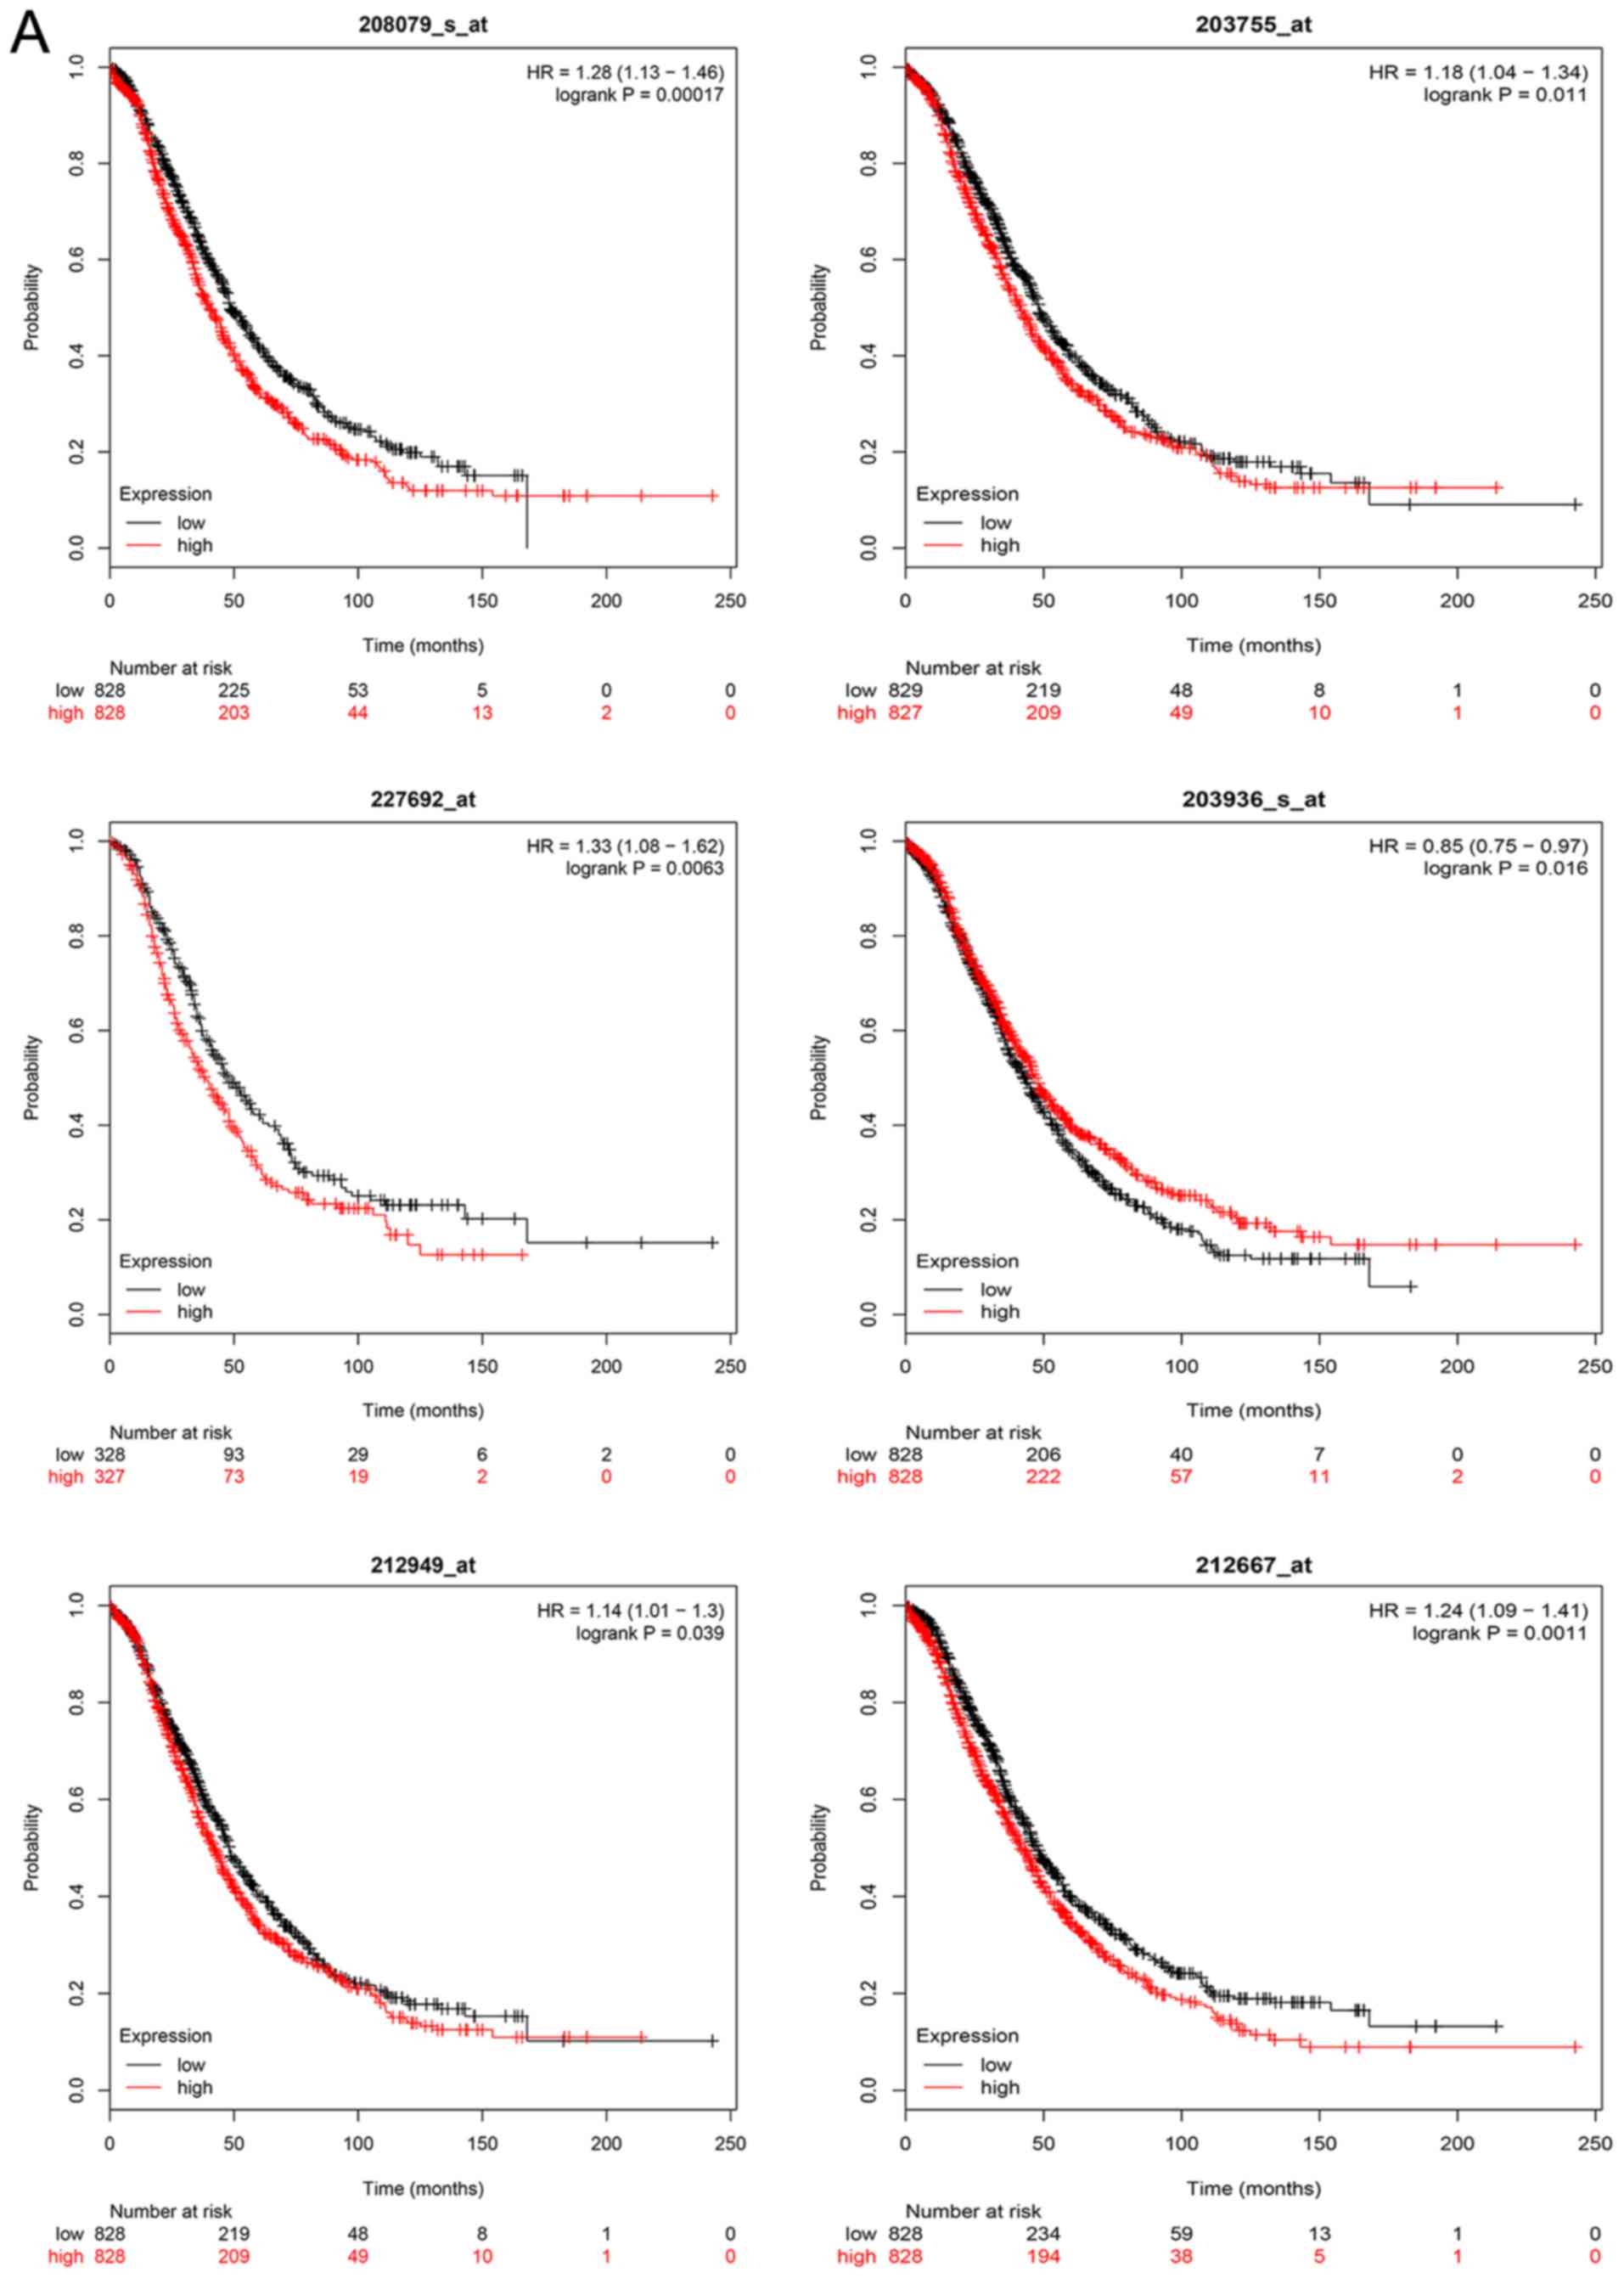
Kaplan-Meier survival analysis
The overall survival analysis of hub genes was
performed using the Kaplan-Meier curve. The results demonstrated
that high expression levels of GNAI1, SPARC, NCAPH, MMP9, FGF2,
AURKA, EZH2 and BUB1B were associated with worse survival of
ovarian cancer patients. The overall and progression-free survival
analyses of hub genes are displayed in Fig. 6A and B, respectively.
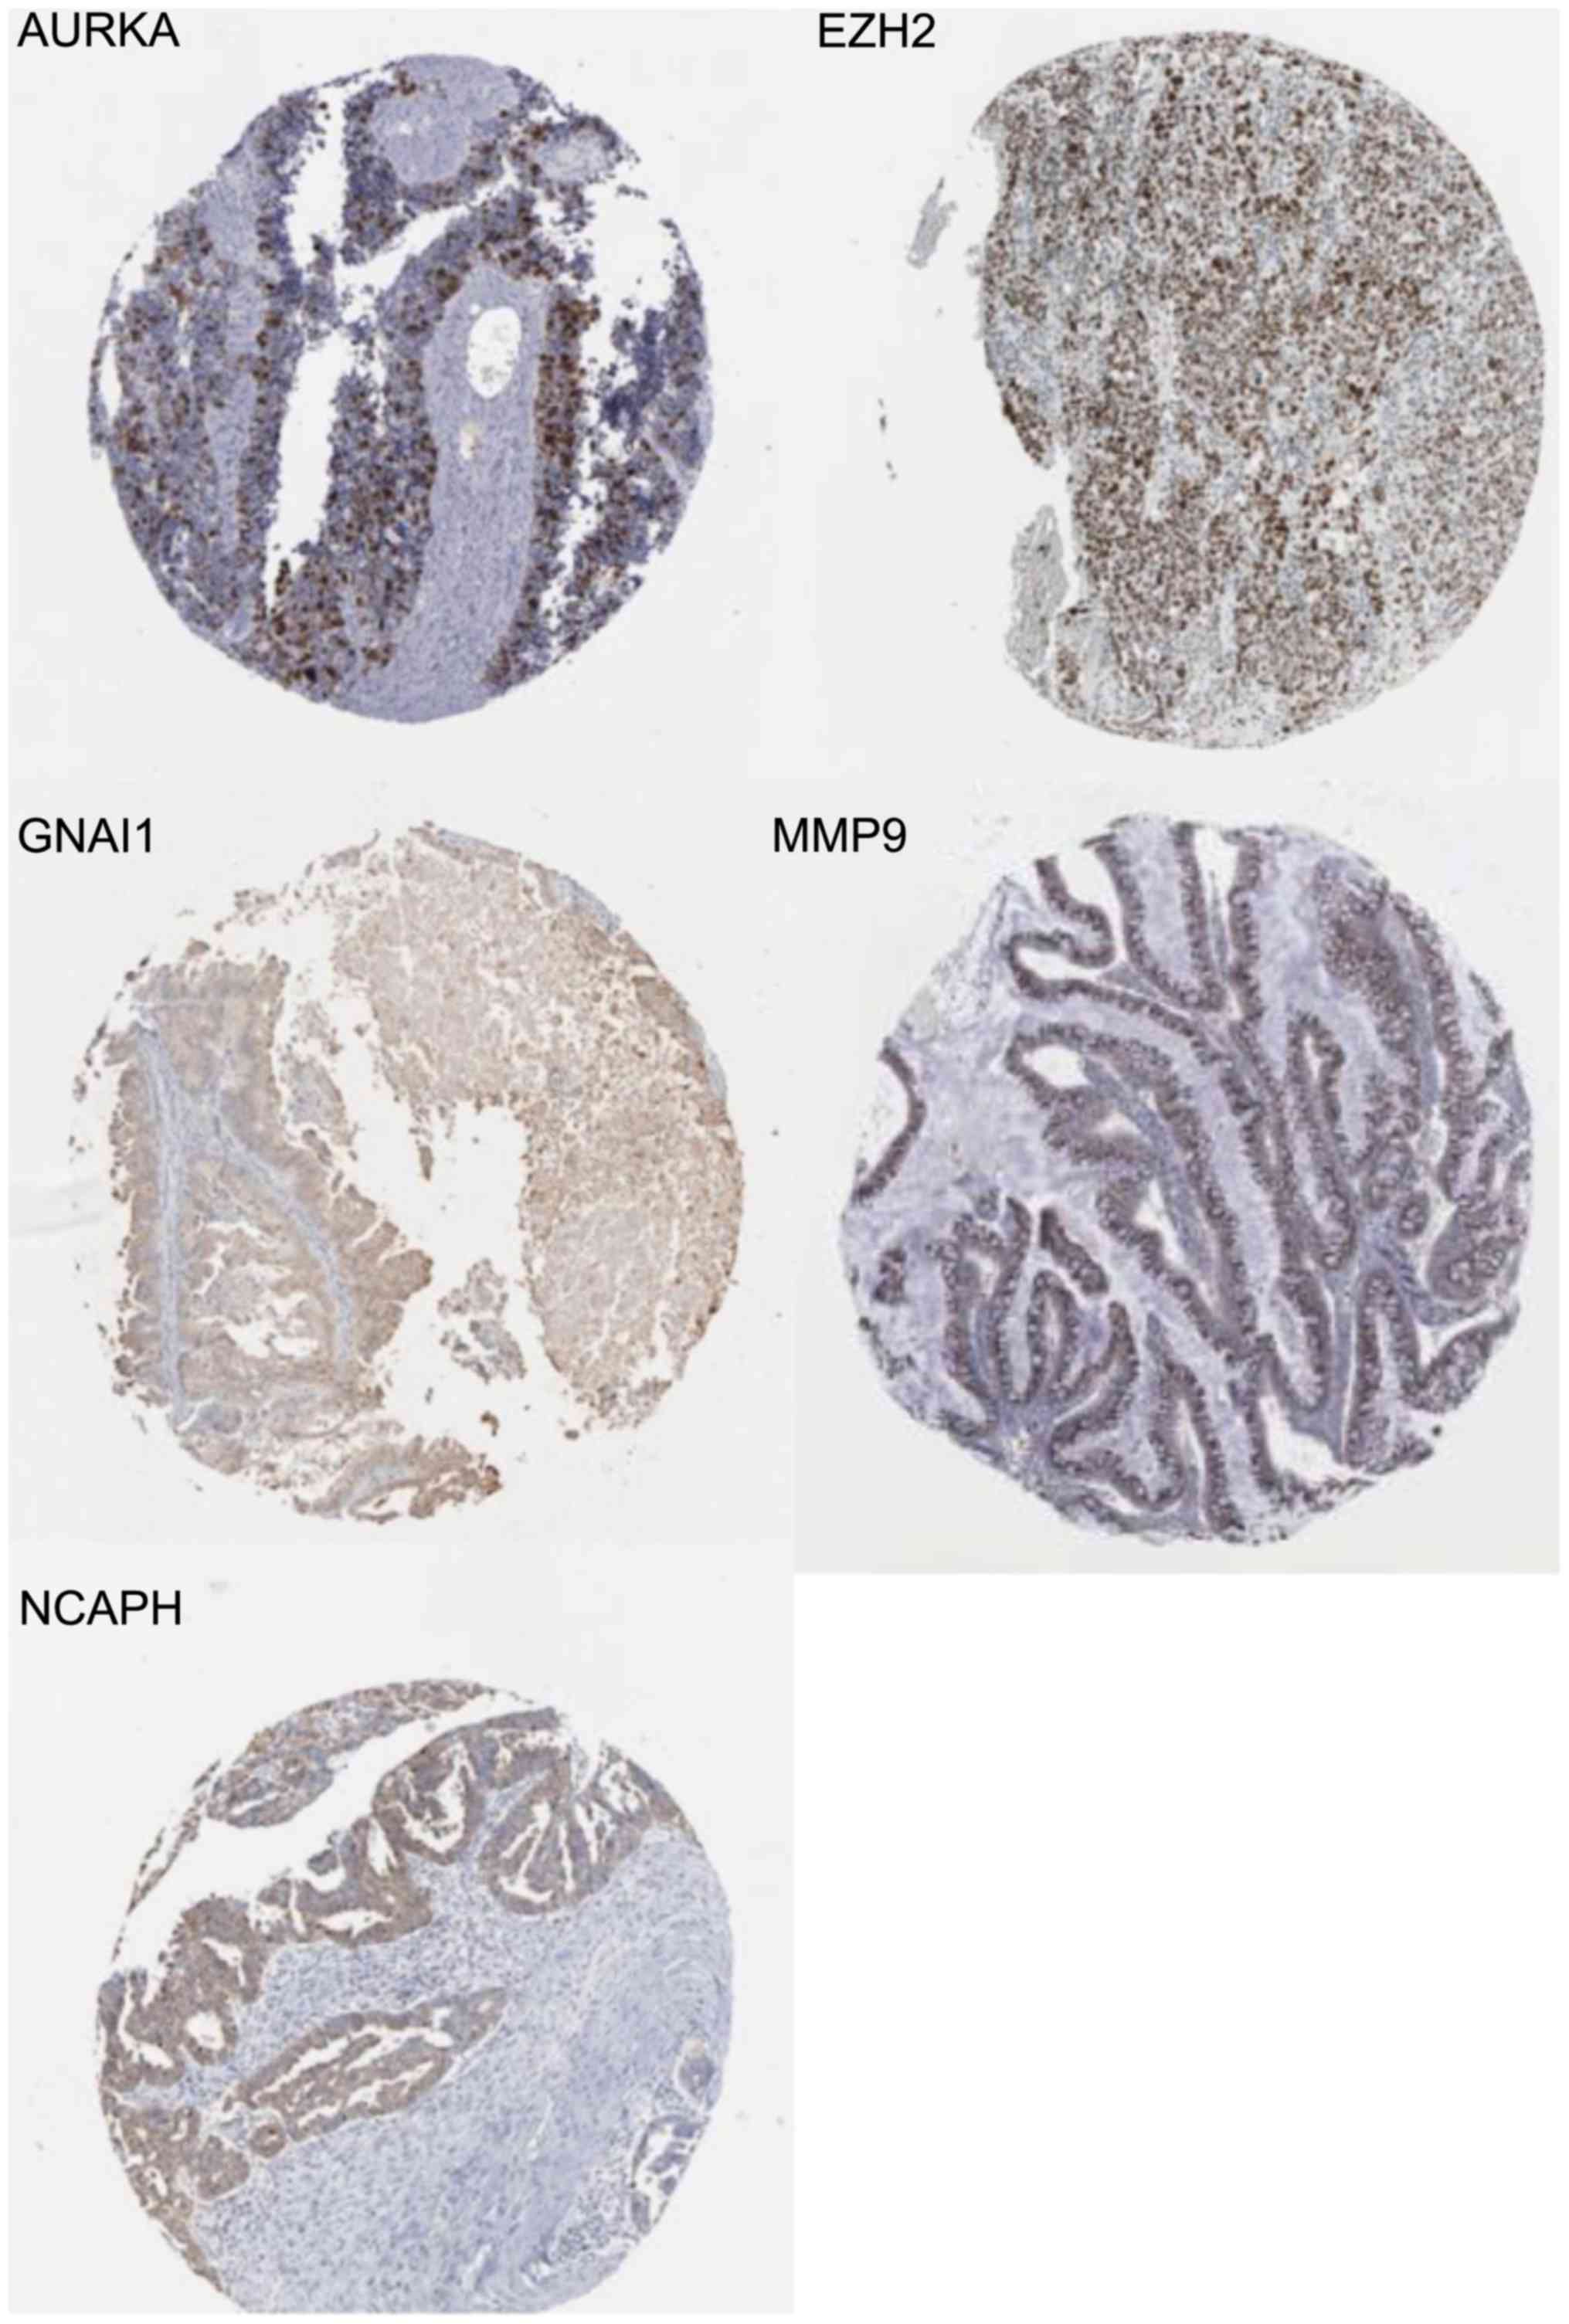
IHC
An online website (http://www.proteinatlas.org/) was used to search for
the IHC results. Immunostaining of certain hub genes yielded
positive results in ovarian cancer tissue. The staining intensity
of GNAI1 in 12 patients with ovarian cancer included 3 weak and 9
negative staining cases using antibody CAB022449 (antibody
dilution:1:1,000) (18), 1 low and
10 negative staining cases using antibody HPA042141 (antibody
dilution:1:75) (18,19). The staining intensity of NCAPH in 12
ovarian cancer samples included 4 moderate, 3 weak and 5 negative
staining cases using antibody HPA003008 (antibody dilution:1:150)
(18), whereas 3 moderate, 3 weak
and 5 negative staining cases in 11 ovarian cancer samples using
antibody HPA002647 (antibody dilution: 1:100) (18,20).
The staining intensity of MMP9 in 12 patients with ovarian cancer
included 3 strong and 9 negative staining cases using antibody
CAB000348 (antibody dilution:1:1,000) (18), whereas all were negative staining
using other antibodies (21). The
staining intensity of AURKA in 24 ovarian cancer samples included 1
strong, 1 moderate, 3 weak and 7 negative staining cases using
antibody CAB001454 (antibody dilution:1:25) (18), 1 moderate, 3 weak and 8 negative
staining cases using antibody HPA002636 (antibody dilution:1:100)
(18,22). The staining intensity of EZH2 in 10
ovarian cancer samples included 4 strong, 5 moderate and 1 weak
staining cases using antibody CAB009589 (antibody dilution:1:100)
(18,23). IHC analysis further demonstrated the
unknown connection between hub genes and ovarian cancer. An
illustration of the weak staining of GNAI1 (19), strong staining of EZH2 (23), moderate staining of NCAPH (20), strong staining of MMP9 (21) and strong staining of AURKA (22) are displayed in Fig. 7.
Discussion
Microarray analysis of gene expression profiles is
widely used to identify genes and biological pathways associated
with multifactorial diseases. However, such studies on ovarian
cancer have been scarce to date. Thus, in the present study,
integrated analyses were performed and 219 DEGs common between OSE
and CEPIs, as well as genes common between carboplatin-sensitive
and carboplatin-resistant ovarian cancer cells, were detected to
identify the key platinum-resistant genes in SOC, which is the most
common type of epithelial ovarian cancer. The results provided
evidence that the 219 DEGs were probably involved in cancer
development and the molecular mechanism underlying carboplatin
resistance, which were enriched in the PI3K-Akt signaling pathway,
Rap1 signaling pathway, proteoglycans in cancer, axon guidance,
cell cycle, fluid shear stress and atherosclerosis, small-cell lung
cancer, and complement and coagulation cascades.
Overall, 30 DEGs were identified as hub genes with
high node degrees. Among these hub genes, interleukin (IL)6
exhibited the highest node degree with 51. IL6 belongs to the IL6
cytokine family and was recently reported to promote lung and
pancreatic tumorigenesis (24–26).
Systemic and pulmonary production of IL6 was commonly elevated in
patients with lung adenocarcinoma and was correlated with poor
survival (27–30). A mouse model revealed specific
targeting of IL6 trans-signaling, which suppressed the pathogenesis
of lung adenocarcinoma (31).
Subsequently, the screened genes that may be closely associated
with ovarian cancer were further analyzed. The present study
identified five genes, namely GANI1, NCAPH, MMP9, AURKA and EZH2,
that were closely associated with ovarian cancer. NCAPH encodes a
member of the Barr gene and a regulatory subunit of the condensin
complex that contributes to the conversion of interphase chromatin
into condensed chromosomes (32).
NCAPH is one of the three non-SMC subunits in condensin I that is a
superfamily of proteins termed kleisins (16) and it was found to be crucial for
condensin complex stability and resolution of sister chromatids. It
promotes colonic cancerous cell proliferation and migration,
affects cell cycle transition, and inhibits cellular apoptosis.
Knockdown of NCAPH decreased the xenograft tumor growth of HCT116
in vivo (33). MMP9 is one
of the members of the MMP family that participates in the breakdown
of extracellular matrix in normal physiological processes. The
majority of MMPs are converted to their active forms from inactive
protein precursors after being cleaved by extracellular proteinases
(32). MMP9 was found to be
involved in the metastasis of lung cancer, hepatocellular carcinoma
(HCC), prostate and breast cancer (34–37).
MMP9 was also found to be involved in cancer progression and was
identified in patients with ovarian cancer. Therefore, MMP9 may be
a candidate biomarker for high-grade ovarian cancer (38). AURKA, also referred to as aurora
kinase A, is a cell cycle-regulated kinase that participates in
microtubule formation and stabilization at the spindle pole during
chromosome segregation (32).
Aurora A mapped to chromosomal region 20q13.2, which was amplified
in a number of cancer cell lines and primary tumors (39–41).
Previous studies demonstrated that AURKA was involved in the
susceptibility to hepatitis B virus-related HCC and the progression
of head and neck and gastric cancer. High expression of AURKA
promoted cisplatin resistance by activating p-eIF4E, c-MYC and HDM2
(42,43). AURKA was found to be amplified in
>15–25% of ovarian cancer cell lines and primary tumors
(40,41). The expression of BRCA1/2 may be
increased by AURKA in ovarian carcinoma cells (44), and several studies revealed a
physical and functional association between AURKA and BRCA1/2
(45–47). Clinical data demonstrated that
patients with BRCA1 and BRCA2 mutations exhibited a higher response
rate to cisplatin (48,49). Thus, AURKA was hypothesized to exert
a synergistic effect with BRCA1/2 in platinum resistance. EZH2
encoded one of the polycomb-group family members. The protein EZH2
encoding was involved in the hematopoietic and central nervous
systems (32). Mutation or
overexpression of EZH2 was reported to be associated with a wide
variety of cancers. As in ovarian cancer, an increased expression
of EZH2 was reported to promote cancer cell metastasis and
migration (50,51), whereas inhibitors of EZH2 were
assessed in clinical trials as potential therapeutic targets
(52).
GANI1 and the interaction between ovarian cancer and
NCAPH have not been widely reported and, hence, need further
investigation.
The present study integrated two gene expression
datasets to lower the false-positive rate of the single microarray
analysis. This process also stabilized the effects of the study
with a small sample size. Finally, five DEGs were identified,
namely GNAI1, NCAPH, MMP9, AURKA and EZH2, which may be considered
as potential novel targets for ovarian cancer therapy and drug
resistance reversal agents. However, further experiments in
vivo and in vitro are needed to explicate the biological
function of these genes and the complex molecular processes
underlying the platinum resistance of ovarian cancer require
further investigation.
Acknowledgements
The authors thank all the data of all the websites
involved.
Funding
The present study was supported by grants from the
National Natural Science Foundation of China (nos. C81072120 and
C81572562).
Availability of data and materials
The datasets used during the present study are
available from the corresponding author upon reasonable
request.
Authors' contributions
Shijie Zhan conceived and designed the study and
wrote the paper. Hua Linghu and Bin Liu reviewed and edited the
manuscript. All authors read and approved the manuscript and agree
to be accountable for all aspects of the research in ensuring that
the accuracy or integrity of any part of the work are appropriately
investigated and resolved.
Ethics approval and consent to
participate
Not applicable.
Consent for publication
Not applicable.
Competing interests
The authors declare no conflicts of interest.
References
|
1
|
International Agency for Research on
CancerGlobal cancer statistics. http://globocan.iarc.fr/Pages/fact_sheets_population.aspx
|
|
2
|
De Las Rivas J and Fontanillo C:
Protein-protein interactions essentials: Key concepts to building
and analyzing interactome networks. PLoS Comput Biol.
6:e10008072010. View Article : Google Scholar : PubMed/NCBI
|
|
3
|
Bryant HE, Schultz N, Thomas HD, Parker
KM, Flower D, Lopez E, Kyle S, Meuth M, Curtin NJ and Helleday T:
Specific killing of BRCA2-deficient tumours with inhibitors of
poly(ADP-ribose) polymerase. Nature. 434:913–917. 2005. View Article : Google Scholar : PubMed/NCBI
|
|
4
|
Farmer H, McCabe N, Lord CJ, Tutt AN,
Johnson DA, Richardson TB, Santarosa M, Dillon KJ, Hickson I,
Knights C, et al: Targeting the DNA repair defect in BRCA mutant
cells as a therapeutic strategy. Nature. 434:917–921. 2005.
View Article : Google Scholar : PubMed/NCBI
|
|
5
|
Wiggans AJ, Cass GK, Bryant A, Lawrie TA
and Morrison J: Poly(ADP-ribose) polymerase (PARP) inhibitors for
the treatment of ovarian cancer. Cochrane Database Syst Rev:
CD007929. 2015. View Article : Google Scholar
|
|
6
|
Olopade OI and Wei M: FANCF methylation
contributes to chemoselectivity in ovarian cancer. Cancer Cell.
3:417–420. 2003. View Article : Google Scholar : PubMed/NCBI
|
|
7
|
Malati T: Tumour markers: An overview.
Indian J Clin Biochem. 22:17–31. 2007. View Article : Google Scholar : PubMed/NCBI
|
|
8
|
Kurman RJ and Shih Ie M: Pathogenesis of
ovarian cancer: Lessons from morphology and molecular biology and
their clinical implications. Int J Gynecol Pathol. 27:151–160.
2008.PubMed/NCBI
|
|
9
|
Lee E and Moon A: Identification of
biomarkers for breast cancer using databases. J Cancer Prev.
21:235–242. 2016. View Article : Google Scholar : PubMed/NCBI
|
|
10
|
Ashburner M, Ball CA, Blake JA, Botstein
D, Butler H, Cherry JM, Davis AP, Dolinski K, Dwight SS, Eppig JT,
et al: Gene ontology: Tool for the unification of biology. The Gene
Ontology Consortium. Nat Genet. 25:25–29. 2000. View Article : Google Scholar : PubMed/NCBI
|
|
11
|
Lin CM and Feng W: Microarray and
synchronization of neuronal differentiation with pathway changes in
the Kyoto Encyclopedia of Genes and Genomes (KEGG) databank in
nerve growth factor-treated PC12 cells. Curr Neurovasc Res.
9:222–229. 2012. View Article : Google Scholar : PubMed/NCBI
|
|
12
|
Franceschini A, Szklarczyk D, Frankild S,
Kuhn M, Simonovic M, Roth A, Lin J, Minguez P, Bork P, von Mering C
and Jensen LJ: STRING v9.1: Protein-protein interaction networks,
with increased coverage and integration. Nucleic Acids Res.
41:(Database Issue). D808–D815. 2013. View Article : Google Scholar : PubMed/NCBI
|
|
13
|
Smoot ME, Ono K, Ruscheinski J, Wang PL
and Ideker T: Cytoscape 2.8: New features for data integration and
network visualization. Bioinformatics. 27:431–432. 2011. View Article : Google Scholar : PubMed/NCBI
|
|
14
|
Connectivity Map. https://portals.broadinstitute.org/cmap
|
|
15
|
Kaplan EL and Meier P: Nonparametric
estimation from incomplete observations. J Am Statist Assoc.
53:457–481. 1958. View Article : Google Scholar
|
|
16
|
Gyorffy B, Lánczky A and Szállási Z:
Implementing an online tool for genome-wide validation of
survival-associated biomarkers in ovarian-cancer using microarray
data from 1287 patients. Endocr Relat Cancer. 19:197–208. 2012.
View Article : Google Scholar : PubMed/NCBI
|
|
17
|
The Human Protein Atlas. https://www.proteinatlas.org/about
|
|
18
|
Protein Atlas version 18. https://www.proteinatlas.org/about/releases
|
|
19
|
GNAI1/pathology/tissue/ovarian+cancer.
https://www.proteinatlas.org/ENSG00000127955-GNAI1/pathology/tissue/ovarian+cancer
|
|
20
|
NCAPH/pathology/tissue/ovarian+cancer.
https://www.proteinatlas.org/ENSG00000121152-NCAPH/pathology/tissue/ovarian+cancer
|
|
21
|
MMP9/pathology/tissue/ovarian+cancer.
https://www.proteinatlas.org/ENSG00000100985-MMP9/pathology/tissue/ovarian+cancer
|
|
22
|
AURKA/pathology/tissue/ovarian+cancer.
https://www.proteinatlas.org/ENSG00000087586-AURKA/pathology/tissue/ovarian+cancer
|
|
23
|
EZH2/pathology/tissue/ovarian+cancer.
https://www.proteinatlas.org/ENSG00000106462-EZH2/pathology/tissue/ovarian+cancer
|
|
24
|
Ochoa CE, Mirabolfathinejad SG, Ruiz VA,
Evans SE, Gagea M, Evans CM, Dickey BF and Moghaddam SJ:
Interleukin 6, but not T helper 2 cytokines, promotes lung
carcinogenesis. Cancer Prev Res. 4:51–64. 2011. View Article : Google Scholar
|
|
25
|
Lesina M, Kurkowski MU, Ludes K, Rose-John
S, Treiber M, Klöppel G, Yoshimura A, Reindl W, Sipos B, Akira S,
et al: Stat3/Socs3 activation by IL-6 transsignaling promotes
progression of pancreatic intraepithelial neoplasia and development
of pancreatic cancer. Cancer Cell. 19:456–469. 2011. View Article : Google Scholar : PubMed/NCBI
|
|
26
|
Tan X, Carretero J, Chen Z, Zhang J, Wang
Y, Chen J, Li X, Ye H, Tang C, Cheng X, et al: Loss of p53
attenuates the contribution of IL-6 deletion on suppressed
tumor progression and extended survival in Kras-driven
murine lung cancer. PLoS One. 8:e808852013. View Article : Google Scholar : PubMed/NCBI
|
|
27
|
Yanagawa H, Sone S, Takahashi Y, Haku T,
Yano S, Shinohara T and Ogura T: Serum levels of interleukin 6 in
patients with lung cancer. Br J Cancer. 71:1095–1098. 1995.
View Article : Google Scholar : PubMed/NCBI
|
|
28
|
Yeh HH, Lai WW, Chen HH, Liu HS and Su WC:
Autocrine IL-6-induced Stat3 activation contributes to the
pathogenesis of lung adenocarcinoma and malignant pleural effusion.
Oncogene. 25:4300–4309. 2006. View Article : Google Scholar : PubMed/NCBI
|
|
29
|
Gao SP, Mark KG, Leslie K, Pao W, Motoi N,
Gerald WL, Travis WD, Bornmann W, Veach D, Clarkson B and Bromberg
JF: Mutations in the EGFR kinase domain mediate STAT3 activation
via IL-6 production in human lung adenocarcinomas. J Clin Invest.
117:3846–3856. 2007. View
Article : Google Scholar : PubMed/NCBI
|
|
30
|
Haura EB, Livingston S and Coppola D:
Autocrine interleukin-6/interleukin-6 receptor stimulation in
non-small-cell lung cancer. Clin Lung Cancer. 7:273–275. 2006.
View Article : Google Scholar : PubMed/NCBI
|
|
31
|
Brooks GD, McLeod L, Alhayyani S, Miller
A, Russell PA, Ferlin W, Rose-John S, Ruwanpura S and Jenkins BJ:
IL6 trans-signaling promotes KRAS-driven lung carcinogenesis.
Cancer Res. 76:866–876. 2016. View Article : Google Scholar : PubMed/NCBI
|
|
32
|
GeneSupport Center of NCBI. https://www.ncbi.nlm.nih.gov/gene/
|
|
33
|
Neuwald AF and Hirano T: HEAT repeats
associated with condensins, cohesins, and other complexes involved
in chromosome-related functions. Genome Res. 10:1445–1452. 2000.
View Article : Google Scholar : PubMed/NCBI
|
|
34
|
Wang J, Wu Y, Guo J, Fei X, Yu L and Ma S:
Adipocyte-derived exosomes promote lung cancer metastasis by
increasing MMP9 activity via transferring MMP3 to lung cancer
cells. Oncotarget. 8:81880–81891. 2017.PubMed/NCBI
|
|
35
|
Chen Q, Yin D, Zhang Y, Yu L, Li XD, Zhou
ZJ, Zhou SL, Gao DM, Hu J, Jin C, et al: MicroRNA-29a induces loss
of 5-hydroxymethylcytosine and promotes metastasis of
hepatocellular carcinoma through a TET-SOCS1-MMP9 signaling axis.
Cell Death Dis. 8:e29062017. View Article : Google Scholar : PubMed/NCBI
|
|
36
|
Xie H, Li L, Zhu G, Dang Q, Ma Z, He D,
Chang L, Song W, Chang HC, Krolewski JJ, et al: Correction:
Infiltrated pre-adipocytes increase prostate cancer metastasis via
modulation of the miR-301a/androgen receptor (AR)/TGF-β1/Smad/MMP9
signals. Oncotarget. 7:83829–83830. 2016. View Article : Google Scholar : PubMed/NCBI
|
|
37
|
Limoge M, Safina A, Beattie A, Kapus L,
Truskinovsky AM and Bakin AV: Tumor-fibroblast interactions
stimulate tumor vascularization by enhancing cytokine-driven
production of MMP9 by tumor cells. Oncotarget. 8:35592–35608. 2017.
View Article : Google Scholar : PubMed/NCBI
|
|
38
|
Reiner AT, Tan S, Agreiter C, Auer K,
Bachmayr-Heyda A, Aust S, Pecha N, Mandorfer M, Pils D, Brisson AR,
et al: EV-associated MMP9 in high-grade serous ovarian cancer is
preferentially localized to Annexin V-Binding EVs. Dis Markers.
2017:96531942017. View Article : Google Scholar : PubMed/NCBI
|
|
39
|
Bischoff JR, Anderson L, Zhu Y, Mossie K,
Ng L, Souza B, Schryver B, Flanagan P, Clairvoyant F, Ginther C, et
al: A homologue of Drosophila aurora kinase is oncogenic and
amplified in human colorectal cancers. EMBO J. 17:3052–3065. 1998.
View Article : Google Scholar : PubMed/NCBI
|
|
40
|
Zhou H, Kuang J, Zhong L, Kuo WL, Gray JW,
Sahin A, Brinkley BR and Sen S: Tumour amplified kinase STK15/BTAK
induces centrosome amplification, aneuploidy and transformation.
Nat Genet. 20:189–193. 1998. View
Article : Google Scholar : PubMed/NCBI
|
|
41
|
Tanner MM, Grenman S, Koul A, Johannsson
O, Meltzer P, Pejovic T, Borg A and Isola JJ: Frequent
amplification of chromosomal region 20q12-q13 in ovarian cancer.
Clin Cancer Res. 6:1833–1839. 2000.PubMed/NCBI
|
|
42
|
Bao Z, Lu L, Liu X, Guo B, Zhai Y, Li Y,
Wang Y, Xie B, Ren Q, Cao P, et al: Association between the
functional polymorphism Ile31Phe in the AURKA gene and
susceptibility of hepatocellular carcinoma in chronic hepatitis B
virus carriers. Oncotarget. 8:54904–54912. 2017. View Article : Google Scholar : PubMed/NCBI
|
|
43
|
Wang L, Arras J, Katsha A, Hamdan S,
Belkhiri A, Ecsedy J and El-Rifai W: Cisplatin-resistant cancer
cells are sensitive to Aurora kinase A inhibition by alisertib. Mol
Oncol. 11:981–995. 2017. View Article : Google Scholar : PubMed/NCBI
|
|
44
|
Do TV, Hirst J, Hyter S, Roby KF and
Godwin AK: Aurora A kinase regulates non-homologous end-joining and
poly(ADP-ribose) polymerase function in ovarian carcinoma cells.
Oncotarget. 8:50376–50392. 2017. View Article : Google Scholar : PubMed/NCBI
|
|
45
|
Yang G, Chang B, Yang F, Guo X, Cai KQ,
Xiao XS, Wang H, Sen S, Hung MC, Mills GB, et al: Aurora kinase A
promotes ovarian tumorigenesis through dysregulation of the cell
cycle and suppression of BRCA2. Clin Cancer Res. 16:3171–3181.
2010. View Article : Google Scholar : PubMed/NCBI
|
|
46
|
Wang Y, Wang Z, Qi Z, Yin S, Zhang N, Liu
Y, Liu M, Meng J, Zang R, Zhang Z and Yang G: The negative
interplay between Aurora A/B and BRCA1/2 controls cancer cell
growth and tumorigenesis via distinct regulation of cell cycle
progression, cytokinesis, and tetraploidy. Mol Cancer. 13:942014.
View Article : Google Scholar : PubMed/NCBI
|
|
47
|
Brodie KM and Henderson BR:
Characterization of BRCA1 protein targeting, dynamics, and function
at the centrosome: A role for the nuclear export signal, CRM1, and
Aurora A kinase. J Biol Chem. 287:7701–7716. 2012. View Article : Google Scholar : PubMed/NCBI
|
|
48
|
Dann RB, DeLoia JA, Timms KM, Zorn KK,
Potter J, Flake DD II, Lanchbury JS and Krivak TC: BRCA1/2
mutations and expression: Response to platinum chemotherapy in
patients with advanced stage epithelial ovarian cancer. Gynecol
Oncol. 125:677–682. 2012. View Article : Google Scholar : PubMed/NCBI
|
|
49
|
Muggia F and Safra T: ‘BRCAness’ and its
implications for platinum action in gynecologic cancer. Anticancer
Res. 34:551–556. 2014.PubMed/NCBI
|
|
50
|
Rao ZY, Cai MY, Yang GF, He LR, Mai SJ,
Hua WF, Liao YJ, Deng HX, Chen YC, Guan XY, et al: EZH2 supports
ovarian carcinoma cell invasion and/or metastasis via regulation of
TGF-beta1 and is a predictor of outcome in ovarian carcinoma
patients. Carcinogenesis. 31:1576–1583. 2010. View Article : Google Scholar : PubMed/NCBI
|
|
51
|
Gao J, Zhu Y, Nilsson M and Sundfeldt K:
TGF-β isoforms induce EMT independent migration of ovarian cancer
cells. Cancer Cell Int. 14:722014. View Article : Google Scholar : PubMed/NCBI
|
|
52
|
Villanueva MT: Anticancer drugs: All roads
lead to EZH2 inhibition. Nat Rev Drug Discov. 16:2392017.
View Article : Google Scholar : PubMed/NCBI
|