Introduction
Hepatocellular carcinoma (HCC) remains one of the
main malignancies worldwide with a poor 5-year survival rate
(1–4). Generally, patients are diagnosed with
HCC at an advanced stage, and a large number of HCC patients show
intrahepatic metastasis and postoperative recurrence (5). In the Chinese population, the
development of HCC has been associated with the hepatitis B virus
(HBV) and hepatitis C virus (HCV) infections in most patients
(6). The long-term symptoms of
inflammation, chronic hepatitis and cirrhosis contribute to the
virus-initiated tumorigenic process (7,8). For
the treatment of HCC, liver transplantation or tumor resection is
always the most effective treatment. Furthermore, the high rate of
metastasis or postsurgical recurrence remains an obstacle to a
better prognosis of HCC patients (9,10).
Thus, it is imperative to explore the mechanism of HCC, which may
lead to novel insights for the diagnosis and treatment of HCC
patients.
Long non-coding RNAs (lncRNAs) include the recently
identified class of non-protein coding RNA transcripts of 200
nucleotides to 100 kb in length (11–13).
Accumulating evidence has demonstrated that lncRNAs may contribute
to various biological processes, including proliferation,
apoptosis, invasion and metastasis (14–16).
However, the particular mechanisms of many lncRNAs remain vague.
lncRNA PVT1 is located on chromosomal region 8q24, which is a
well-known cancer-related region (17). Previous studies have confirmed that
the overexpression of PVT1 accelerates the development and
progression of cancer and reduces the chemosensitivity of cancer
patients. Although, compared with normal liver tissues, PVT1 showed
a high expression in HCC, improved proliferation and predicted
recurrence, the precise functions and mechanism of PVT1 in HCC
remain to be elucidated (18–20).
miRNAs refer to small non-coding RNAs with nearly 20
nucleotides. Recent studies have confirmed that lncRNAs can affect
HCC via combining the expression of miRNAs (21,22).
For example, Liu et al (21)
found that lncRNA FTX inhibited the proliferation and metastasis of
HCC by binding to miR-374a. Zhu et al (22) revealed that lncRNA LINC00052
inhibited the invasion and migration of HCC by binding to
miR-452-5p. Therefore, it is of great significance to further
explore the miRNA expression profile associated with lncRNA in HCC
in order to identify novel therapeutic strategies.
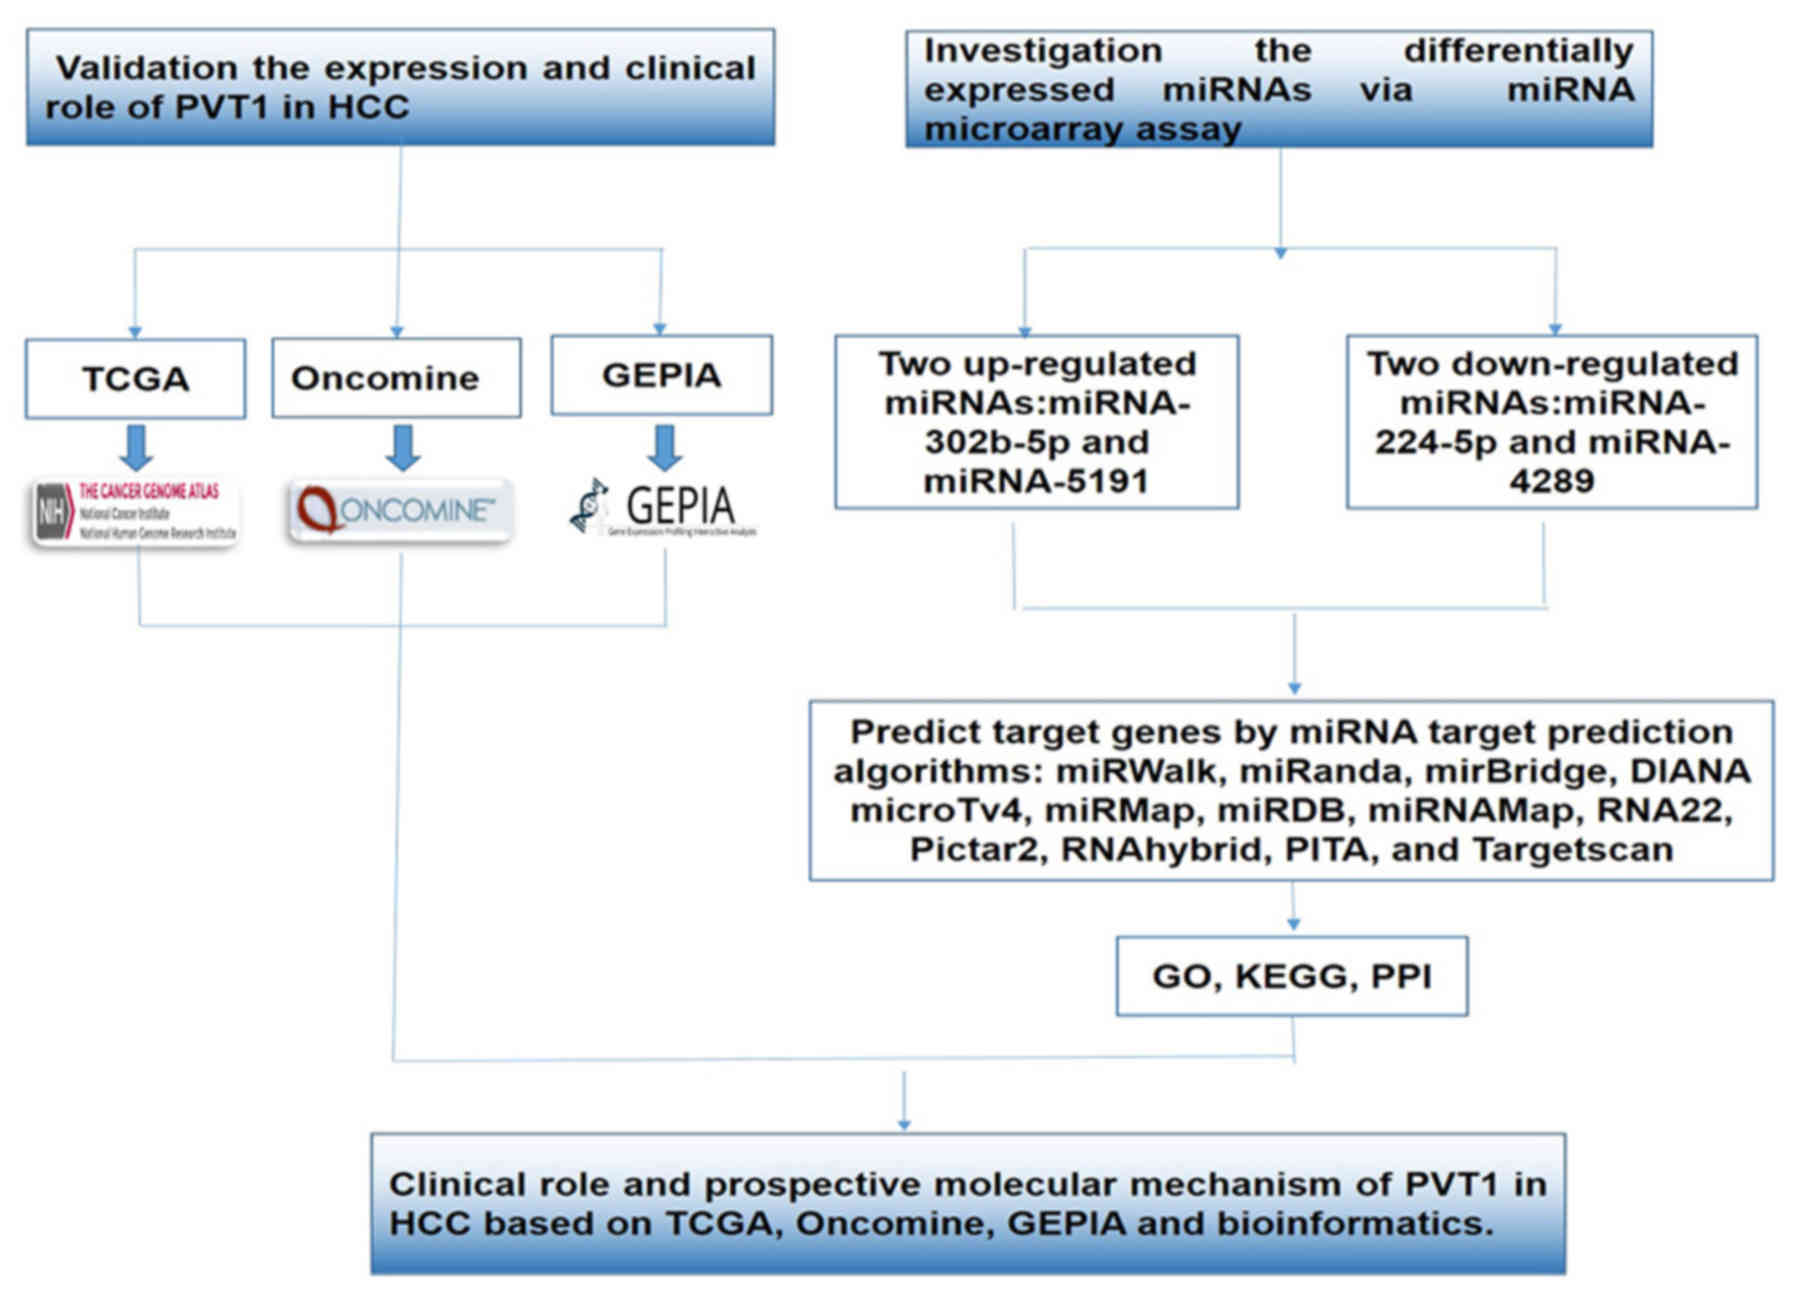
In the present study, we validated the differential
PVT1 expression in normal liver and HCC. Furthermore, we combined
the miRNA expression profile after silencing PVT1 expression and
miRNA target prediction algorithms to explore the underlying target
genes related to PVT1 in HCC. Bioinformatics analysis, involving
Gene Ontology (GO), Kyoto Encyclopedia of Genes and Genomes (KEGG),
protein-protein interactions (PPIs) and network analyses, was
utilized to explore the underlying functions, pathways and networks
of the target genes (23–26). Furthermore, the relationship between
PVT1 and the clinical parameters in HCC was confirmed based on the
original data in the TCGA database. A flow chart of the present
study is shown in Fig. 1.
Materials and methods
Cell culture and siRNA
transfection
Human HCC cells (SMMC-7721) were obtained from the
American Type Culture Collection (ATCC), and the SMMC-7721 cells
were cultured in Dulbecco's modified Eagle's medium (DMEM)
supplemented with 1% penicillin/streptomycin and 10% fetal bovine
serum (FBS) at 37°C in a humidified incubator with 5%
CO2. The Lenti-siRNA vector of PVT1 was produced by
GeneChem (Shanghai, China) (sense, 5′-CCCAACAGGAGGACAGCUUTT-3′ and
antisense, 5′-AAGCUGUCCUCCUGUUGGGTT-3′). siRNA vectors of PVT1 were
transfected into HCC cells according to the manufacturer's
protocol.
miRNA microarray analysis
The sample analysis and miRNA microarray
hybridization were completed by Kangchen Bio-tech (Shanghai,
China). Briefly, miRNA labeling was performed using the
miRCURY™ Array Power Labeling kit (cat. no. 208032-A;
Exiqon, Vedbaek, Denmark). Then, the labeled sample was combined
with 2X Hybridization buffer (Phalanx Hyb). Assembly and miRCURY™
Array, was used for miRNA array hybridization. miRNA array scanning
and analysis were applied via Axon GenePix 4000B microarray scanner
and GenePix pro V6.0 software (Molecular Devices, LLC, Sunnyvale,
CA, USA). Differentially expressed miRNAs between PVT1 RNAi and the
control groups were identified when fold-change (FC) was ≥2 or
≤0.5, and false discovery rate (FDR) <1 and P<0.05.
Validation of the expression of PVT1
in HCC
The TCGA database (http://cancergenome.nih.gov/) is a collection of DNA
methylation, RNA-Seq, miRNA-seq, SNP array and exome sequencing
(27,28). TCGA can also be used to further
explore the expression of complicated cancer genomics and clinical
parameters. In the present study, RNA-Seq data of HCC cases, which
were calculated on the IlluminaHiSeq RNA-Seq platform, were
obtained from the TCGA data portal (https://tcga-data.nci.nih.gov/tcga/), containing 374
HCC cases and 50 adjacent normal liver cases up to July 10, 2017.
The original expression data of PVT1 were exhibited as reads per
million (RPM) and the expression level of PVT1 was normalized by
the Deseq package of R language. Prior to applying further
analyses, we log transformed the original expression data for PVT1.
The difference expression of PVT1 in various clinicopathological
parameters in HCC was acknowledged based on the data from the TCGA
database. The diagnostic value of PVT1 was evaluated using the
receiver operating characteristic (ROC) curve. Additionally, the
genetic alteration of PVT1 in HCC was investigated based on TCGA.
Furthermore, Oncomine (https://www.oncomine.org/) and GEPIA (http://gepia.cancer-pku.cn/) databases were assisted
to validate PVT1 expression in HCC (29,30).
Target prediction and functional
analysis
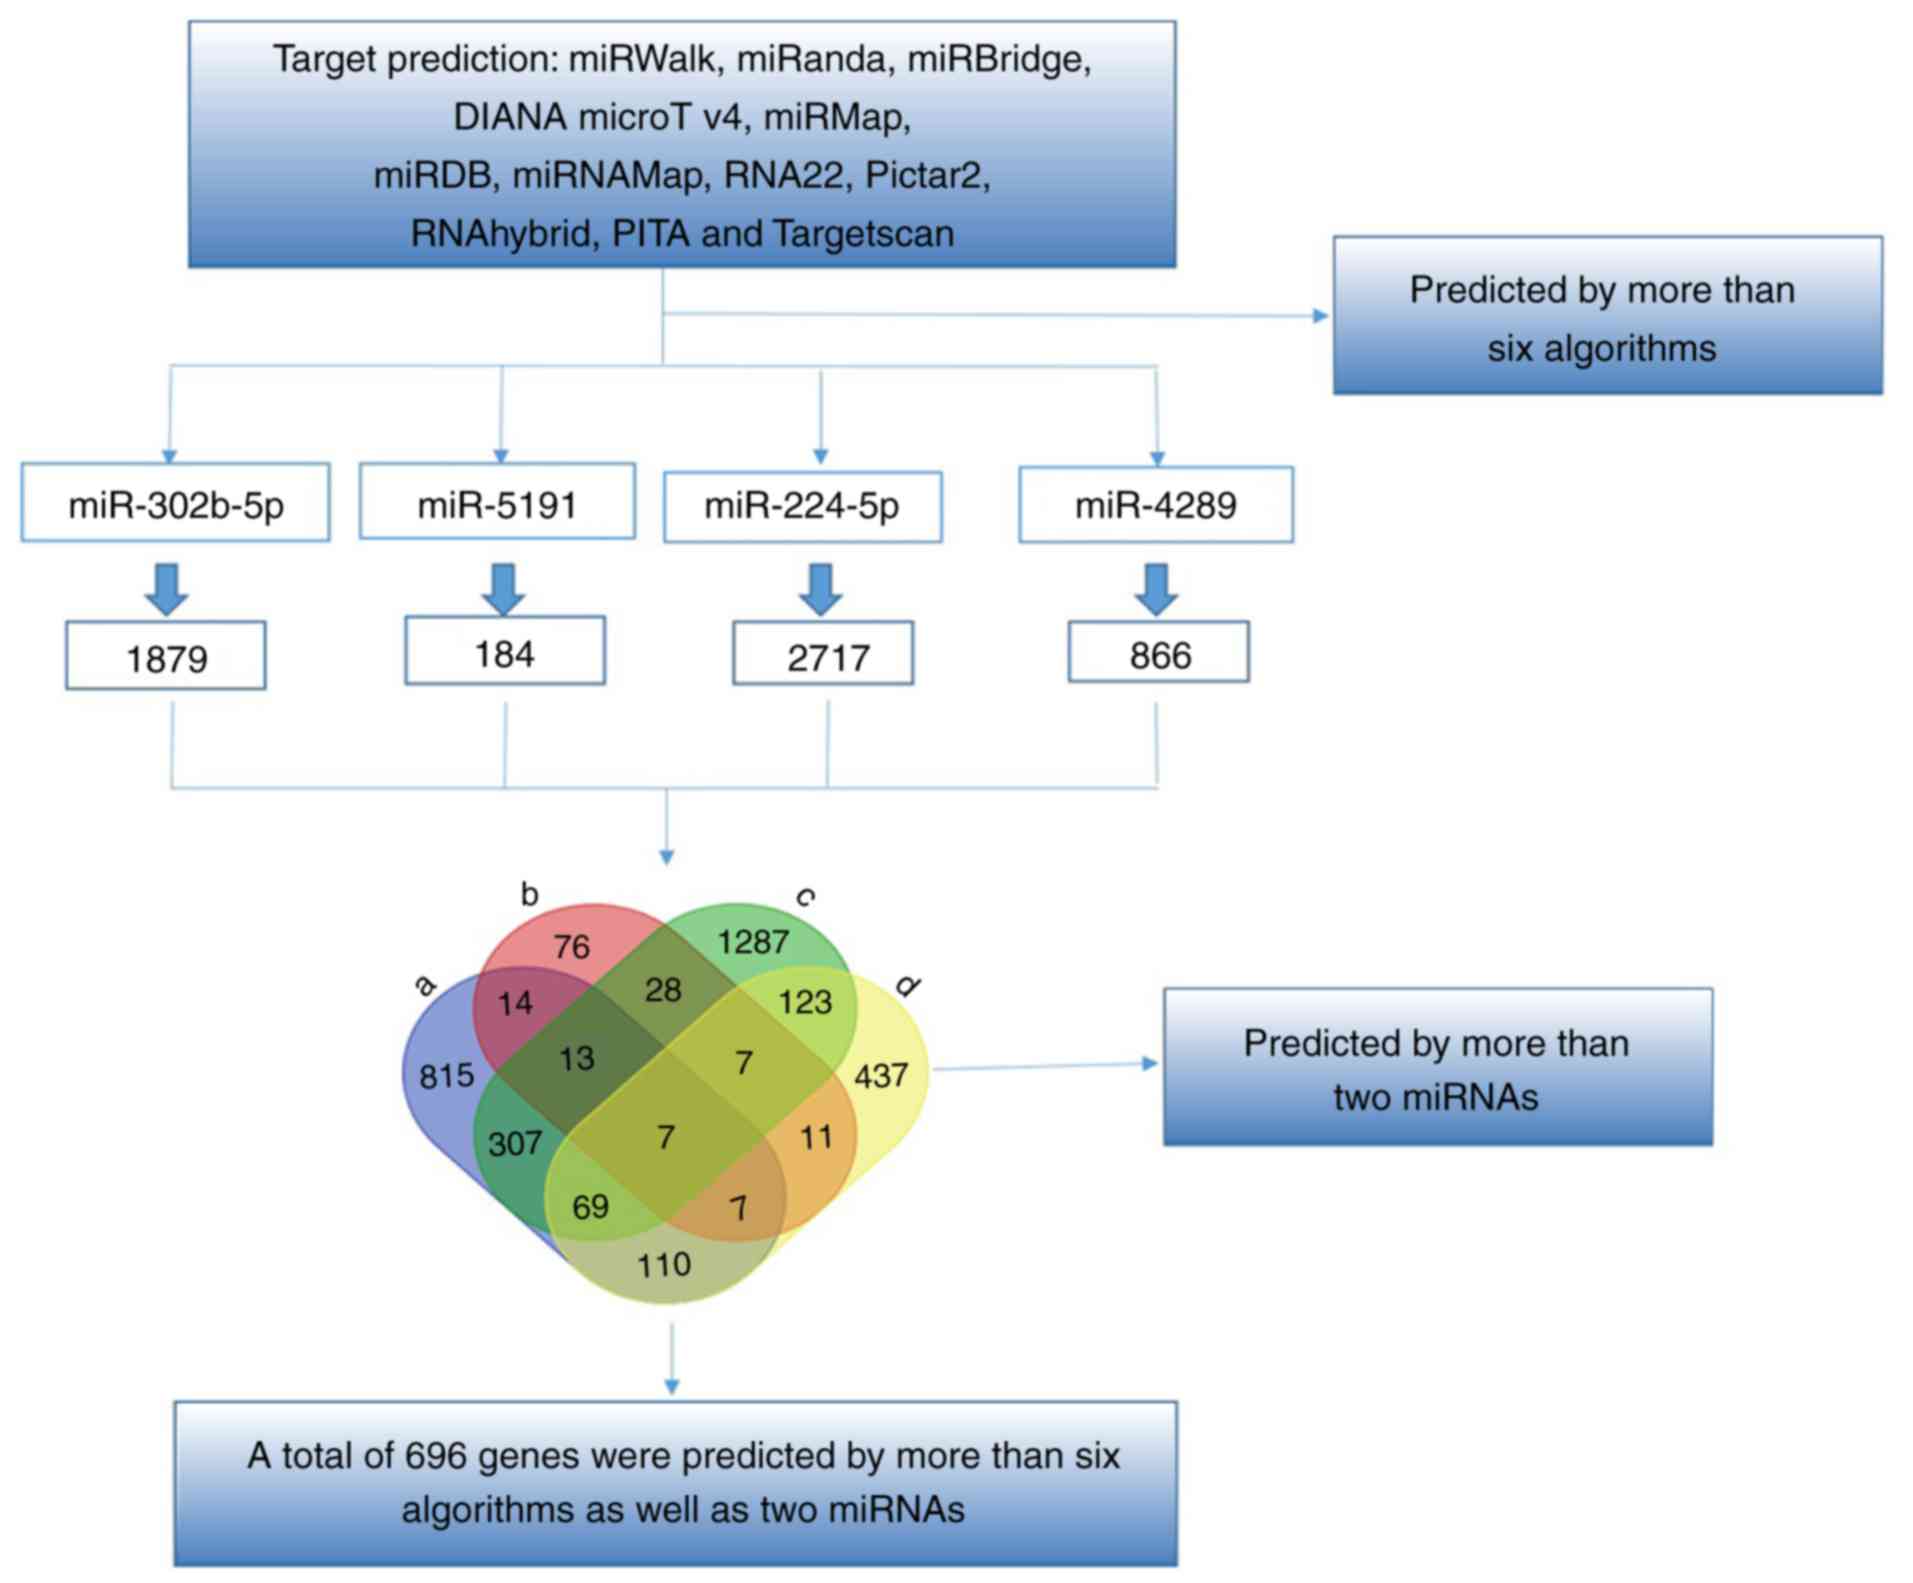
Twelve target prediction algorithms were used to
predict the probable target genes of miRNAs. The 12 corresponding
prediction algorithms were miRWalk (http://zmf.umm.uni-heidelberg.de/apps/zmf/mirwalk2/),
miRanda (http://www.microrna.org), mirBridge
(http://mirsystem.cgm.ntu.edu.tw/), DIANA
microT v4 (http://diana.imis.athena-innovation.gr/), miRMap
(http://mirmap.ezlab.org/), miRDB (http://www.mirdb.org/), miRNAMap (http://mirnamap.mbc.nctu.edu.tw/), RNA22
(https://cm.jefferson.edu/), Pictar2
(https://www.mdc-berlin.de/), RNAhybrid
(https://bibiserv.cebitec.uni-bielefeld.de/), PITA
(https://genie.weizmann.ac.il/), and
TargetScan (http://www.targetscan.org/), and the overlapping
target genes were identified via Venn diagrams (http://bioinformatics.psb.ugent.be/webtools/Venn/). In
addition, the HPA (http://www.proteinatlas.org) was used to explore the
protein expression of target genes in HCC and normal liver
tissues.
To further consider the potential functions,
pathways and networks of these target genes, bioinformatics
analyses (GO, KEGG and network analyses) were performed (31,32).
In this process, Database for Annotation, Visualization and
Integrated Discovery (DAVID: available online: http://david.abcc.ncifcrf.gov/) was utilized to
perform GO and KEGG analyses, and biological process (BP), cellular
component (CC) and molecular function (MF) categories were derived
from the GO analysis. Additionally, Cytoscape (version 2.8,
http://cytoscape.org) was applied to construct
the functional network.
Construction of protein-protein
interaction (PPI) network
The interaction pairs of the overlapped target genes
were researched by Search Tool for the Retrieval of Interacting
Genes (STRING; version 9.0, http://string-db.org) (33). The STRING database provides a
worldwide perspective for as many animals and mammals as feasible.
The predicted and acknowledged interactions are unified and scored.
The interaction pairs in PPI network were selected when the
combined score was >0.4.
Statistical analysis
SPSS 22.0 software (IBM Corp., Armonk, NY, USA) was
used for the statistical analysis. Data were expressed as mean ±
standard deviation (SD). Differences in the expression of PVT1 in
HCC and normal liver and various clinicopathological parameters
were estimated by the Student's t-test. The comparison between
different subgroups was performed by one-way analysis of variance
(ANOVA). Kaplan-Meier curves were used to detect the relationship
between the PVT1 expression and patient survival in HCC. In
addition, the ROC curve was used to predict the clinical diagnostic
value of PVT1, which was statistically significant when P<0.05
(two-sided).
Results
miRNA profiling associated with lncRNA
PVT1
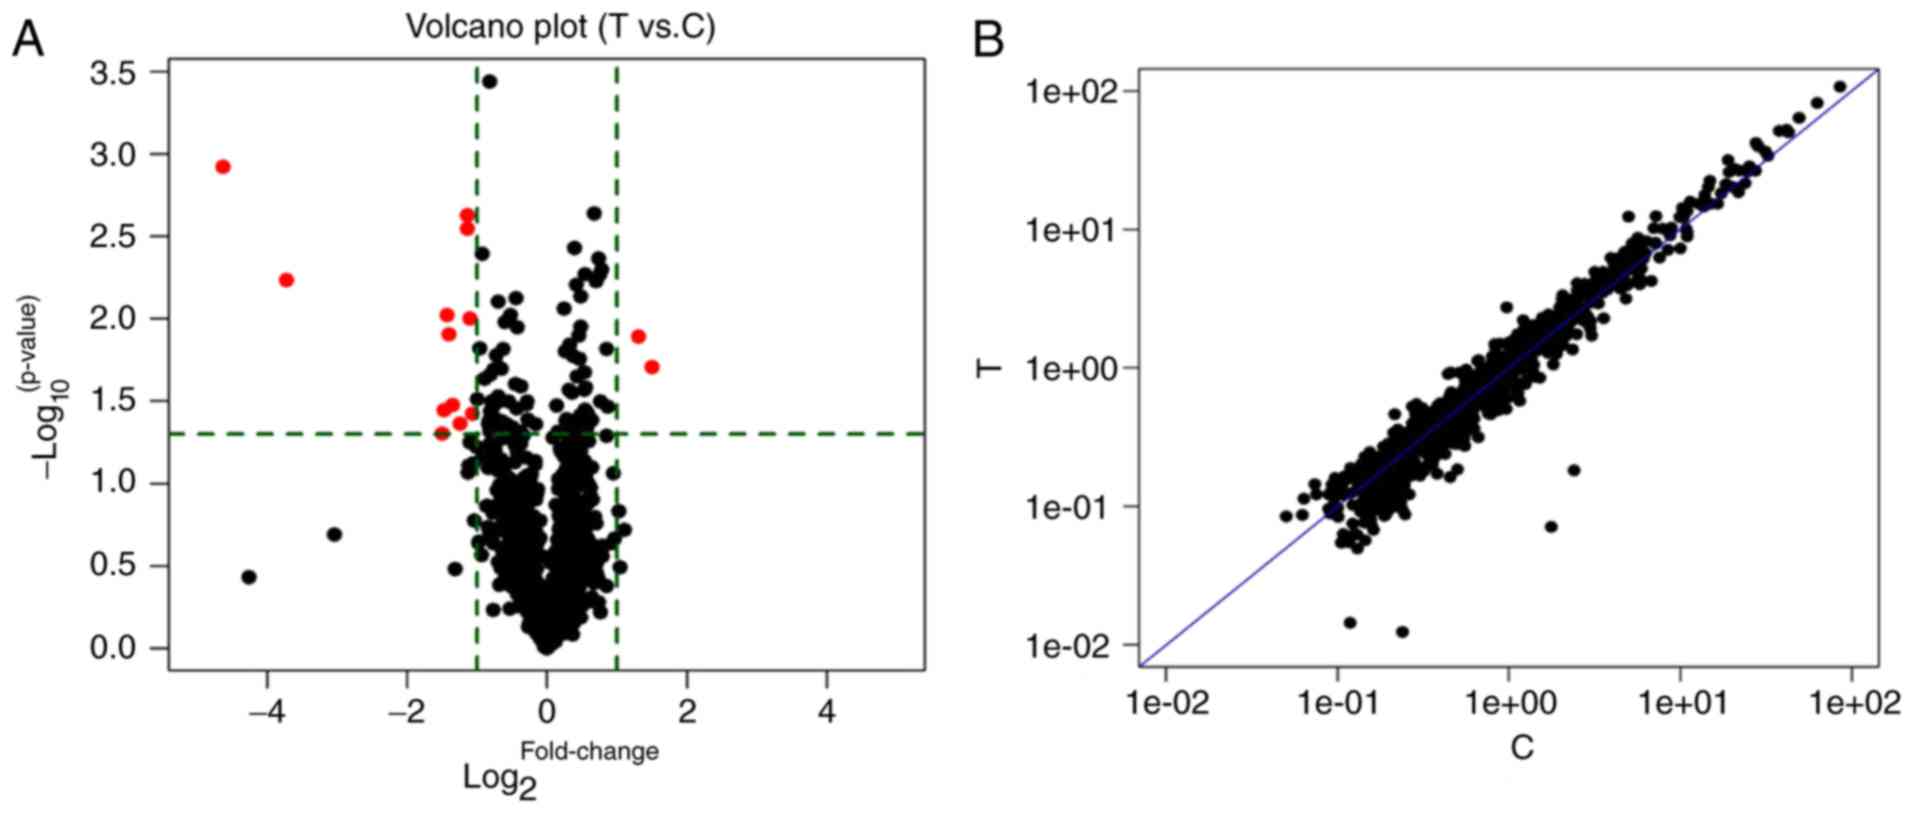
The transfection efficiency was ~90%, and the
knockdown efficiency of PVT1 in SMMC-7721 cells was >75% as
detected by RT-qPCR (data not shown). Next, a miRNA microarray
assay was applied to detect the differentially expressed miRNAs
between PVT1 RNAi and the control groups. We found that 2 miRNAs
were upregulated, and 12 miRNAs were downregulated in response to
PVT1 knockdown. A summary of the differentially expressed miRNAs is
shown in Fig. 2 and Table I. The top 2 upregulated
(miR-302b-5p, miR-5191) and downregulated miRNAs (miR-224-5p,
miR-4289) were finally selected as the most significant
differentially expressed miRNAs due to the FC, FDR and P-values.
Significance was determined via an FC ≥2 or ≤0.5, FDR <1 and
P<0.05 was applied (34). We
focused on the top two upregulated and downregulated miRNAs to
improve the accuracy and stability of the results. The targets of
the top dysregulated miRNAs may play key regulation roles in
PVT1-related HCC.
 | Table I.The top 2 upregulated and top 2
downregulated miRNAs. |
Table I.
The top 2 upregulated and top 2
downregulated miRNAs.
| Name | Fold-change | P-value | FDR |
|---|
| Upregulated
miRNAs |
|
miR-302b-5p | 2.832 | 0.020 | 0.441 |
|
miR-5191 | 2.477 | 0.013 | 0.409 |
| Downregulated
miRNAs |
|
miR-224-5p | 0.372 | 0.009 | 0.398 |
|
miR-4289 | 0.453 | 0.002 | 0.349 |
|
miR-UL22A-5p | 0.040 | 0.001 | 0.349 |
|
miR-548aa/miR-548t-3p | 0.455 | 0.003 | 0.371 |
|
miR-544b | 0.076 | 0.006 | 0.379 |
|
miR-374c-3p | 0.465 | 0.010 | 0.398 |
|
miR-5009-5p | 0.379 | 0.012 | 0.407 |
|
miR-138-1-3p | 0.392 | 0.033 | 0.441 |
|
miR-154-5p | 0.360 | 0.036 | 0.441 |
|
miR-5003-5p | 0.475 | 0.038 | 0.441 |
|
miR-195-5p | 0.421 | 0.043 | 0.441 |
|
miR-3131 | 0.354 | 0.049 | 0.441 |
Validation of the expression of PVT1
in HCC
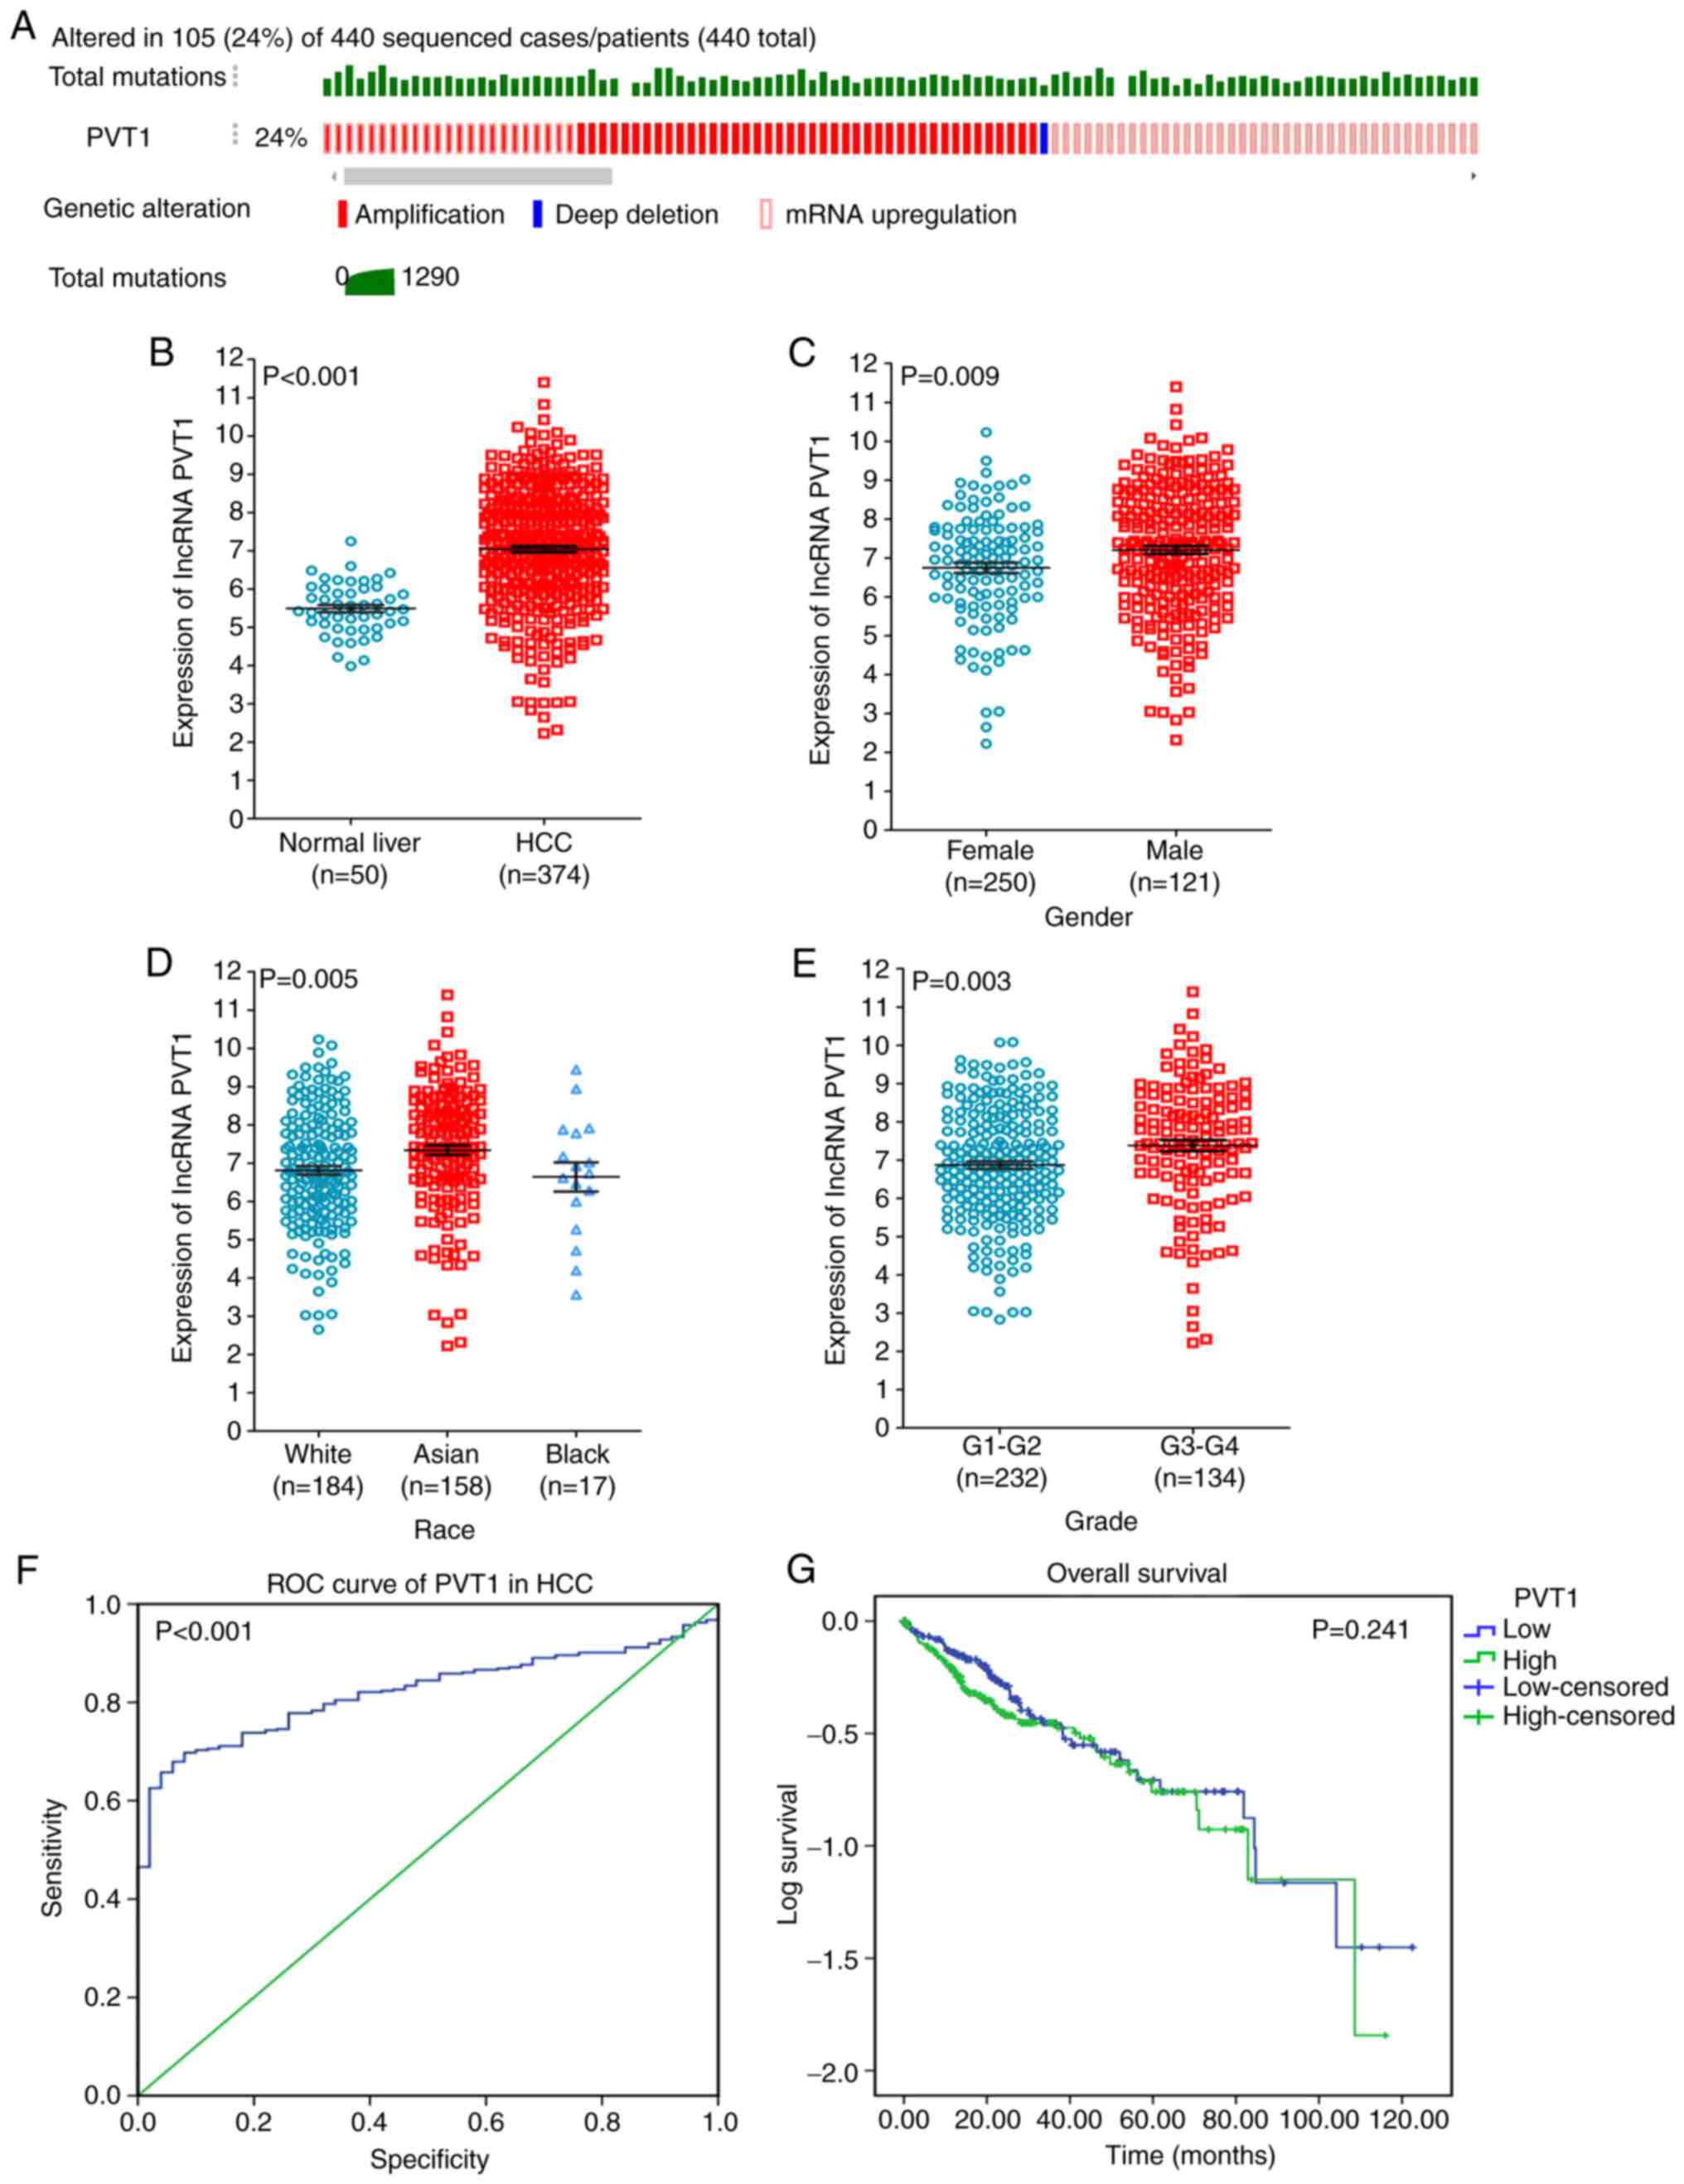
Based on TCGA, 24% cases of PVT1 in HCC were found,
which contained amplification, deep deletion and mRNA upregulation
(Fig. 3A). To demonstrate the vital
role of PVT1 in HCC, a clinical study was performed using the
original data in TCGA. The results showed the obvious high
expression of PVT1 in HCC compared to that in normal liver tissues
(P<0.001, Fig. 3B). Moreover, a
statistically significant higher PVT1 expression was observed in
sex (male), ethnicity (Asian) and pathological grade (G3+G4)
compared with that in the control groups (P<0.05; Fig. 3C-E and Table II). Moreover, the area under curve
(AUC) of PVT1 was 0.822 (95% CI, 0.780–0.863), indicating a
moderate diagnostic value of the PVT1 expression in HCC (Fig. 3F). Furthermore, we investigated a
different PVT1 expression in other clinical parameters of HCC, but
no positive results were found based on the TCGA database. In
addition, we investigated the relationship between the PVT1
expression and patient survival. A low PVT1 expression was
correlated with improved survival (64.31±5.17 months) compared to
the high PVT1 expression group (59.59±4.75 months, P=0.241;
Fig. 3G) in HCC.
| Table II.Differential expression of PVT1 of
other clinicopathological parameters in HCC based on TCGA. |
Table II.
Differential expression of PVT1 of
other clinicopathological parameters in HCC based on TCGA.
|
|
| PVT1
expression |
|
|---|
|
|
|
|
|
|---|
| Clinicopathological
parameters | N | Mean ± SD | T | P-value |
|---|
| Tissues |
| Normal
liver | 50 | 5.489±0.095 | 12.43 | <0.001 |
|
HCC | 374 | 7.044±0.082 |
|
|
| Age (years) |
|
<60 | 169 | 7.078±1.493 | 0.305 | 0.761 |
|
≥60 | 201 | 7.027±1.651 |
|
|
| Sex |
|
Male | 250 | 7.206±1.624 | 2.631 | 0.009 |
|
Female | 121 | 6.749±1.447 |
|
|
| Race |
|
White | 184 | 6.811±1.525 | F=5.436 | 0.005 |
|
Black | 17 | 6.642±1.575 |
|
|
|
Asian | 158 | 7.340±1.604 |
|
|
| T (tumor) |
|
T1+T2 | 275 | 7.045±1.516 | −0.308 | 0.758 |
|
T3+T4 | 93 | 7.104±1.779 |
|
|
| Stage |
|
I+II | 257 | 7.083±1.534 | 0.106 | 0.916 |
|
III+IV | 90 | 7.062±1.750 |
|
|
| Pathological
grade |
|
G1+G2 | 232 | 6.874±1.491 | −2.970 | 0.003 |
|
G3+G4 | 134 | 7.382±1.708 |
|
|
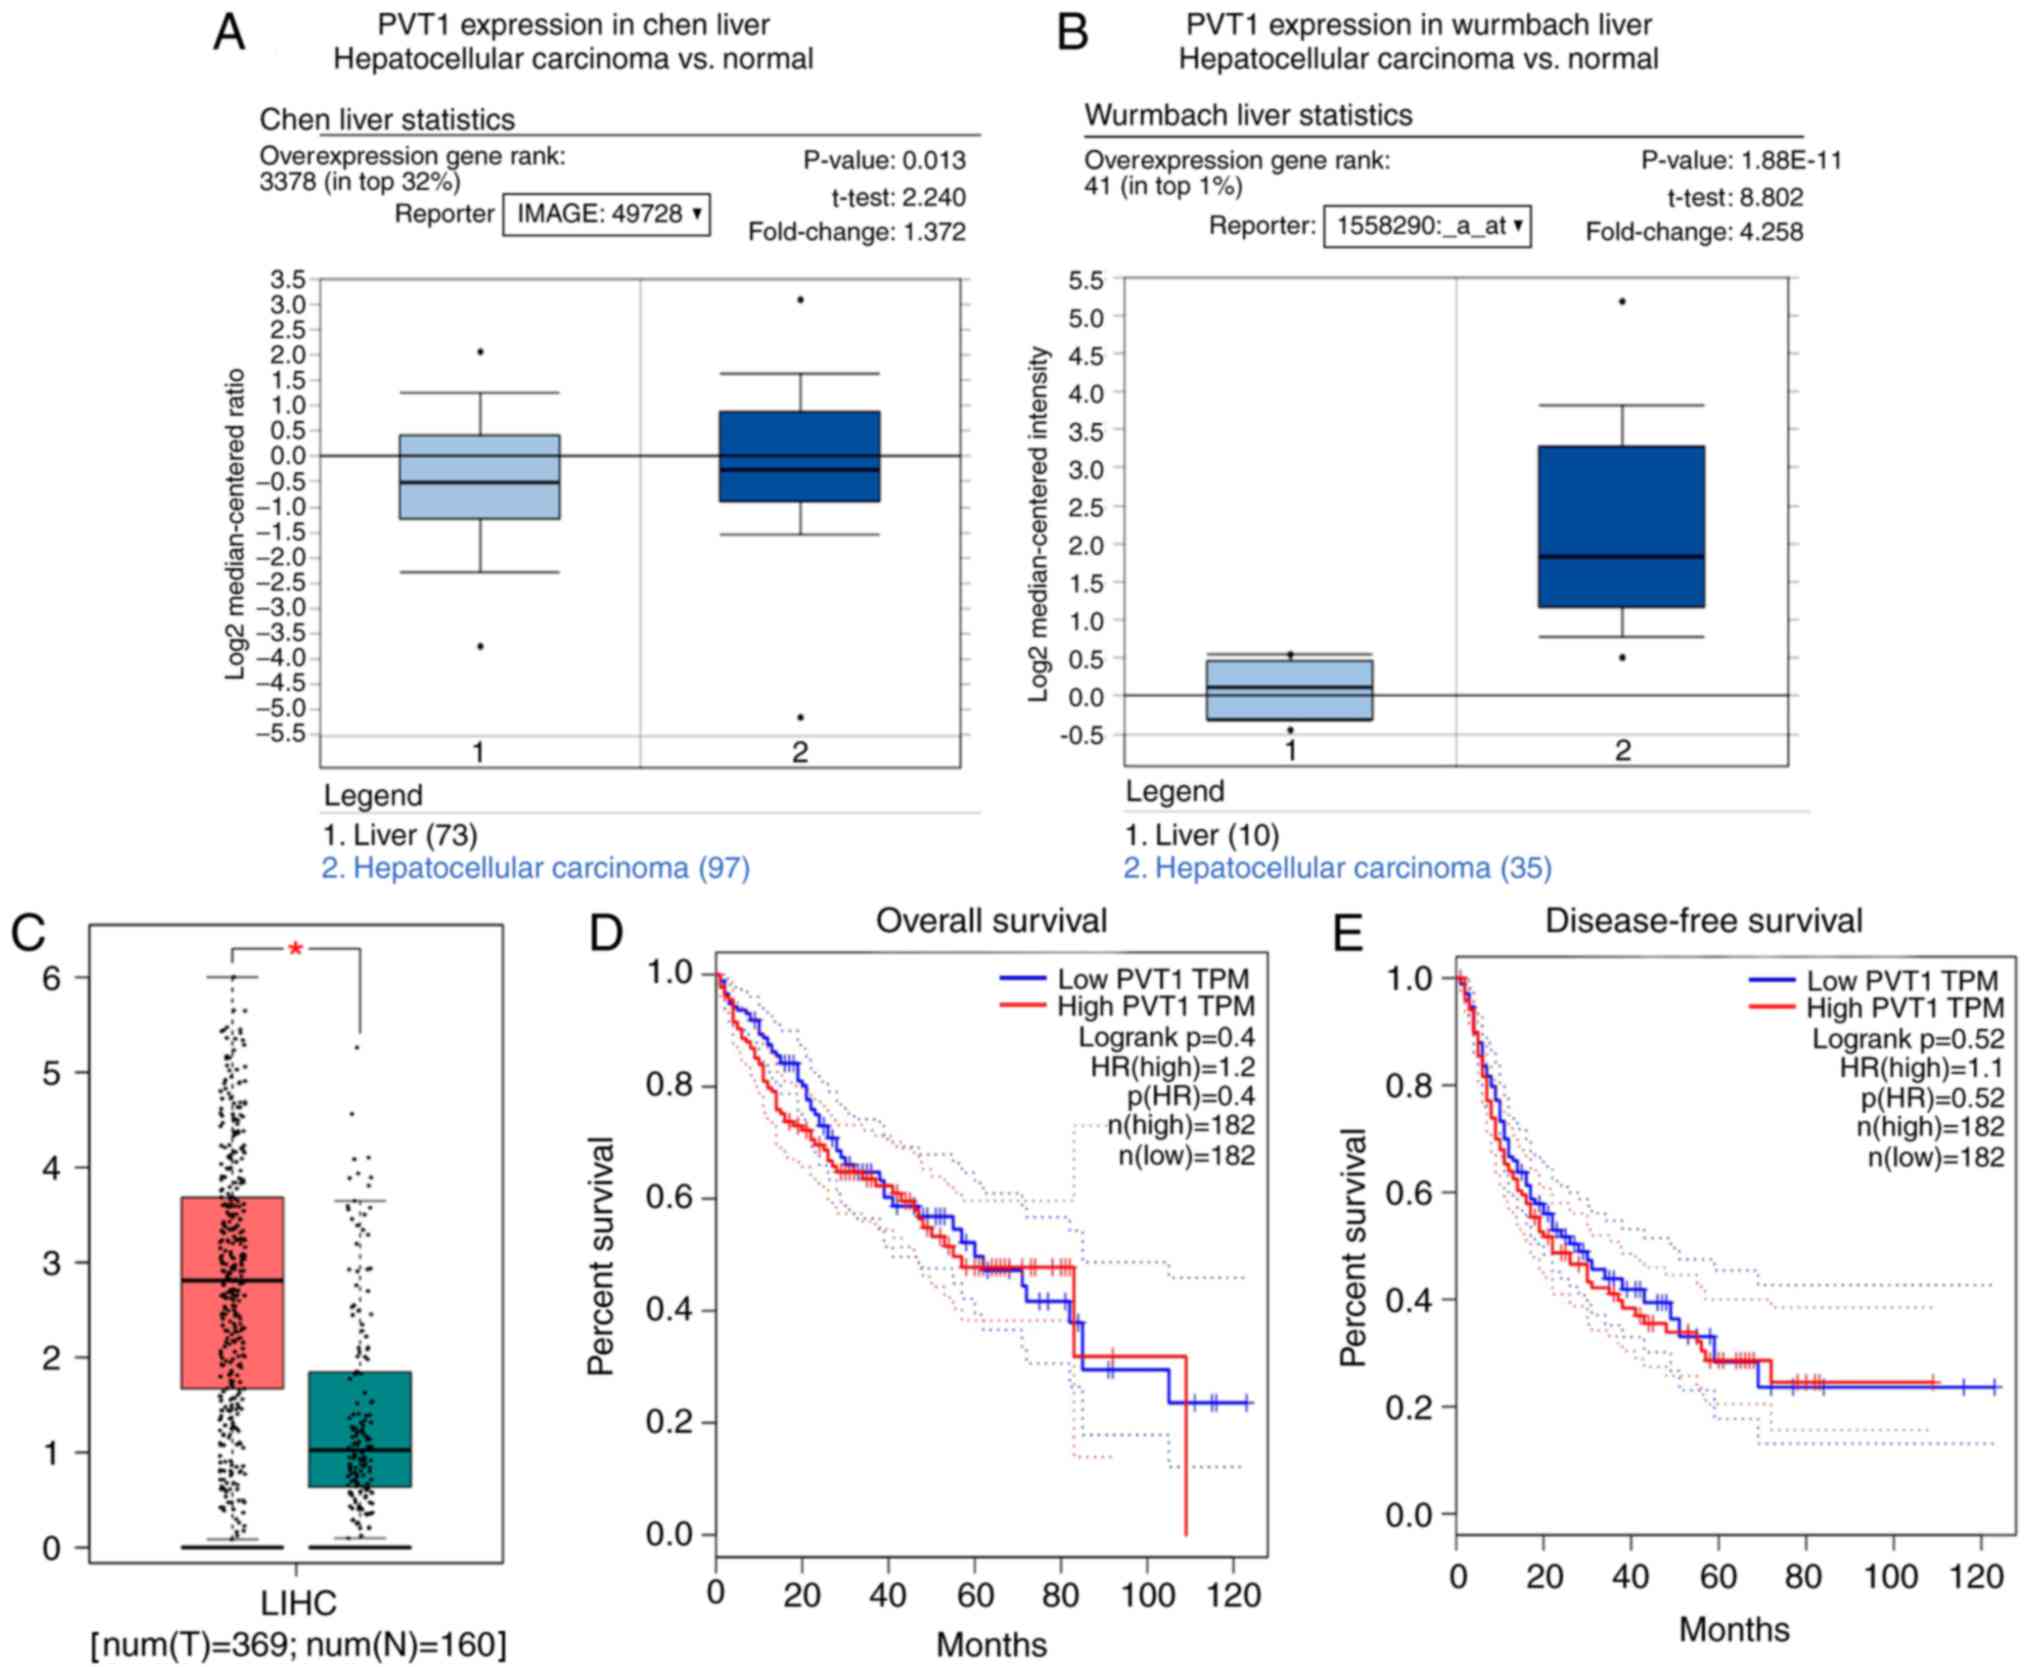
Moreover, the Oncomine and GEPIA databases confirmed
the high expression of PVT1 in HCC (Fig. 4A-C). Furthermore, GEPIA demonstrated
that patients with a low PVT1 expression have improved overall and
disease-free survival, consistent with the results in TCGA
(Fig. 4D and E).
Target prediction and functional
analysis
In the present study, 12 miRNA target prediction
algorithms were utilized to predict the potential target genes of
the four miRNAs. The genes predicted by >6 algorithms were
selected as the final target genes. Among these target genes, 696
genes were predicted by >2 miRNAs, and these 696 genes were used
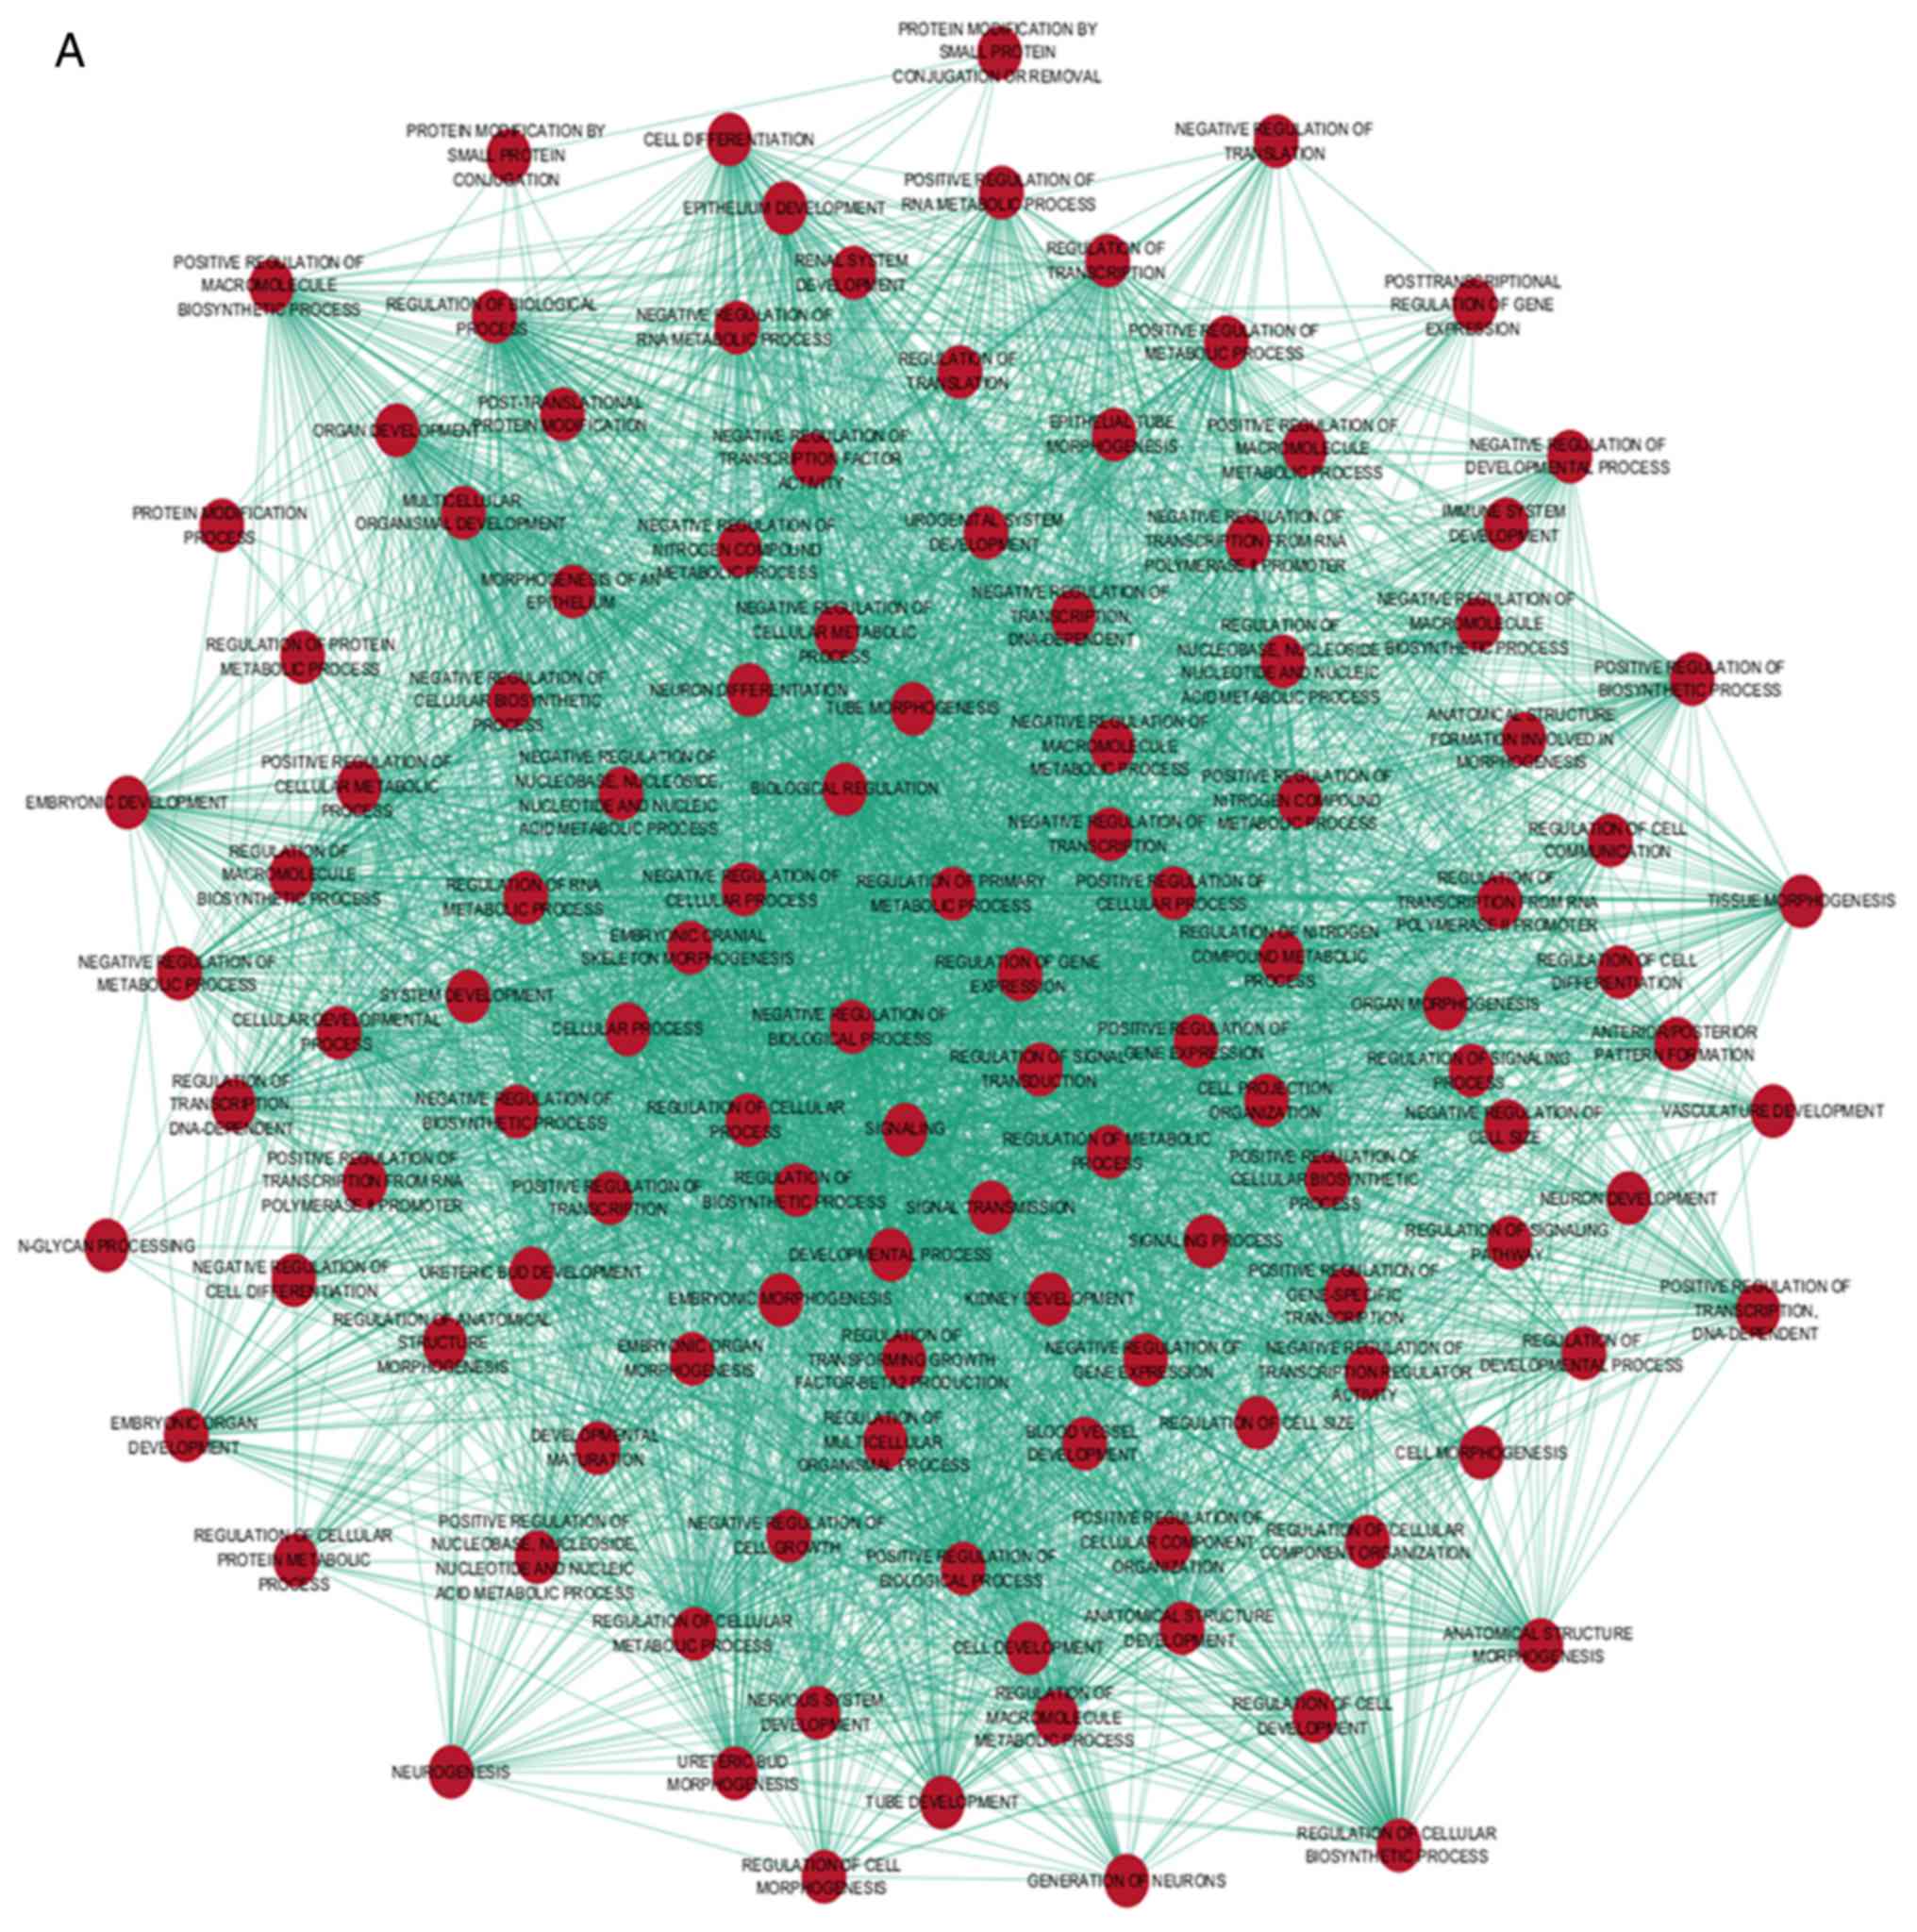
for the GO and pathway analyses (Fig.
5). The GO analysis indicated that the target genes were
involved in complex cellular pathways, such as macromolecule
biosynthetic process, compound metabolic process and transcription
(Fig. 6 and Table III). The KEGG pathway analysis
revealed that the MAPK and Wnt signaling pathways may be associated
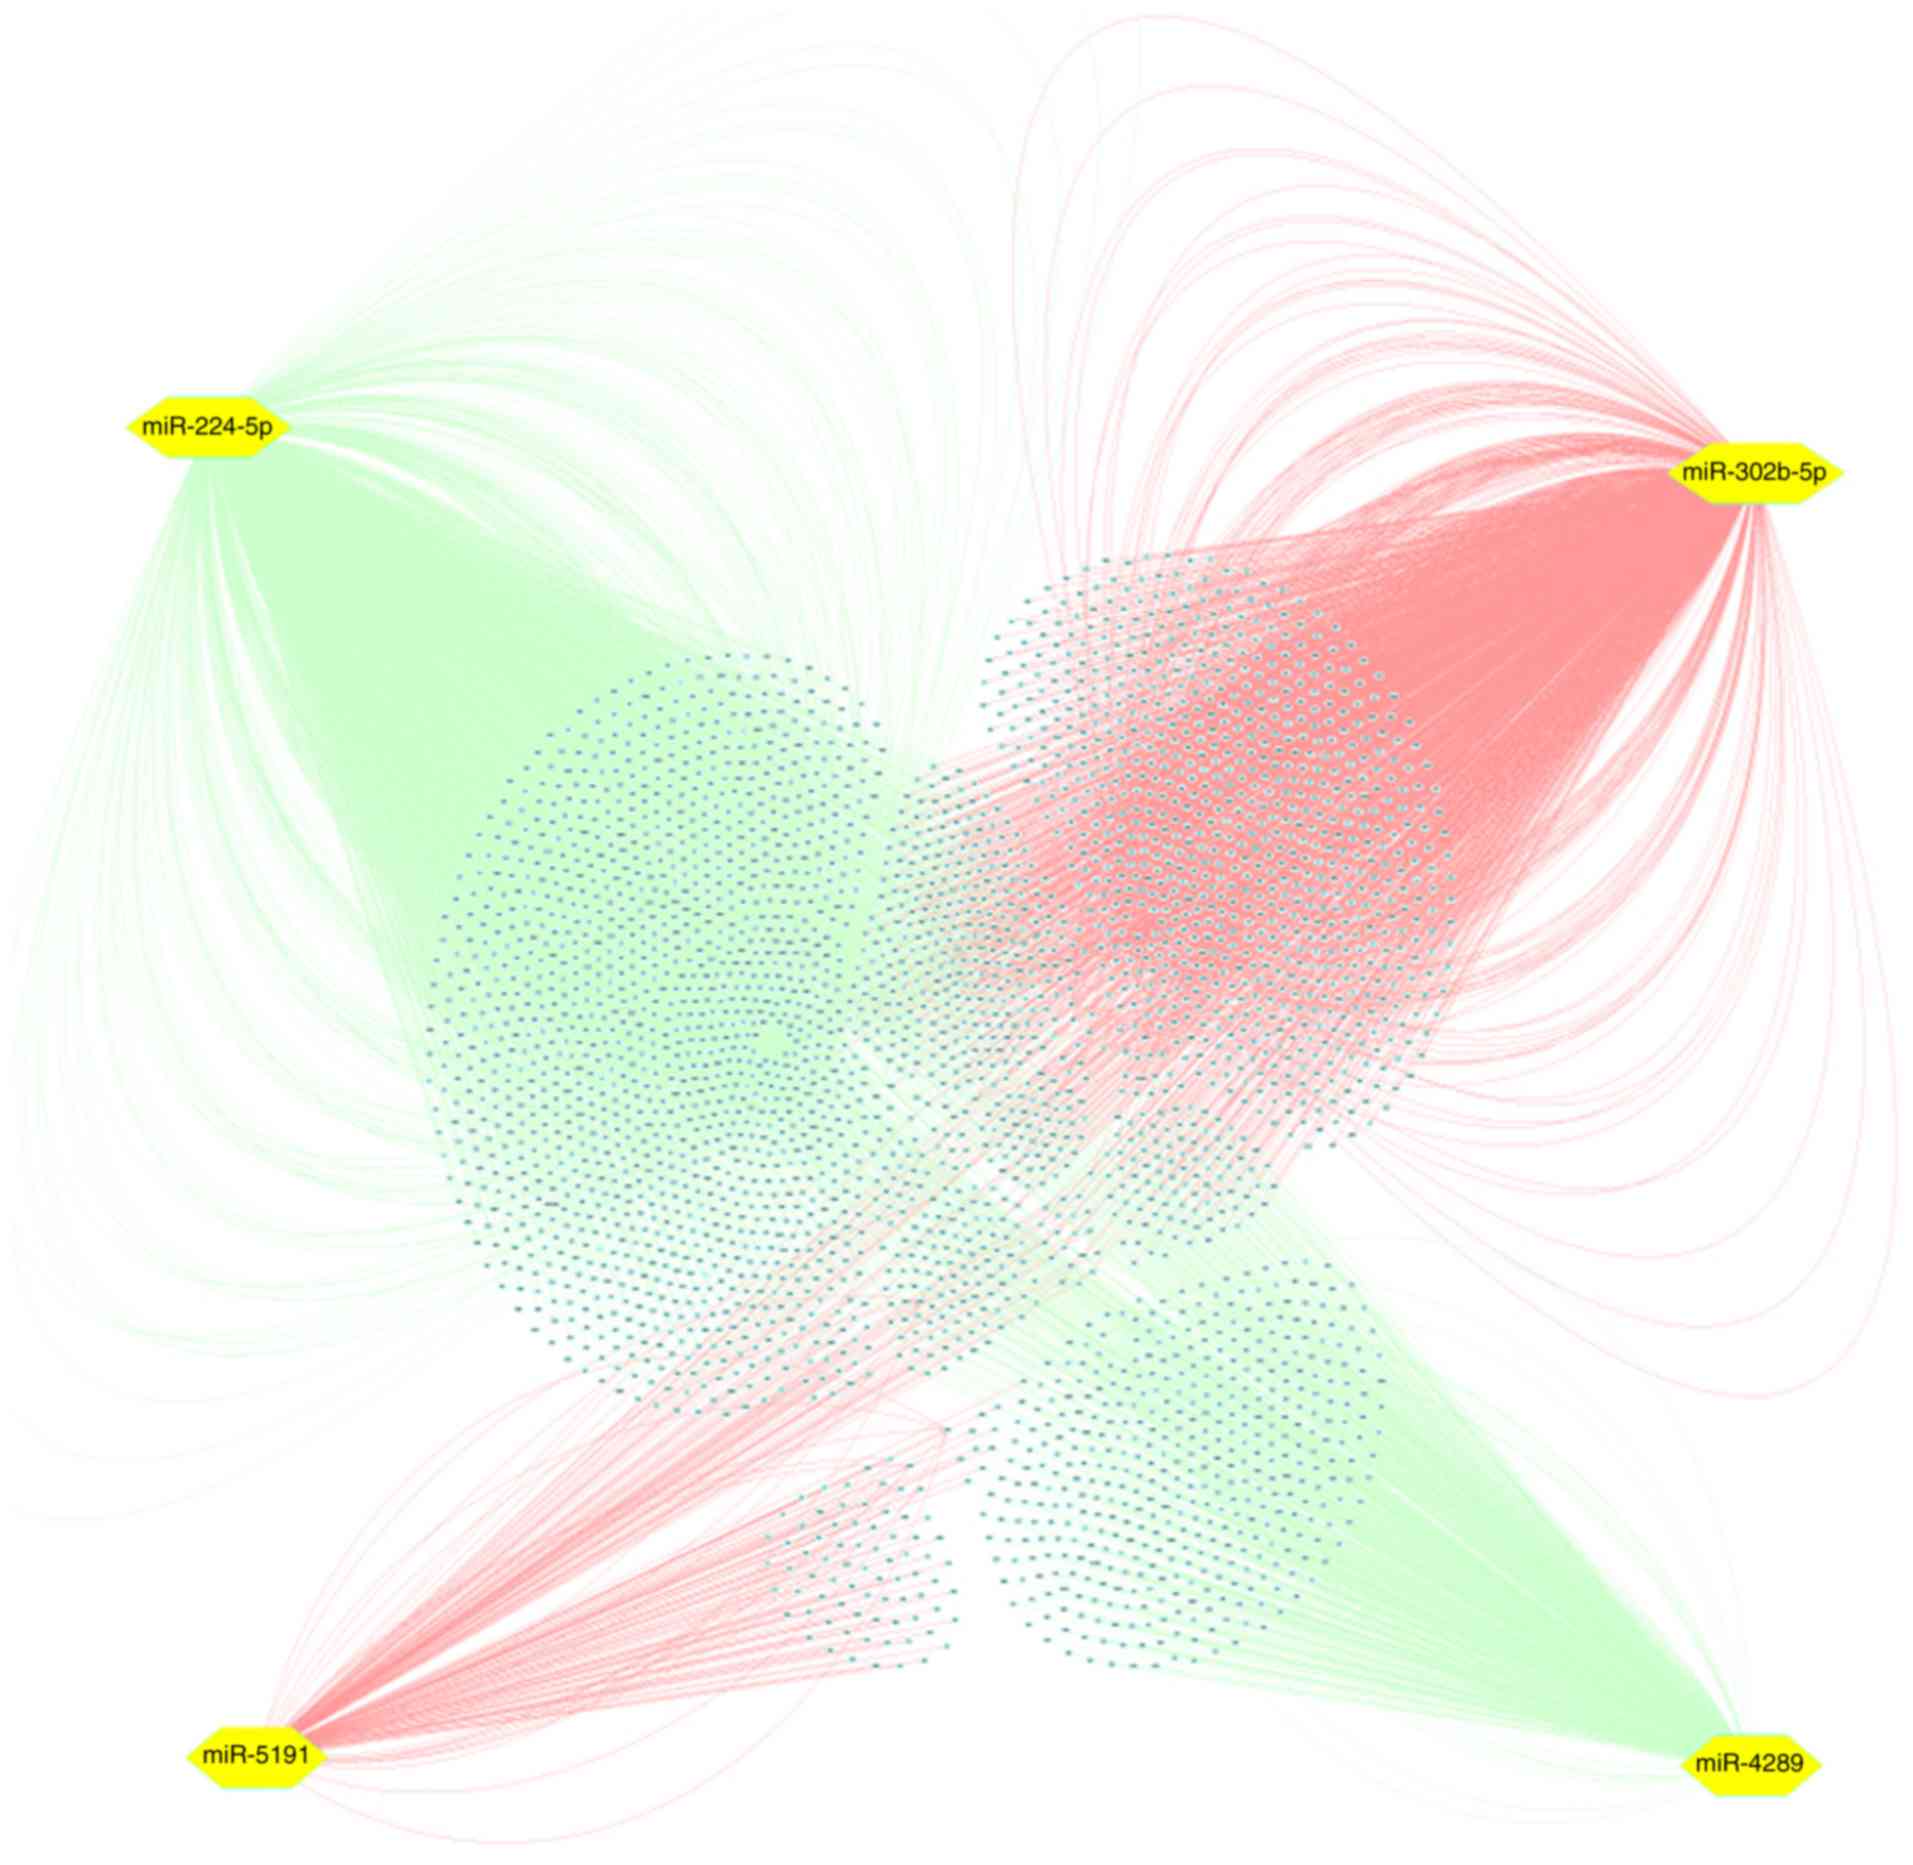
with regulation of the four candidate miRNAs (Table IV). To better identify the
relationships between PVT1, miRNAs and target genes, a network was
constructed via Cytoscape, and the genes were easily observed from
the network (Fig. 7).
| Table III.Top 10 enrichment GO terms (BP, CC
and MF) for the target genes of miRNAs. |
Table III.
Top 10 enrichment GO terms (BP, CC
and MF) for the target genes of miRNAs.
| GO ID | Term | Ontology | Count | Fold
enrichment | P-value |
|---|
| GO:0010557 | Positive regulation
of macromolecule biosynthetic process | BP | 53 | 2.197 | 1.24121E-07 |
| GO:0051173 | Positive regulation
of nitrogen compound metabolic process | BP | 52 | 2.189 | 1.89479E-07 |
| GO:0045941 | Positive regulation
of transcription | BP | 47 | 2.259 | 3.37814E-07 |
| GO:0009891 | Positive regulation
of biosynthetic process | BP | 54 | 2.106 | 3.51213E-07 |
| GO:0045893 | Positive regulation
of transcription, DNA-dependent | BP | 42 | 2.387 | 3.84168E-07 |
| GO:0045935 | Positive regulation
of nucleobase, nucleoside, nucleotide and nucleic acid metabolic
process | BP | 50 | 2.172 | 4.265E-07 |
| GO:0051254 | Positive regulation
of RNA metabolic process | BP | 42 | 2.367 | 4.81533E-07 |
| GO:0031328 | Positive regulation
of cellular biosynthetic process | BP | 53 | 2.098 | 5.24515E-07 |
| GO:0010628 | Positive regulation
of gene expression | BP | 47 | 2.193 | 7.8235E-07 |
| GO:0010604 | Positive regulation
of macromolecule metabolic process | BP | 60 | 1.898 | 2.2026E-06 |
| GO:0005635 | Nuclear
envelope | CC | 21 | 2.976 | 2.61292E-05 |
| GO:0030424 | Axon | CC | 18 | 3.287 | 3.2788E-05 |
| GO:0030426 | Growth cone | CC | 10 | 5.380 | 8.24587E-05 |
| GO:0030427 | Site of polarized
growth | CC | 10 | 5.282 | 9.56427E-05 |
| GO:0045202 | Synapse | CC | 28 | 2.291 | 9.57691E-05 |
| GO:0043005 | Neuron
projection | CC | 27 | 2.293 | 0.0001 |
| GO:0031965 | Nuclear
membrane | CC | 11 | 4.377 | 0.0002 |
| GO:0016010 |
Dystrophin-associated glycoprotein
complex | CC | 6 | 10.253 | 0.0002 |
| GO:0031252 | Cell leading
edge | CC | 15 | 3.158 | 0.0003 |
| GO:0044459 | Plasma membrane
part | CC | 105 | 1.385 | 0.0003 |
| GO:0003700 | Transcription
factor activity | MF | 71 | 1.857 | 4.45E-07 |
| GO:0030528 | Transcription
regulator activity | MF | 95 | 1.603 | 2.72E-06 |
| GO:0043565 | Sequence-specific
DNA binding | MF | 45 | 1.891 | 5.87E-05 |
| GO:0008092 | Cytoskeletal
protein binding | MF | 36 | 1.822 | 0.0007 |
| GO:0016563 | Transcription
activator activity | MF | 31 | 1.929 | 0.0007 |
| GO:0051015 | Actin filament
binding | MF | 9 | 4.331 | 0.0010 |
| GO:0003779 | Actin binding | MF | 26 | 2.034 | 0.0010 |
| GO:0003702 | RNA polymerase II
transcription factor activity | MF | 20 | 2.091 | 0.0033 |
| GO:0005127 | Ciliary
neurotrophic factor receptor binding | MF | 3 | 25.507 | 0.0045 |
| GO:0019899 | Enzyme binding | MF | 34 | 1.658 | 0.0047 |
| Table IV.The top 10 KEGG pathways from the
enrichment analysis of the target genes of miRNAs. |
Table IV.
The top 10 KEGG pathways from the
enrichment analysis of the target genes of miRNAs.
| KEGG ID | KEGG term | Count | Fold
enrichment | P-value | Gene symbol |
|---|
| hsa04010 | MAPK signaling
pathway | 22 | 2.253 | 0.0006 | PRKCA, TAOK1,
TGFBR1, PPP3R2, STK4, PRKX, TGFB2, ATF2, MAP3K7, MAPK1, DUSP4,
RPS6KA3, RASGRF2, ELK4, ARRB1, MAP3K2, MAPT, PDGFRA, MAPK8,
RAPGEF2, CACNA1B, RASA2 |
| hsa04310 | Wnt signaling
pathway | 15 | 2.716 | 0.0011 | PRKCA, TBL1XR1,
VANGL1, SMAD4, PPP3R2, SMAD3, FZD3, DAAM1, FZD5, PRKX, MAP3K7,
CCND1, PSEN1, PRICKLE2, MAPK8 |
| hsa04360 | Axon guidance | 13 | 2.755 | 0.0024 | SEMA5A, ABLIM1,
MAPK1, SEMA6A, PLXNA2, NTN4, PPP3R2, ROBO2, EFNA5, DPYSL2, SLIT1,
SRGAP1, EPHA2 |
| hsa05210 | Colorectal
cancer | 10 | 3.255 | 0.0032 | MAPK1, CCND1,
TGFBR1, PDGFRA, SMAD4, SMAD3, FZD3, MAPK8, FZD5, TGFB2 |
| hsa05212 | Pancreatic
cancer | 9 | 3.417 | 0.0043 | MAPK1, CCND1,
TGFBR1, SMAD4, RALA, SMAD3, CDK6, MAPK8, TGFB2 |
| hsa05200 | Pathways in
cancer | 21 | 1.750 | 0.01500 | PRKCA, XIAP,
TGFBR1, MITF, SMAD4, RUNX1T1, SMAD3, CDK6, EGLN1, FZD3, FZD5, STK4,
TPM3, TGFB2, MAPK1, CCND1, HDAC2, CDKN2B, PDGFRA, RALA,
MAPK8 |
| hsa05220 | Chronic myeloid
leukemia | 8 | 2.916 | 0.01856 | MAPK1, CCND1,
HDAC2, TGFBR1, SMAD4, SMAD3, CDK6, TGFB2 |
| hsa04520 | Adherens
junction | 8 | 2.840 | 0.0212 | MAP3K7, MAPK1,
TGFBR1, SMAD4, SMAD3, PTPN1, MLLT4, VCL |
| hsa04120 | Ubiquitin-mediated
proteolysis | 11 | 2.195 | 0.027 | CUL3, UBE2D3,
UBE4A, XIAP, NEDD4, UBE2K, UBE2G1, UBA2, UBE2J1, UBE2W,
NEDD4L |
| hsa04144 | Endocytosis | 13 | 1.932 | 0.0350 | DNM3, RAB31,
RAB11FIP2, ERBB4, TFRC, NEDD4, ARRB1, TGFBR1, PSD3, PDGFRA, EEA1,
NEDD4L, PIP4K2B |
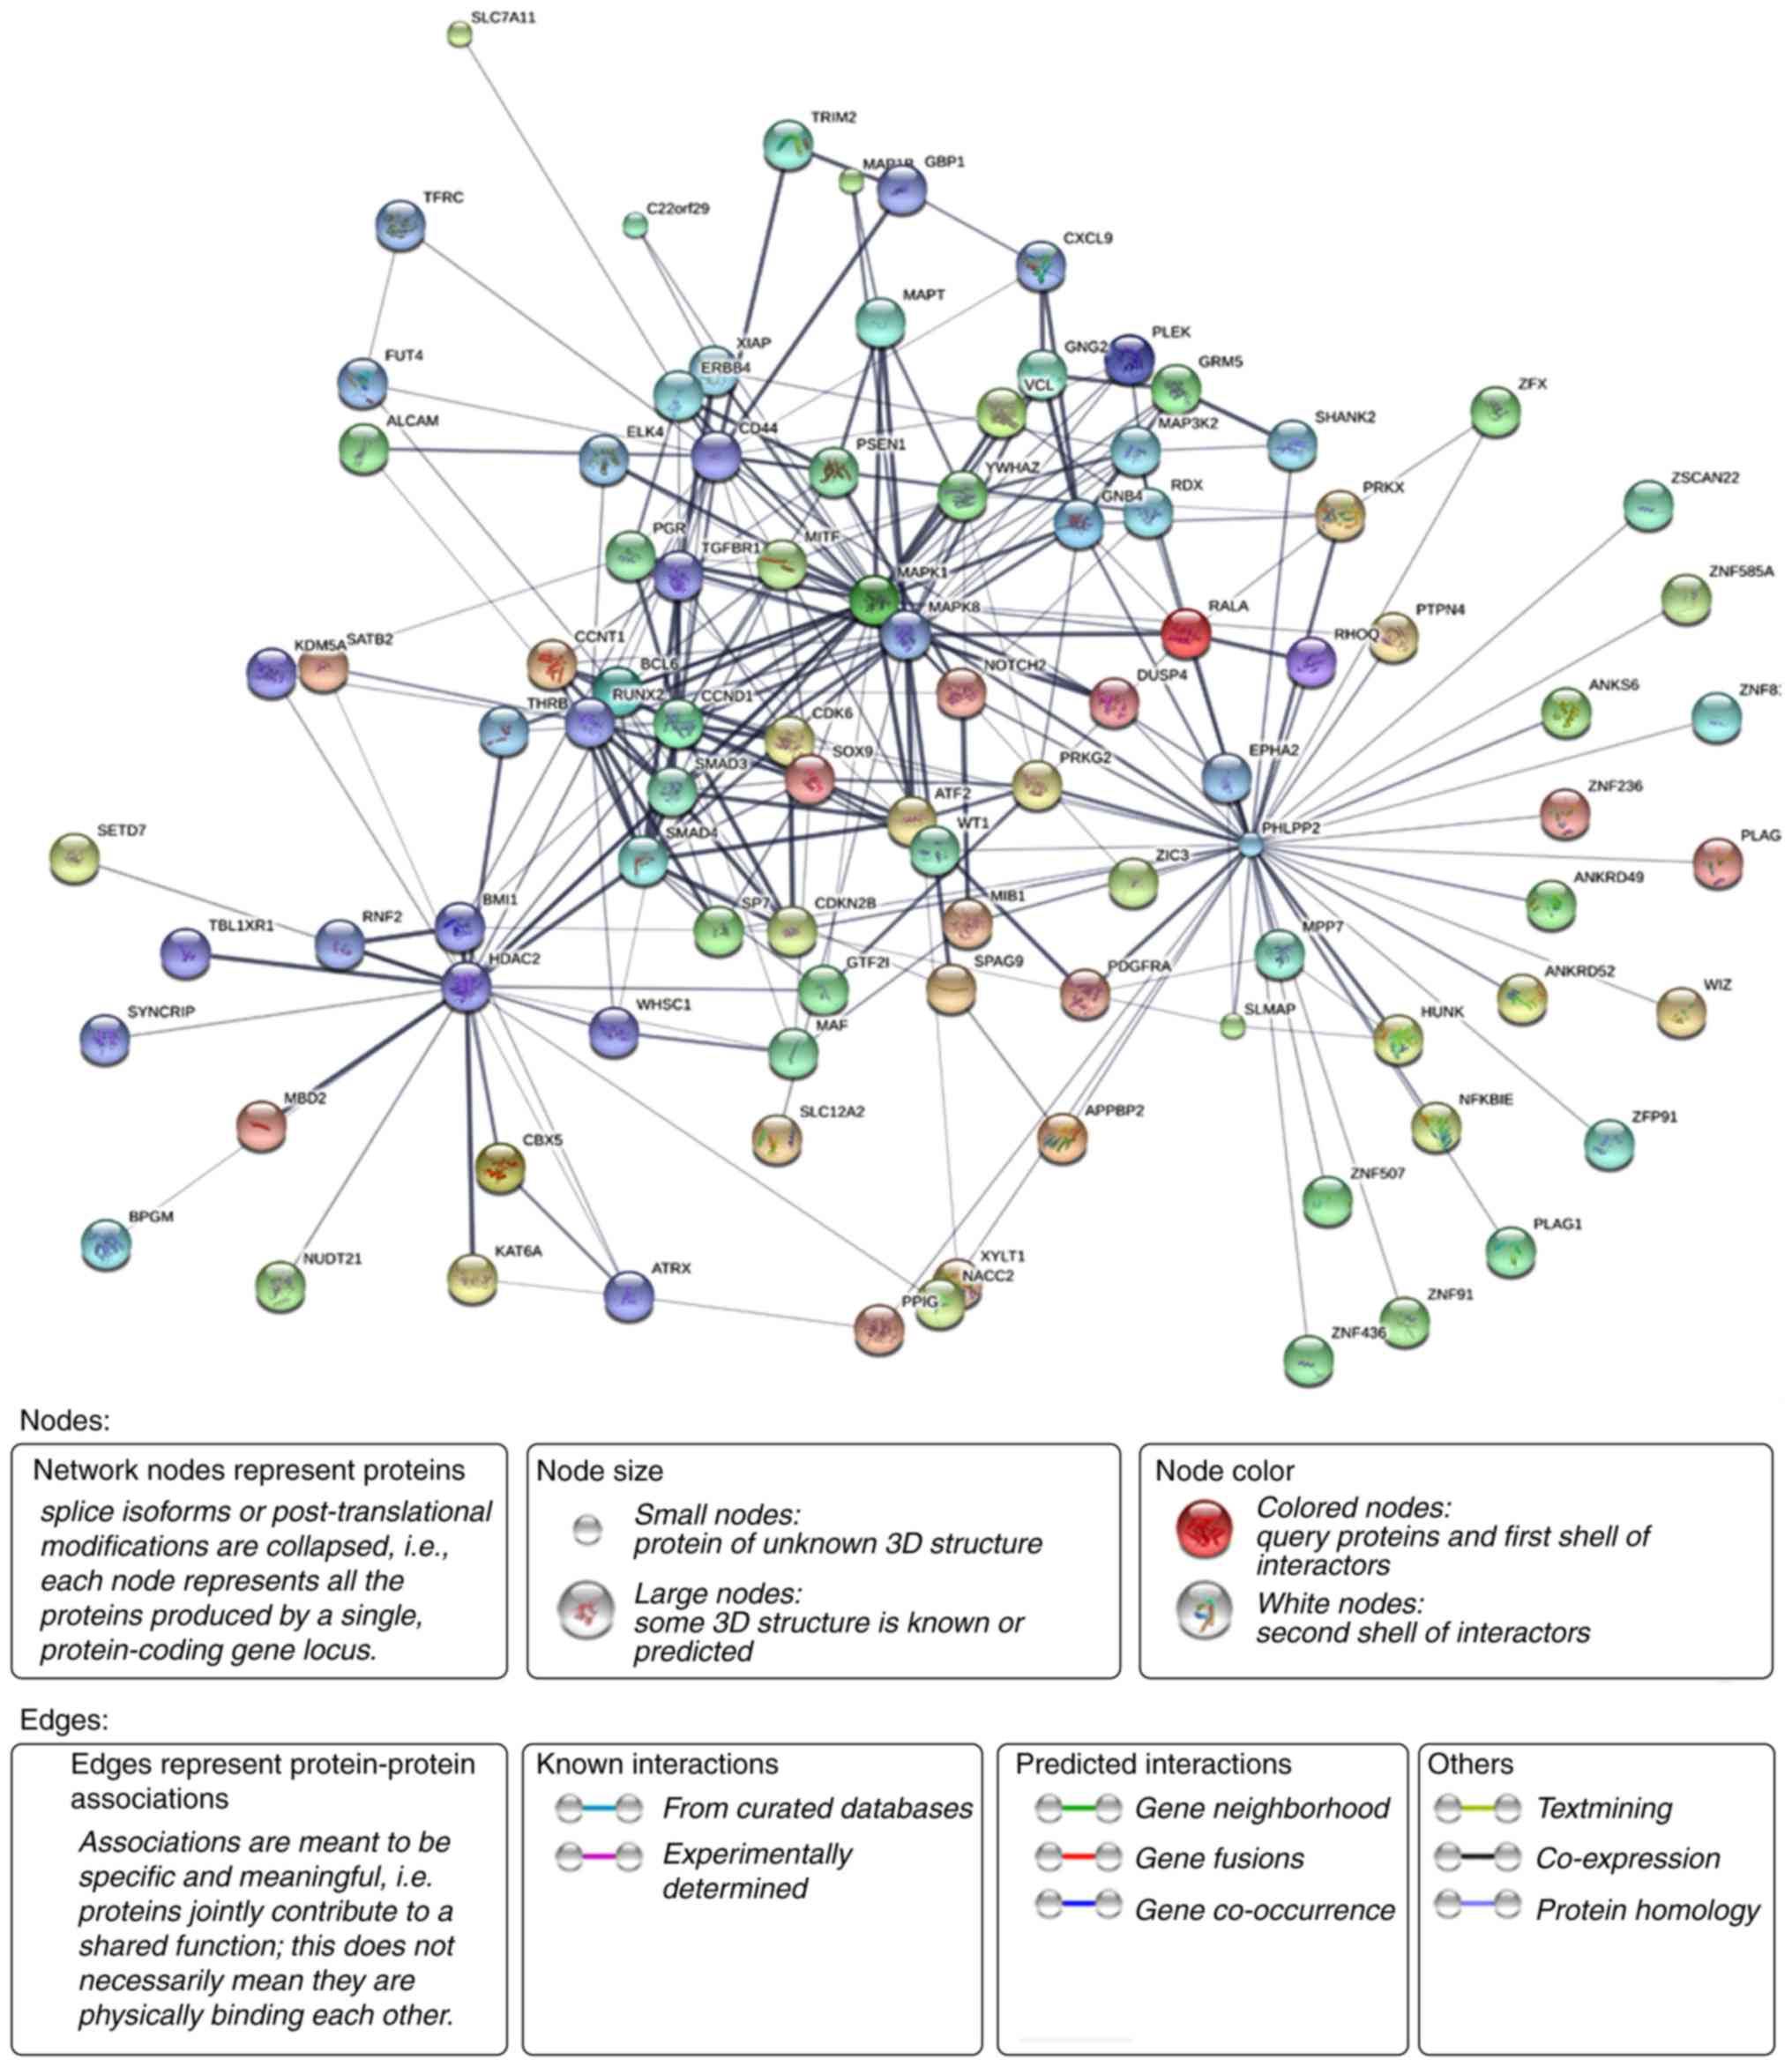
PPI network analysis
The STRING database was applied to construct the PPI
network and 1,420 PPI pairs with a combined score of <0.4 were
selected. PHLPP2 (degree, 42) and MAPK8 (degree, 26) had the
highest degree and interactions in the PPI network. Then, a
sub-network of 269 PPI pairs with >20 connectivity degrees was
constructed for further analysis (Fig.
8). The number of nodes was 96, accounting for 13.79% of all
the target genes. The clustering coefficient of PPI network was
0.634, which indicates that the PPI network had high cluster
properties.
In addition, the genes associated with the MAPK and
Wnt signaling pathways were selected based on the KEGG pathway
analysis. Five genes (PRKCA, MAPK8, PPP3R2, MAP3K7 and
PRKX) were overlapped based on the Venn diagrams. According
to the degree of hub genes in PPI network, MAPK8 had a high
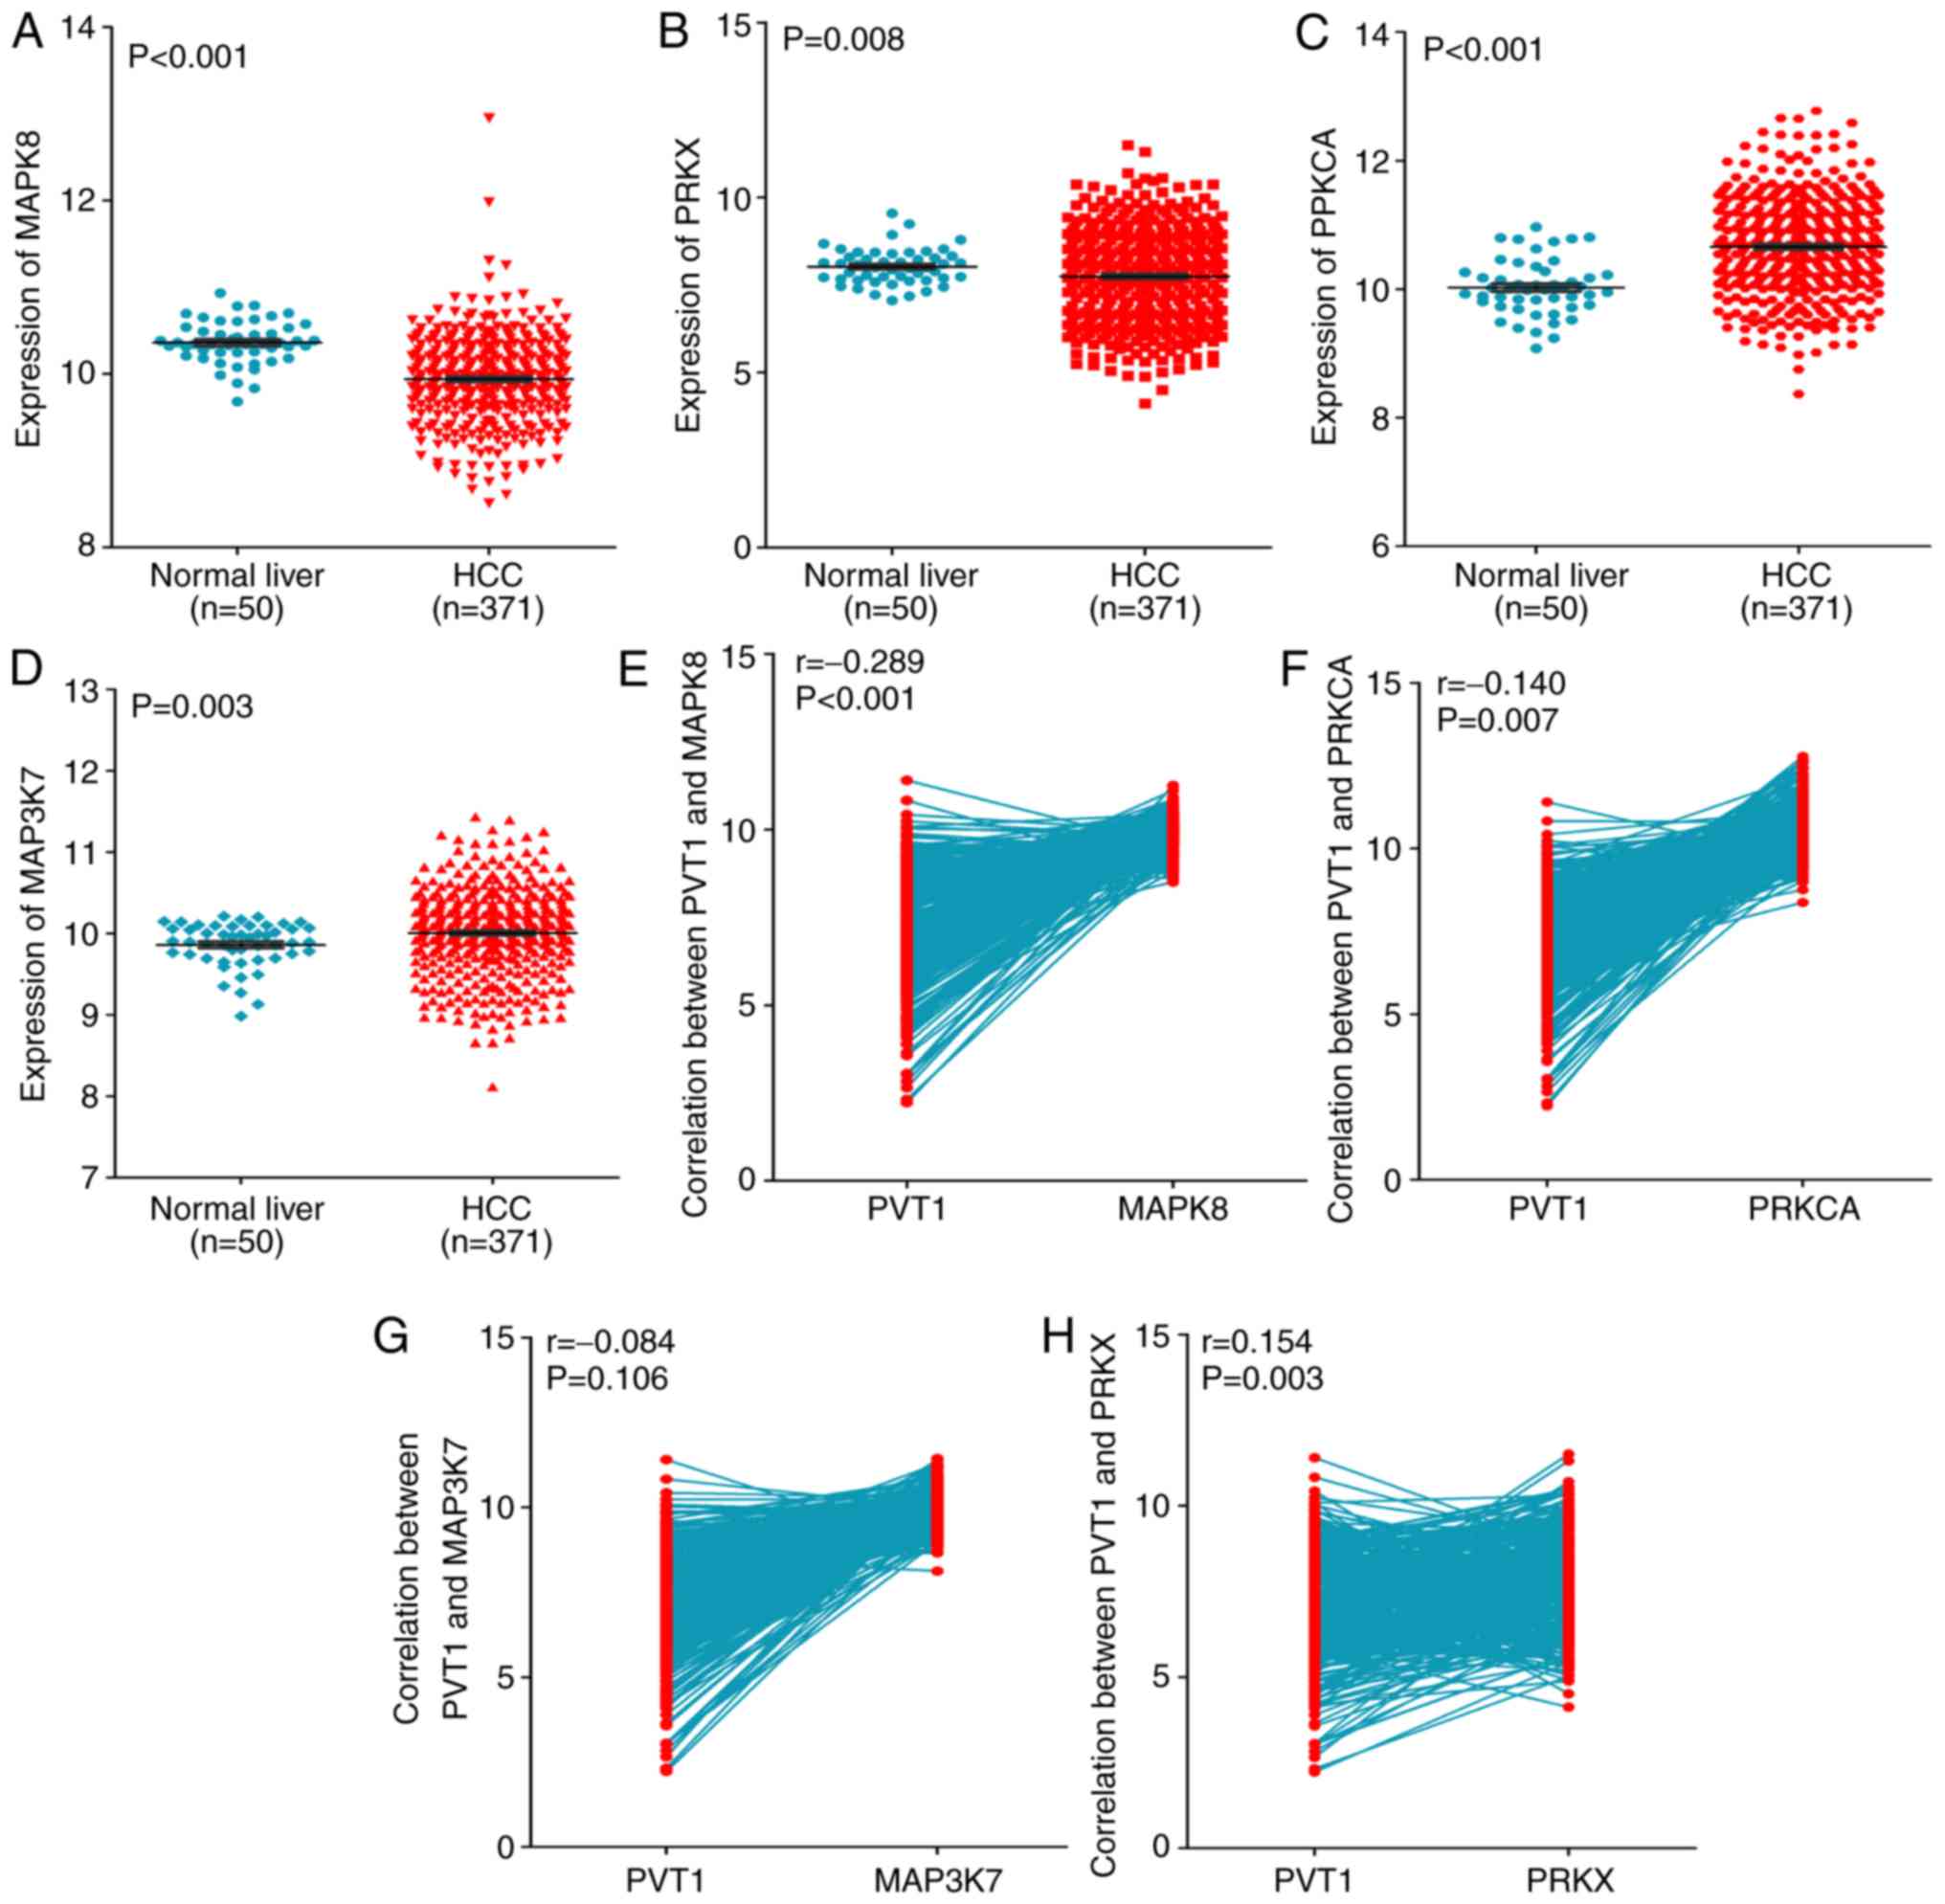
degree (degree, 26). Next, we investigated the preliminary
expression level of the five genes based on TCGA, and the original
expression data of PPP3R2 was censored. Thus, based on TCGA,
MAPK8 and PRKX were downregulated, whereas
PRKCA and MAP3K7 were upregulated in HCC compared to
that in normal liver tissues (both P<0.05, Fig. 9A-D). Furthermore, negative
correlations were found between PVT1 and MAPK8 (r=−0.289,
P<0.001, Fig. 9E), PRKCA
(r=−0.140, P=0.007, Fig. 9F) and
MAP3K7 (r=−0.084, P=0.106, Fig.
9G), whereas a positive correlation was found between PVT1 and
PRKX (r=0.154, P=0.003, Fig. 9H).
Moreover, based on HPA, weak staining in HCC was observed for
MAPK8, whereas moderate staining was observed for PRKCA and PPP3R2
(Fig. 10A-F). Negative staining in
both HCC and normal liver tissues was observed for MAP3K7, in
contrast with its upregulated expression in TCGA (Fig. 10G and H), whereas moderate staining
for PRKX was observed in HCC, inconsistent with its downregulated
expression in TCGA (Fig. 10I and
J). Based on these results, PRKCA and MAPK8 were all negatively
correlated with PVT1, whereas PRKCA was overexpressed in HCC, in
contrast with the correlation of PVT1. Thus, only MAPK8 was
selected. We hypothesized that PVT1 may influence MAPK8 expression
in the MAPK or Wnt signaling pathways to participate in the
different biological processes of HCC. However, the precise
molecular mechanism of PVT1 in HCC needs further experimental
investigation.
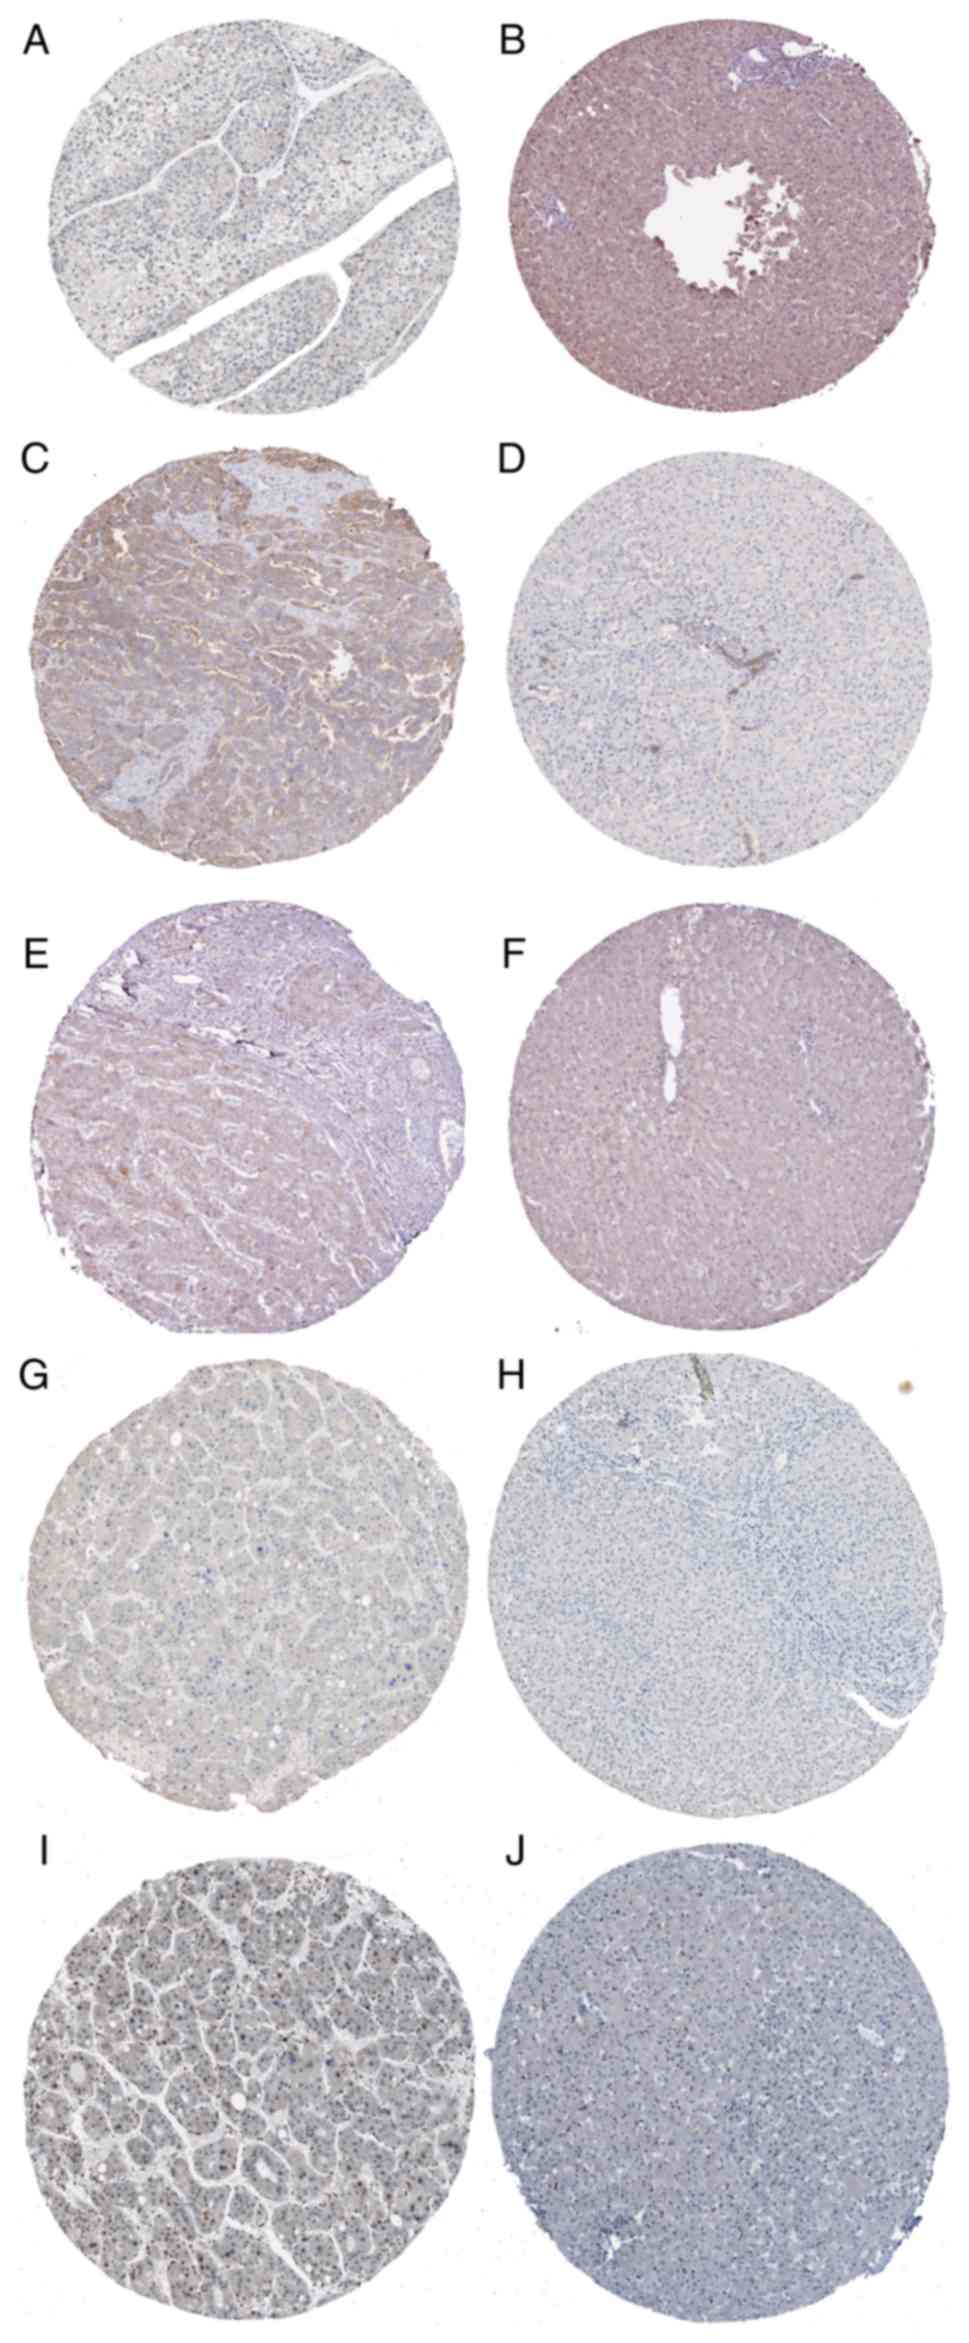 | Figure 10.Validation of hub gene expression
based on the HPA database. (A) MAPK8 was weakly stained in HCC
(magnification, ×100), (B) MAPK8 was moderately stained in normal
liver (magnification, ×100), (C) PRKCA was moderately stained in
HCC (magnification, ×100), (D) PRKCA was weakly stained in normal
liver (magnification, ×100), (E) PPP3R2 was moderately stained in
HCC (magnification, ×100), (F) PPP3R2 was negatively stained in
normal liver (magnification, ×100), (G) MAP3K7 was negatively
stained in HCC (magnification, ×100), (H) MAP3K7 was negatively
stained in normal liver (magnification, ×100), (I) PRKX was
moderately stained in HCC (magnification, ×100), and (J) PRKX was
negatively stained in normal liver (magnification, ×100). |
Discussion
Previous studies have demonstrated that lncRNAs
participates in different biological processes, such as
transcription, chromosome remodeling and post-transcriptional
processing (35–37). Many studies have verified that
lncRNAs are associated with the tumorigenesis and development of
various types of cancer through various pathways, including the
regulation of cell proliferation, metastasis and invasion (38–40).
Thus, lncRNAs have opened an avenue of cancer genomics.
To date, several studies have investigated the
effect of PVT1 on various cancer types. Xu et al (41) demonstrated that PVT1 overexpression
encouraged proliferation and invasion in gastric cancer cells via
binding to FOXM1, and a high PVT1 expression was associated with
the poor prognosis of gastric cancer patients. Chen et al
(42) revealed that the
overexpression of PVT1 promoted the invasion of non-small cell lung
cancer cells. Additionally, PVT1 functioned as a competitive
endogenous RNA to regulate the expression of MMP9 via competitively
binding to microRNAs. Liu et al (43) showed that PVT1 was an oncogene in
prostate cancer by activating miR-146a methylation to improve tumor
growth. Nevertheless, the detailed roles for PVT1 in HCC remain
undefinable. In the present study, we combined miRNA microarray
analysis and TCGA, as well as Oncomine and GEPIA databases to
explore the potential biological functions of PVT1 in HCC. We
confirmed that PVT1 was an oncogene and highly expressed in HCC,
consistent with Yu et al and Ding et al (18,19).
Moreover, Yu et al (18)
revealed that the combined upregulation of two lncRNAs (PVT1 and
uc002 mbe.2) offered a new method for the diagnosis of HCC, and the
expression of these two lncRNAs was positively correlated with
tumor size and clinical stage in HCC patients. Furthermore, Ding
et al (19) revealed that
the overexpression of PVT1 was strongly associated with the AFP
level and could predict recurrence. By comparison, the present
study showed that PVT1 expression was positively correlated with
sex, ethnicity and pathological grade. The AUC of PVT1 indicated a
moderate diagnostic value of PVT1 expression in HCC. Furthermore,
the genetic alterations of PVT1 were observed in HCC based on TCGA,
which may be correlated with the pathogenesis of HCC.
To the best of our knowledge, the present study was
the first to identify the differentially expressed miRNAs
associated with PVT1 based on miRNA microarray analysis, and 12
miRNA target prediction algorithms were used to predict the
underlying target genes of the differentially expressed miRNAs.
According to GO analysis, the target genes were involved in complex
cellular pathways, such as macromolecule biosynthetic process,
compound metabolism, and transcription. The KEGG pathway analysis
revealed that the MAPK and Wnt signaling pathways are potentially
correlated with the regulation of the four candidate miRNAs. As
reported, the MAPK and Wnt signaling pathways were all associated
with proliferation, migration, invasion and prognosis and HCC
(44–48). Consequently, we hypothesized that
PVT1 plays a vital role in HCC by regulating the expression of the
four miRNAs via the MAPK or Wnt signaling pathways, which requires
further investigation on the precise molecular mechanism of PVT1 in
HCC. We also investigated the genes from the MAPK and Wnt signaling
pathways and the hub genes from PPI. We hypothesized that PVT1 may
influence MAPK8 expression to contribute to different biological
processes of HCC. Various in vitro and in vivo
experiments, including cell proliferation, invasion and metastasis
assays, and animal models, are needed to verify this hypothesis.
The clinical significance and molecular mechanism of PVT1 in the
biological function of HCC are to be further researched at the
molecular, cellular, tissue and animal levels. Focusing on the new
insight of PVT1 in HCC, the present study aimed to provide a
potential biomarker or therapeutic target for HCC.
Acknowledgements
Not applicable.
Funding
The present study was financially supported through
grants from the National Natural Science Foundation of China (no.
NSFC81560489), the Natural Science Foundation of Guangxi, China
(nos. 2016GXNSFBA380039 and 2017GXNSFAA198017) and the Promoting
Project of Basic Capacity for Young and Middle-aged University
Teachers in Guangxi (no. KY2016LX031) and Medical Excellence Award
funded by the Creative Research Development grant from the First
Affiliated Hospital of Guangxi Medical University.
Availability of data and materials
Data used in this study are available upon request
to the corresponding author.
Authors' contributions
YZ and WM conceived and designed the study. XW, TZ
and YQ performed the experiments. YZ and GC wrote the paper. DW and
YD reviewed and edited the manuscript. All authors read and
approved the manuscript and agree to be accountable for all aspects
of the research in ensuring that the accuracy or integrity of any
part of the work are appropriately investigated and resolved.
Ethics approval and consent to
participate
All experimental protocols were approved by the
First Affiliated Hospital of Guangxi Medical University (Nanning,
China).
Consent for publication
Not applicable.
Competing interests
The authors DEC that they have no competing
interests.
Glossary
Abbreviations
Abbreviations:
|
HCC
|
hepatocellular carcinoma
|
|
lncRNAs
|
long non-coding RNAs
|
|
TCGA
|
The Cancer Genome Atlas
|
|
MEM
|
Multi Experiment Matrix
|
|
GO
|
Gene Ontology
|
|
KEGG
|
Kyoto Encyclopedia of Genes and
Genomes
|
|
PPI
|
protein-protein interactions
|
|
ROC
|
receiver operating characteristic
|
|
BP
|
biological process
|
|
CC
|
cellular component
|
|
MF
|
molecular function
|
|
FDR
|
false discovery rate
|
|
AUC
|
area under curve
|
|
HBV
|
hepatitis B virus
|
|
HCV
|
hepatitis C virus
|
|
DMEM
|
Dulbecco's modified Eagle's medium
|
|
FBS
|
fetal bovine serum
|
|
DAVID
|
Database for Annotation, Visualization
and Integrated Discovery
|
|
STRING
|
Search Tool for the Retrieval of
Interacting Genes
|
|
ANOVA
|
one-way analysis of variance
|
|
mean ± SD
|
mean ± standard deviation
|
|
FC
|
fold-change
|
References
|
1
|
Li C, Miao R, Liu S, Wan Y, Zhang S, Deng
Y, Bi J, Qu K, Zhang J and Liu C: Down-regulation of miR-146b-5p by
long noncoding RNA MALAT1 in hepatocellular carcinoma promotes
cancer growth and metastasis. Oncotarget. 8:28683–28695.
2017.PubMed/NCBI
|
|
2
|
Lu PH, Chen MB, Liu YY, Wu MH, Li WT, Wei
MX, Liu CY and Qin SK: Identification of sphingosine kinase 1
(SphK1) as a primary target of icaritin in hepatocellular carcinoma
cells. Oncotarget. 8:22800–22810. 2017.PubMed/NCBI
|
|
3
|
Maluccio M and Covey A: Recent progress in
understanding, diagnosing, and treating hepatocellular carcinoma.
CA Cancer J Clin. 62:394–399. 2012. View Article : Google Scholar : PubMed/NCBI
|
|
4
|
Trépo C, Chan HL and Lok A: Hepatitis B
virus infection. Lancet. 384:2053–2063. 2014. View Article : Google Scholar : PubMed/NCBI
|
|
5
|
El-Serag HB: Hepatocellular carcinoma. N
Engl J Med. 365:1118–1127. 2011. View Article : Google Scholar : PubMed/NCBI
|
|
6
|
Zhang H, Zhai Y, Hu Z, Wu C, Qian J, Jia
W, Ma F, Huang W, Yu L, Yue W, et al: Genome-wide association study
identifies 1p36.22 as a new susceptibility locus for hepatocellular
carcinoma in chronic hepatitis B virus carriers. Nat Genet.
42:755–758. 2010. View
Article : Google Scholar : PubMed/NCBI
|
|
7
|
Bréchot C: Pathogenesis of hepatitis B
virus-related hepatocellular carcinoma: Old and new paradigms.
Gastroenterology. 127 5 Suppl 1:S56–S61. 2004. View Article : Google Scholar : PubMed/NCBI
|
|
8
|
Xu Y, Qi Y, Luo J, Yang J, Xie Q, Deng C,
Su N, Wei W, Shi D, Xu F, et al: Hepatitis B virus X protein
stimulates proliferation, wound closure and inhibits apoptosis of
HuH-7 cells via CDC42. Int J Mol Sci. 18:E5862017. View Article : Google Scholar : PubMed/NCBI
|
|
9
|
Moriguchi M, Takayama T, Higaki T, Kimura
Y, Yamazaki S, Nakayama H, Ohkubo T and Aramaki O: Early
cancer-related death after resection of hepatocellular carcinoma.
Surgery. 151:232–237. 2012. View Article : Google Scholar : PubMed/NCBI
|
|
10
|
Fairman J, Liu KH and Menne S: Prevention
of liver tumor formation in woodchucks with established
hepatocellular carcinoma by treatment with cationic liposome-DNA
complexes. BMC Cancer. 17:1722017. View Article : Google Scholar : PubMed/NCBI
|
|
11
|
Batista PJ and Chang HY: Long noncoding
RNAs: Cellular address codes in development and disease. Cell.
152:1298–1307. 2013. View Article : Google Scholar : PubMed/NCBI
|
|
12
|
Xie X, Pan J, Wei L, Wu S, Hou H, Li X and
Chen W: Gene expression profiling of microRNAs associated with UCA1
in bladder cancer cells. Int J Oncol. 48:1617–1627. 2016.
View Article : Google Scholar : PubMed/NCBI
|
|
13
|
Sun XJ, Wang Q, Guo B, Liu XY and Wang B:
Identification of skin-related lncRNAs as potential biomarkers that
involved in Wnt pathways in keloids. Oncotarget. 8:34236–34244.
2017.PubMed/NCBI
|
|
14
|
Zhu P, Wang Y, Wu J, Huang G, Liu B, Ye B,
Du Y, Gao G, Tian Y, He L and Fan Z: LncBRM initiates YAP1
signalling activation to drive self-renewal of liver cancer stem
cells. Nat Commun. 7:136082016. View Article : Google Scholar : PubMed/NCBI
|
|
15
|
Cao C, Sun J, Zhang D, Guo X, Xie L, Li X,
Wu D and Liu L: The long intergenic noncoding RNA UFC1, a target of
MicroRNA 34a, interacts with the mRNA stabilizing protein HuR to
increase levels of β-catenin in HCC cells. Gastroenterology.
148:415–426.e18. 2015. View Article : Google Scholar : PubMed/NCBI
|
|
16
|
Zhou M, Zhang XY and Yu X: Overexpression
of the long non-coding RNA SPRY4-IT1 promotes tumor cell
proliferation and invasion by activating EZH2 in hepatocellular
carcinoma. Biomed Pharmacother. 85:348–354. 2017. View Article : Google Scholar : PubMed/NCBI
|
|
17
|
Colombo T, Farina L, Macino G and Paci P:
PVT1: A rising star among oncogenic long noncoding RNAs. Biomed Res
Int. 2015:3042082015. View Article : Google Scholar : PubMed/NCBI
|
|
18
|
Yu J, Han J, Zhang J, Li G, Liu H, Cui X,
Xu Y, Li T, Liu J and Wang C: The long noncoding RNAs PVT1 and
uc002mbe.2 in sera provide a new supplementary method for
hepatocellular carcinoma diagnosis. Medicine. 95:e44362016.
View Article : Google Scholar : PubMed/NCBI
|
|
19
|
Ding C, Yang Z, Lv Z, DU C, Xiao H, Peng
C, Cheng S, Xie H, Zhou L, Wu J and Zheng S: Long non-coding RNA
PVT1 is associated with tumor progression and predicts recurrence
in hepatocellular carcinoma patients. Oncol Lett. 9:955–963. 2015.
View Article : Google Scholar : PubMed/NCBI
|
|
20
|
Wang F, Yuan JH, Wang SB, Yang F, Yuan SX,
Ye C, Yang N, Zhou WP, Li WL, Li W and Sun SH: Oncofetal long
noncoding RNA PVT1 promotes proliferation and stem cell-like
property of hepatocellular carcinoma cells by stabilizing NOP2.
Hepatology. 60:1278–1290. 2014. View Article : Google Scholar : PubMed/NCBI
|
|
21
|
Liu F, Yuan JH, Huang JF, Yang F, Wang TT,
Ma JZ, Zhang L, Zhou CC, Wang F, Yu J, et al: Long noncoding RNA
FTX inhibits hepatocellular carcinoma proliferation and metastasis
by binding MCM2 and miR-374a. Oncogene. 35:5422–5434. 2016.
View Article : Google Scholar : PubMed/NCBI
|
|
22
|
Zhu L, Yang N, Chen J, Zeng T, Yan S, Liu
Y, Yu G, Chen Q, Du G, Pan W, et al: LINC00052 upregulates EPB41L3
to inhibit migration and invasion of hepatocellular carcinoma by
binding miR-452-5p. Oncotarget. 8:63724–63737. 2017.PubMed/NCBI
|
|
23
|
Xu X, Wang X, Fu B, Meng L and Lang B:
Differentially expressed genes and microRNAs in bladder carcinoma
cell line 5637 and T24 detected by RNA sequencing. Int J Clin Exp
Pathol. 8:12678–12687. 2015.PubMed/NCBI
|
|
24
|
Subramanian Y, Kaliyappan K and
Ramakrishnan KS: Facile hydrothermal synthesis and characterization
of Co2GeO4/r-GO@C ternary nanocomposite as
negative electrode for Li-ion batteries. J Colloid Interface Sci.
498:76–84. 2017. View Article : Google Scholar : PubMed/NCBI
|
|
25
|
Wei L, Murphy BL, Wu G, Parker M, Easton
J, Gilbertson RJ, Zhang J and Roussel MF: Exome sequencing analysis
of murine medulloblastoma models identifies WDR11 as a potential
tumor suppressor in Group 3 tumors. Oncotarget. 8:64685–64697.
2017. View Article : Google Scholar : PubMed/NCBI
|
|
26
|
Chen F, Shen C, Wang X, Wang H, Liu Y, Yu
C, Lv J, He J and Wen Z: Identification of genes and pathways in
nasopharyngeal carcinoma by bioinformatics analysis. Oncotarget.
8:63738–63749. 2017.PubMed/NCBI
|
|
27
|
Bornstein S, Schmidt M, Choonoo G, Levin
T, Gray J, Thomas CR Jr, Wong M and McWeeney S: IL-10 and integrin
signaling pathways are associated with head and neck cancer
progression. BMC Genomics. 17:382016. View Article : Google Scholar : PubMed/NCBI
|
|
28
|
Zeng JH, Xiong DD, Pang YY, Zhang Y, Tang
RX, Luo DZ and Chen G: Identification of molecular targets for
esophageal carcinoma diagnosis using miRNA-seq and RNA-seq data
from The Cancer Genome Atlas: A study of 187 cases. Oncotarget.
8:35681–35699. 2017.PubMed/NCBI
|
|
29
|
Rhodes DR, Kalyana-Sundaram S, Mahavisno
V, Varambally R, Yu J, Briggs BB, Barrette TR, Anstet MJ,
Kincead-Beal C, Kulkarni P, et al: Oncomine 3.0: Genes, pathways,
and networks in a collection of 18,000 cancer gene expression
profiles. Neoplasia. 9:166–180. 2007. View Article : Google Scholar : PubMed/NCBI
|
|
30
|
Tang Z, Li C, Kang B, Gao G, Li C and
Zhang Z: GEPIA: A web server for cancer and normal gene expression
profiling and interactive analyses. Nucleic Acids Res. 45:W98–W102.
2017. View Article : Google Scholar : PubMed/NCBI
|
|
31
|
Ashburner M, Ball CA, Blake JA, Botstein
D, Butler H, Cherry JM, Davis AP, Dolinski K, Dwight SS, Eppig JT,
et al: Gene ontology: Tool for the unification of biology. The Gene
Ontology Consortium. Nat Genet. 25:25–29. 2000. View Article : Google Scholar : PubMed/NCBI
|
|
32
|
Ge QM, Huang CM, Zhu XY, Bian F and Pan
SM: Differentially expressed miRNAs in sepsis-induced acute kidney
injury target oxidative stress and mitochondrial dysfunction
pathways. PLoS One. 12:e01732922017. View Article : Google Scholar : PubMed/NCBI
|
|
33
|
Franceschini A, Szklarczyk D, Frankild S,
Kuhn M, Simonovic M, Roth A, Lin J, Minguez P, Bork P, von Mering C
and Jensen LJ: STRING v9.1: Protein-protein interaction networks,
with increased coverage and integration. Nucleic Acids Res.
41:D808–D815. 2013. View Article : Google Scholar : PubMed/NCBI
|
|
34
|
Qian Y, Feng L, Wu W, Weng T, Hu C, Hong
B, Wang FX, Shen L, Wang Q, Jin X, et al: MicroRNA expression
profiling of pancreatic cancer cell line L3.6p1 following B7-H4
knockdown. Cell Physiol Biochem. 44:494–504. 2017. View Article : Google Scholar : PubMed/NCBI
|
|
35
|
Shi X, Sun M, Liu H, Yao Y and Song Y:
Long non-coding RNAs: A new frontier in the study of human
diseases. Cancer Lett. 339:159–166. 2013. View Article : Google Scholar : PubMed/NCBI
|
|
36
|
Xiong DD, Feng ZB, Cen WL, Zeng JJ, Liang
L, Tang RX, Gan XN, Liang HW, Li ZY, Chen G, et al: The clinical
value of lncRNA NEAT1 in digestive system malignancies: A
comprehensive investigation based on 57 microarray and RNA-seq
datasets. Oncotarget. 8:17665–17683. 2017.PubMed/NCBI
|
|
37
|
Chen Y, Xie H, Gao Q, Zhan H, Xiao H, Zou
Y, Zhang F, Liu Y and Li J: Colon cancer associated transcripts in
human cancers. Biomed Pharmacother. 94:531–540. 2017. View Article : Google Scholar : PubMed/NCBI
|
|
38
|
Zhang Z, Liu T, Wang K, Qu X, Pang Z, Liu
S, Liu Q and Du J: Down-regulation of long non-coding RNA MEG3
indicates an unfavorable prognosis in non-small cell lung cancer:
Evidence from the GEO database. Gene. 630:49–58. 2017. View Article : Google Scholar : PubMed/NCBI
|
|
39
|
Gao R, Zhang R, Zhang C, Zhao L and Zhang
Y: Long noncoding RNA CCAT1 promotes cell proliferation and
metastasis in human medulloblastoma via MAPK pathway. Tumori 0.
2017.doi: 10.5301/tj.5000662.
|
|
40
|
Jin L, Fu H, Quan J, Pan X, He T, Hu J, Li
Y, Li H, Yang Y, Ye J, et al: Overexpression of long non-coding RNA
differentiation antagonizing non-protein coding RNA inhibits the
proliferation, migration and invasion and promotes apoptosis of
renal cell carcinoma. Mol Med Rep. 16:4463–4468. 2017. View Article : Google Scholar : PubMed/NCBI
|
|
41
|
Xu MD, Wang Y, Weng W, Wei P, Qi P, Zhang
Q, Tan C, Ni SJ, Dong L, Yang Y, et al: A positive feedback loop of
lncRNA-PVT1 and FOXM1 facilitates gastric cancer growth and
invasion. Clin Cancer Res. 23:2071–2080. 2017. View Article : Google Scholar : PubMed/NCBI
|
|
42
|
Chen W, Zhu H, Yin L, Wang T, Wu J, Xu J,
Tao H, Liu J and He X: lncRNA-PVT1 facilitates invasion through
upregulation of MMP9 in nonsmall cell lung cancer cell. DNA Cell
Biol. 36:787–793. 2017.PubMed/NCBI
|
|
43
|
Liu HT, Fang L, Cheng YX and Sun Q: LncRNA
PVT1 regulates prostate cancer cell growth by inducing the
methylation of miR-146a. Cancer Med. 5:3512–3519. 2016. View Article : Google Scholar : PubMed/NCBI
|
|
44
|
Zeng J, Liu X, Li X, Zheng Y, Liu B and
Xiao Y: Daucosterol inhibits the proliferation, migration, and
invasion of hepatocellular carcinoma cells via Wnt/β-catenin
signaling. Molecules. 22:E8622017. View Article : Google Scholar : PubMed/NCBI
|
|
45
|
Zhang J, Lai W, Li Q, Yu Y, Jin J, Guo W,
Zhou X, Liu X and Wang Y: A novel oncolytic adenovirus targeting
Wnt signaling effectively inhibits cancer-stem like cell growth via
metastasis, apoptosis and autophagy in HCC models. Biochem Biophys
Res Commun. 491:469–477. 2017. View Article : Google Scholar : PubMed/NCBI
|
|
46
|
Ou W, Lv J, Zou X, Yao Y, Wu J, Yang J,
Wang Z and Ma Y: Propofol inhibits hepatocellular carcinoma growth
and invasion through the HMGA2-mediated Wnt/beta-catenin pathway.
Exp Ther Med. 13:2501–2506. 2017. View Article : Google Scholar : PubMed/NCBI
|
|
47
|
Peng W and Fan H: Long noncoding RNA CCHE1
indicates a poor prognosis of hepatocellular carcinoma and promotes
carcinogenesis via activation of the ERK/MAPK pathway. Biomed
Pharmacother. 83:450–455. 2016. View Article : Google Scholar : PubMed/NCBI
|
|
48
|
Lin W, Zhong M, Yin H, Chen Y, Cao Q, Wang
C and Ling C: Emodin induces hepatocellular carcinoma cell
apoptosis through MAPK and PI3K/AKT signaling pathways in
vitro and in vivo. Oncol Rep. 36:961–967. 2016.
View Article : Google Scholar : PubMed/NCBI
|