Introduction
Esophageal carcinoma is the sixth leading cause of
cancer-related mortality worldwide (1), and 90% of the 456,000 annual new cases
of this cancer are esophageal squamous cell carcinoma (ESCC)
(2). Such as other malignancies,
the most common biological changes in the pathogenesis of ESCC
include activation of oncogenes and inactivation of
tumor-suppressor genes (3).
Considerable effort has been made to identify molecular markers
related to the etiology of ESCC (4). However, unlike the estrogen and
progesterone receptors in breast cancer, and α-fetoprotein (AFP) in
hepatocellular carcinoma, promising biomarkers with clinical
significance for ESCC have remained elusive.
The monocarboxylate transporter (MCT) family,
including MCT1, MCT2, MCT3 and MCT4 isoforms, are essential for
fast transport of monocarboxylates in mammals, such as the
transport of pyruvate, lactate and ketone bodies across the plasma
membrane (5). MCT1 and MCT2 are
predominantly involved in lactate uptake, thus deriving cellular
energy from initiating oxidative phosphorylation of lactate,
whereas MCT4 is involved in lactate excretion (6). MCT4 is highly expressed in tissues
that rely on glycolysis, such as skeletal muscle fibers and glial
cells in the cerebellum (7–9). Upregulated glycolysis with production
of lactate and downregulated mitochondrial oxidative
phosphorylation metabolism (OXPHOS) commonly exist in cancer
(10). Expression of MCT4 in cancer
or stromal cells in the tumor microenvironment varies among
different types of cancer. Overexpression of MCT4 in both
epithelial and stromal cells of breast cancer (11–13),
hepatocellular cancer cells (14,15)
and pancreatic cancer cells (16)
predicted worse outcomes for patients. Furthermore, high expression
of MCT4 in stromal cells of colorectal cancer (17), oral squamous cell carcinoma
(18) and gastric cancer (19) was revealed to be associated with
poor prognosis.
Currently, an association between MCT4 and ESCC
prognosis is yet to be demonstrated. In the present study, we
investigated whether MCT4 expression may have prognostic value for
ESCC patients. Additionally, we used in vitro assays to
verify its proliferation-inhibiting and apoptosis-promoting effects
on ESCC cells.
Materials and methods
Analysis of mRNA expression using The
Cancer Genome Atlas (TCGA) database
The datasets of RNA sequencing information of 81
ESCC tissues and 11 normal tissues were acquired from the The
Cancer Genome Atlas (TCGA, http://tcga-data.nci.nih.gov/) database. mRNA
expression data of MCT4 were retrieved from these
datasets.
Clinical samples and cell lines
Cancer tissues and corresponding adjacent non-tumor
tissues were obtained from 110 ESCC patients, who had not received
neoadjuvant therapy and were admitted to Qilu Hospital of Shandong
University (Jinan, China) from January 2010 to December 2011. The
research proposal was approved by the Ethics Committee of Qilu
Hospital. Follow-up data of the 110 patients was available for at
least 5 years for review. All ESCC samples were confirmed by
pathological evaluation. The tumor, node, metastasis (TNM) staging
was classified according to the American Joint Committee on Cancer
Cancer Staging Manual (7th edition). Other clinicopathological
variables of the patients were obtained from clinical and
pathological records.
The human ESCC cell lines KYSE150 and Eca109 were
purchased from the China Center for Type Culture Collection in 2017
and authenticated by short tandem repeat analysis. Cell lines were
routinely cultured at 37°C in RPMI-1640 medium (Gibco; Thermo
Fisher Scientific, Inc., Waltham, MA, USA) supplemented with 10%
fetal bovine serum (FBS; Gibco; Thermo Fisher Scientific, Inc.) in
an incubator with 5% CO2.
Immunohistochemical (IHC)
analysis
Paraffin-embedded tissue sections were dewaxed and
gradually rehydrated. After antigen retrieval by microwave
irradiation, endogenous peroxidase activity was blocked by
incubation with 3% hydrogen peroxide. Sections were then incubated
with 10% goat serum at 37°C for 30 min, followed by incubation with
a rabbit anti-MCT4 polyclonal antibody (dilution 1:100; cat. no.
22787-1-AP; ProteinTech Group, Inc., Chicago, IL, USA) overnight at
4°C. Sections of the negative control were incubated with PBS
instead of the primary antibody. Complexes of
streptavidin-peroxidase and biotinylated secondary antibody
(dilution 1:200; cat. no. SP-9001; Zhongshan Golden Bridge
Biotechnology, Co., Ltd., Beijing, China) were added to the
sections, followed by incubation at 37°C for 30 min. Subsequently,
the MCT4 protein was detected by a chromogenic reaction with
3,3′-diaminobenzidine and counterstained with hematoxylin. The
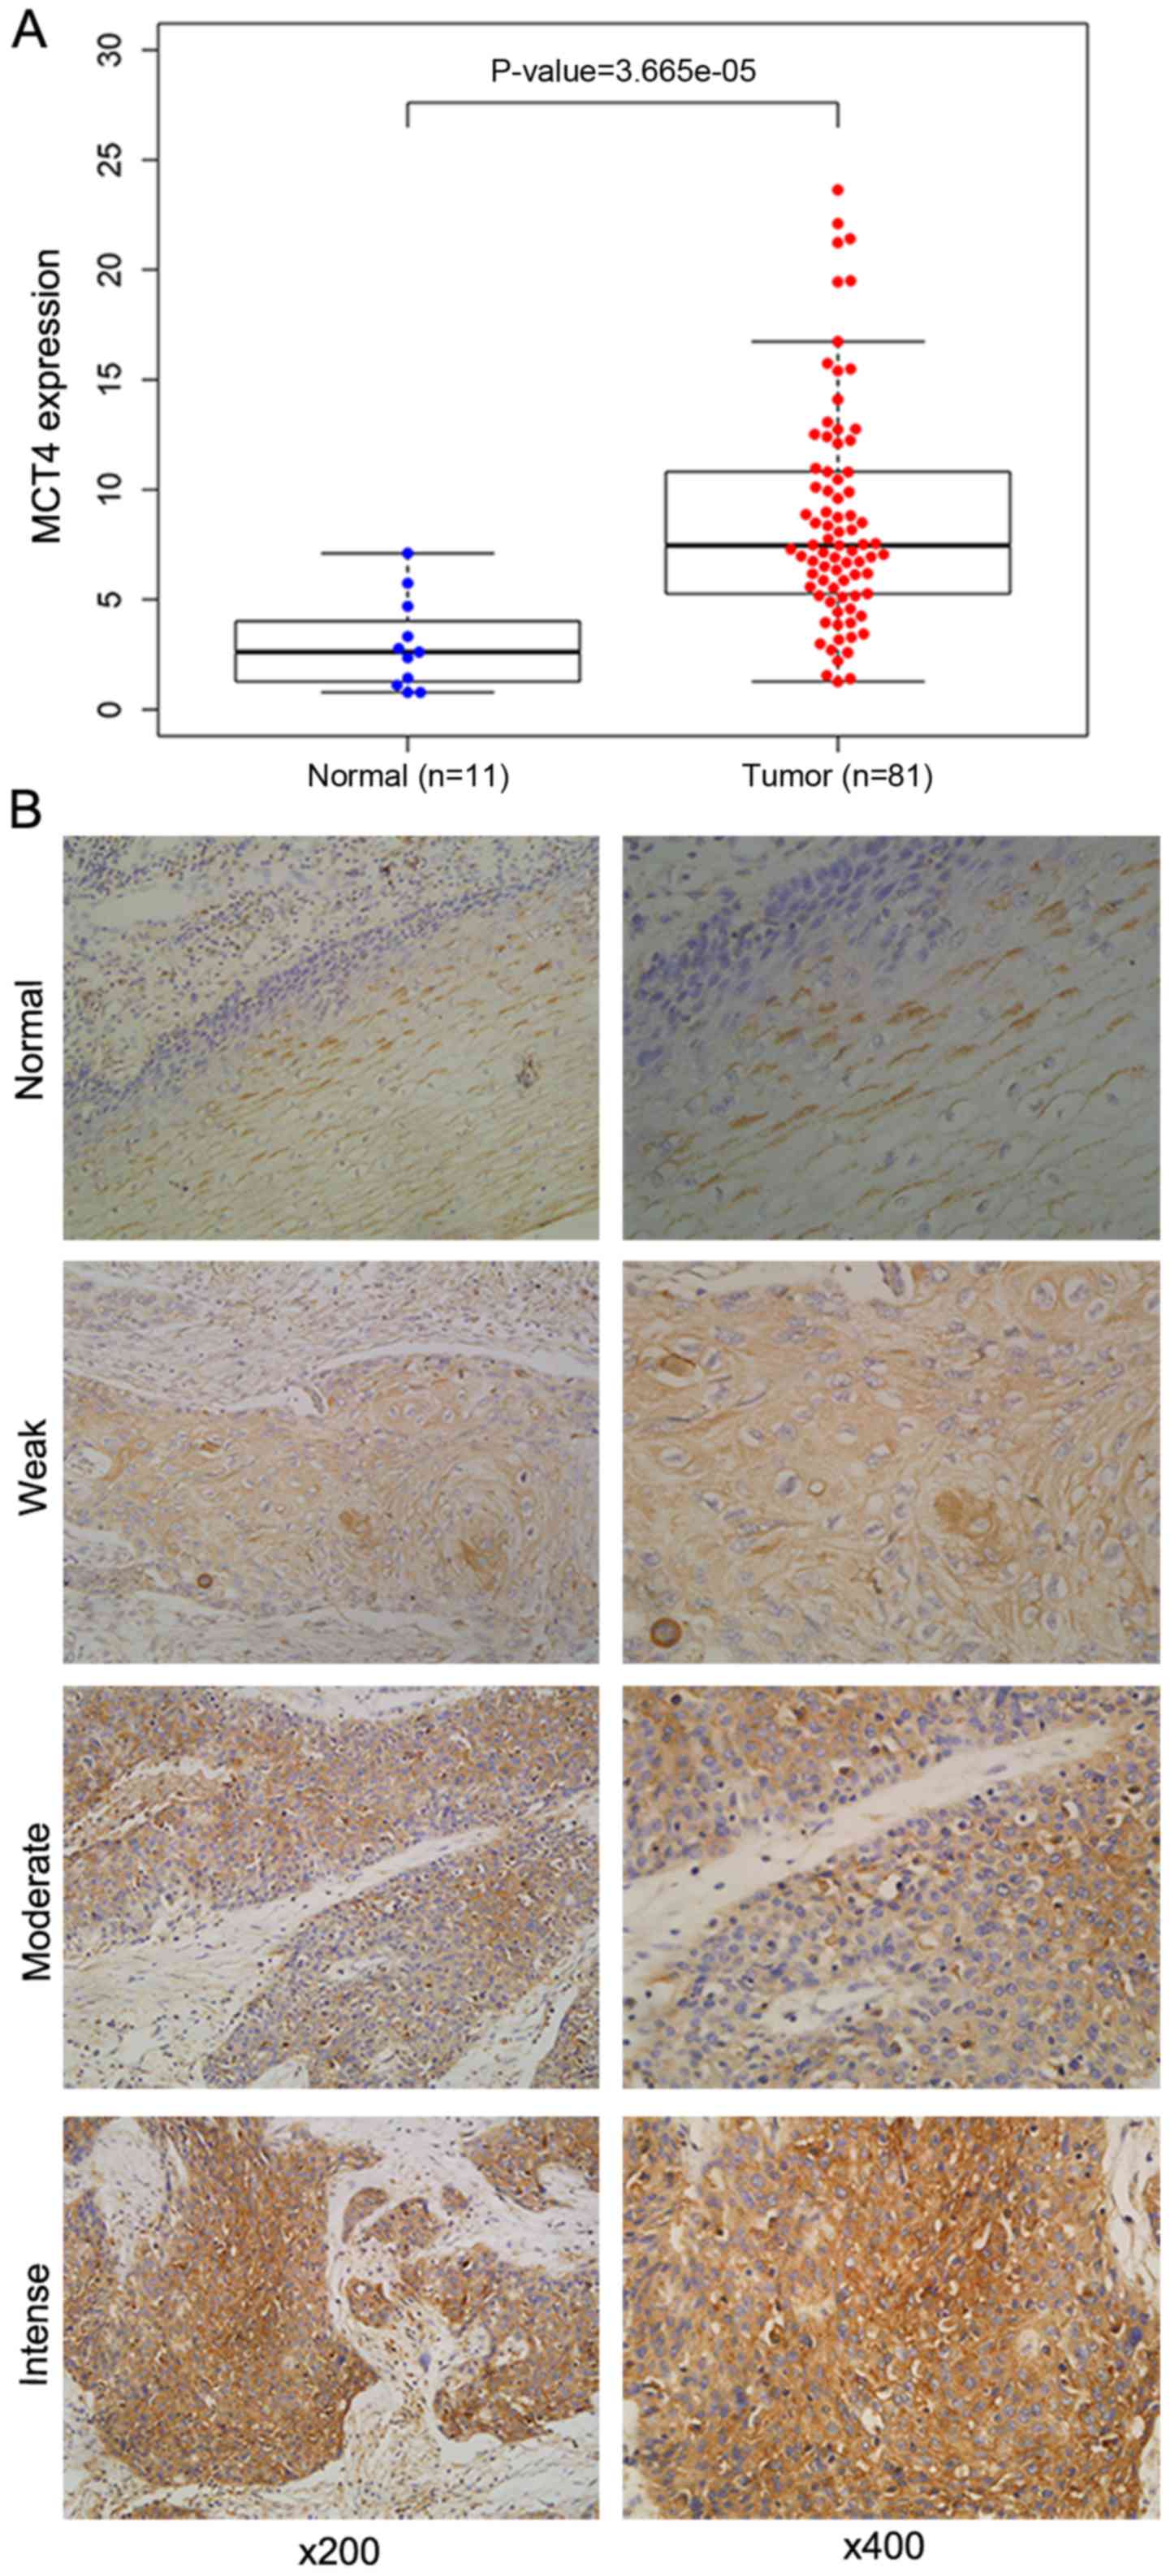
expression level of MCT4 was determined by multiplying the staining
density value by the number of positive cells. All slides were
independently evaluated by two pathologists using a double-blind
method. The staining intensity was graded as 0 (no staining), 1
(weak), 2 (moderate) or 3 (intense). The number of positive cells
was scored as 0 (<5%), 1 (5–25%), 2 (26–50%), 3 (51–75%) or 4
(>75%). The level of expression was defined as ‘low expression’
if the multiplied score was <8; otherwise it was defined as
‘high expression’.
Transfection
Plasmids containing shRNA targeting MCT4 (cat. no.
HSH022117-LVmRU6GP) and a control shRNA (cat. no. CSHCTR001-LVR-
U6GP) were purchased from GeneCopoeia, Inc. (Rockville, MD, USA).
When cells reached 80% confluence, the plasmids were transfected
into the KYSE150 and Eca109 cells using Lipofectamine 2000
(Invitrogen; Thermo Fisher Scientific, Inc.). The transfection
procedure was carried out according to the manufacturer's protocol.
Knockdown efficiency was determined by quantitative real-time
polymerase chain reaction (RT-qPCR) and western blot analysis 48 h
after transfection.
RNA isolation and RT-qPCR
Total RNA was isolated from ESCC cells using TRIzol
reagent (Invitrogen; Thermo Fisher Scientific, Inc.). Briefly,
cells were lysed directly by adding 1 ml of TRIzol to each well of
a 6-well plate for 10 min, followed by adding 0.2 ml of chloroform
per 1 ml of TRIzol. After shaking tubes vigorously by hand for 30
sec and incubating samples at room temperature for 5 min, the
samples were centrifuged at 12,000 × g for 15 min at 4°C. Following
centrifugation, RNA remained exclusively in the aqueous phase.
Then, the RNA was precipitated from the aqueous phase by mixing
with isopropyl alcohol. Finally, the RNA pellet was washed once
with 75% ethanol and dissolved in RNase-free water after
air-drying. RT-qPCR was conducted on a Bio-Rad Single Color
Real-Time PCR system (Bio-Rad Laboratories, Inc., Hercules, CA,
USA), using SYBR-Green Real-Time PCR Master Mix (Toyobo Life
Science, Osaka, Japan). The primers used were as follows: MCT4
forward, 5′-TCGTCATCACYGGCTTCTCC-3′ and reverse,
5′-ATCCAGGCTGTGTCGCTGTA-3′; β-actin forward,
5′-CAAAGGCCAACAGAGAGAAGAT-3′, and reverse,
5′-TGAGACACACCATCACCAGAAT-3′.
Western blot analysis
Protein was extracted 48 h after transfection for
MCT4 analysis. Other analyses were performed 120 h after
transfection. Total protein was extracted using RIPA lysis buffer
(Beyotime Institute of Biotechnology, Shanghai, China) with 1%
phenylmethylsulfonyl fluoride (PMSF) (Beyotime Institute of
Biotechnology) according to the manufacturer's instructions. A BCA
kit was used to assess protein concentration (Beyotime Institute of
Biotechnology). A total of 10 µg protein was loaded per lane. After
being separated by 10–12% sodium dodecyl sulfate-polyacrylamide gel
electrophoresis, proteins were transferred to polyvinylidene
fluoride membranes (EMD Millipore, Billerica, MA, USA). The
membranes were blocked with 5% non-fat milk, followed by incubation
with the following primary antibodies overnight at 4°C: anti-MCT4
(dilution 1:1,000; cat. no. 22787-1-AP; ProteinTech), anti-α
tubulin antibody (dilution 1:1,000; cat. no. ab7291; Abcam,
Cambridge, UK), anti-p-Ser308-Akt (dilution 1:1,000; cat. no.
ab38449; Abcam), anti-Bax (dilution 1:1,000; cat. no. 50559-2-lg;
ProteinTech Group Inc.), anti-Bcl-2 (dilution 1:1,000; cat. no.
2872; Cell Signaling Technology Inc., Danvers, MA, USA),
anti-cytochrome c (dilution 1:1,000; cat. no. 4272; Cell
Signaling Technology), anti-cleaved caspase-3 (dilution 1:1,000;
cat. no. 9661; Cell Signaling Technology), anti-caspase-3 (dilution
1:1,000; cat. no. 9662; Cell Signaling Technology). After
incubation with horseradish peroxidase-labeled secondary antibodies
(dilution 1:5,000; cat. no. ZB-2301; Zhongshan Golden Bridge
Biotechnology), the membranes were finally developed with Immobilon
Western Chemiluminescent HRP Substrate kit (EMD Millipore). ImageJ
1.44 software was used for analyzing the protein bands (US National
Institutes of Health, Bethesda, MD, USA).
Cell Counting Kit-8 (CCK-8) assay
After transfection, logarithmic growth phase cells
from the sh-NC and sh-MCT4 groups were seeded at a cell density of
5,000 cells/well in 96-well plates and cultured for 0, 24, 48 and
72 h. After each of these intervals, 10 µl CCK-8 solution in 100 µl
fresh medium was added into each well, followed by additional
incubation for 2 h. The absorbance at 450 nm was measured using a
Varioskan Flash spectrophotometer (Thermo Fisher Scientific,
Inc.).
Clonogenic assay
Transfected cells were trypsinized and suspended in
a single cell suspension. A total of 800 cells/well were seeded and
cultured for 2 weeks. Ethanol was used as a fixative and crystal
violet was used as a cell dye for counting. A clone was defined as
containing at least 50 cells.
Flow cytometric analysis
Cell apoptosis was evaluated using the Annexin
V-APC/propidium iodide (PI) kit (BestBio, Shanghai, China). After
transfection, cells were cultured for 5 days. After being
trypsinized and harvested, the cells were washed with PBS twice.
Cells were then resuspended in a binding buffer at
1–5×10⁶ cells/ml. Subsequently, 5 µl Annexin V-APC and 5
µl PI were successively added to 100 µl cell suspension. After
incubation in the dark for 10 min, 400 µl PBS was added to the
mixture. The cells were immediately subjected to flow cytometry
(Beckman Coulter, Inc., Brea, CA, USA). FlowJo 7.6 software was
used for analyzing the results (FlowJo LLC, Ashland, OR, USA).
Statistical analysis
SPSS software (IBM Corp., Armonk, NY, USA) was used
for statistical data analysis. The Wilcoxon rank sum test was used
to compare the mRNA expression data from TCGA. The association of
MCT4 expression with clinicopathological characteristics was
analyzed using the Chi-square test. Kaplan-Meier analysis and
log-rank test were applied to compare the differences in overall
survival (OS) and progression-free survival (PFS) between the
MCT4-high and MCT4-low groups. Death or disease progression were
used as the outcomes for the Cox regression analysis. Multivariate
regression analyses in the Cox regression model were performed to
identify independent factors. Receiver operating characteristic
(ROC) curve analysis was conducted for the Cox regression models
and the area under the curve (AUC) value was used to indicate the
forecasting ability. For the in vitro assay, the shRNA-MCT4
and control group were compared using a paired Student's t-test. A
two-sided P<0.05 was considered to indicate a statistically
significant result.
Results
Relationship between
clinicopathological characteristics and MCT4 expression
According to the TCGA database, MCT4 was
upregulated in ESCC tissues compared to normal tissues (Fig. 1A, P<0.001). MCT4 was detected on
the cell membranes and in the cytoplasm. Representative images of
MCT4 immunostaining are shown in Fig.
1B. A total of 110 patients were studied, of whom 39 (35.5%)
were female and 71 (64.5%) were male, with their age at the time of
diagnosis ranging from 37 to 79 years (median, 61 years). The
survival time of 39 (35.5%) patients was more >5 years, while 71
(64.5%) died during the follow-up period. The survival time of all
patients ranged from 6–80 months (median, 39). Among the 110 ESCC
patients, 63 expressed high levels of MCT4 expression and 47
expressed low levels of MCT4. The associations between
clinicopathological characteristics and MCT4 expression are
presented in Table I. MCT4
expression was found to be associated with T stage (P=0.001), N
stage (P=0.020) and TNM stage (P=0.042). No significant association
was detected with clinicopathological characteristics, including
sex, age, smoking habit, drinking habit and differentiation.
 | Table I.The association of the
clinicopathological characteristics of ESCC with MCT4 expression in
FFPE tissues. |
Table I.
The association of the
clinicopathological characteristics of ESCC with MCT4 expression in
FFPE tissues.
|
| MCT4
overexpression |
|
|---|
|
|
|
|
|---|
| Clinicopathological
features | Low (n=47) | High (n=63) |
P-valuea |
|---|
| Age (years) |
|
| 0.680 |
|
<65 | 22 | 27 |
|
|
≥65 | 25 | 36 |
|
| Sex |
|
| 0.060 |
|
Female | 12 | 27 |
|
|
Male | 35 | 36 |
|
| Smoking |
|
| 0.798 |
| No | 19 | 27 |
|
|
Yes | 28 | 36 |
|
| Drinking |
|
| 0.116 |
| No | 19 | 35 |
|
|
Yes | 28 | 28 |
|
|
Differentiation |
|
| 0.864 |
|
Well | 21 | 26 |
|
|
Moderate | 12 | 19 |
|
|
Poor | 14 | 18 |
|
| T stage |
|
| 0.001a |
| T1 | 7 | 5 |
|
| T2 | 26 | 16 |
|
| T3 | 11 | 25 |
|
| T4 | 3 | 17 |
|
| N stage |
|
| 0.020a |
| N0 | 26 | 18 |
|
| N1 | 5 | 19 |
|
| N2 | 11 | 18 |
|
| N3 | 5 | 8 |
|
| TNM stage |
|
| 0.042a |
| I | 14 | 9 |
|
| II | 16 | 17 |
|
|
III | 17 | 37 |
|
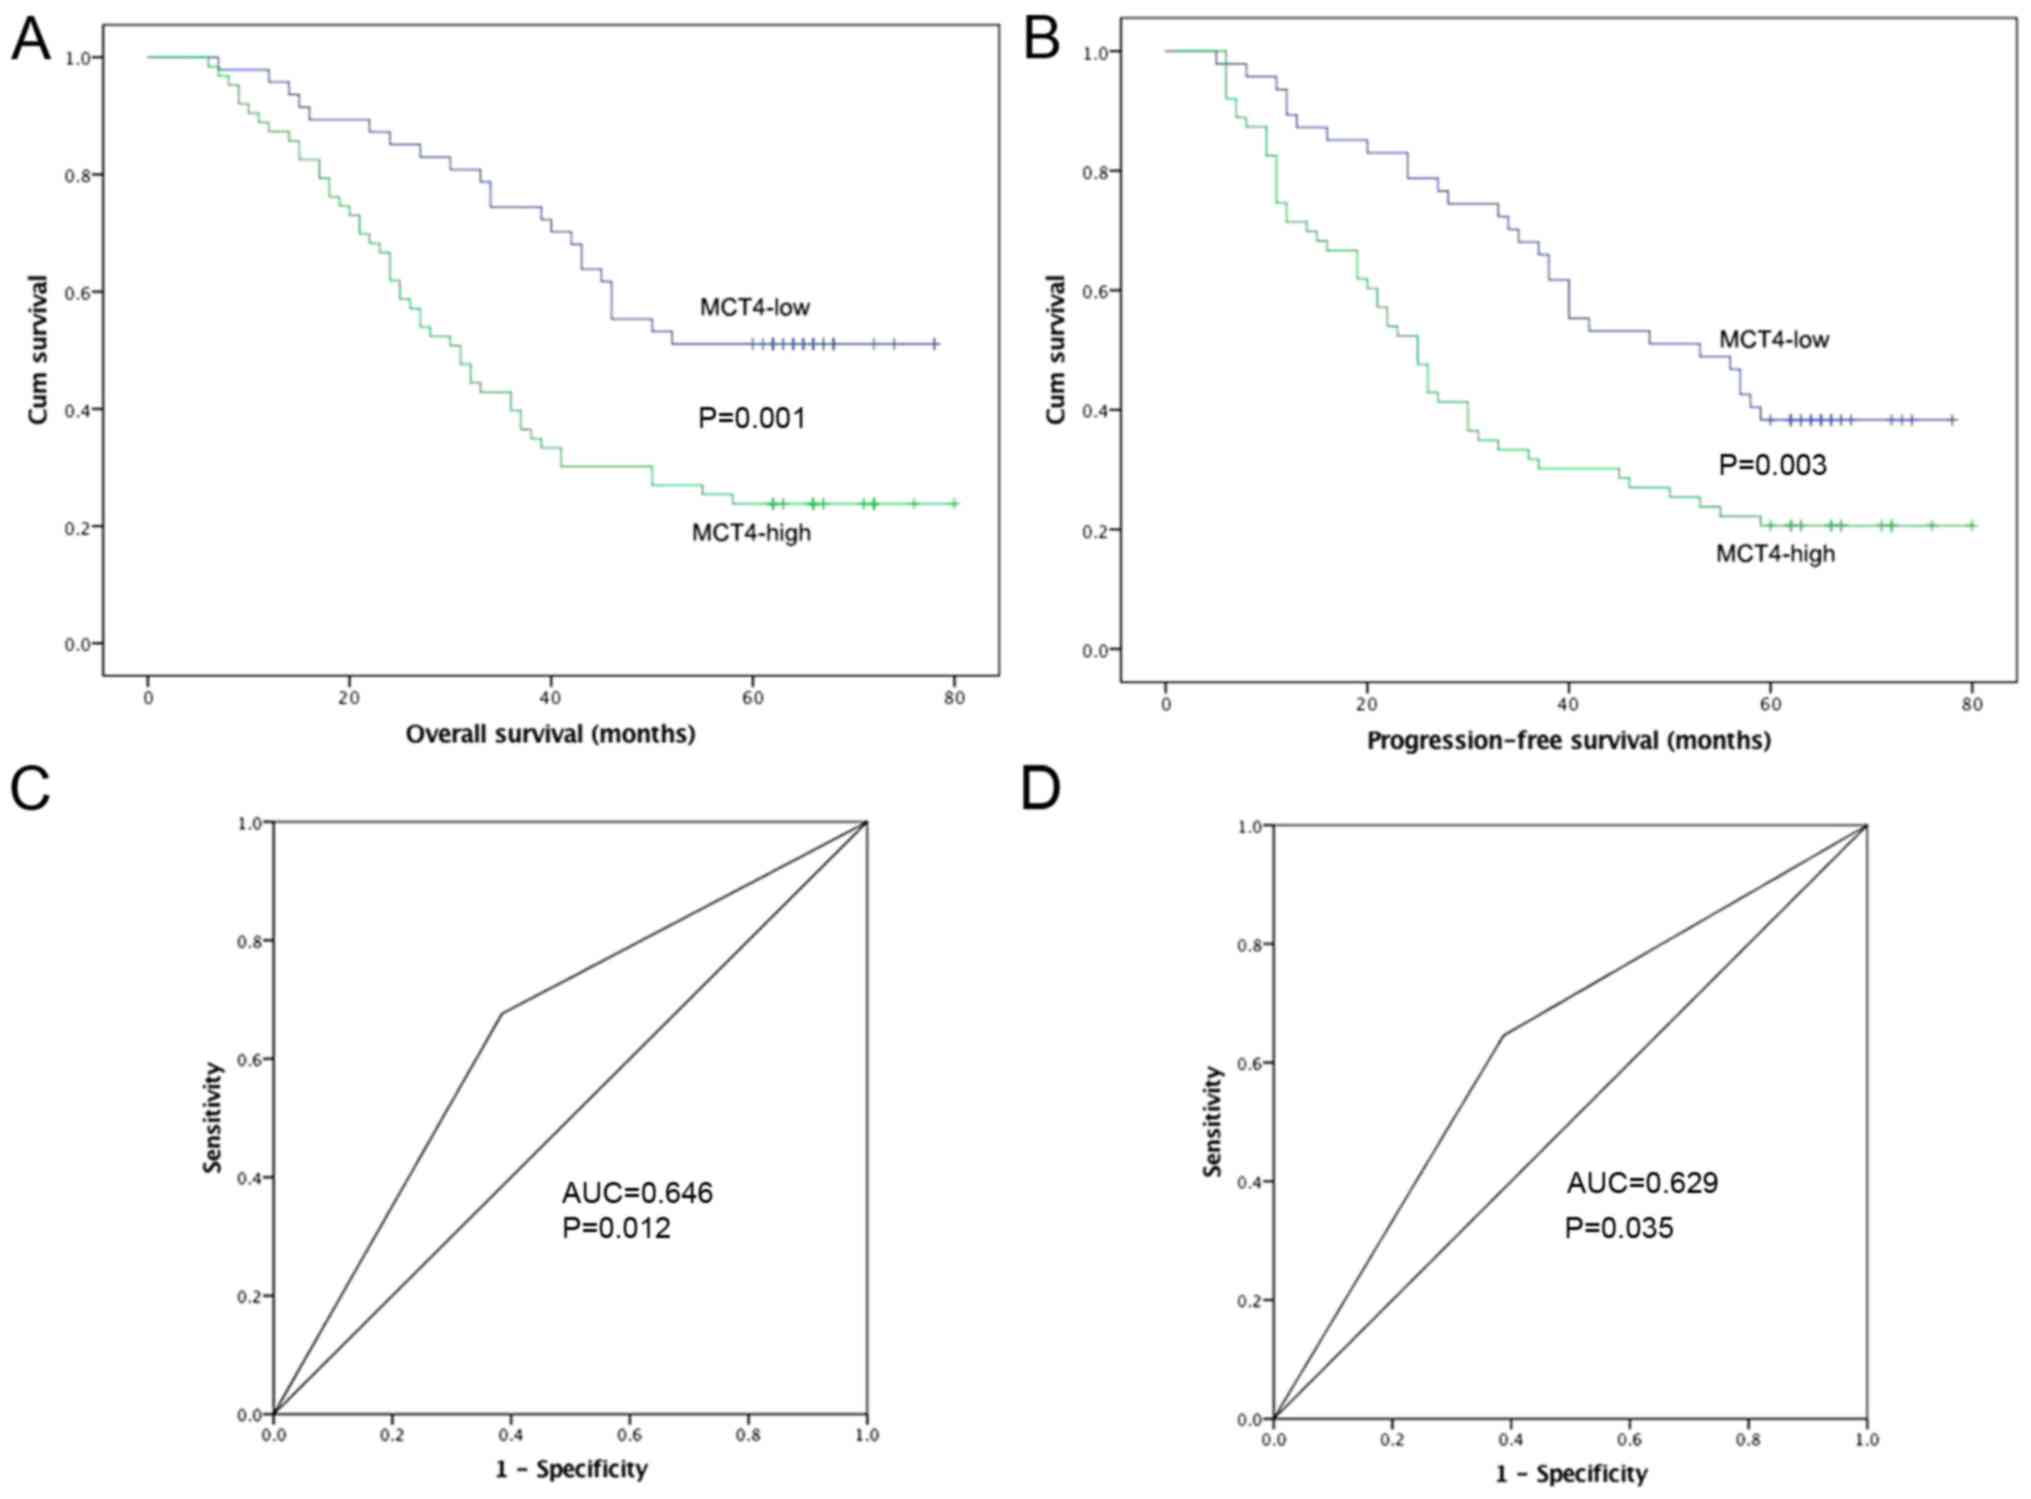
Prognostic value of MCT4 for ESCC
patients
The OS and PFS curves of patients classified by MCT4
expression are shown in Fig. 2A and
B. ROC curve analysis was conducted, and AUC values of MCT4
were 0.646 (P=0.012) and 0.629 (P=0.035) for OS and PFS,
respectively (Fig. 2C and D). The
effect of MCT4 expression on OS and PFS was evaluated by
Kaplan-Meier analysis with the log-rank test. A decreased 5-year OS
was observed in the MCT4-high group compared to the MCT4-low group
(P=0.001). Similarly, the MCT4-high group had a lower 5-year PFS
rate (P=0.003).
The results of the univariate Cox regression
analysis are shown in Table II.
MCT4 expression (P=0.001), T stage (P=0.001) and N stage (P=0.004)
were found to be significantly associated with OS. MCT4 expression
(P=0.004), T stage (P=0.001) and N stage (P=0.001) were also found
to be associated with PFS.
| Table II.Univariate analyses of prognostic
variables. |
Table II.
Univariate analyses of prognostic
variables.
|
| OS | PFS |
|---|
|
|
|
|
|---|
| Variables | P-value | HR | 95% CI | P-value | HR | 95% CI |
|---|
| Sex (female vs.
male) | 0.057 | 0.633 | 0.395–1.013 | 0.054 | 0.642 | 0.409–1.007 |
| Age (<65 vs. ≥65
years) | 0.922 | 1.024 | 0.640–1.637 | 0.612 | 0.892 | 0.573–1.388 |
| Smoking (yes vs.
no) | 0.701 | 0.912 | 0.571–1.458 | 0.693 | 0.914 | 0.586–1.427 |
| Drinking (yes vs.
no) | 0.166 | 0.717 | 0.448–1.148 | 0.256 | 0.733 | 0.496–1.205 |
| T stage | 0.001a |
|
| 0.001a |
|
|
| T1 |
| 1.000 | Ref. |
| 1.000 | Ref. |
| T2 | 0.219 | 1.949 | 0.672–5.658 | 0.889 | 1.059 | 0.476–2.357 |
| T3 | 0.014a | 3.737 | 1.307–10.69 | 0.072 | 2.057 | 0.936–4.518 |
| T4 | 0.001a | 5.941 | 1.988–17.75 | 0.006a | 3.269 | 1.411–7.573 |
| N stage | 0.004a |
|
| 0.001a |
|
|
| N0 |
| 1.000 | Ref. |
| 1.000 | Ref. |
| N1 | 0.072 | 1.831 | 0.948–3.538 | 0.082 | 1.747 | 0.932–3.274 |
| N2 | 0.001a | 2.723 | 1.487–4.987 | 0.001a | 3.024 | 1.719–5.319 |
| N3 | 0.003a | 3.017 | 1.468–6.203 | 0.003a | 2.966 | 1.461–6.021 |
|
Differentiation | 0.399 |
|
| 0.143 |
|
|
|
Well |
| 1.000 | Ref. |
| 1.000 | Ref. |
|
Moderate | 0.427 | 1.249 | 0.722–2.159 | 0.188 | 1.412 | 0.845–2.360 |
|
Poor | 0.505 | 0.821 | 0.460–1.466 | 0.433 | 0.800 | 0.457–1.399 |
| MCT4 (High level
vs. low level) | 0.001a | 2.337 | 1.416–3.856 | 0.004a | 1.969 | 1.242–3.122 |
The results of the multivariate Cox regression
analysis are shown in Table III.
MCT4 expression (P=0.014), T stage (P=0.038) and N stage (P=0.048)
were found to be independent prognostic factors for ESCC patients.
With respect to PFS, MCT4 expression (P=0.046) and N stage
(P=0.016) were significantly associated with patient outcome.
| Table III.Multivariate analyses of prognostic
variables. |
Table III.
Multivariate analyses of prognostic
variables.
|
| OS | PFS |
|---|
|
|
|
|
|---|
| Variables | P-value | HR | 95% CI | P-value | HR | 95% CI |
|---|
| T stage | 0.038a |
|
| 0.115 |
|
|
| T1 |
| 1.000 | Ref. |
| 1.000 | Ref. |
| T2 | 0.093 | 2.543 | 0.856–7.555 | 0.462 | 1.364 | 0.597–3.120 |
| T3 | 0.029a | 3.285 | 1.131–9.538 | 0.072 | 1.839 | 0.823–4.113 |
| T4 | 0.007a | 4.648 | 1.520–14.21 | 0.028a | 2.626 | 1.108–6.224 |
| N stage | 0.048a |
|
| 0.016a |
|
|
| N0 |
| 1.000 | Ref. |
| 1.000 | Ref. |
| N1 | 0.479 | 1.220 | 0.605–2.458 | 0.549 | 1.227 | 0.628–2.397 |
| N2 | 0.011a | 2.335 | 1.219–4.474 | 0.003a | 2.517 | 1.376–4.606 |
| N3 | 0.070 | 1.730 | 0.791–3.788 | 0.107 | 1.878 | 0.873–4.041 |
| MCT4 (High level
vs. low level) | 0.014a | 2.022 | 1.153–3.479 | 0.046a | 1.677 | 1.010–2.784 |
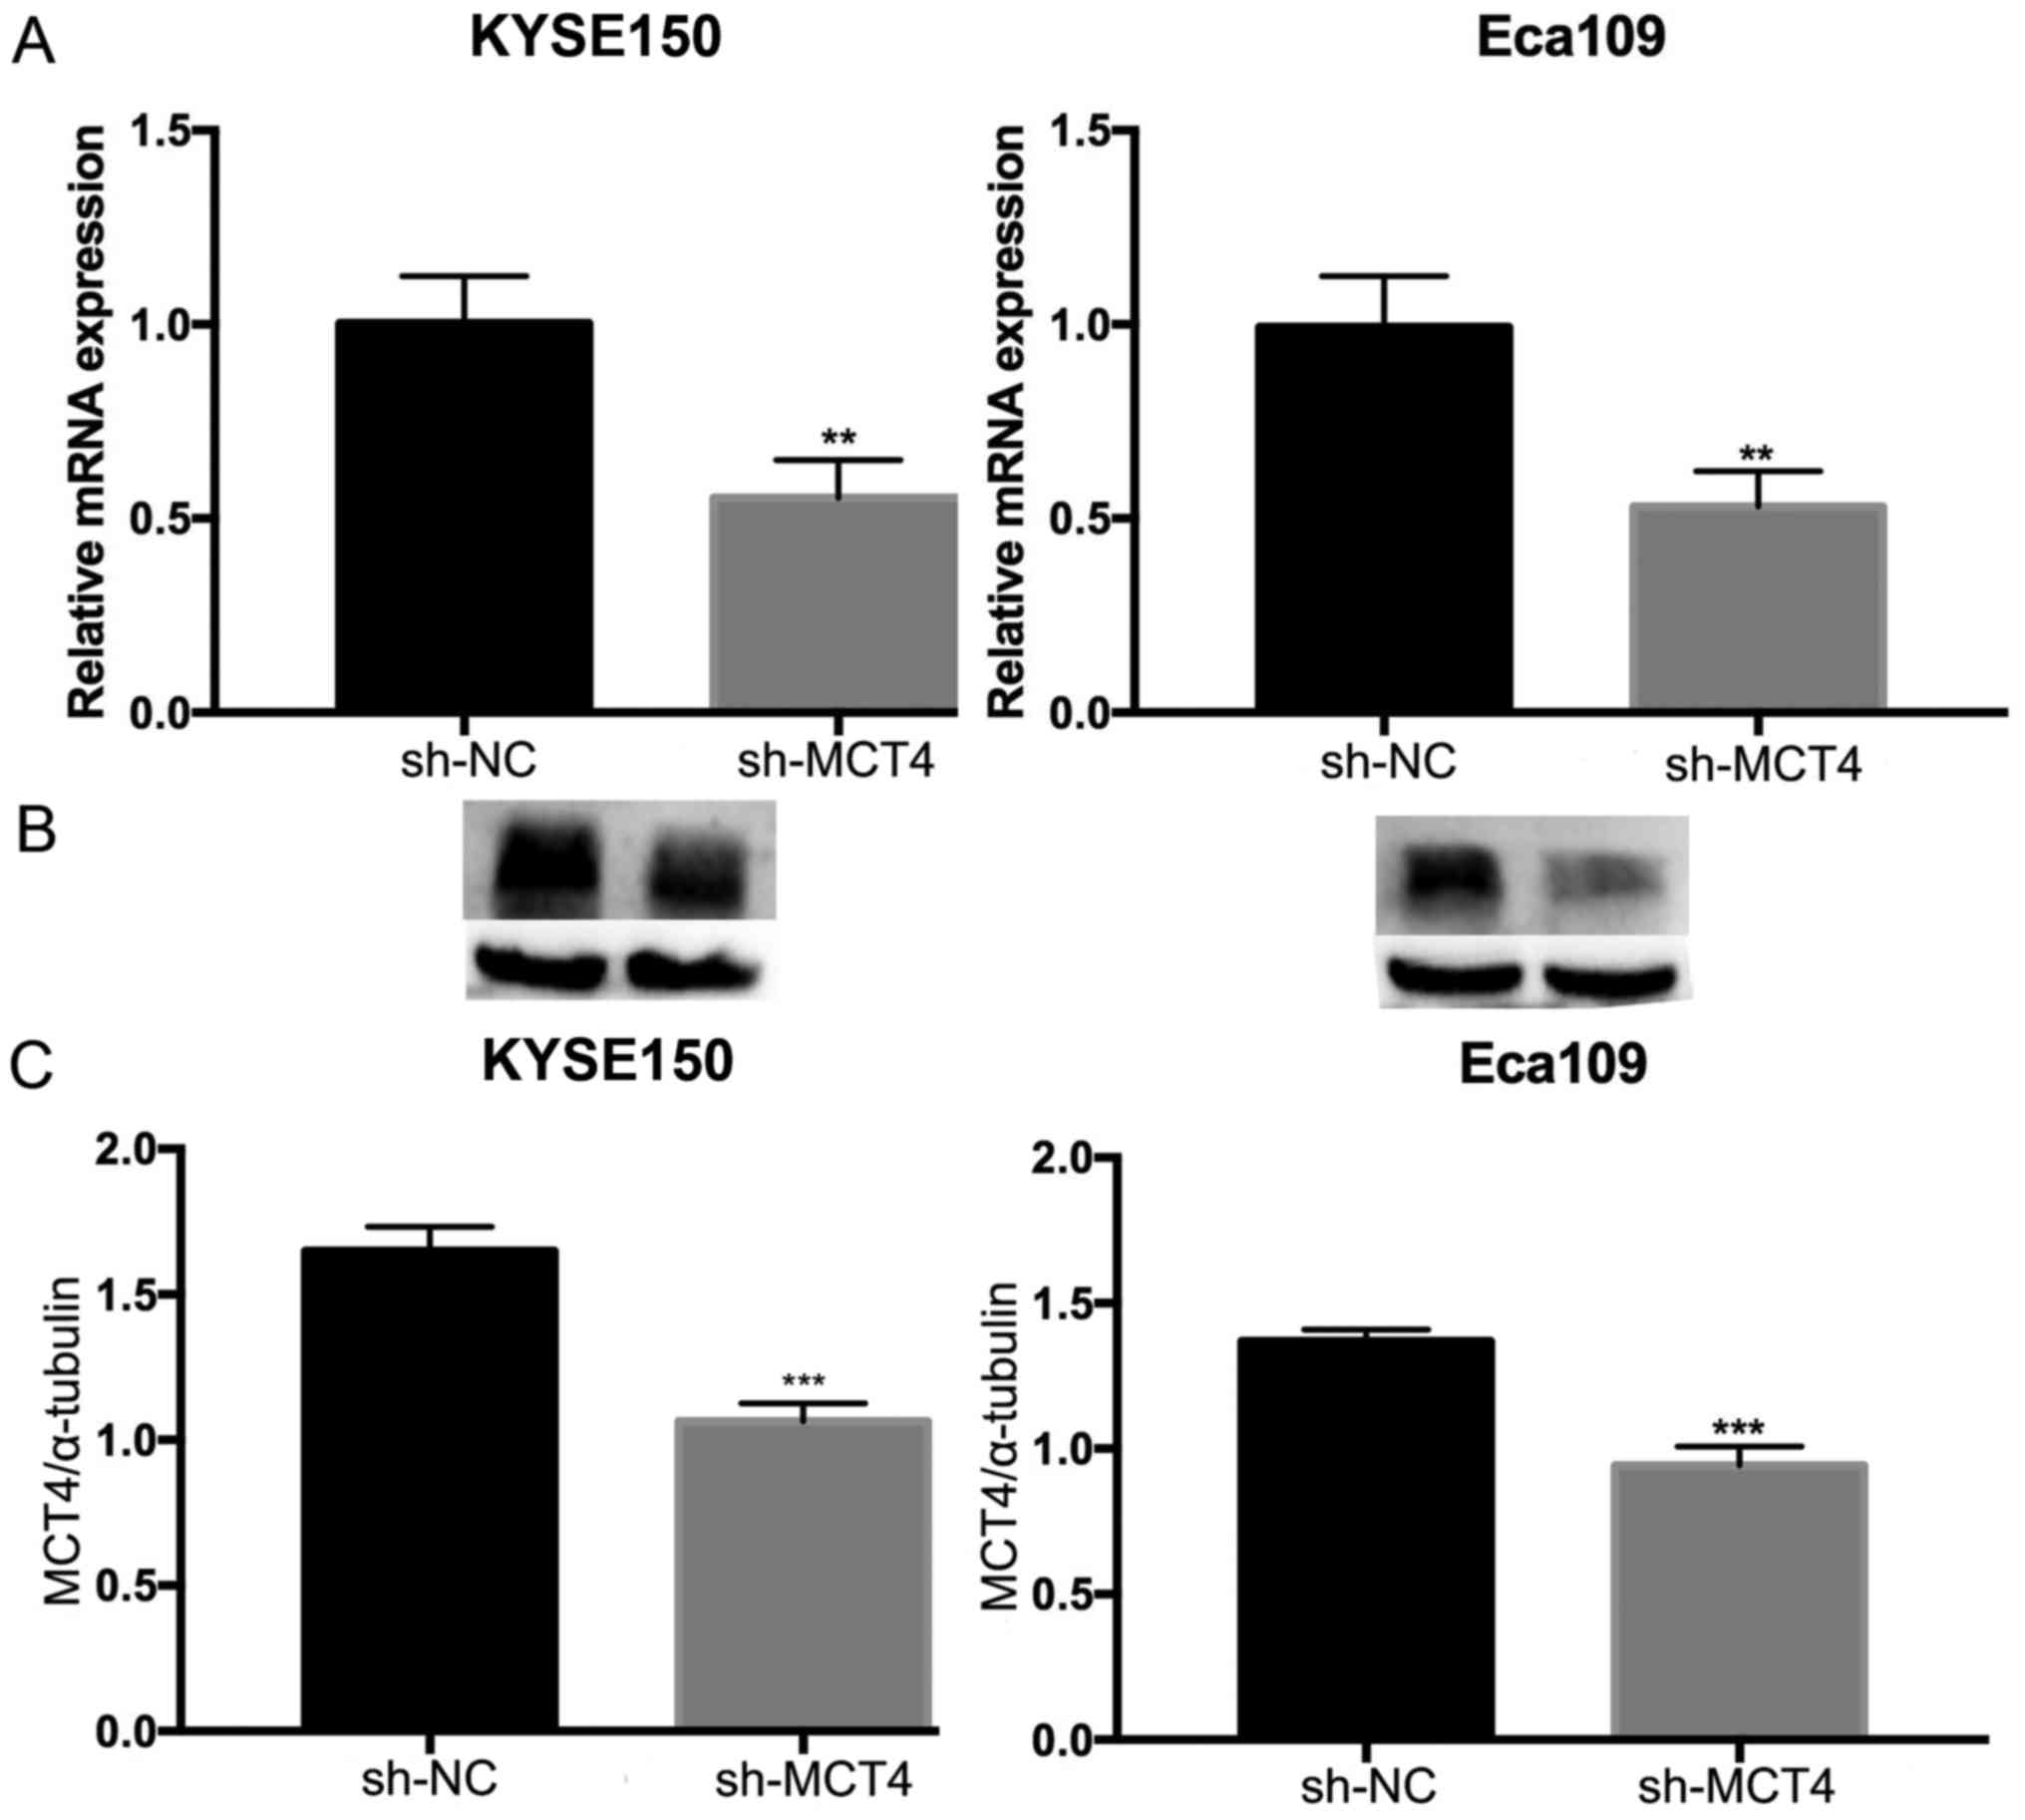
Downregulation of MCT4 expression
inhibits proliferation and promotes apoptosis of ESCC cells
To investigate the function of MCT4 in ESCC, shRNA
was used to specifically knock down MCT4 expression in KYSE150 and
Eca109 cells. RT-qPCR and western blot analyses were conducted to
verify the effect of the knockdown on mRNA and protein expression
levels. The expression of MCT4 mRNA (MCT4/β-actin: 1.00±0.12 vs.
0.55±0.10, P=0.007 and 1.03±0.08 vs. 0.30±0.04, P=0.006, for
KYSE150 and Eca109 respectively; Fig.
3A) and protein (MCT4/α-tubulin: 1.65±0.08 vs. 1.06±0.06,
P=0.001 and 1.37±0.04 vs. 0.94±0.06, P<0.001, for KYSE150 and
Eca109, respectively; Fig. 3B and
C) was successfully downregulated by sh-MCT4. To determine
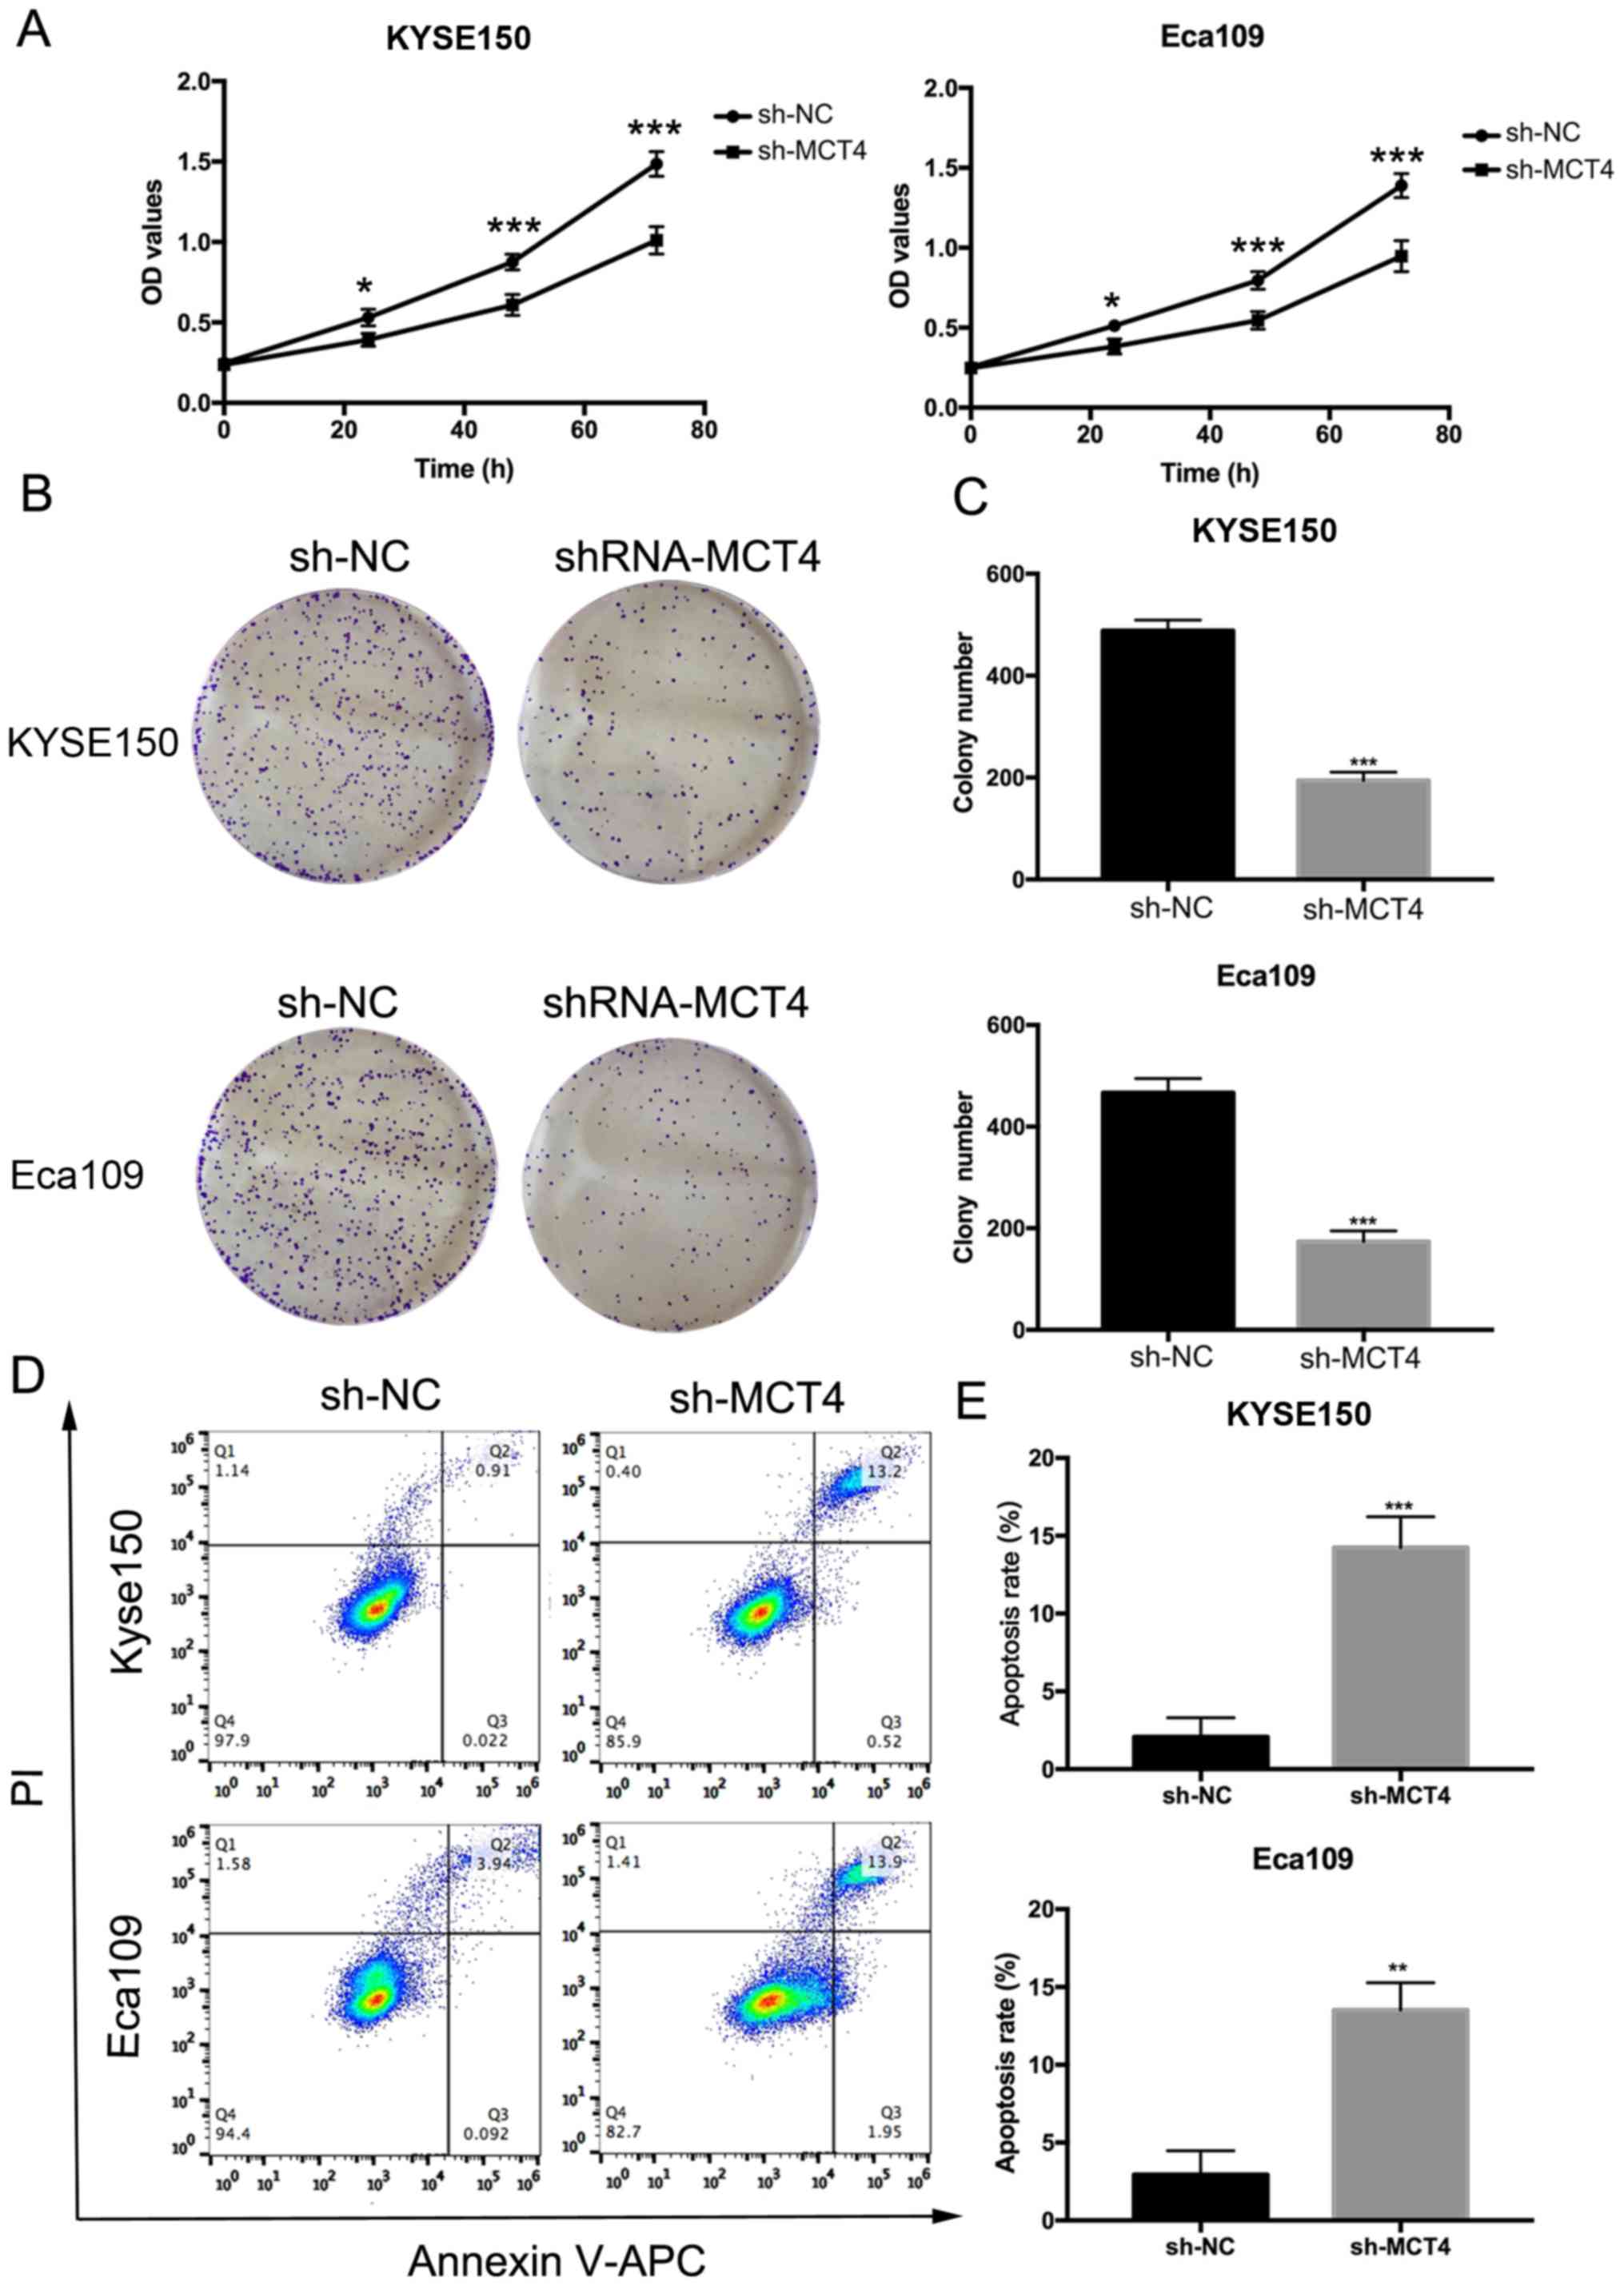
whether MCT4 affected the proliferation and survival abilities of
KYSE150 and Eca109 cells, we performed CCK-8 and clonogenic assays.
The OD values (Fig. 4A) of the
sh-MCT4 groups were significantly decreased compared to the control
sh-NC groups at 24, 48 and 72 h for both cell lines (P<0.05). In
comparison with the control groups, the number of clones was
reduced (KYSE150, 488±21 vs. 194±16, P<0.001; Eca109, 467±28 vs.
174±21, P<0.001; Fig. 4B and C).
As shown in Fig. 4D and E, 5 days
after shRNA was transfected, the apoptosis rates (%) of the sh-MCT4
groups were increased (KYSE150, 14.23±1.99 vs. 2.07±1.23,
P<0.001; Eca109, 13.52±1.75 vs. 2.94±1.53, P=0.002).
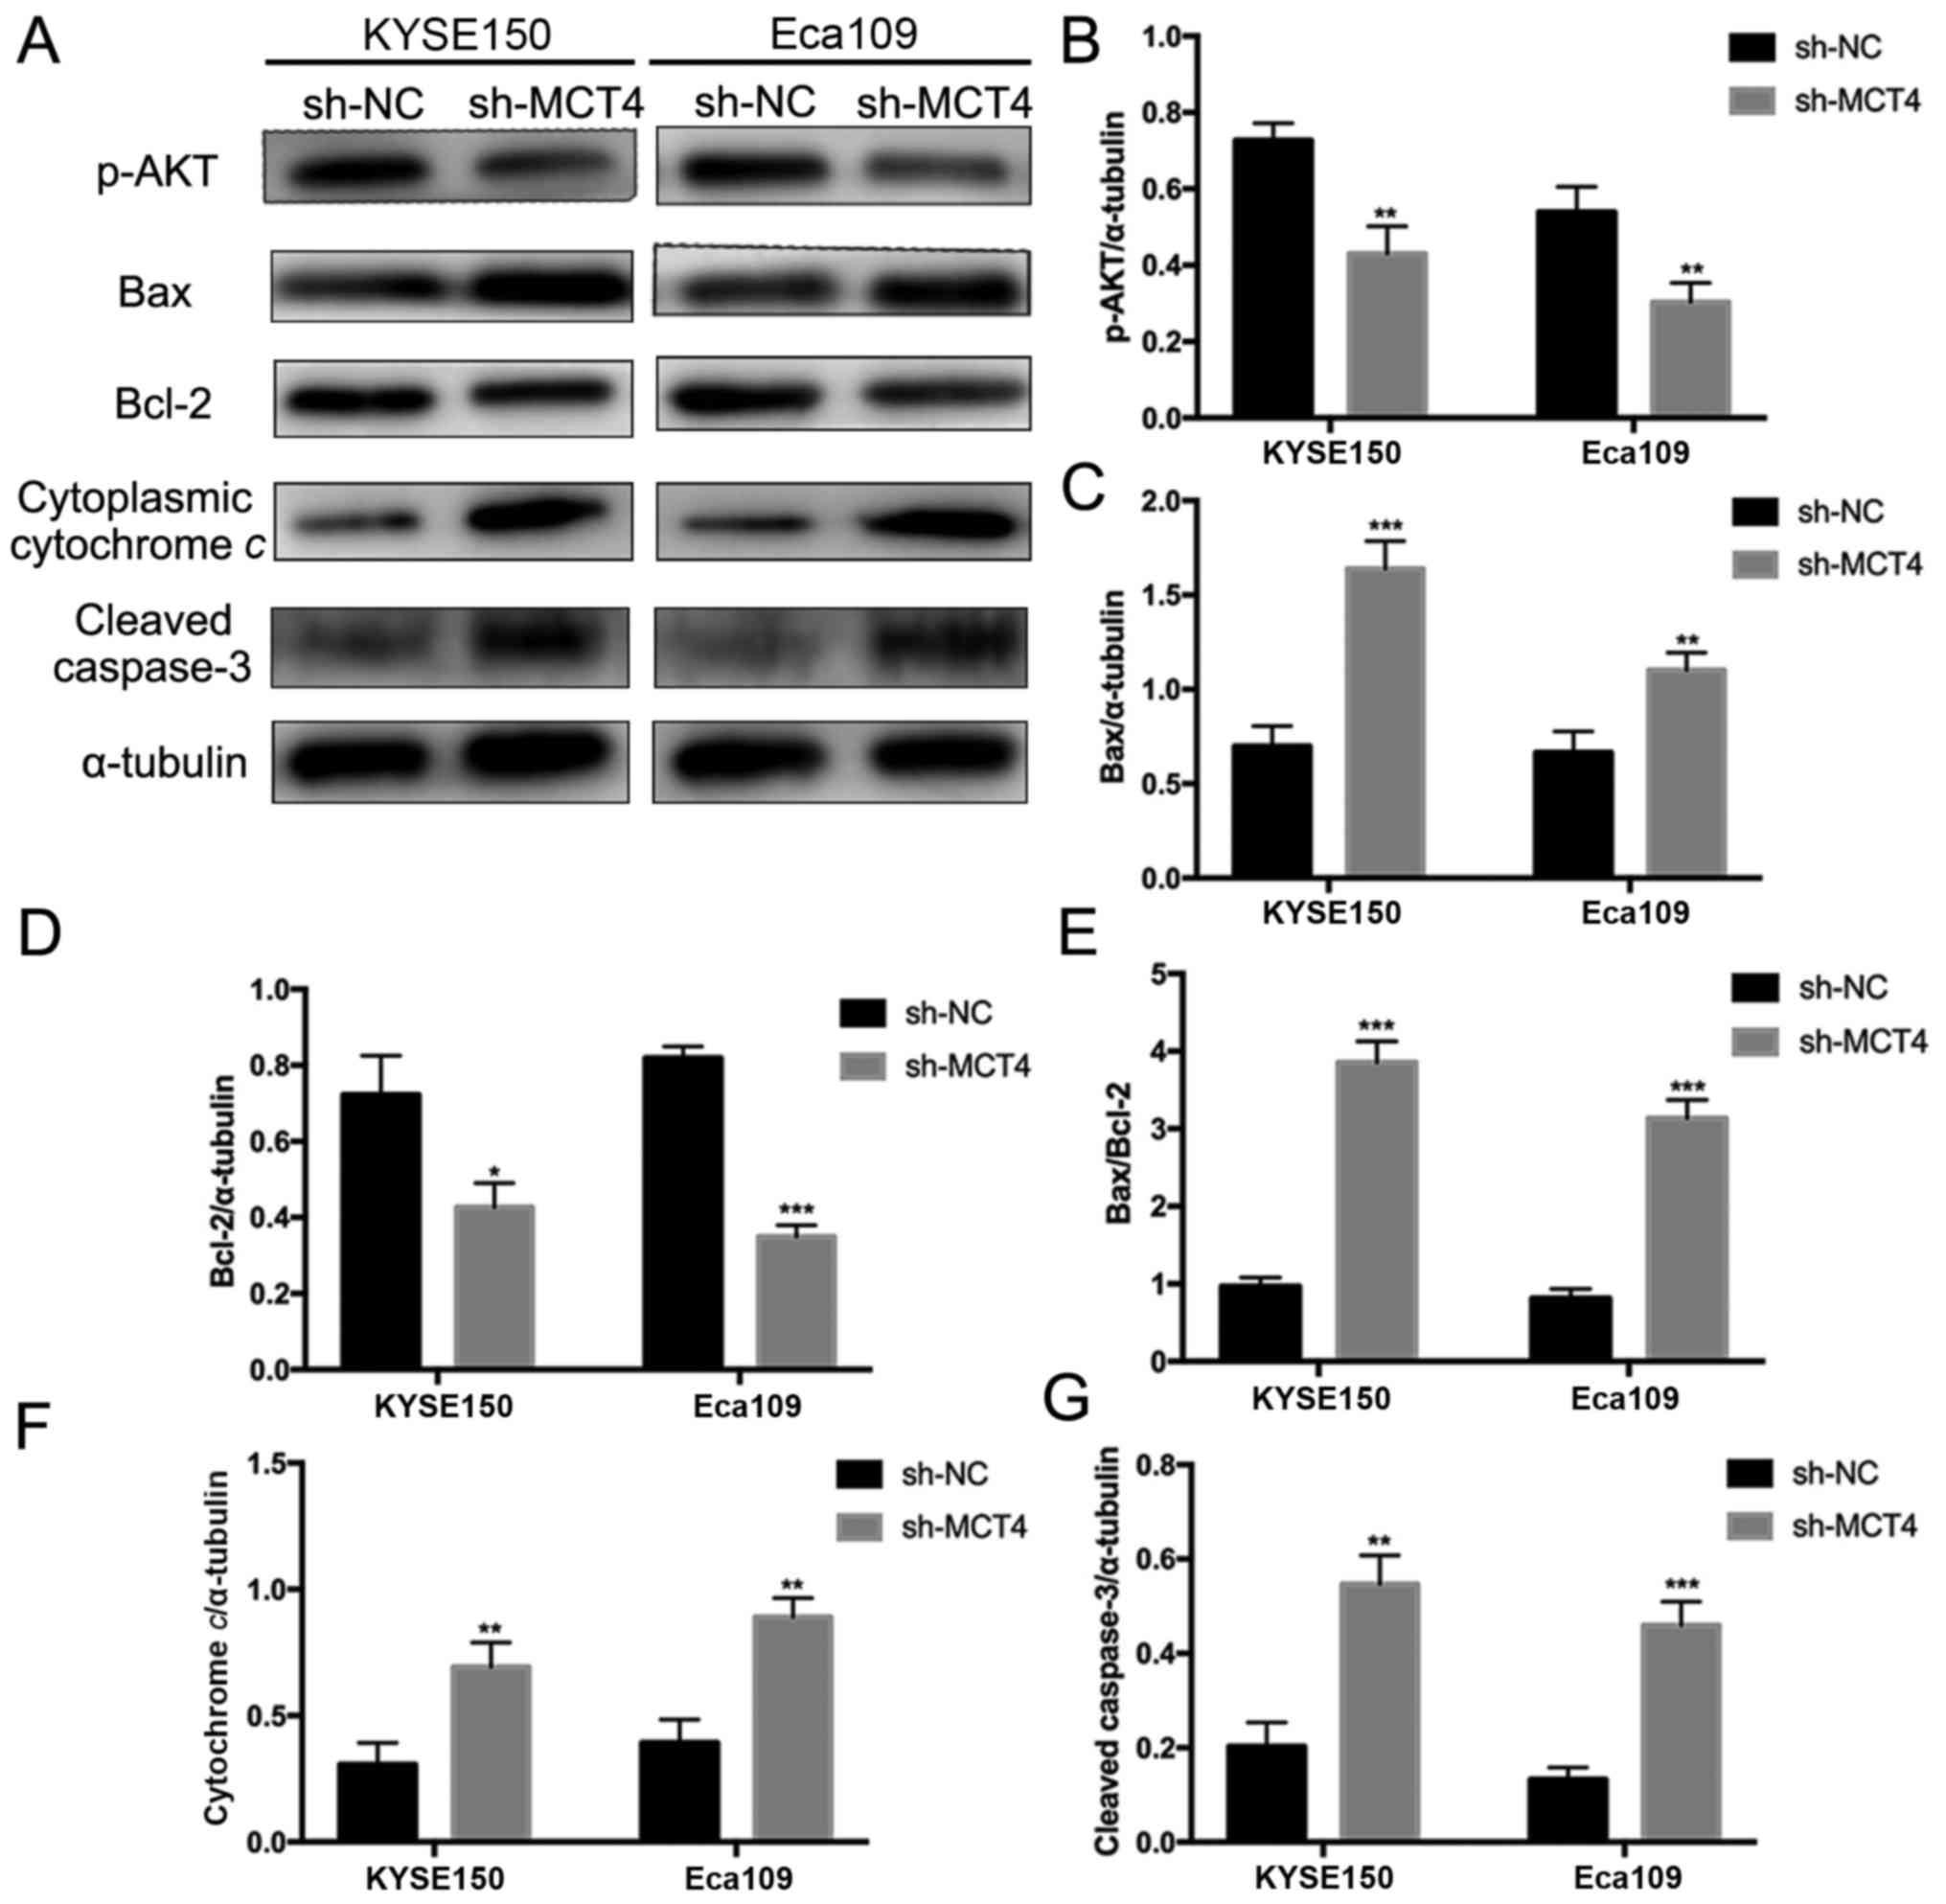
MCT4 knockdown inhibits activation of
Akt and increases Bax/Bcl-2 ratio, cytochrome c release and
caspase-3 cleavage
To explore the molecular mechanisms underlying
inhibited proliferation and elevated apoptosis by loss of MCT4, key
intracellular molecules of proliferation and apoptosis were
examined by western blotting, including p-Akt, Bax, Bcl-2,
cytochrome c, caspase-3 and cleaved caspase-3 (Fig. 5A). As shown in Fig. 5A, phosphorylation of Akt was
decreased in sh-MCT4 groups compared to sh-NC groups
(p-Akt/α-tubulin, 0.43±0.07 vs. 0.73±0.05, P=0.004 and 0.30±0.05
vs. 0.54±0.07, P=0.007, for KYSE150 and Eca109 respectively;
Fig. 5B). MCT4 knockdown
upregulated Bax expression (Bax/α-tubulin, 1.64±0.15 vs. 0.70±0.11,
P<0.001 and 1.10±0.09 vs. 0.67±0.11, P=0.007, for KYSE150 and
Eca109 respectively; Fig. 5C) and
downregulated Bcl-2 expression (Bcl-2/α-tubulin, 0.43±0.06 vs.
0.72±0.10, P=0.013 and 0.35±0.03 vs. 0.82±0.03, P<0.001, for
KYSE150 and Eca109 respectively; Fig.
5D), thus increasing the Bax/Bcl-2 ratio (KYSE150, 3.86±0.27
vs. 0.97±0.11, P<0.001; Eca109, 3.14±0.24 vs. 0.81±0.12,
P<0.001; Fig. 5E). Cytoplasmic
cytochrome c release was increased with loss of MCT4
(cytoplasmic cytochrome c/α-tubulin, 0.69±0.09 vs.
0.31±0.09, P=0.006 and 0.89±0.08 vs. 0.39±0.08, P=0.002, for
KYSE150 and Eca109 respectively; Fig.
5F). Additionally, MCT4 knockdown promoted caspase-3 cleavage
(cleaved caspase-3/α-tubulin, 0.55±0.06 vs. 0.20±0.05, P=0.002 and
0.46±0.05 vs. 0.13±0.03 P<0.0001, for KYSE150 and Eca109
respectively; Fig. 5G).
Discussion
According to the ‘Warburg effect’, cancer cells
exhibit a greater dependency on the glycolytic pathway for ATP
generation (20). Rapid glucose
uptake and lactate secretion are features of the ‘Warburg effect’
that contribute to sustained ATP production and provide
biosynthetic intermediates in many types of cancer (21). The widespread clinical application
of 18 fluorodeoxyglucose (FdG) positron-emission tomography (PET)
has demonstrated that the glycolytic phenotype exists in most
cancer types (22). The main
function of MCT4 is secretion of lactate and protons from highly
glycolytic cells in order to stabilize the intracellular
environment (23).
According to data acquired from the TCGA database,
MCT4 is expressed at higher levels in ESCC cancerous tissue
compared with normal tissue. It is possible that MCT4 may act as an
oncogene in ESCC, as it does in other types of cancer (11,12,14–19)
and it could be a potential prognostic factor for ESCC. Analysis of
the associations between patient clinicopathological
characteristics and MCT4 expression revealed that MCT4 expression
was significantly associated with T stage, N stage and TNM stage.
Kaplan-Meier analysis indicated that patients with lower MCT4
expression had a higher survival rate. ROC-AUC analysis indicates
the degree of concordance between expected and observed ordering of
the data. The AUC values of MCT4 were statistically significant for
prediction of OS and PFS. Univariate and multivariate Cox
regression analyses demonstrated that MCT4 was an independent
prognostic factor for ESCC patients. Furthermore, in vitro
assays indicated that knockdown of MCT4 by shRNA-MCT4 decreased the
proliferation and increased the apoptosis rates of ESCC cells.
Accordingly, MCT4 could potentially be used as a prognostic
biomarker for survival of ESCC patients.
The altered metabolism of cancer cells is controlled
by oncogene signaling and mutated metabolic enzymes (24). Cancers with invasion and metastasis
tendency and rapid development in a hypoxic microenvironment
usually exhibit upregulated expression of MCT4, mediated by
hypoxia-inducible factor 1 (HIF-1) and CD147 (25). In addition, oncogene signaling
pathways can also be influenced by the metabolites generated from
reciprocally reprogrammed metabolism and such crosstalk may sustain
the progression of cancer and its resistance to therapeutic agents
(26). Based upon the finding that
loss of MCT4 inhibited proliferation and promoted apoptosis of ESCC
cells, it is proposed that MCT4 downregulation leads to the
alteration of gene expression associated with proliferation and
apoptosis. Akt signaling plays a crucial role in various cellular
processes, including cell proliferation, apoptosis, intracellular
transport, glucose metabolism, genetic transcription and cell
migration (27).
In the present study, we found that phosphorylation
of Akt was inhibited by MCT4 knockdown in two ESCC cell lines. This
result indicated that MCT4 expression was associated with
activation of Akt signaling. Furthermore, increased Bax/Bcl-2
ratio, cytochrome c release and caspase-3 cleavage were
observed in MCT4 knockdown ESCC cells. Previous evidence suggests
that pro- and anti-apoptotic activities are tightly regulated by
the Bcl-2 family (28). These
proteins regulate cell apoptosis by controlling the release of
cytochrome c, through adjusting the permeability of the
mitochondrial membrane (29). Bax
is inserted into the mitochondrial membrane and facilitates the
release of cytochrome c into the cytoplasm, while Bcl-2
impedes cytochrome c release (30). Cytochrome c promotes the
intrinsic pathway of apoptosis, which is activated after its
combination with deoxyadenosine triphosphate (dATP) and apoptotic
protease-activating factor (Apaf1) to form an apoptosome (31). Then, the apoptosome provides a
platform to gather the initiating caspases and eventually activated
caspase-3, which is a general executioner of apoptosis, by cleaving
numerous substrates inside the cell (32). The current results indicated that
MCT4 knockdown had an apoptosis-inducing effect on ESCC cells via
the mitochondria pathway. A potential mechanism of proliferative
inhibition and apoptotic activation is that MCT4 is not only
essential for the hyper-glycolytic phenotype, but also for the
acid-resistant phenotype by eliminating newly generated lactate,
thus allowing cells to continuously convert pyruvate to lactate,
conduct glycolysis and resist acid-induced apoptosis or necrosis
(33). MCT4 silencing leads to
intracellular acidosis and reduction of ATP production, together
with partial reversion of the ‘Warburg effect’ in clear cell renal
cell carcinoma (ccRCC) cell lines (34). MCT4 knockdown may also cause lactate
to accumulate, lessen the ATP production of glycolysis and
eventually result in decreased proliferation and increased
apoptosis of ESCC cells. Although the mechanism remains unclear,
MCT4 could be an attractive target for ESCC therapy based upon our
findings.
In conclusion, the results of this study indicated
that MCT4 is a novel biomarker for predicting the outcomes of ESCC
patients. Downregulation of MCT4 decreased proliferation and
increased apoptosis of ESCC cells by reducing activation of Akt and
initiating the mitochondrial apoptosis pathway. Targeting MCT4 may
serve as an effective treatment for ESCC patients.
Acknowledgements
Not applicable.
Funding
The present study was supported by a grant from the
National Natural Science Foundation of China (grant no.
81671785).
Availability of data and materials
The analyzed data sets are available from the
corresponding author upon reasonable request.
Authors' contributions
JY and BC designed the study. BC, XC and YL
generated the majority of the data. XH provided the follow-up data.
BC was the major writer of the manuscript. All authors read and
approved the manuscript and agree to be accountable for all aspects
of the research in ensuring that the accuracy or integrity of any
part of the work are appropriately investigated and resolved.
Ethics approval and consent to
participate
The present study was approved by the Ethics
Committee of Qilu Hospital (Jinan, China) and was carried out in
compliance with the 1964 Helsinki declaration and its later
amendments. As the present study was a retrospective study, the
requirement to obtain informed consent was waived. All patient data
were treated in accordance with the privacy regulations of our
committee.
Patient consent for publication
Not applicable.
Competing interests
The authors declare that they have no competing
interests.
References
|
1
|
Napier KJ, Scheerer M and Misra S:
Esophageal cancer: A Review of epidemiology, pathogenesis, staging
workup and treatment modalities. World J Gastrointest Oncol.
6:112–120. 2014. View Article : Google Scholar : PubMed/NCBI
|
|
2
|
Abnet CC, Arnold M and Wei WQ:
Epidemiology of esophageal squamous cell carcinoma.
Gastroenterology. 154:360–373. 2018. View Article : Google Scholar : PubMed/NCBI
|
|
3
|
Mandard AM, Hainaut P and Hollstein M:
Genetic steps in the development of squamous cell carcinoma of the
esophagus. Mutat Res. 462:335–342. 2000. View Article : Google Scholar : PubMed/NCBI
|
|
4
|
Ohashi S, Miyamoto S, Kikuchi O, Goto T,
Amanuma Y and Muto M: Recent advances from basic and clinical
studies of esophageal squamous cell carcinoma. Gastroenterology.
149:1700–1715. 2015. View Article : Google Scholar : PubMed/NCBI
|
|
5
|
Halestrap AP and Price NT: The
proton-linked monocarboxylate transporter (MCT) family: Structure,
function and regulation. Biochem J. 343:281–299. 1999. View Article : Google Scholar : PubMed/NCBI
|
|
6
|
Halestrap AP and Wilson MC: The
monocarboxylate transporter family - role and regulation. IUBMB
Life. 64:109–119. 2012. View
Article : Google Scholar : PubMed/NCBI
|
|
7
|
Juel C and Halestrap AP: Lactate transport
in skeletal muscle - role and regulation of the monocarboxylate
transporter. J Physiol. 517:633–642. 1999. View Article : Google Scholar : PubMed/NCBI
|
|
8
|
Bonen A: The expression of lactate
transporters (MCT1 and MCT4) in heart and muscle. Eur J Appl
Physiol. 86:6–11. 2001. View Article : Google Scholar : PubMed/NCBI
|
|
9
|
Bergersen L, Rafiki A and Ottersen OP:
Immunogold cytochemistry identifies specialized membrane domains
for monocarboxylate transport in the central nervous system.
Neurochem Res. 27:89–96. 2002. View Article : Google Scholar : PubMed/NCBI
|
|
10
|
Lunt SY and Vander Heiden MG: Aerobic
glycolysis: Meeting the metabolic requirements of cell
proliferation. Annu Rev Cell Dev Biol. 27:441–464. 2011. View Article : Google Scholar : PubMed/NCBI
|
|
11
|
Doyen J, Trastour C, Ettore F, Peyrottes
I, Toussant N, Gal J, Ilc K, Roux D, Parks SK, Ferrero JM, et al:
Expression of the hypoxia-inducible monocarboxylate transporter
MCT4 is increased in triple negative breast cancer and correlates
independently with clinical outcome. Biochem Biophys Res Commun.
451:54–61. 2014. View Article : Google Scholar : PubMed/NCBI
|
|
12
|
Kwon JE, Jung WH and Koo JS: The
expression of metabolism-related proteins in phyllodes tumors.
Tumour Biol. 34:115–124. 2013. View Article : Google Scholar : PubMed/NCBI
|
|
13
|
Witkiewicz AK, Whitaker-Menezes D,
Dasgupta A, Philp NJ, Lin Z, Gandara R, Sneddon S,
Martinez-Outschoorn UE, Sotgia F and Lisanti MP: Using the ‘reverse
Warburg effect’ to identify high-risk breast cancer patients:
Stromal MCT4 predicts poor clinical outcome in triple-negative
breast cancers. Cell Cycle. 11:1108–1117. 2012. View Article : Google Scholar : PubMed/NCBI
|
|
14
|
Gao HJ, Zhao MC, Zhang YJ, Zhou DS, Xu L,
Li GB, Chen MS and Liu J: Monocarboxylate transporter 4 predicts
poor prognosis in hepatocellular carcinoma and is associated with
cell proliferation and migration. J Cancer Res Clin Oncol.
141:1151–1162. 2015. View Article : Google Scholar : PubMed/NCBI
|
|
15
|
Ohno A, Yorita K, Haruyama Y, Kondo K,
Kato A, Ohtomo T, Kawaguchi M, Marutuska K, Chijiiwa K and Kataoka
H: Aberrant expression of monocarboxylate transporter 4 in tumour
cells predicts an unfavourable outcome in patients with
hepatocellular carcinoma. Liver Int. 34:942–952. 2014. View Article : Google Scholar : PubMed/NCBI
|
|
16
|
Baek G, Tse YF, Hu Z, Cox D, Buboltz N,
McCue P, Yeo CJ, White MA, DeBerardinis RJ, Knudsen ES, et al: MCT4
defines a glycolytic subtype of pancreatic cancer with poor
prognosis and unique metabolic dependencies. Cell Reports.
9:2233–2249. 2014. View Article : Google Scholar : PubMed/NCBI
|
|
17
|
Nakayama Y, Torigoe T, Inoue Y, Minagawa
N, Izumi H, Kohno K and Yamaguchi K: Prognostic significance of
monocarboxylate transporter 4 expression in patients with
colorectal cancer. Exp Ther Med. 3:25–30. 2012. View Article : Google Scholar : PubMed/NCBI
|
|
18
|
Zhu J, Wu YN, Zhang W, Zhang XM, Ding X,
Li HQ, Geng M, Xie ZQ and Wu HM: Monocarboxylate transporter 4
facilitates cell proliferation and migration and is associated with
poor prognosis in oral squamous cell carcinoma patients. PLoS One.
9:e879042014. View Article : Google Scholar : PubMed/NCBI
|
|
19
|
Zhao Z, Han F, He Y, Yang S, Hua L, Wu J
and Zhan W: Stromal-epithelial metabolic coupling in gastric
cancer: Stromal MCT4 and mitochondrial TOMM20 as poor prognostic
factors. Eur J Surg Oncol. 40:1361–1368. 2014. View Article : Google Scholar : PubMed/NCBI
|
|
20
|
Vander Heiden MG, Cantley LC and Thompson
CB: Understanding the Warburg effect: The metabolic requirements of
cell proliferation. Science. 324:1029–1033. 2009. View Article : Google Scholar : PubMed/NCBI
|
|
21
|
Shlomi T, Benyamini T, Gottlieb E, Sharan
R and Ruppin E: Genome-scale metabolic modeling elucidates the role
of proliferative adaptation in causing the Warburg effect. PLOS
Comput Biol. 7:e10020182011. View Article : Google Scholar : PubMed/NCBI
|
|
22
|
Gatenby RA and Gillies RJ: Why do cancers
have high aerobic glycolysis? Nat Rev Cancer. 4:891–899. 2004.
View Article : Google Scholar : PubMed/NCBI
|
|
23
|
Dimmer KS, Friedrich B, Lang F, Deitmer JW
and Bröer S: The low-affinity monocarboxylate transporter MCT4 is
adapted to the export of lactate in highly glycolytic cells.
Biochem J. 350:219–227. 2000. View Article : Google Scholar : PubMed/NCBI
|
|
24
|
Cairns RA, Harris IS and Mak TW:
Regulation of cancer cell metabolism. Nat Rev Cancer. 11:85–95.
2011. View
Article : Google Scholar : PubMed/NCBI
|
|
25
|
Parks SK, Chiche J and Pouyssegur J: pH
control mechanisms of tumor survival and growth. J Cell Physiol.
226:299–308. 2011. View Article : Google Scholar : PubMed/NCBI
|
|
26
|
Blanker MH, Norg RJ and van der Heide WK:
A new approach to patients with lower urinary tract symptoms. Br J
Gen Pract. 62:344–345. 2012. View Article : Google Scholar : PubMed/NCBI
|
|
27
|
Manning BD and Cantley LC: AKT/PKB
signaling: Navigating downstream. Cell. 129:1261–1274. 2007.
View Article : Google Scholar : PubMed/NCBI
|
|
28
|
Youle RJ and Strasser A: The BCL-2 protein
family: Opposing activities that mediate cell death. Nat Rev Mol
Cell Biol. 9:47–59. 2008. View
Article : Google Scholar : PubMed/NCBI
|
|
29
|
Cory S, Huang DC and Adams JM: The Bcl-2
family: Roles in cell survival and oncogenesis. Oncogene.
22:8590–8607. 2003. View Article : Google Scholar : PubMed/NCBI
|
|
30
|
Oltvai ZN, Milliman CL and Korsmeyer SJ:
Bcl-2 heterodimerizes in vivo with a conserved homolog, Bax, that
accelerates programmed cell death. Cell. 74:609–619. 1993.
View Article : Google Scholar : PubMed/NCBI
|
|
31
|
Riedl SJ and Salvesen GS: The apoptosome:
Signalling platform of cell death. Nat Rev Mol Cell Biol.
8:405–413. 2007. View
Article : Google Scholar : PubMed/NCBI
|
|
32
|
Fan TJ, Han LH, Cong RS and Liang J:
Caspase family proteases and apoptosis. Acta Biochim Biophys Sin
(Shanghai). 37:719–727. 2005. View Article : Google Scholar : PubMed/NCBI
|
|
33
|
Hsieh FY and Lavori PW: Sample-size
calculations for the Cox proportional hazards regression model with
nonbinary covariates. Control Clin Trials. 21:552–560. 2000.
View Article : Google Scholar : PubMed/NCBI
|
|
34
|
Gerlinger M, Santos CR, Spencer-Dene B,
Martinez P, Endesfelder D, Burrell RA, Vetter M, Jiang M, Saunders
RE, Kelly G, et al: Genome-wide RNA interference analysis of renal
carcinoma survival regulators identifies MCT4 as a Warburg effect
metabolic target. J Pathol. 227:146–156. 2012. View Article : Google Scholar : PubMed/NCBI
|