Introduction
The current situation in ovarian cancer (OC)
management remains unsatisfactory, as the overall survival has
hardly improved in the past decades (1,2).
High-grade serous ovarian carcinoma (HGSOC), the most commonly
diagnosed histological subtype, nearly always presents as advanced
disease, and therefore, is associated with low overall survival
(3). The standard treatment for
primary OC is cytoreductive surgery followed by six cycles of
adjuvant chemotherapy with carboplatin and paclitaxel. HGSOC tumors
are initially responsive to platinum-based chemotherapy; however,
the majority of patients eventually experience tumor recurrence
(4). Platinum-free interval (PFI),
the period from completion of primary chemotherapy to disease
recurrence, serves as measure to further subdivide OC patients into
the following groups based on their response to platinum:
Refractory (PFI <1 month), resistant (PFI 1–6 months),
par-sensitive (PFI 6–12 months) and sensitive (PFI >12 months)
(5). Although currently this
grouping serves as a practical guideline for secondary chemotherapy
selection, it has limitations. Multiplex categorization of
patients, incorporating the recent discoveries of molecular
genetics, is suggested for future patient stratification in
clinical trials (6).
Molecular analysis of HGSOC revealed its underlying
genomic instability, DNA repair defects and copy number alterations
(7). Furthermore, several
independent groups were classified as HGSOC based on gene and
microRNA expression patterns, with four largely overlapping
molecular subtypes: C1/mesenchymal, C2/immunoreactive,
C4/differentiated and C5/proliferative (7,8). Later
studies emphasized an active role of the stromal tumor
microenvironment in the pathogenesis of HGSOC and presented
evidence for association between molecular subtypes and survival
(9,10), in particular that the immunoreactive
subtype-bearing patients, characterized by the elevated mRNA
expression of chemokines, major histocompatibility complex class
I/II, programmed cell death 1 ligand 1 (PD-L1), and interferon
regulatory factor 7, have a better prognosis than the other
subtypes (11). These findings
emphasize the role of the immune system in OC, previously suggested
in the study by Hwang et al (12), which demonstrated that tumor
infiltrating lymphocytes (TILs) were correlated with increased
overall survival in patients with OC. Recently, an immune score for
OC was proposed, linking the compendium of immune marker genes with
response to chemotherapy and survival. The infiltration of the
majority subpopulations associated adaptive immunity [except
regulatory T cells (Tregs)] was associated with favorable prognosis
(13).
The role of the immune system in the development of
chemoresistance and recurrence of OC remains elusive. The primary
evidence for association of immune cells and chemosensitivity in OC
was recently reported from in vitro and mouse model studies,
which demonstrated the ability of T-cell surface glycoprotein CD8
(CD8)+ T cells to alter the metabolism of cytostatic
drugs in fibroblasts (14) or
negative regulation of PD-L1 on CD8+ T cells (15) to abrogate chemoresistance. However,
the dual nature of the immune system is often exploited by tumor
cells to create local immune suppression (16) and promote chemoresistance (17), as demonstrated in carcinomas of
various origins (18,19). The nature of the cross-talk between
cancer and other stromal cells is orchestrated by a cytokine and
chemokine network, which can act both locally and systemically
(20). The circulating cytokines
and chemokines reflect the tumor microenvironment (21) and, therefore, are convenient
candidates for the discovery of novel biomarkers as the basis for
rational treatment decisions.
Despite frequent recurrence and limited effective
treatment options, the selection of reliable prognostic and
predictive biomarkers in HGSOC remains limited (22). The present study aimed to evaluate
whether the levels of circulating signaling molecules can
distinguish patients that are less likely to respond to
chemotherapy. The immune profiles of HGSOC tumors were also
evaluated to select circulating chemokines that reflect the immune
infiltration.
Materials and methods
Patient cohort
A total of 40 patients with confirmed diagnosis of
HGSOC of III–IV International Federation of Gynecology and
Obstetrics stage (23) with no
prior cancer history or immune disorders were involved in this
study. All patients (age range 32–76 years) underwent primary
cytoreductive surgery and completed six cycles of adjuvant
carboplatin-based chemotherapy between April 2013 and April 2015 at
the National Cancer Institute (Vilnius, Lithuania). For each
patient, a pre-operative serum sample and surgically removed tumor
specimen was collected. Clinical data were obtained from the
patients' medical records. Patients were followed up until April
2018 to determine platinum status and recurrence. This study was
approved by the Lithuanian Bioethics Committee (approval no.
158200-06-500-147). All patients signed informed consent form.
Sample preparation
Serum was centrifuged at 2,000 × g for 10 min at
22°C, aliquoted and stored at −80°C prior to analysis. Tumor tissue
was collected during surgery. Fresh tissue was immediately divided
into four parts for enzymatic dissociation, protein extraction, RNA
extraction and a fresh-frozen backup sample. All samples were
processed on the same day. For preparing single cell suspensions,
tumor tissue was incubated in digestion solution [5 mg/ml
collagenase II, 5 mg/ml collagenase IV and 1 mg/ml DNase, all
Sigma-Aldrich (Merck KGaA, Darmstadt, Germany)] for 30 min at 37°C.
Following gentle pipetting, the solution was filtered and washed
with PBS. For red blood cell lysis, the cell pellet was treated
with 5 ml 1X BD FACS Lysing solution (BD Biosciences, San Jose, CA,
USA) for 10 min at 22°C and washed with PBS. For protein
extraction, tumor tissue was homogenized and lysed using T-PER
Tissue Protein Extraction Reagent (Thermo Fisher Scientific, Inc.,
Waltham, MA, USA), supplemented with protease/phosphatase inhibitor
cocktail (Thermo Fisher Scientific, Inc.), followed by 15 min
centrifugation at 10,000 × g at 4°C and debris removal. For RNA
extraction, tumor tissue was homogenized with TRIzol reagent from
the TRIzol Plus RNA Purification kit (Thermo Fisher Scientific,
Inc.) and RNA was purified according to the manufacturer's
protocol.
Cytokine and chemokine
measurement
Serum samples were analyzed using the Proteome
Profiler Human Cytokine Array kit (R&D Systems, Inc.,
Minneapolis, MN, USA) according to manufacturer's instructions.
Membranes with cytokine expression signal were scanned with LI-COR
C-DiGit blot scanner (LI-COR Biosciences, Lincoln, NE, USA) and
analyzed with ImageJ software (v1.50f; National Institute of
Health, Bethesda, MD, USA).
A panel of 13 chemokines [C-C motif chemokine ligand
(CCL) 2, −3, −4, −5, −11, −17 and −20; C-X-C motif chemokine ligand
(CXCL) 1, −5, −8, −9, −10 and −11) was measured in all patients
serum and tumor lysate samples using LEGENDplex Human
Proinflammatory Chemokine Panel (BioLegend, Inc., San Diego, CA,
USA), a bead-based immunoassay, according to the manufacturer's
guidelines. Samples were assayed in duplicates in 96-well plates,
collected with BD LSR II flow cytometer (BD Biosciences) and
analyzed with LEGENDplex data analysis software (V7.1; BioLegend,
Inc.).
Evaluation of gene expression by
reverse transcription-quantitative polymerase chain reaction
(RT-qPCR)
For cDNA synthesis, 500 µg RNA from each sample was
reverse transcribed using Maxima First Strand cDNA Synthesis kit
(Thermo Fisher Scientific, Inc.) according to the manufacturer's
protocol. qPCR was performed in duplicate in Eco Real-Time
thermocycler (Illumina, Inc., San Diego, CA, USA). The reaction
volume of 10 µl contained 5 µl Maxima SYBR-Green qPCR Master Mix 2X
(Thermo Fisher Scientific, Inc.), 2.5 µl 0.8 µmol/l
sequence-specific forward and reverse primers mix, 1 µl cDNA
reaction product, and 1.5 µl nuclease-free water. The reaction was
started by 5 min at 95°C and continued with 40 cycles of 10 sec
denaturing at 95°C and 30 sec of annealing/extension at 60°C.
Primer sequences are listed Table
I. The expression level of selected genes was evaluated with
EcoStudy software (Illumina, Inc.), using GAPDH and ribosomal
protein L13 as the reference genes. The analysis was performed
using ∆∆Cq relative quantitation method (24) with Pfaffl correction for PCR
efficiency (25). Relative gene
expression was z-transformed, visualized and clustered using
K-means clustering by Euclidean distance for selection of
non-inflamed (z-score negative) and inflamed patient (z-score
positive) clusters with Morpheus software (Broad Institute,
Cambridge, MA, USA).
 | Table I.Primer sequences. |
Table I.
Primer sequences.
| Gene ID | Protein alias | Forward primer
(5′-3′ sequence) | Reverse primer
(5′-3′ sequence) |
|---|
| CD163 | CD163 |
CGAGTTAACGCCAGTAAGG |
GAACATGTCACGCCAGC |
| CD274 | PD-L1 |
TATGGTGGTGCCGACTACAA |
TGGCTCCCAGAATTACCAAG |
| CD4 | CD4 |
TGCCTCAGTATGCTGGCTCT |
GAGACCTTTGCCTCCTTGTTC |
| CD68 | CD68 |
TGGGGCAGAGCTTCAGTTG |
TGGGGCAGGAGAAACTTTGC |
| CD8A | CD8 |
ACTTGTGGGGTCCTTCTCCT |
GTCTCCCGATTTGACCACAG |
| CTLA4 | CTLA-4 |
TGCAGCAGTTAGTTCGGGGTTGTT |
CTGGCTCTGTTGGGGGCATTTTC |
| CXCL10 | CXCL10 |
AAGGATGGACCACACAGAGG |
ACCCTTGGAAGATGGGAAAG |
| CXCL11 | CXCL11 |
ATGAGTGTGAAGGGCATGGC |
TCACTGCTTTTACCCCAGGG |
| EOMES | EOMES |
AGCTCTCCAAGGAGAAAGTG |
GCCTTCGCTTACAAGCACTG |
| FCGR2A | CD32 |
TTTGAGATGAGTAATCCCAGCCA |
TCAGGCCCAGTCTCCATTTTA |
| FOXP3 | FOXP3 |
GAACGCCATCCGCCACAACCTGA |
CCCTGCCCCCACCACCTCTGC |
| GAPDH | GAPDH |
AATCCCATCACCATCTTCCA |
TGGACTCCACGACGTACTCA |
| GZMB | Granzyme B |
GAAACGCTACTAACTACAGG |
CCACTCAGCTAAGAGGT |
| IDO1 | IDO |
GGCAAAGGTCATGGAGATGT |
CAGGACGTCAAAGCACTGAA |
| IFNG | IFNγ |
TGGAAAGAGGAGAGTGACAGAA |
TCTTTTGGATGCTCTGGTCAT |
| IL10 | IL-10 |
GACTTTAAGGGTTACCTGGGTTG |
TCACATGCGCCTTGATGTCTG |
| PDCD1 | PD-1 |
ACCCTGGTCATTCACTTGGG |
CATTTGCTCCCTCTGACACTG |
| PSMB9 | PSMB9 |
GCACCAACCGGGGACTTAC |
CACTCGGGAATCAGAACCCAT |
| RLP13 | RLP13 |
GAGGTATGCTGCCCCACAA |
GTGGGATGCCGTCAAACA |
| TAP1 | TAP1 |
TGCCCCGCATATTCTCCCT |
CACCTGCGTTTTCGCTCTTG |
| TAP2 | TAP2 |
TGGACGCGGCTTTACTGTG |
GCAGCCCTCTTAGCTTTAGCA |
| TIGIT | TIGIT |
TCTGCATCTATCACACCTACCC |
CCACCACGATGACTGCTGT |
Flow cytometry
Single tumor cell suspension was stained for 20 min
at 4°C with pre-titrated amounts of monoclonal mouse anti-human
antibodiesprotein tyrosine phosphatase, receptor type C (CD45)-V450
(cat. no. 560367; BD Biosciences) at 1:20 dilution and T-cell
surface glycoprotein CD3 (CD3)-allophycocyanin (cat. no. 300312;
BioLegend, Inc.) at 1:50 dilution. Cells were washed, stained with
5 µg/ml viability dye 7-aminoactinomycin D (BD Biosciences) for 5
min at 22°C, collected with BD LSR II flow cytometer (BD
Biosciences), and analyzed using BD FACSDiva software (v6.2; BD
Biosciences).
Histological assessment of tumor
tissue
Tumor tissue was fixed in 4% paraformaldehyde
(Sigma-Aldrich; Merck KGaA) for 24 h at 22°C. Tissue sections from
paraffin-embedded blocks (4 µm-thick) were stained with Mayer's
hematoxylin solution for 40 sec and 1% eosin for 30 sec (H&E;
all Sigma-Aldrich; Merck KGaA) at 22°C. Tumor type and grade were
assessed (26,27). Qualitative evaluations for the
presence of either intraepithelial or stromal T lymphocytes within
tumor tissue were conducted by the pathologist.
Statistical analysis
Data were analyzed and visualized using GraphPad
Prism 7 (GraphPad Software, Inc., La Jolla, CA, USA) statistical
software. The associations between systemic and local chemokine
expression and clinical characteristics were evaluated by the
Spearman rank correlation coefficient. Differences in chemokine
levels between patients were determined with a Mann-Whitney U test.
Differences in patient characteristics between groups were
identified by Kruskal-Wallis test. Receiver operator characteristic
(ROC) curves were created to determine the predictive performance
of the cytokines and their combinations. The area under curve
(AUC), sensitivity and specificity were calculated from ROC curves.
Performance metrics and clinical utility were calculated and
converted into qualitative grades: Excellent utility, ≥0.81; good,
≥0.64; fair, ≥0.49; and poor, <0.49, as suggested previously
(28). To combine chemokines,
logistic regression was applied. The best combination in each
setting was selected based on the AUC and sensitivity. For
combinations with equally good characteristics, a classifier with
the least number of elements was chosen. The Kaplan-Meier survival
curves and hazard ratios were analyzed with a log-rank test. Cohort
clinicopathological features were compared with the χ2
test. P<0.05 was considered to indicate a statistically
significant difference. Given the exploratory nature of this study,
P-values were not adjusted for multiple testing.
Results
Patient characteristics
All patients involved in this study (n=40) were
diagnosed with stage III (90%) or IV (10%) HGSOC. Following the
complete resection of tumor foci, all patients completed six cycles
of adjuvant chemotherapy with carboplatin and paclitaxel. The
median follow up time was 46 months. The patients were regularly
tested for the blood CA125 level. Recurrence was confirmed by
radiological imaging. Recurrence of primary disease occurred in 73%
of patients (n=29) during the follow-up period, with median
recurrence-free survival (RFS) of 11.1 months. Recurrent patients
were classified as platinum-resistant (PFI <6 months),
par-sensitive (PFI 6–12 months) or sensitive (recurrent PFI >12
months or non-recurrent) based on the duration of PFI. An overview
of patient clinical characteristics is presented in Table II.
| Table II.Overview of patient characteristics
(n=40). |
Table II.
Overview of patient characteristics
(n=40).
| Feature | Pt-resistant (PFI
<6 months) | Pt-par-sensitive
(PFI 6–12 months) | Pt-sensitive
(recurrent PFI >12 months) | Pt-sensitive
(non-recurrent) | P-value |
|---|
| N | 15 | 7 | 7 | 11 |
|
| Age |
|
|
|
| 0.335 |
| Median
(years) | 62 | 69 | 60 | 67 |
|
|
Range | 53-76 | 53-75 | 32-72 | 32-74 |
|
| Stage |
|
|
|
| 0.639 |
|
III | 13 (87%) | 6 (86%) | 6 (86%) | 11 (100%) |
|
| IV | 2 (13%) | 1 (14%) | 1 (14%) | 0 (0%) |
|
| RFS (median
months) | 4.1 | 9.7 | 21.0 | NR | <0.0001 |
| OS (median
months) | 27.5 | 21.0 | NR | NR | 0.0024 |
Inflammatory serum protein profiling
reveals differential chemokine expression among HGSOC patients
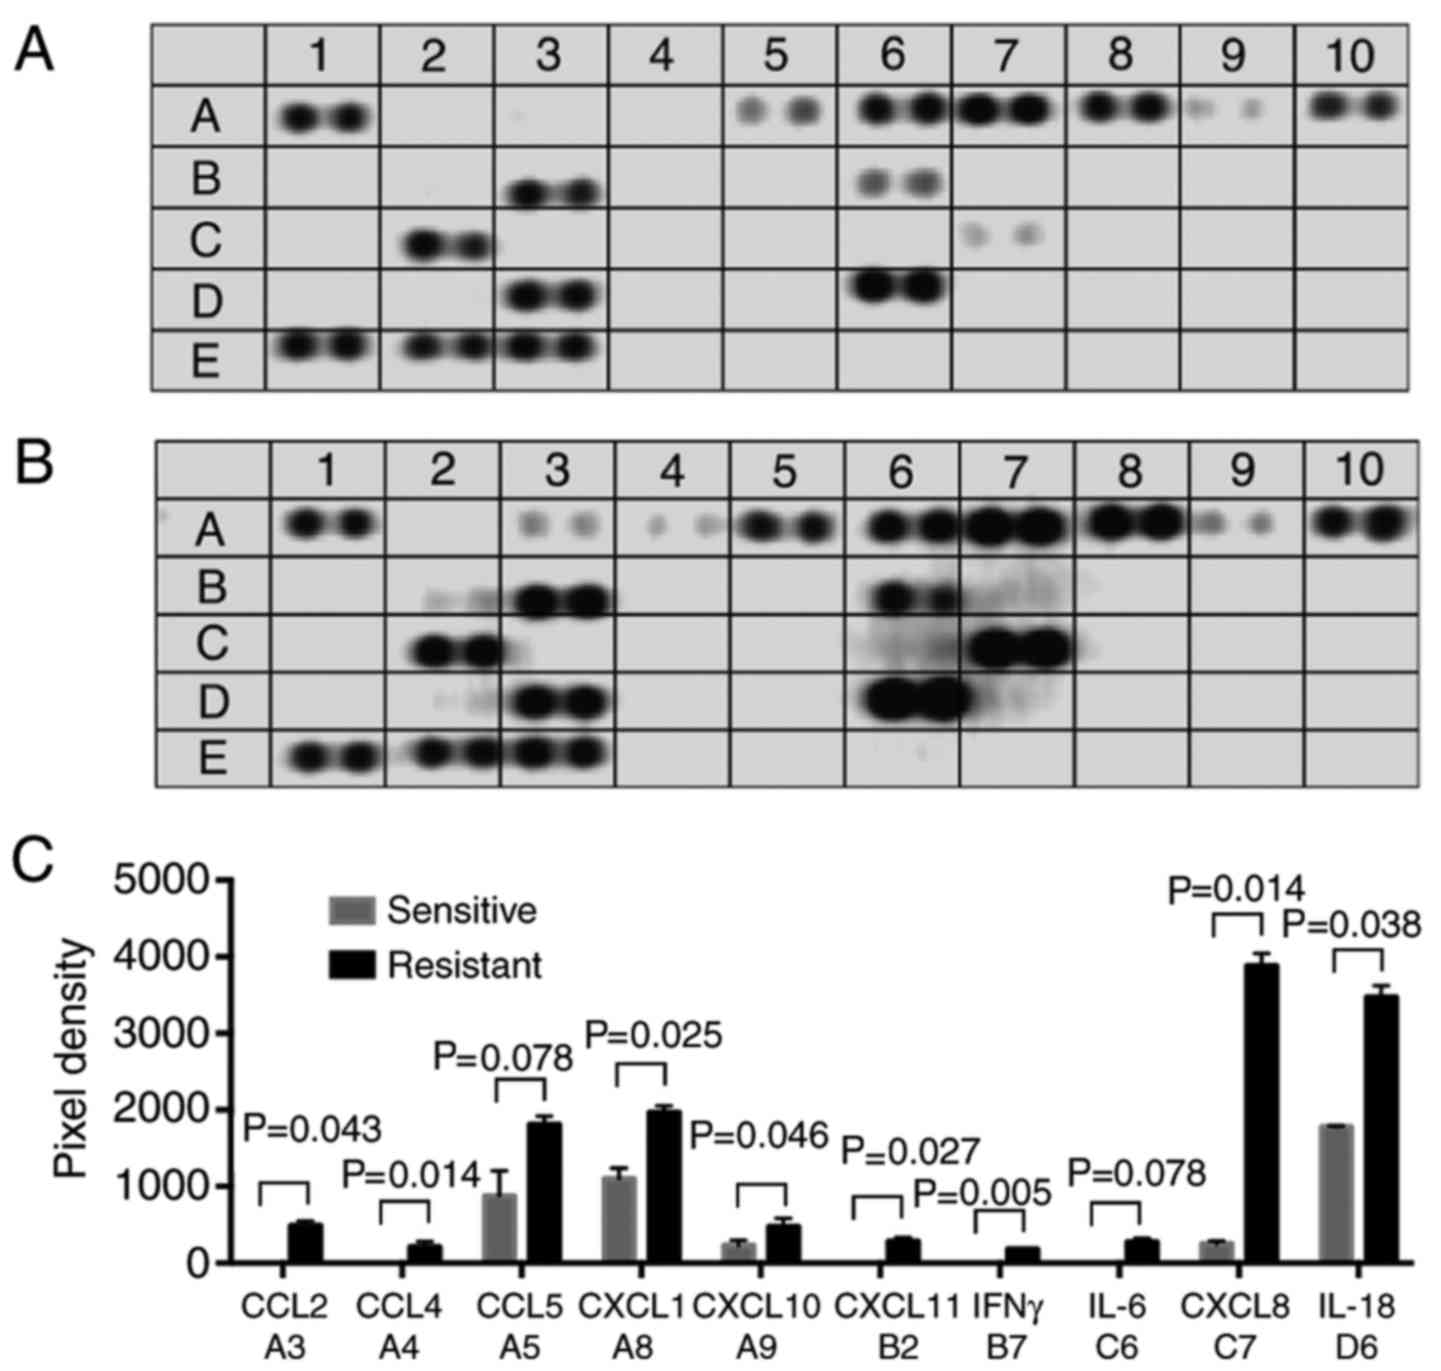
It was hypothesized that profiling of multiple
inflammatory markers could help unveil the role of inflammation in
ovarian cancer progression. The relative level of 36 different
cytokines, chemokines and acute phase proteins was analyzed in the
serum of platinum-resistant (Fig.
1A) and non-recurrent platinum-sensitive patients (Fig. 1B; n=4 for each group). Out of 18
proteins detected, 10 proteins were to be more abundant in sera of
platinum-resistant patients compared with platinum-sensitive
patients (Fig. 1C). The majority of
the proteins were members of the CC and CXC chemokine families.
Therefore, the panel of interest was expanded and
the concentration of thirteen selected CC and CXC family chemokines
was quantified (CCL2, −3, −4, −5, −11, −17 and −20, CXCL1, −5, −8,
−9, −10 and −11) in patient serum samples. To examine how the serum
chemokine levels reflect the tumor microenvironment and disease
course, the correlation with intratumoral chemokine expression,
immune cell infiltration, RFS and overall survival (OS) were
assessed (Table III). Although
all serum chemokines were positively associated with gene and
protein expression in tumors, their correlation coefficients varied
in magnitude. Among serum chemokines, CXCL9 and CXCL10 levels were
positively correlated with the intratumoral infiltration of
CD45+ cells (total leukocytes) and
CD45+/CD3+ cells (total TILs), as measured by
flow cytometry. These two chemokines, along with CCL3 and CCL20,
were significantly negatively associated with RFS. Serum chemokines
did not have any significant correlations with OS.
| Table III.Correlations between circulating
preoperative serum chemokine concentrations and their gene and
protein expression level in tumor, tumor infiltration with immune
cells and patient survival. |
Table III.
Correlations between circulating
preoperative serum chemokine concentrations and their gene and
protein expression level in tumor, tumor infiltration with immune
cells and patient survival.
| Serum
chemokine | Relative gene
expression of respective chemokine in tumor | Respective
chemokine concentration in tumor lysate | Total immune tumor
infiltration (CD45) | Immune infiltration
with T lymphocytes (CD45+/CD3+) | RFS | OS |
|---|
| CCL2 | 0.206 | 0.196 | 0.302 | 0.327 | −0.220 | −0.115 |
| CCL3 | 0.658 | 0.202 | 0.200 | 0.214 | −0.384 | 0.118 |
| CCL4 | 0.175 | 0.245 | 0.095 | 0.234 | −0.210 | −0.162 |
| CCL5 | 0.194 | 0.175 | −0.096 | −0.077 | −0.120 | −0.115 |
| CCL11 | 0.235 | 0.153 | 0.309 | 0.120 | −0.256 | 0.027 |
| CCL17 | 0.246 | 0.261 | −0.034 | −0.121 | 0.024 | 0.060 |
| CCL20 | 0.596 | 0.391 | 0.029 | 0.008 | −0.320 | −0.154 |
| CXCL1 | 0.390 | 0.410 | 0.118 | 0.017 | −0.106 | −0.022 |
| CXCL5 | 0.296 | 0.234 | −0.002 | −0.048 | −0.170 | −0.264 |
| CXCL8 | 0.196 | 0.105 | 0.151 | 0.051 | −0.129 | 0.096 |
| CXCL9 | 0.423 | 0.257 | 0.378 | 0.458 | −0.455 | −0.295 |
| CXCL10 | 0.607 | 0.511 | 0.475 | 0.393 | −0.379 | 0.067 |
| CXCL11 | 0.335 | 0.119 | 0.179 | 0.238 | −0.194 | −0.172 |
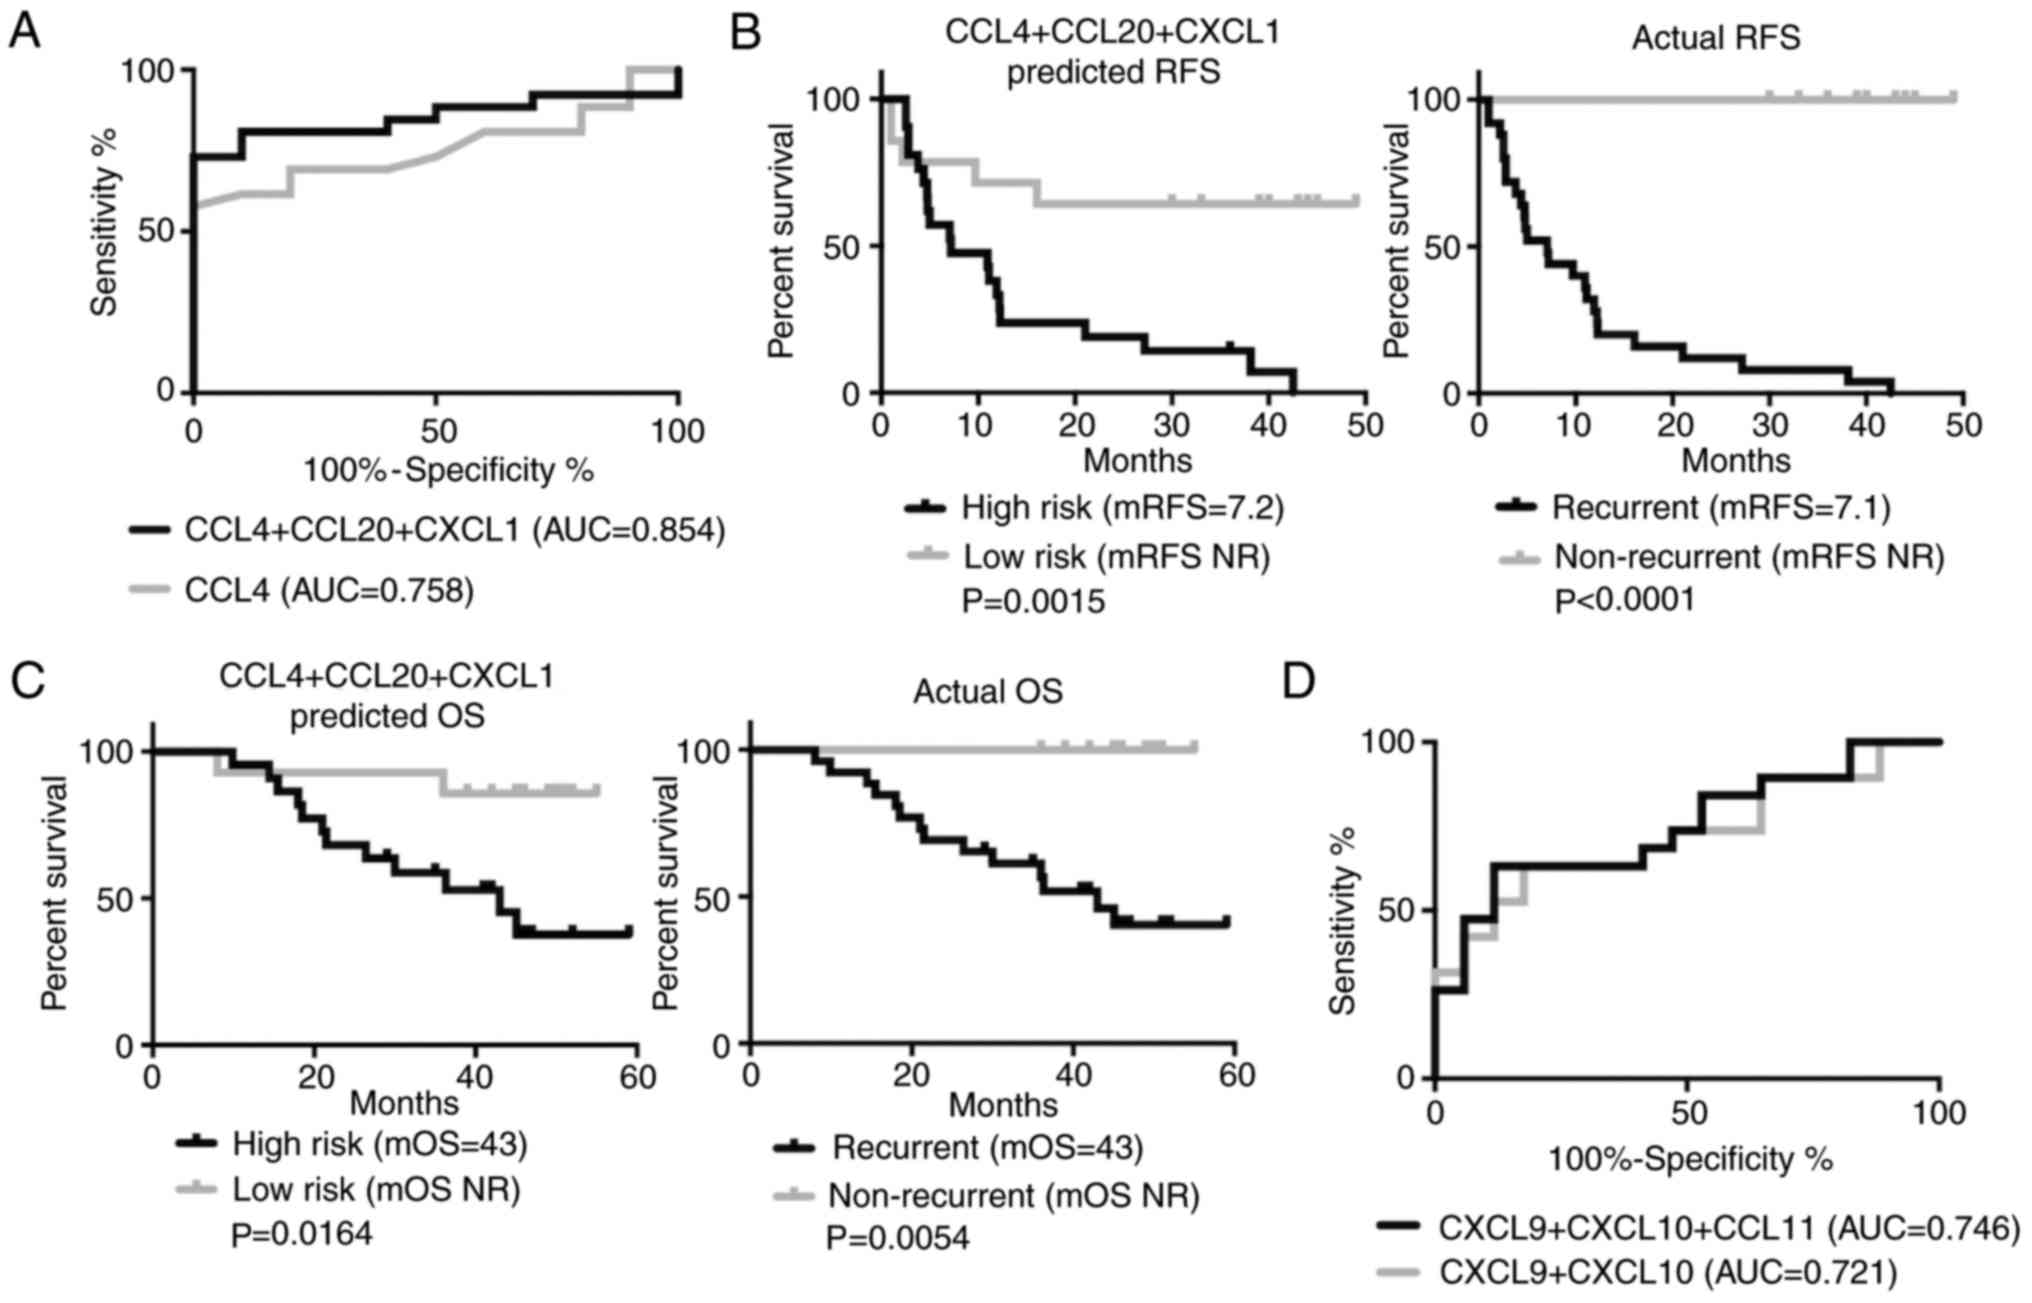
Combination of circulating CCL4 +
CXCL1 + CCL20 predicts recurrence-prone tumors
Due to the association of preoperative circulating
chemokine levels with RFS, the patients were subsequently grouped
based on their recurrence status and the serum chemokine expression
patterns were analyzed. Significantly higher levels of CCL3, CCL4,
CCL20 and CXCL1 were present in recurrent patient serum compared
with non-recurrent patients (Table
IV). To evaluate the predictive value of each chemokine, ROC
curve analysis was performed to calculate the cut-off, area under
curve (AUC) and sensitivity at clinically relevant specificity.
Among single chemokines, CCL4 had the best sensitivity (62%) and
fair positive clinical utility (CUI) at a cut-off of 20 pg/ml.
Subsequently, the performance of single chemokines was compared
with their multiple combinations in order to select the best
biomarkers that may potentially identify the patients in a higher
recurrence risk group. All possible double, triple and quadruple
combinations were assessed, and then the combination with the
highest AUC and least number of elements was selected. In the
recurrent cancer setting, combining CCL4, CXCL1 and CCL20 into a
single classifier resulted in 81% sensitivity. The combination of
CCL4 + CXCL1 + CCL20 also had good positive and fair negative
clinical utility. ROC curves for CCL4 and CCL4 + CXCL1 + CCL20
classifier highlight the advantage of the chemokine combination
(Fig. 2A). The combination of CCL4
+ CXCL1 + CCL20 could also predict RFS and OS (Fig. 2B and C). The individuals with
elevated serum levels of these three markers had greater chances of
disease recurrence (HR=4.08) and worse survival prognosis
(HR=5.10).
 | Figure 2.Performance and prognostic impact of
CCL4 + CCL20 + CXCL1 (upper panels) and CXCL9 + CXCL10 + CCL11
(lower panels). (A) ROC curves of CXCL4 + CCL20 + CXCL1 and CCL4
alone in detecting recurrence-prone patients. (B) RFS and (C) OS
estimates for patients with high risk or low risk of recurrence as
predicted with CCL4 + CCL20 + CXCL1, compared to actual survival in
recurrent vs. non-recurrent patients. (D) ROC curves of CXCL9 +
CXCL10 and CXCL9 + CXCL10+CCL11 in detecting patients with
PFI<12 months. (E) RFS and (F) OS survival estimates for
patients with high risk or low risk of early (<12 months)
recurrence as predicted with CXCL9 + CXCL10 + CCL11, compared to
actual survival in patients with PFI<12 months vs. PFI>12
months. mRFS and mOS were calculated from Kaplan Meier survival
curves. Survival curves were compared with log-rank test. ROC,
receiver operating characteristic; CCL, C-C motif chemokine ligand;
CXCL, C-X-C motif chemokine ligand; AUC, area under curve; RFS,
recurrence-free survival; mRFS, median RFS; NR, not reached; OS,
overall survival; mOS, median OS; PFI, platinum-free interval. |
| Table IV.Overview of circulating chemokine
levels, performance metrics and prognostic impact in recurrent vs.
non-recurrent and PFI <12 months vs. PFI >12 months. |
Table IV.
Overview of circulating chemokine
levels, performance metrics and prognostic impact in recurrent vs.
non-recurrent and PFI <12 months vs. PFI >12 months.
| A, Recurrent vs.
non-recurrent |
|---|
|
|---|
|
|
|
|
|
|
|
|
|
|
| RFS | OS |
|---|
|
|
|
|
|
|
|
|
|
|
|
|
|
|---|
| Chemokine | Recurrent (n=29)
[mean (range) pg/ml] | Non-recurrent
(n=11) [mean (range) pg/ml] | P-value | AUC | Cut-off
(pg/ml) | SE (%) | SP (%) | CUI + | CUI - | HR | P-value | HR | P-value |
|---|
| CCL20 | 46 (3–357) | 12 (3–61) | 0.006 | 0.794 | 32 | 31 | 91 | 0.267 | 0.303 | 1.486 | 0.363 | 2.855 | 0.041 |
| CXCL1 | 2,058
(118–7,542) | 1,105
(46–3632) | 0.015 | 0.762 | 2,028 | 42 | 91 | 0.388 | 0.339 | 1.549 | 0.267 | 1.854 | 0.350 |
| CCL3 | 9.0 (3–31) | 3.8 (2–6) | 0.007 | 0.787 | 5 | 54 | 91 | 0.501 | 0.387 | 2.740 | 0.007 | 2.567 | 0.064 |
| CCL4 | 28 (8–126) | 14 (7–20) | 0.016 | 0.758 | 20 | 62 | 91 | 0.582 | 0.422 | 3.162 | 0.002 | 2.594 | 0.072 |
| CCL4 + CCL20 + | – | – | – | 0.854 | – | 81 | 91 | 0.763 | 0.583 | 4.077 | 0.002 | 5.100 | 0.016 |
| CXCL1 |
|
| B, PFI <12
months vs. PFI >12 months |
|
|
|
|
|
|
|
|
|
|
|
| RFS | OS |
|
|
|
|
|
|
|
|
|
|
|
|
|
|
Chemokine | PFI <12
months (n=22) [mean (range) pg/ml] | PFI >12
months (n=18) [mean (range) pg/ml] | P-value | AUC | Cut-off
(pg/ml) | SE (%) | SP (%) | CUI + | CUI - | HR | P-value | HR | P-value |
|
| CCL2 | 1,710
(374–3,744) | 1,015
(193–3,021) | 0.023 | 0.701 | 2,409 | 26 | 94 | 0.222 | 0.501 | 1.656 | 0.303 | 1.501 | 0.591 |
| CXCL9 | 178 (10–953) | 66 (10–287) | 0.039 | 0.699 | 179 | 26 | 94 | 0.222 | 0.521 | 2.811 | 0.027 | 1.762 | 0.375 |
| CXCL10 | 1,495
(363–4,988) | 869
(124–2,684) | 0.034 | 0.707 | 1,916 | 33 | 94 | 0.288 | 0.547 | 1.813 | 0.224 | 1.519 | 0.575 |
| CCL11 | 224 (50–651) | 159 (38–415) | 0.036 | 0.704 | 221 | 40 | 94 | 0.363 | 0.547 | 3.010 | 0.003 | 1.681 | 0.330 |
| CXCL9 + CXCL10 | – | – | – | 0.721 | – | 44 | 94 | 0.401 | 0.582 | 2.588 | 0.024 | 1.473 | 0.517 |
| CXCL9 + CXCL10
+ | – | – | – | 0.746 | – | 50 | 94 | 0.445 | 0.600 | 3.051 | 0.002 | 1.824 | 0.273 |
| CCL11 |
Subsequently, it was sought to determine whether
preoperative circulating chemokine levels were able to predict the
PFI. There was no difference in serum chemokine concentrations in
patients with PFI <6 months compared with PFI >6 months.
However, CCL2, CXCL9, CXCL10 and CCL11 concentrations were higher
in the serum of patients with PFI <12 months compared with PFI
>12 months (Table IV). The
sensitivity of single markers at 94% specificity varied between 26
and 40%, resulting in the unsatisfactory clinical utility of these
markers. Combining CXCL9 + CXCL10 or CXCL9 + CXCL10 + CCL11
resulted in increased sensitivity (44 and 50%, respectively).
However, the AUC values of either single chemokines or their
combinations did not surpass 0.750 (Fig. 2D). Nevertheless, patients with
higher preoperative levels of CXCL9 + CXCL10 + CCL11 were more
likely experience recurrence within 12 months (HR=3.05; Fig. 2E). No significant association with
OS was observed (Fig. 2F).
Immune-infiltrated tumors express more
intratumoral chemokines
The patient cohort was divided into inflamed and
non-inflamed tumor groups, based on three parameters: TILs in tumor
sections, immune response-related gene expression in tumor tissue
and CD3+ positive cell count in the tumor (Fig. 3). H&E-stained tumor tissue
sections were evaluated by a pathologist for the presence or
absence of both intraepithelial and stromal TILs (Fig. 3A), resulting in 21 TIL-positive and
19 TIL-negative samples. Immune response-associated gene expression
was measured with RT-qPCR, and clustered into high-expression (18
samples) and low expression (22 samples) clusters (Fig. 3B). The percentage of CD3+
cells in tumors was evaluated with flow cytometry analysis of
freshly digested tumor tissue samples. Gating for live cells and
CD45+ was applied. A cut-off of 3% CD3+ cells
was applied to divide the study population into 18 samples with
high and 22 samples with low immune infiltration in the tumor
(Fig. 3C).
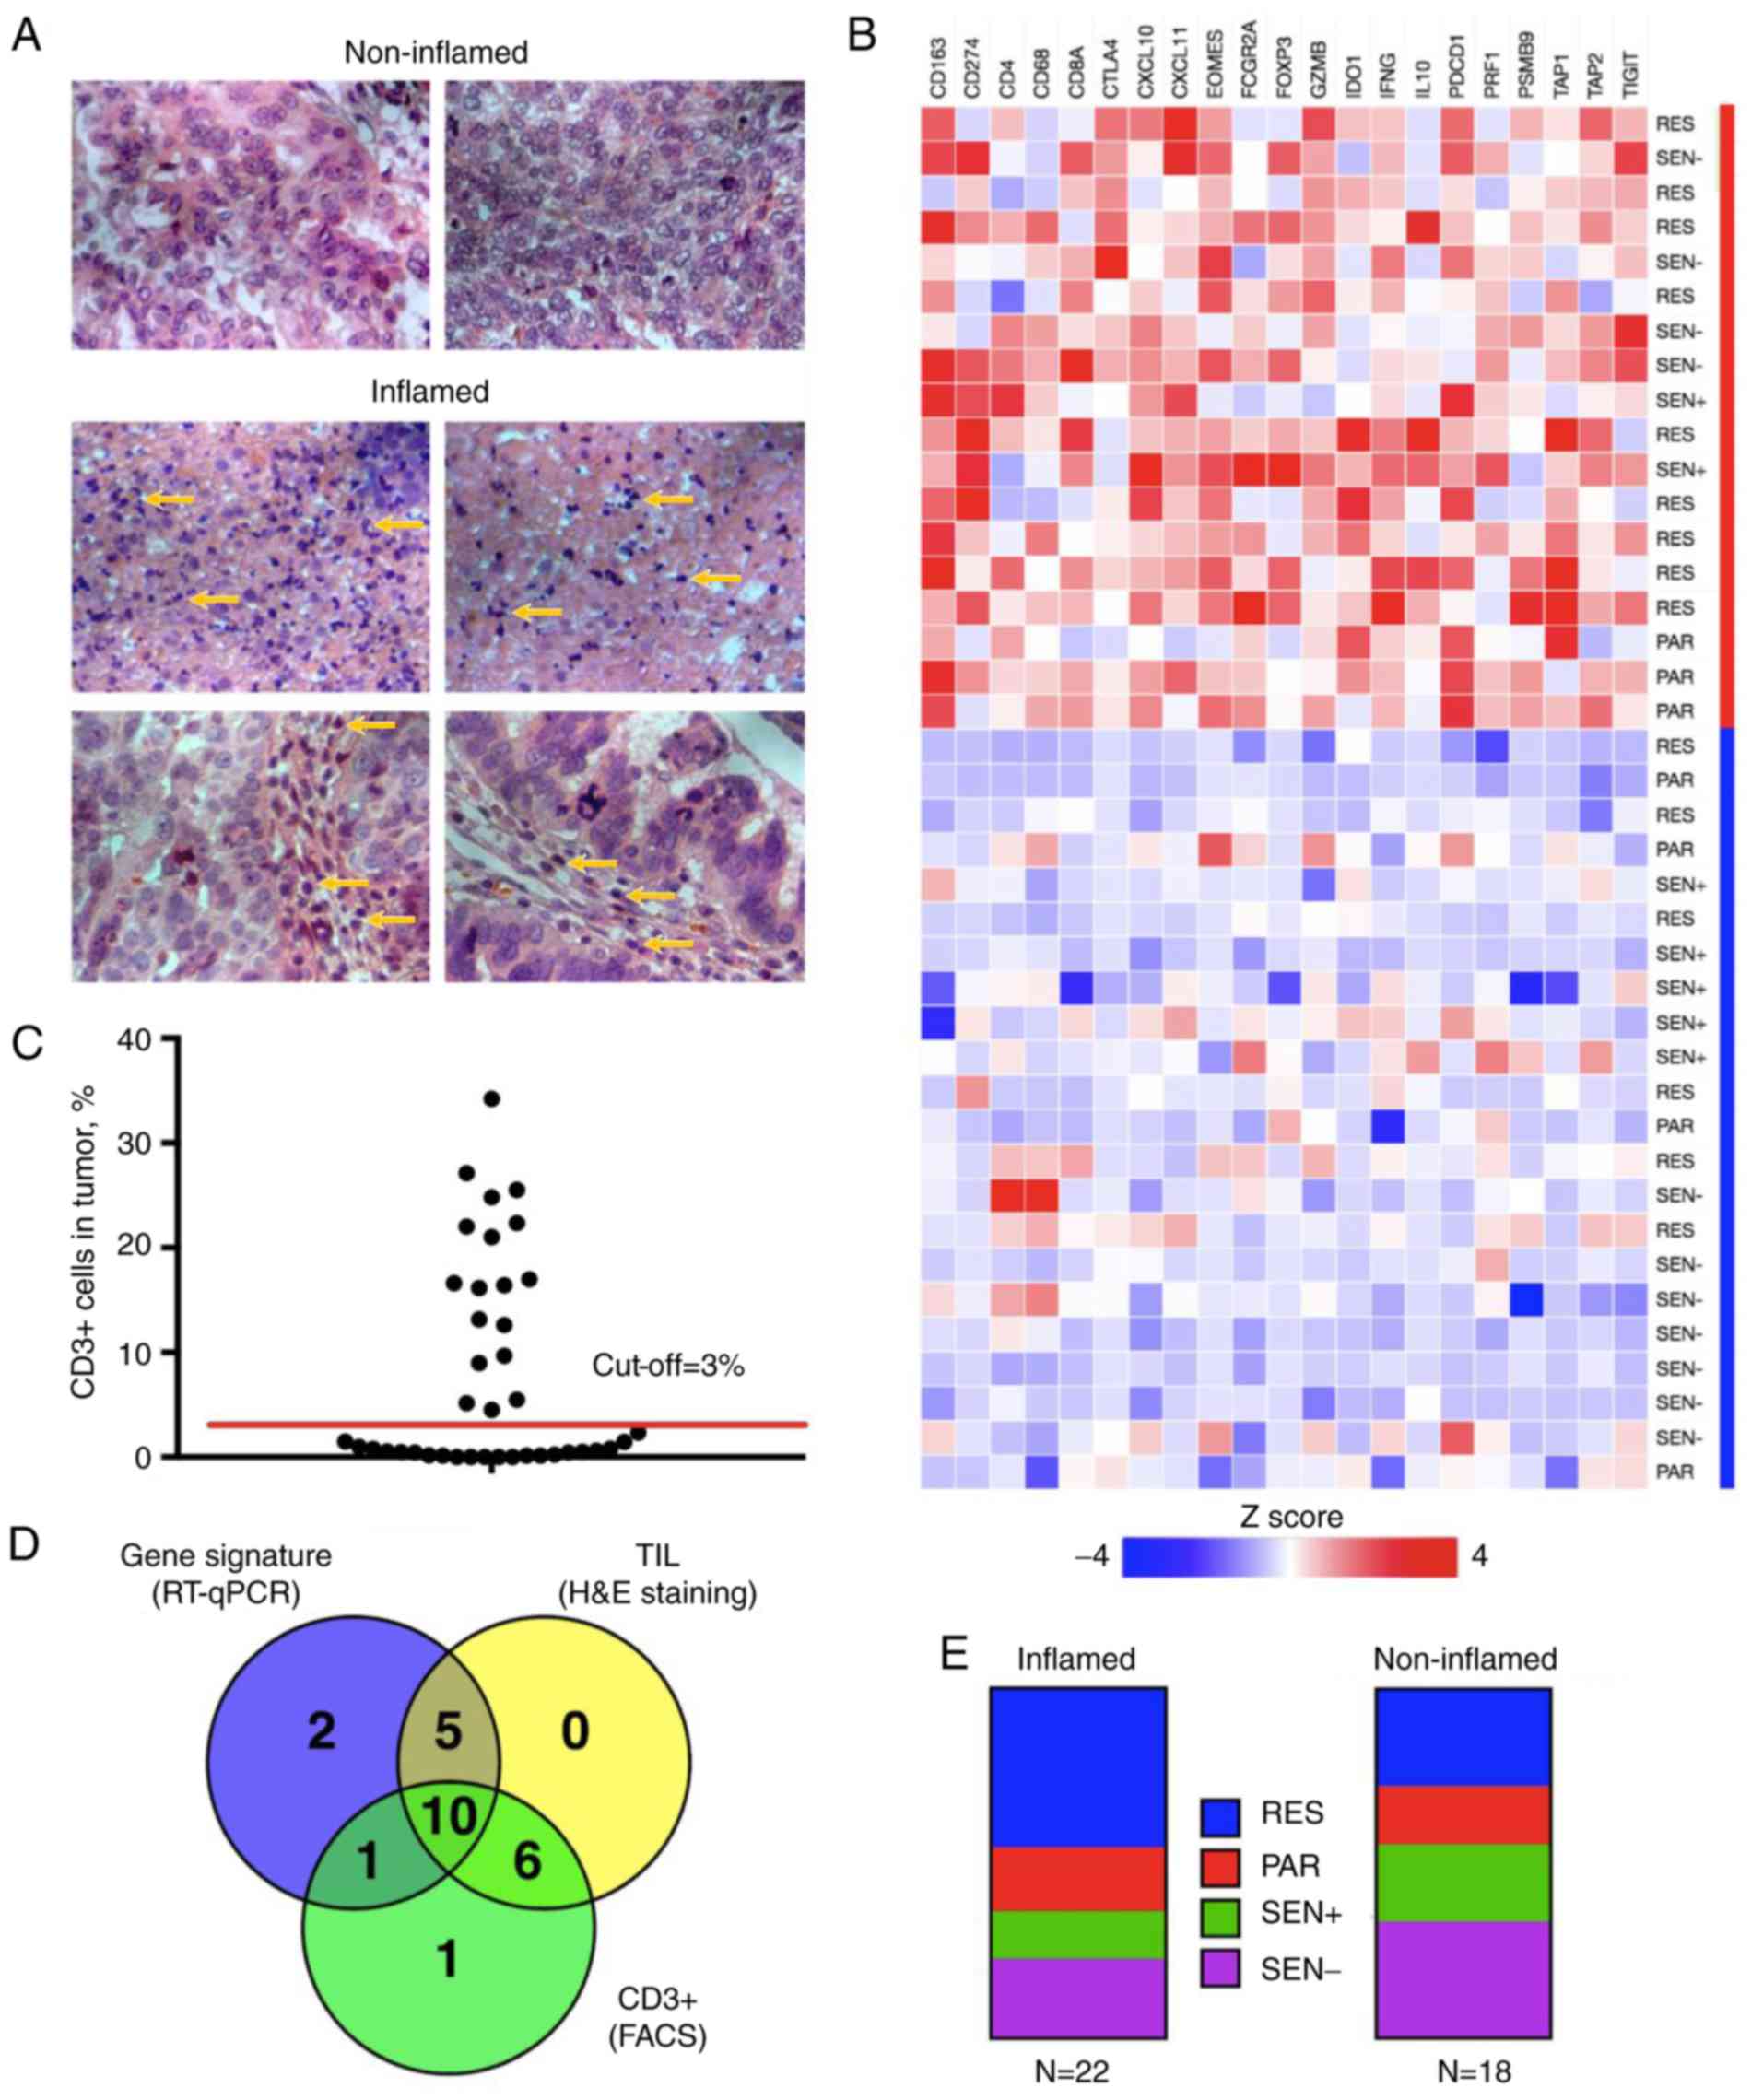 | Figure 3.Selection of inflamed tumors.
Patients were grouped based on three independent evaluations. (A)
Tumors were classified as inflamed if intraepithelial or stromal T
lymphocytes (indicated by arrows) were detected in H&E-stained
tissues. (B) Z-transformed tumoral mRNA expression levels of immune
response-associated genes, as measured with RT-qPCR, served as a
basis for unsupervised clustering of patients into non-inflamed (z
score below 0) and inflamed (z score above 0) groups (C) Level of
CD3+ cells in tumor samples was evaluated using flow
cytometry and a cut-off of 3% was applied to distinguish
immune-infiltrated tumors. (D) Patients were assigned to the
inflamed group if positive for at least two factors. (E) Inflamed
and non-inflamed groups had a different proportional distribution
of patients, based on their platinum sensitivity and recurrence
status. CD3, T-cell surface glycoprotein CD3; RT-qPCR, reverse
transcription-quantitative polymerase chain reaction; TIL, tumor
infiltrating lymphocyte; H&E, hematoxylin and eosin; RES,
platinum-resistant; PAR, partially platinum-sensitive; SEN+,
recurrent platinum-sensitive; SEN, non-recurrent
platinum-sensitive. |
The distribution and overlap of samples, identified
as TIL-positive, >3% CD3+ or high expression of
immune-associated genes, is presented as a Venn diagram in Fig. 3D. Patients were assigned to the
inflamed group if they were positive for at least two factors. Out
of 25 samples, characterized by at least one positive
inflammation-related factor, only 12% did not overlap with other
factors, and thus were assigned to the non-inflamed group, together
with the rest of the samples, which did not qualify for the
inflamed group. Finally, 22 patients were allocated to the inflamed
and 18 in the non-inflamed group. The proportional distribution of
patients based on their platinum-resistance level and recurrence is
presented in Fig. 3E.
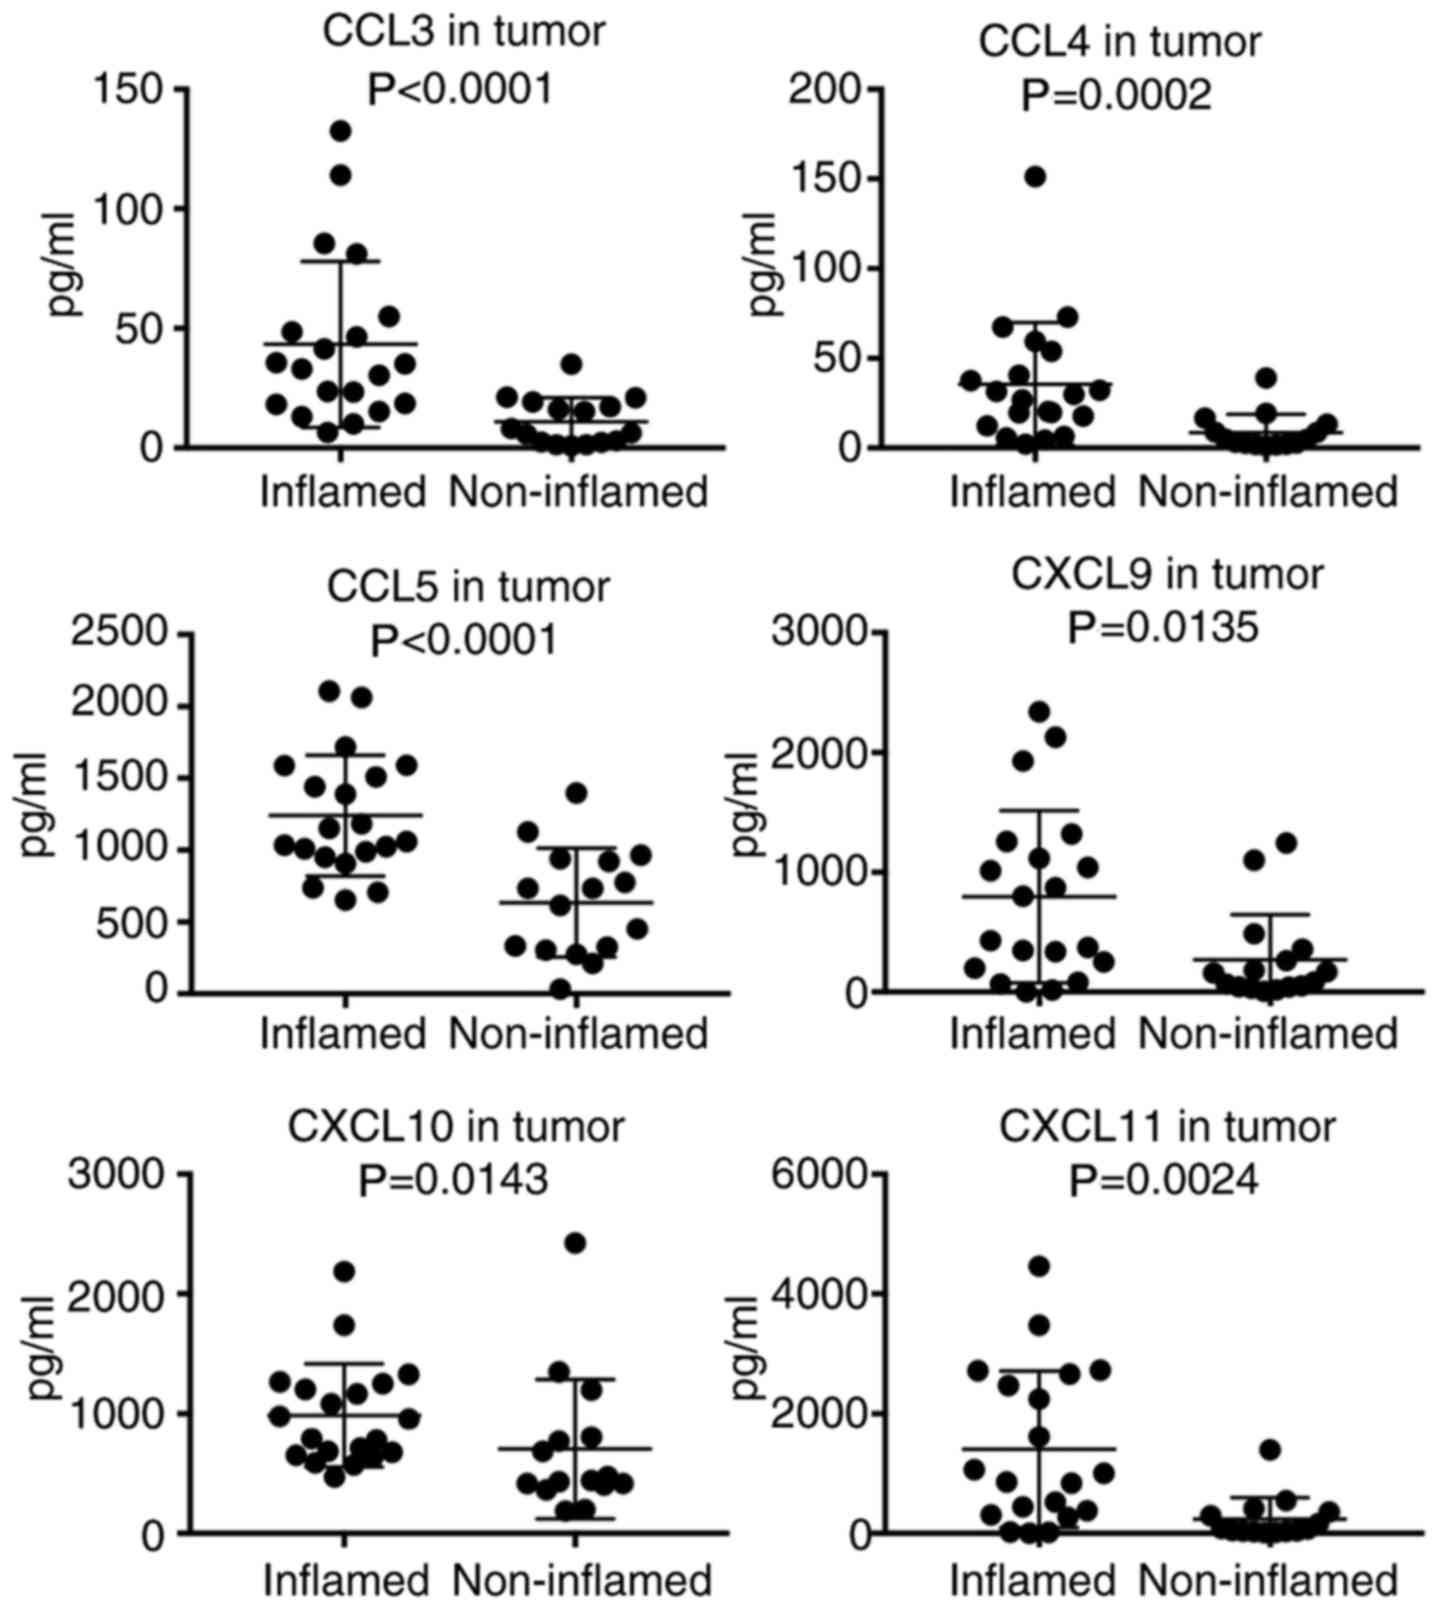
This classification allowed identification of other
significant differences between the groups, including the increased
level of CCL3, CCL4, CCL5, CXCL9, CXCL10 and CXCL11 (Fig. 4) in tumors from the inflamed group
compared with the non-inflamed group.
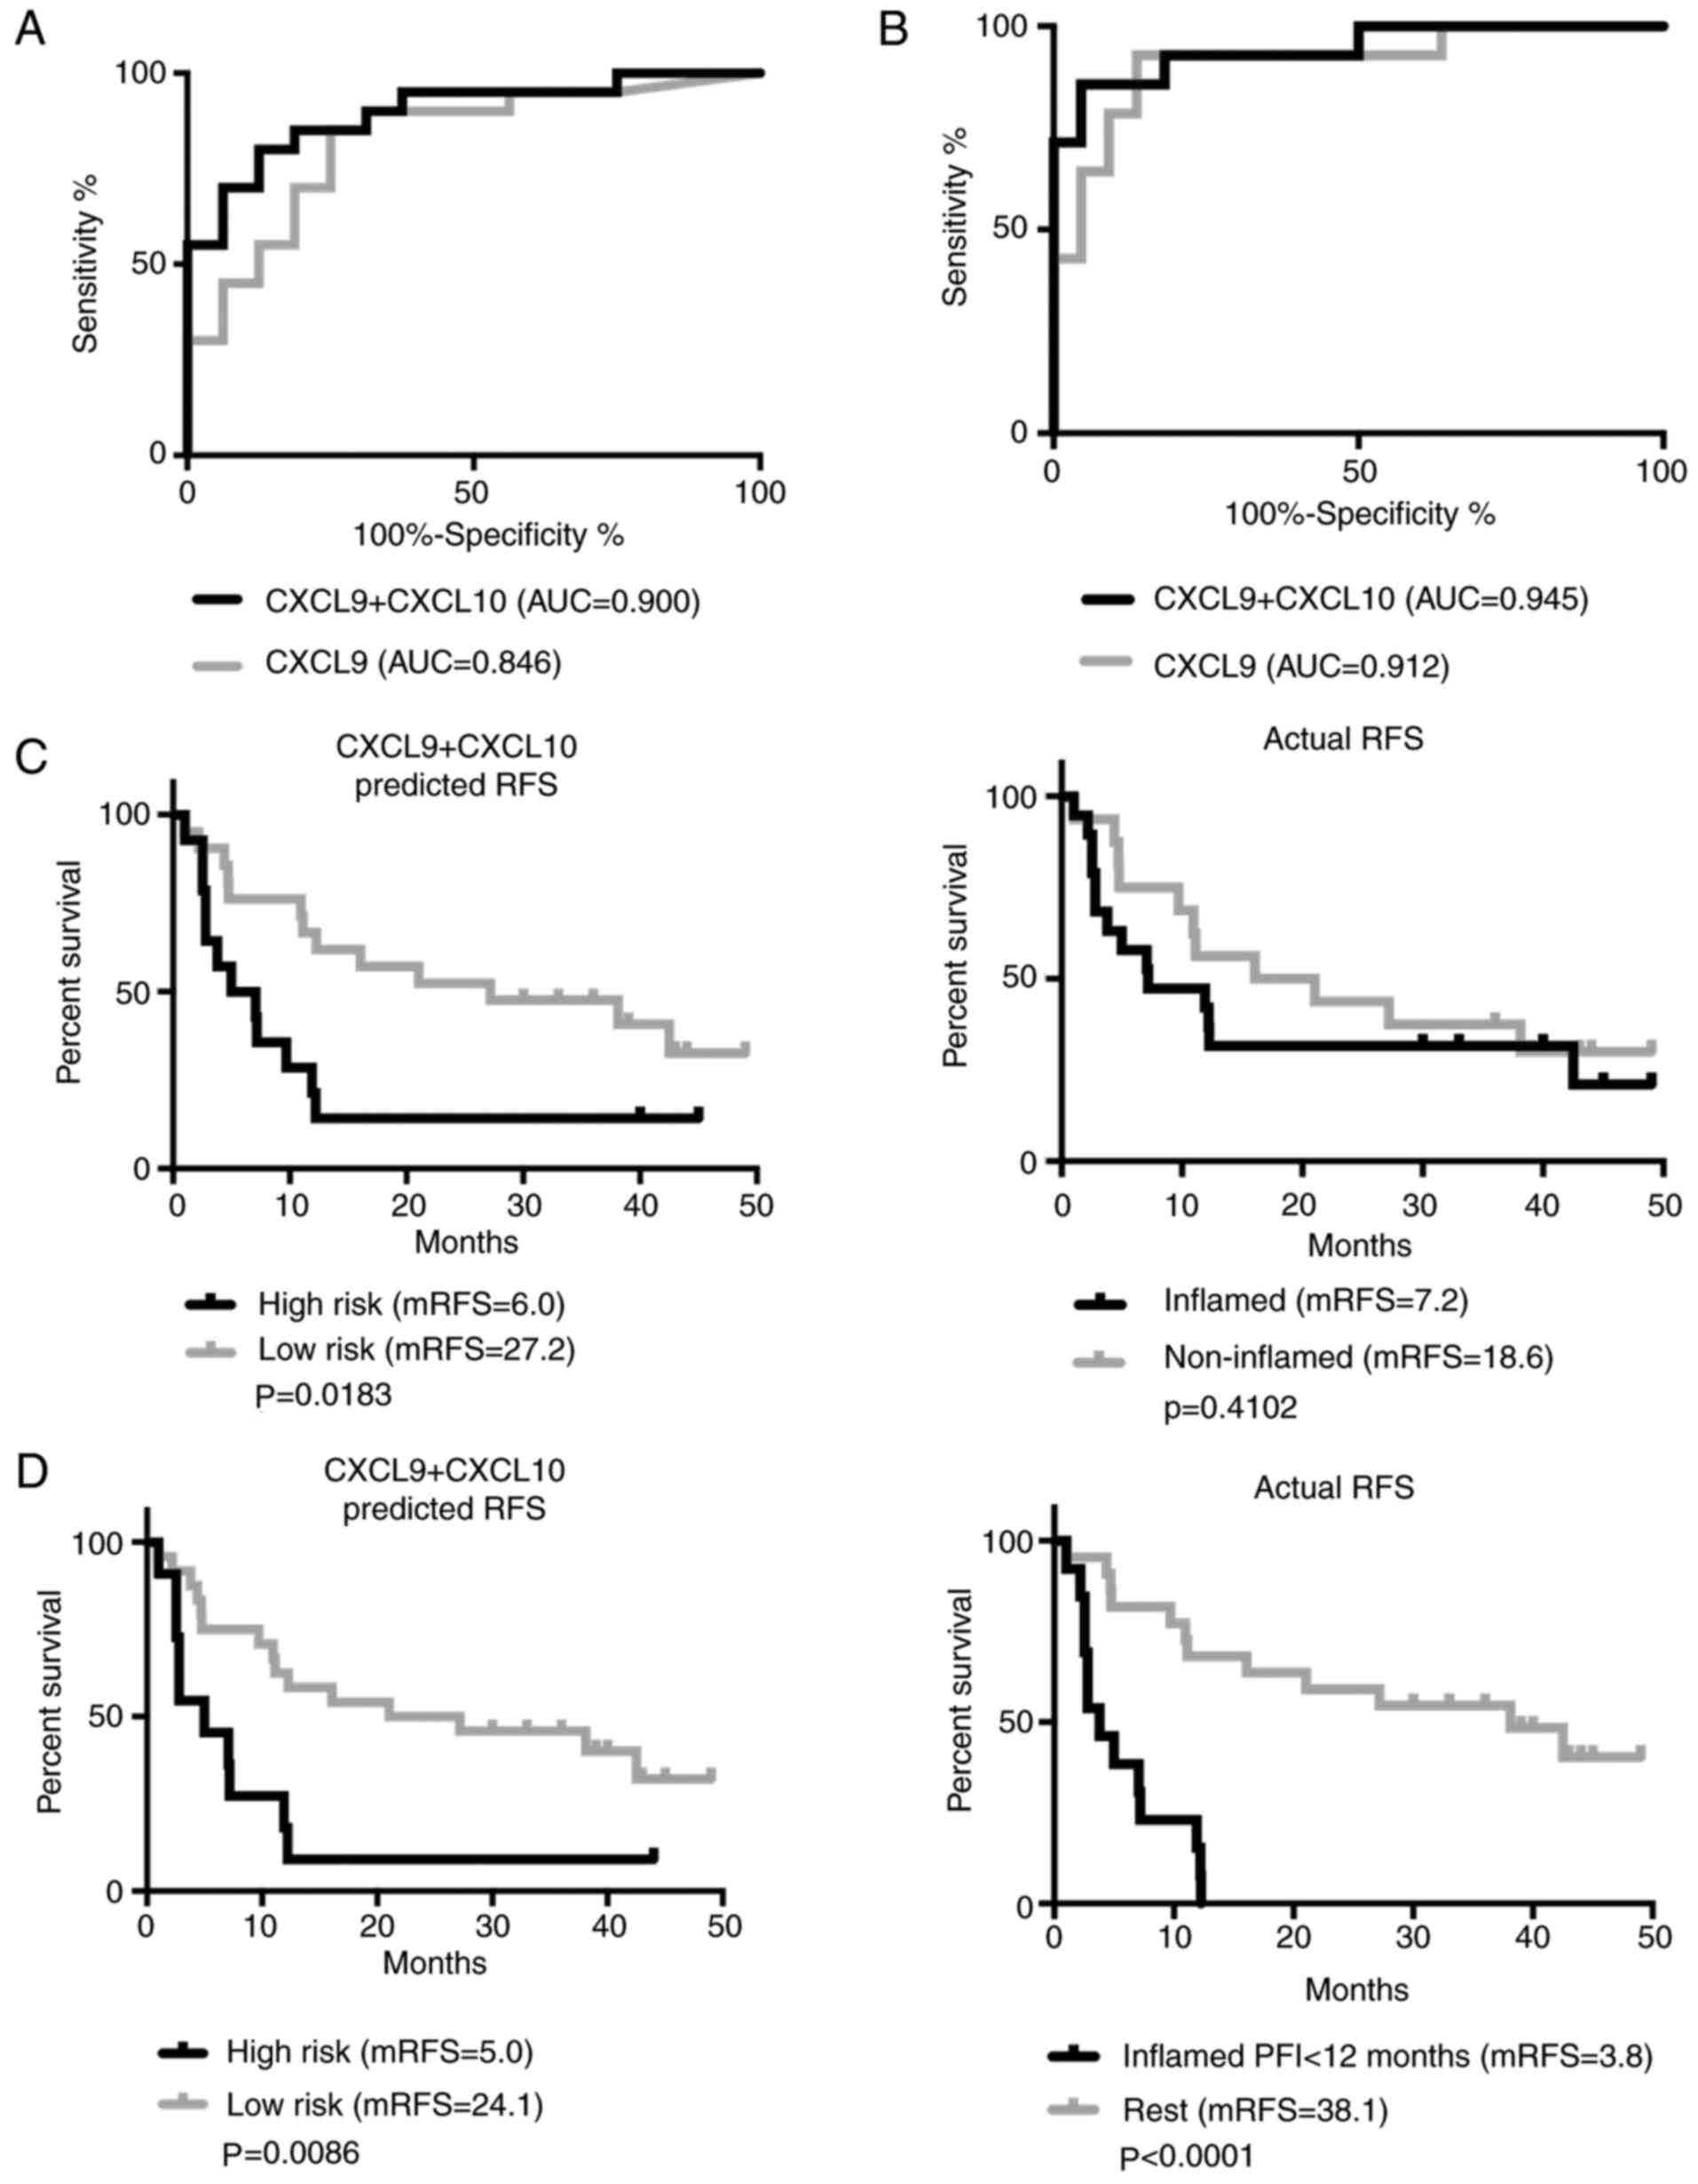
Combination of circulating CXCL9 +
CXCL10 detects inflamed tumors
Following grouping of the patients based on their
tumor inflammation level, differences in serum level of CXCL11,
CCL2, CXCL10 and CXCL9 were observed. The levels of these
chemokines were significantly higher in the serum of patients in
the inflamed group compared with the non-inflamed group (Table V). At 94% specificity, the
sensitivity of single chemokines varied between 30 and 45%. Taken
alone, these cytokines exhibited poor positive and fair negative
clinical utility, despite good AUC values (>0.8). Following
screening of all possible multiple chemokine combinations, the
CXCL9 + CXCL10 classifier performed best, with 70% sensitivity and
94% specificity it resulted in good positive and good negative
clinical utility for discrimination of patients with inflamed
tumors. CXCL9 + CXCL10 had improved AUC (0.900) compared with CXCL9
alone (0.846; Fig. 5A). Although
the actual RFS curves of patients identified as inflamed or
non-inflamed did not differ significantly (p=0.4102), patients with
elevated serum levels of CXCL9 + CXCL10 had worse RFS (HR=2.44;
Fig. 5B).
| Table V.Overview of circulating chemokine
levels, performance metrics, and prognostic impact in inflamed vs.
non-inflamed, and inflamed PFI <12 months vs. other
patients. |
Table V.
Overview of circulating chemokine
levels, performance metrics, and prognostic impact in inflamed vs.
non-inflamed, and inflamed PFI <12 months vs. other
patients.
| A, Inflamed vs.
non-inflamed |
|---|
|
|---|
|
| Inflamed (n=22)
[mean (range) pg/ml] | Non-inflamed (n=18)
[mean (range) pg/ml] | P-value | AUC | Cut-off
(pg/ml) | SE (%) | SP (%) | CUI + | CUI - | HR RFS | P-value |
|---|
| CXCL11 | 870
(120–5,740) | 406 (36–1,457) | 0.033 | 0.709 | 983 | 30 | 94 | 0.263 | 0.486 | 2.234 | 0.0581 |
| CCL2 | 1,796
(649–3,744) | 864
(193–2,269) | 0.001 | 0.825 | 2,134 | 30 | 94 | 0.263 | 0.486 | 1.660 | 0.3032 |
| CXCL10 | 1,625
(217–4,988) | 667
(124–2,187) | <0.001 | 0.841 | 1,410 | 40 | 94 | 0.355 | 0.521 | 0.949 | 0.9117 |
| CXCL9 | 190 (10–953) | 44 (10–174) | 0.001 | 0.846 | 147 | 45 | 94 | 0.411 | 0.544 | 2.369 | 0.0347 |
| CXCL9 + CXCL10 | – | – | – | 0.900 | – | 70 | 94 | 0.751 | 0.736 | 2.444 | 0.0183 |
|
| B, Inflamed
PFI<12 months vs. other |
|
|
| Inflamed
PFI<12 (n=14) [mean (range) pg/ml] | Other (n=26)
[mean (range) pg/ml] | P-value | AUC | Cut-off
(pg/ml) | SE (%) | SP (%) | CUI + | CUI - | HR RFS | P-value |
|
| CXCL10 | 1,706
(530–4,988) | 877
(124–2,648) | 0.012 | 0.750 | 2,194 | 29 | 96 | 0.227 | 0.653 | 1.386 | 0.589 |
| CXCL5 | 4,527
(1208–8,904) | 3,066
(1,016–10,591) | 0.016 | 0.740 | 5,590 | 36 | 96 | 0.302 | 0.667 | 2.136 | 0.091 |
| CCL2 | 2,035
(712–3,744) | 966
(193–3,021) | <0.001 | 0.854 | 2,409 | 36 | 96 | 0.302 | 0.667 | 1.871 | 0.239 |
| CXCL11 | 1,116
(351–5,740) | 376 (36–1,457) | <0.001 | 0.867 | 983 | 43 | 96 | 0.365 | 0.688 | 2.230 | 0.058 |
| CCL3 | 11 (3–22) | 5 (3–31) | 0.002 | 0.808 | 9 | 64 | 96 | 0.580 | 0.768 | 2.704 | 0.010 |
| CXCL9 | 253 (17–953) | 44 (10–174) | <0.001 | 0.912 | 147 | 64 | 96 | 0.580 | 0.768 | 2.366 | 0.034 |
| CXCL9 + CXCL10 | – | – | – | 0.945 | – | 86 | 96 | 0.788 | 0.872 | 2.721 | 0.009 |
Circulating CXCL9 and CXCL10 were the two cytokines
able to distinguish between inflamed and non-inflamed tumors, and
patients with PFI <12 months and PFI >12 months, which
encouraged assessment of whether circulating chemokines are able to
detect immune-infiltrated tumors, which are more likely to recur
within 12 months after completion of chemotherapy. For this,
inflamed tumors group was narrowed into inflamed with PFI <12
months (n=14). The patients in the inflamed PFI <12 months group
exhibited higher serum levels of CXCL10, CXCL5, CCL2, CXCL11, CCL3
and CXCL9 compared with the remaining patients, with the
sensitivity of single chemokines varying from 29–64 at 96%
specificity (Table V). CCL3 and
CXCL9 alone had positive and good negative clinical utility.
However, the AUC of CXCL9 was the best out of all single markers
analyzed. Despite numerous potential multiple chemokine
combinations, CXCL9 + CXCL10 again had the most promising
characteristics, reaching 86% sensitivity and 96% specificity. This
combination had good positive and excellent negative clinical
utility. Although AUC of CXCL9 alone was 0.912, the combination
with CXCL10 performed even better with AUC of 0.945 (Fig. 5C). Patients with high preoperative
CXCL9 + CXCL10 levels were likely to belong to the inflamed group
and recur within 12 months after completion of chemotherapy
(Fig. 5D).
Discussion
Multidirectional cross-talk between various cell
types in the tumor microenvironment and recruitment of immune cells
is often mediated by the secretion of chemotactic factors (20). Chemokine signals may exhibit
pleiotropic effects that go beyond their originally described
function as chemoattractants, and can directly and indirectly
participate in shaping the immune contexture of the tumor (29). Studies demonstrated that the
signaling components and metabolites of the tumor microenvironment
can gain access to the bloodstream (21,30).
Therefore, measuring chemokines in serum of patients with cancer
presents as a relevant and convenient approach for identification
of novel biomarkers, which may be beneficial for the personalized
management of complex diseases, such as recurrent ovarian
cancer.
In this study, CC and CXC family chemokines were
differentially expressed in sera of patients with HGSOC. Their
levels, negatively associated with RFS, reflect the corresponding
intratumoral gene and protein expression. A combination of
circulating preoperative CCL4 + CXCL1 + CCL20 chemokines was
associated with shorter RFS and OS. The immune contexture of tumors
was also highlighted and it was proposed that the CXCL9 + CXCL10
combination may be applicable for detecting immune-infiltrated
tumors, including those which are more likely to recur within 12
months after completion of first-line chemotherapy.
Resistance to platinum-based chemotherapy remains
the major cause of HGSOC recurrence. The second-line chemotherapy
regimen decision is usually made according to the duration of PFI
(5). There are no clinically useful
biomarkers to predict the chemotherapy outcome ahead of treatment.
As OC is often driven by somatic and germline mutations, attempts
to classify tumors as platinum-sensitive or platinum-resistant have
typically focused on tumor gene expression profiling and resulted
in multiple predictive gene expression algorithms (31–33).
Among circulating proteins, the classical OC marker CA-125 was
previously demonstrated to be a positive response predictor if
present at lower levels at the time of diagnosis (34); however, other studies contradict
this finding (35) or emphasize
another OC marker, HE4, as more specific in preoperative prediction
of platinum sensitivity (36,37).
The development of chemoresistance is a complex
process, depending on multiple factors, including intrinsic genetic
and epigenetic alterations, cell metabolism, and even the tumor
immune infiltration (38,39). The idea that the elements of host
immunity may contribute to responsiveness and resistance to
chemotherapy suggests the rationale for systemic analysis of
soluble mediators. For example, platinum-based drugs and mitotic
inhibitors are able to induce nuclear factor κB (NFκB)-mediated
chemoresistance in cancer cells, which relies on the production of
proinflammatory chemokines (40,41).
We hypothesized that recurrence-prone patients may already exhibit
altered levels of serum chemokines at diagnosis. Increased levels
of CCL4, CXCL1 and CCL20 chemokines were detected in patients that
later experienced disease recurrence. These cytokines act in
multiple ways during tumor development and response to treatment.
Increased levels of circulating CXCL1 in ovarian carcinomas
compared with benign pelvic masses imply its potential role as a
marker in early OC detection (42),
which may be attributed to its ability to induce the proliferation
epithelial OC cells by transactivation of epidermal growth factor
(EGF) receptor and induction of mitogen-activated protein kinase
signaling, as demonstrated in vitro (43). CXCL1 participates in an
endothelial-carcinoma-myeloid signaling network through its ability
to recruit neutrophils/myeloid-derived suppressor cells that
promote angiogenesis in vivo and promote cancer cell
survival (44).
Chemotherapy-induced tumor necrosis factor-α (TNF-α) increases the
expression of CXCL1, amplifying the signaling loop and causing
NFκB-mediated chemoresistance (45). CCL20, similarly to CXCL1, is also
expressed in response to EGF and TNF-α (46), and acts pro-metastatically,
supporting proliferation, migration and adhesion of tumor cells
(47,48). Additionally, CCL20 recruits
CD34+-derived dendritic cells and Tregs (49,50).
An interesting mechanism was proposed in a study of esophageal
squamous cell carcinoma, which suggested that CCL4 and CCL20
recruit functionally different T lymphocyte subsets, cytotoxic T
lymphocytes (CTLs) and Tregs, respectively. A high level of CCL20
was associated with worse prognosis, whereas increased CCL4 was
associated with better OS (51).
Correlation between increased intratumoral CCL4 and CD8+
TILs was also reported in OC (52).
Nevertheless, the present study identified a negative association
between cumulative preoperative circulating CCL4 + CXCL1 + CCL20
levels and response to chemotherapy, which may suggest the presence
of multiple immune milieu-driven chemoresistance mechanisms in
HGSOC.
The discovery of an immunoreactive molecular subtype
of HGSOC underlined the complexity of the ovarian tumor
microenvironment (TME), indicating that immune effector and
inhibitory molecules are expressed in tumors. The presence of CXCL9
and CXCL10 is another characteristic of immunoreactive subtypes
(7,8). Together with their receptor C-X-C
motif chemokine receptor 3, these cytokines can indirectly act as
both tumor-suppressing and tumor-promoting factors depending on
their source. CXCL9 and CXCL10 recruit T and B lymphocytes, natural
killer (NK) cells and NK T cells (53). However, their prognostic impact is
rather contradictory. We propose the circulating preoperative CXCL9
+ CXCL10 chemokine classifier as an auxiliary marker for
microinvasive discrimination of patients with stronger immune
infiltration in tumors. Notably, in the cohort of the present
study, there was a negative association between systemic CXCL9 +
CXCL10 and RFS (but not OS), which contradicts reports linking
intratumoral CXCL9 and CXCL10 with better OS in HGSOC to some
extent (13,54). However, the levels of these
chemokines were also demonstrated to be associated with worse
prognosis in several other cancer types (55–60).
The complexity of surrounding TME can explain the differences in
observed outcomes, as the tumor-dependent factors can shift the
microenvironment from immune-activating to immune-suppressing.
Additionally, CXCL9 and CXCL10 chemokines can recruit both CTLs and
Tregs in ovarian cancer, as demonstrated in vitro and in
murine models (61,62), and the CTL/Treg ratio can also
determine the prognosis of patients with OC (63). In the present study, elevated
circulating chemokine levels reflected the overall T lymphocyte
infiltration. However, gene expression analysis revealed the
presence of antitumoral [increased expression of CD8, interferon γ
(IFNγ), granzymes, eomesodermin] and immunosuppressive [increased
expression of forkhead box P3, cytotoxic T-lymphocyte associated
protein 4 (CTLA-4), PD-L1, interleukin-10 (IL-10), CD163] T
cell-associated processes in inflamed tumors. These findings
suggest the presence of CTLs and Tregs in the same tumor. Another
reason for the contradictory prognostic role of CXCL9 and CXCL10
are their splice variants, which can act antagonistically, as
previously reported in hepatocellular carcinoma and HGSOC (64–66).
Discovery of the immunosuppressive mechanisms of OC
encourages the development of novel treatment strategies. The goal
of immunotherapy is to generate long-term protective T cell
immunity to promote tumor eradication. The cancer-immunity cycle
summarizes the stepwise processes required to yield an anticancer T
cell response. One of the crucial stages, trafficking and retaining
of effector T cells in the tumor, is mediated by CXCL9 and CXCL10
(67). Furthermore, the expression
of these cytokines, together with IFNγ and granzymes, is strongly
correlated with the expression of PD-L1 tumors, suggesting the
potential benefit of checkpoint blockade (68). Successful melanoma and renal cell
carcinoma clinical trials reported the association of intratumoral
CXCL9 and CXCL10 in TILs with clinical benefit from adoptive T cell
therapy (69), ipilimumab (70,71)
and pembrolizumab (72), as well as
the increase of circulating CXCL9 and CXCL10 during treatment with
nivolumab (73,74). The early phase checkpoint inhibitor
trials in OC demonstrated a durable antitumor response in some
patients [reviewed in (75)]. The
mRNA expression of CTLA-4, PD-L1, IFNγ, granzyme B and CXCL10 were
also increased in immune-infiltrated tumors of patients,
characterized by the increased serum CXCL9 + CXCL10 level. The
relatively short RFS of these patients indicates them as potential
candidates for immunotherapy. Thus far, the results of checkpoint
inhibition in OC are promising, taking into consideration the poor
sensitivity of platinum-resistant HGSOC to other conventional
chemotherapy agents (75,76). Therefore, modulation of TME in
patients selected with the help of accurate predictive biomarkers
may be an encouraging means for improving OC management and
survival. A recent study demonstrated that the expression of CXCL9
and CXCL10, and other genes of IFNγ pathway, can be stimulated by
chemotherapeutic agents, suggesting that chemotherapy may benefit
patients with non-inflamed HGSOC tumors (13). Such pre-treatment may therefore be
advantageous for T cell recruitment and sensitizing tumors to
immune modulation. However, the presence of potentially recruited
Tregs has to be acknowledged too, as they may impact the choice and
strategy of further immunotherapy treatment.
The unsatisfactory clinical outcome of patients with
advanced HGSOC urges the search for novel prognostic and predictive
biomarkers, and therefore, dictated the exploratory nature of this
study. The systemic preoperative chemokine profile was evaluated in
patients with OC and associated them with the immune infiltration
of tumors and response to treatment. There are limitations caused
by the relatively small sample size and homogeneous ethnicity of
the participants in the present study. Also, the study focused on
the pre-operative chemokine level measurements and did not follow
their dynamics during the primary chemotherapy, recurrence-free
period and at the point of recurrence. Longitudinal assessment may
provide more a accurate serum chemokine profile in response to
treatment, as demonstrated by Coosemans et al (77), which reported the significant
decrease in levels of metabolites, including CCL2, IL-10, vascular
endothelial growth factor and transforming growth factor-β,
following debulking surgery and paclitaxel/carboplatin-based
chemotherapy. Nevertheless, this study provides primary evidence
for the combined use of circulating CCL4, CXCL1 and CCL20 for
predicting recurrence, and CXCL9 and CXCL10 for detecting
immune-infiltrated HGSOC at diagnosis, prior to of treatment.
Further validations on a larger scale are required to confirm that
these chemokine combinations successfully model the outcome in
other patient populations. Additionally, determining the exact
source and function of these chemokines in OC setting is necessary
for dissecting and targeting the tumor microenvironment.
In conclusion, the findings of the present study
demonstrate that preoperative levels of serum chemokines vary among
patients with advanced HGSOC. Although the predictive value of
single chemokines is modest, their combinations have a potential
prognostic use. The results suggest that an increased concentration
of circulating CCL4 + CXCL1 + CCL20 in patients with OC serum is
associated with shorter RFS and OS. Furthermore, the elevated
levels of CXCL9 + CXCL10 mark immune infiltrated tumors, and
reflect the increased intratumoral gene and protein expression of
other inflammatory chemokines. Despite the discussed limitations
and descriptive nature of this study, the findings provide
background for further investigations of the clinical performance
of multiple chemokine combinations as patients stratification tools
for improved HGSOC management.
Acknowledgements
Not applicable.
Funding
No funding was received.
Availability of data and materials
The datasets and analyses of this study are
available upon request from the corresponding author.
Authors' contributions
AM, MS, JAK and VP contributed equally to the
conception and design of this study. BI selected the patients and
provided their follow-up clinical information. AM, GS, KZ, SG and
ND processed the patient samples and performed the experimental
procedures. AB performed the histological tumor examination. GL
contributed to statistical data analysis. AM interpreted the data
and wrote the manuscript. MS, JAK and VP critically revised the
manuscript for intellectual content. All authors read and approved
the final manuscript.
Ethics approval and consent to
participate
This study was approved by Lithuanian Bioethics
Committee (approval no. 158200-06-500-147). All patients signed an
informed consent form.
Patient consent for publication
All patients signed an informed consent form
allowing for publication of depersonalized data.
Competing interests
The authors declare that they have no competing
interests.
References
|
1
|
Sant M, Allemani C, Santaquilani M, Knijn
A, Marchesi F and Capocaccia R: EUROCARE Working Group: EUROCARE-4.
Survival of cancer patients diagnosed in 1995–1999. Results and
commentary. Eur J Cancer. 45:931–991. 2009. View Article : Google Scholar : PubMed/NCBI
|
|
2
|
Sant M, Chirlaque Lopez MD, Agresti R,
Sánchez Perez MJ, Holleczek B, Bielska-Lasota M, Dimitrova N, Innos
K, Katalinic A, Langseth H, et al: Survival of women with cancers
of breast and genital organs in Europe 1999–2007: Results of the
EUROCARE-5 study. Eur J Cancer. 51:2191–2205. 2015. View Article : Google Scholar : PubMed/NCBI
|
|
3
|
Bowtell DD, Böhm S, Ahmed AA, Aspuria PJ,
Bast R, Beral V, Berek JS, Birrer MJ, Blagden S, Bookman MA, et al:
Rethinking ovarian cancer II: Reducing mortality from high-grade
serous ovarian cancer. Nat Rev Cancer. 15:668–679. 2015. View Article : Google Scholar : PubMed/NCBI
|
|
4
|
Matulonis UA, Sood AK, Fallowfield L,
Howitt BE, Sehouli J and Karlan BY: Ovarian cancer. Nat Rev Dis
Primers. 2:160612016. View Article : Google Scholar : PubMed/NCBI
|
|
5
|
Friedlander M, Trimble E, Tinker A,
Alberts D, Avall-Lundquist E, Brady M, Harter P, Pignata S,
Pujade-Lauraine E, Sehouli J, et al: Clinical trials in recurrent
ovarian cancer. Int J Gynecol Cancer. 21:771–775. 2011. View Article : Google Scholar : PubMed/NCBI
|
|
6
|
Alvarez RD, Matulonis UA, Herzog TJ,
Coleman RL, Monk BJ and Markman M: Moving beyond the platinum
sensitive/resistant paradigm for patients with recurrent ovarian
cancer. Gynecol Oncol. 141:405–409. 2016. View Article : Google Scholar : PubMed/NCBI
|
|
7
|
Bell D, Berchuck A, Birrer M, Chien J,
Cramer D, Dao F, Dhir R, DiSala P, Gabra H, Glenn P, et al:
Integrated genomic analyses of ovarian carcinoma. Nature.
474:609–615. 2011. View Article : Google Scholar : PubMed/NCBI
|
|
8
|
Tothill RW, Tinker AV, George J, Brown R,
Fox SB, Lade S, Johnson DS, Trivett MK, Etemadmoghadam D, Locandro
B, et al: Novel molecular subtypes of serous and endometrioid
ovarian cancer linked to clinical outcome. Clin Cancer Res.
14:5198–5208. 2008. View Article : Google Scholar : PubMed/NCBI
|
|
9
|
Verhaak RG, Tamayo P, Yang JY, Hubbard D,
Zhang H, Creighton CJ, Fereday S, Lawrence M, Carter SL, Mermel CH,
et al: Prognostically relevant gene signatures of high-grade serous
ovarian carcinoma. J Clin Invest. 123:517–525. 2013.PubMed/NCBI
|
|
10
|
Konecny GE, Wang C, Hamidi H, Winterhoff
B, Kalli KR, Dering J, Ginther C, Chen HW, Dowdy S, Cliby W, et al:
Prognostic and therapeutic relevance of molecular subtypes in
high-grade serous ovarian cancer. J Natl Cancer Inst. 106(pii):
dju2492014.PubMed/NCBI
|
|
11
|
Nelson BH: New insights into tumor
immunity revealed by the unique genetic and genomic aspects of
ovarian cancer. Curr Opin Immunol. 33:93–100. 2015. View Article : Google Scholar : PubMed/NCBI
|
|
12
|
Hwang WT, Adams SF, Tahirovic E, Hagemann
IS and Coukos G: Prognostic significance of tumor-infiltrating T
cells in ovarian cancer: A meta-analysis. Gynecol Oncol.
124:192–198. 2012. View Article : Google Scholar : PubMed/NCBI
|
|
13
|
Hao D, Liu J, Chen M, Li J, Wang L, Li X,
Zhao Q and Di LJ: Immunogenomic analyses of advanced serous ovarian
cancer reveal immune score is a prognostic factor and an indicator
of chemosensitivity. Clin Cancer Res. 24:3560–3571. 2018.
View Article : Google Scholar : PubMed/NCBI
|
|
14
|
Wang W, Kryczek I, Dostál L, Lin H, Tan L,
Zhao L, Lu F, Wei S, Maj T, Peng D, et al: Effector T cells
abrogate Stroma-mediated chemoresistance in ovarian cancer. Cell.
165:1092–1105. 2016. View Article : Google Scholar : PubMed/NCBI
|
|
15
|
Xu S, Tao Z, Hai B, Liang H, Shi Y, Wang
T, Song W, Chen Y, OuYang J, Chen J, et al: miR-424(322) reverses
chemoresistance via T-cell immune response activation by blocking
the PD-L1 immune checkpoint. Nat Commun. 7:114062016. View Article : Google Scholar : PubMed/NCBI
|
|
16
|
Rabinovich GA, Gabrilovich D and Sotomayor
EM: Immunosuppressive strategies that are mediated by tumor cells.
Annu Rev Immunol. 25:267–296. 2007. View Article : Google Scholar : PubMed/NCBI
|
|
17
|
Castells M, Thibault B, Delord JP and
Couderc B: Implication of tumor microenvironment in
chemoresistance: Tumor-associated stromal cells protect tumor cells
from cell death. Int J Mol Sci. 13:9545–9571. 2012. View Article : Google Scholar : PubMed/NCBI
|
|
18
|
Baghdadi M, Wada H, Nakanishi S, Abe H,
Han N, Wira E, Endo D, Watari H, Sakuragi N, Hida Y, et al:
Chemotherapy-induced IL34 enhances immunosuppression by
tumor-associated macrophages and mediates survival of
chemoresistant lung cancer cells. Cancer Res. 76:6030–6042. 2016.
View Article : Google Scholar : PubMed/NCBI
|
|
19
|
Takeuchi S, Baghdadi M, Tsuchikawa T, Wada
H, Nakamura T, Abe H, Nakanishi S, Usui Y, Higuchi K, Takahashi M,
et al: Chemotherapy-derived inflammatory responses accelerate the
formation of immunosuppressive myeloid cells in the tissue
microenvironment of human pancreatic cancer. Cancer Res.
75:2629–2640. 2015. View Article : Google Scholar : PubMed/NCBI
|
|
20
|
Mukaida N, Sasaki S and Baba T: Chemokines
in cancer development and progression and their potential as
targeting molecules for cancer treatment. Mediators Inflamm.
2014:1703812014. View Article : Google Scholar : PubMed/NCBI
|
|
21
|
Gnjatic S, Bronte V, Brunet LR, Butler MO,
Disis ML, Galon J, Hakansson LG, Hanks BA, Karanikas V, Khleif SN,
et al: Identifying baseline immune-related biomarkers to predict
clinical outcome of immunotherapy. J Immunother Cancer. 5:442017.
View Article : Google Scholar : PubMed/NCBI
|
|
22
|
Yang WL, Lu Z and Bast RC Jr: The role of
biomarkers in the management of epithelial ovarian cancer. Expert
Rev Mol Diagn. 17:577–591. 2017. View Article : Google Scholar : PubMed/NCBI
|
|
23
|
Prat J: FIGO Committee on Gynecologic
Oncology: Abridged republication of FIGO's staging classification
for cancer of the ovary, fallopian tube, and peritoneum. Cancer.
121:3452–3454. 2015. View Article : Google Scholar : PubMed/NCBI
|
|
24
|
Livak KJ and Schmittgen TD: Analysis of
relative gene expression data using real-time quantitative PCR and
the 2ΔΔCT method. Methods.
25:402–408. 2001. View Article : Google Scholar : PubMed/NCBI
|
|
25
|
Pfaffl MW: A new mathematical model for
relative quantification in real-time RT-PCR. Nucleic Acids Res.
29:e452001. View Article : Google Scholar : PubMed/NCBI
|
|
26
|
Shimizu Y, Kamoi S, Amada S, Akiyama F and
Silverberg SG: Toward the development of a universal grading system
for ovarian epithelial carcinoma: Testing of a proposed system in a
series of 461 patients with uniform treatment and follow-up.
Cancer. 82:893–901. 1988. View Article : Google Scholar
|
|
27
|
Kaku T, Ogawa S, Kawano Y, Ohishi Y,
Kobayashi H, Hirakawa T and Nakano H: Histological classification
of ovarian cancer. Med Electron Microsc. 36:9–17. 2003. View Article : Google Scholar : PubMed/NCBI
|
|
28
|
Mitchell AJ: Sensitivity × PPV is a
recognized test called the clinical utility index (CUI+). Eur J
Epidemiol. 26:251–252. 2011. View Article : Google Scholar : PubMed/NCBI
|
|
29
|
Charo IF and Ransohoff RM: The many roles
of chemokines and chemokine receptors in inflammation. N Engl J
Med. 354:610–621. 2006. View Article : Google Scholar : PubMed/NCBI
|
|
30
|
Pitteri SJ, Kelly-Spratt KS, Gurley KE,
Kennedy J, Buson TB, Chin A, Wang H, Zhang Q, Wong CH, Chodosh LA,
et al: Tumor microenvironment-derived proteins dominate the plasma
proteome response during breast cancer induction and progression.
Cancer Res. 71:5090–5100. 2011. View Article : Google Scholar : PubMed/NCBI
|
|
31
|
Gevaert O, De Smet F, Van Gorp T, Pochet
N, Engelen K, Amant F, De Moor B, Timmerman D and Vergote I:
Expression profiling to predict the clinical behaviour of ovarian
cancer fails independent evaluation. BMC Cancer. 8:182008.
View Article : Google Scholar : PubMed/NCBI
|
|
32
|
Helleman J, Jansen MP, Span PN, van
Staveren IL, Massuger LF, Meijer-van Gelder ME, Sweep FC, Ewing PE,
van der Burg ME, Stoter G, et al: Molecular profiling of platinum
resistant ovarian cancer. Int J Cancer. 118:1963–1971. 2006.
View Article : Google Scholar : PubMed/NCBI
|
|
33
|
Gonzalez Bosquet J, Newtson AM, Chung RK,
Thiel KW, Ginader T, Goodheart MJ, Leslie KK and Smith BJ:
Prediction of chemo-response in serous ovarian cancer. Mol Cancer.
15:662016. View Article : Google Scholar : PubMed/NCBI
|
|
34
|
Chung RK, Newtson AM, Mott SL and Gonzalez
Bosquet J: Clinicopathological predictors of responsiveness in
epithelial ovarian cancer: A preliminary institutional study. Proc
Obstet Gynecol. 5:62015. View Article : Google Scholar
|
|
35
|
Masoumi-Moghaddam S, Amini A, Wei AQ,
Robertson G and Morris DL: Vascular endothelial growth factor
expression correlates with serum CA125 and represents a useful tool
in prediction of refractoriness to platinum-based chemotherapy and
ascites formation in epithelial ovarian cancer. Oncotarget.
6:28491–28501. 2015. View Article : Google Scholar : PubMed/NCBI
|
|
36
|
Angioli R, Capriglione S, Aloisi A, Guzzo
F, Luvero D, Miranda A, Damiani P, Montera R, Terranova C and
Plotti F: Can HE4 predict platinum response during first-line
chemotherapy in ovarian cancer? Tumor Biol. 35:7009–7015. 2014.
View Article : Google Scholar
|
|
37
|
Chudecka-Głaz A, Cymbaluk-Płoska A,
Wężowska M and Menkiszak J: Could HE4 level measurements during
first-line chemotherapy predict response to treatment among ovarian
cancer patients? PLoS One. 13:e01942702018. View Article : Google Scholar : PubMed/NCBI
|
|
38
|
Pogge von Strandmann E, Reinartz S, Wager
U and Müller R: Tumor-host cell interactions in ovarian cancer:
Pathways to therapy failure. Trends Cancer. 3:137–148. 2017.
View Article : Google Scholar : PubMed/NCBI
|
|
39
|
Senthebane DA, Rowe A, Thomford NE,
Shipanga H, Munro D, Mazeedi MAM, Almazyadi HAM, Kallmeyer K,
Dandara C, Pepper MS, et al: The role of tumor microenvironment in
chemoresistance: To survive, keep your enemies closer. Int J Mol
Sci. 18(pii): E15862017. View Article : Google Scholar : PubMed/NCBI
|
|
40
|
de Visser KE and Jonkers J: Towards
understanding the role of cancer-associated inflammation in
chemoresistance. Curr Pharm Des. 15:1844–1853. 2009. View Article : Google Scholar : PubMed/NCBI
|
|
41
|
Szajnik M, Szczepanski MJ, Czystowska M,
Elishaev E, Mandapathil M, Nowak-Markwitz E, Spaczynski M and
Whiteside TL: TLR4 signaling induced by lipopolysaccharide or
paclitaxel regulates tumor survival and chemoresistance in ovarian
cancer. Oncogene. 28:4353–4363. 2009. View Article : Google Scholar : PubMed/NCBI
|
|
42
|
Wang Q, Li D, Zhang W, Tang B, Li QQ and
Li L: Evaluation of proteomics-identified CCL18 and CXCL1 as
circulating tumor markers for differential diagnosis between
ovarian carcinomas and benign pelvic masses. Int J Biol Markers.
26:262–273. 2011. View Article : Google Scholar : PubMed/NCBI
|
|
43
|
Bolitho C, Hahn MA, Baxter RC and Marsh
DJ: The chemokine CXCL1 induces proliferation in epithelial ovarian
cancer cells by transactivation of the epidermal growth factor
receptor. Endocr Relat Cancer. 17:929–940. 2010. View Article : Google Scholar : PubMed/NCBI
|
|
44
|
Scapini P, Morini M, Tecchio C, Minghelli
S, Di Carlo E, Tanghetti E, Albini A, Lowell C, Berrton G, Noonan
DM and Cassatella MA: CXCL1/macrophage inflammatory
protein-2-induced angiogenesis in vivo is mediated by
neutrophil-derived vascular endothelial growth factor-A. J Immunol.
172:5034–5040. 2004. View Article : Google Scholar : PubMed/NCBI
|
|
45
|
Acharyya S, Oskarsson T, Vanharanta S,
Malladi S, Kim J, Morris PG, Manova-Todorova K, Leversha M, Hogg N,
Seshan VE, et al: A CXCL1 paracrine network links cancer
chemoresistance and metastasis. Cell. 150:165–178. 2012. View Article : Google Scholar : PubMed/NCBI
|
|
46
|
Son DS, Kabir SM, Dong Y, Lee E and
Adunyah SE: Characteristics of chemokine signatures elicited by EGF
and TNF in ovarian cancer cells. J Inflamm. 10:252013. View Article : Google Scholar
|
|
47
|
Marsigliante S, Vetrugno C and Muscella A:
CCL20 induces migration and proliferation on breast epithelial
cells. J Cell Physiol. 228:1873–1883. 2013. View Article : Google Scholar : PubMed/NCBI
|
|
48
|
Beider K, Abraham M, Begin M, Wald H,
Weiss ID, Wald O, Pikarsky E, Abramovitch R, Zeira E, Galun E, et
al: Interaction between CXCR4 and CCL20 pathways regulates tumor
growth. PLoS One. 4:e51252009. View Article : Google Scholar : PubMed/NCBI
|
|
49
|
Greaves DR, Wang W, Dairaghi DJ, Dieu MC,
Saint-Vis B, Franz-Bacon K, Rossi D, Caux C, McClanahan T, Gordon
S, et al: CCR6, a CC chemokine receptor that interacts with
macrophage inflammatory protein 3α and is highly expressed in human
dendritic cells. J Exp Med. 186:837–844. 1997. View Article : Google Scholar : PubMed/NCBI
|
|
50
|
Cook KW, Letley DP, Ingram RJ, Staples E,
Skjoldmose H, Atherton JC and Robinson K: CCL20/CCR6-mediated
migration of regulatory T cells to the Helicobacter
pylori-infected human gastric mucosa. Gut. 63:1550–1559. 2014.
View Article : Google Scholar : PubMed/NCBI
|
|
51
|
Liu JY, Li F, Wang LP, Chen XF, Wang D,
Cao L, Ping Y, Zhao S, Li B, Thorne SH, et al: CTL- vs
Treg lymphocyte-attracting chemokines, CCL4 and CCL20,
are strong reciprocal predictive markers for survival of patients
with oesophageal squamous cell carcinoma. Br J Cancer. 113:747–755.
2015. View Article : Google Scholar : PubMed/NCBI
|
|
52
|
Zsiros E, Duttagupta P, Dangaj D, Li H,
Frank R, Garrabrant T, Hagemann IS, Levine BL, June CH, Zhang L, et
al: The ovarian cancer chemokine landscape is conducive to homing
of vaccine-primed and CD3/CD28-costimulated T cells prepared for
adoptive therapy. Clin Cancer Res. 21:2840–2850. 2015. View Article : Google Scholar : PubMed/NCBI
|
|
53
|
Tokunaga R, Zhang W, Naseem M, Puccini A,
Berger MD, Soni S, McSkane M, Baba H and Lenz HJ: CXCL9, CXCL10,
CXCL11/CXCR3 axis for immune activation-a target for novel cancer
therapy. Cancer Treat Rev. 63:40–47. 2018. View Article : Google Scholar : PubMed/NCBI
|
|
54
|
Bronger H, Singer J, Windmüller C, Reuning
U, Zech D, Delbridge C, Dorn J, Kiechle M, Schmalfeldt B, Schmitt M
and Avril S: CXCL9 and CXCL10 predict survival and are regulated by
cyclooxygenase inhibition in advanced serous ovarian cancer. Br J
Cancer. 115:553–563. 2016. View Article : Google Scholar : PubMed/NCBI
|
|
55
|
Mir MA, Maurer MJ, Ziesmer SC, Slager SL,
Habermann T, Macon WR, Link BK, Syrbu S, Witzig T, Friedberg JW, et
al: Elevated serum levels of IL-2R, IL-1RA, and CXCL9 are
associated with a poor prognosis in follicular lymphoma. Blood.
125:992–998. 2015. View Article : Google Scholar : PubMed/NCBI
|
|
56
|
Flores RJ, Kelly AJ, Li Y, Nakka M,
Barkauskas DA, Krailo M, Wang LL, Perlaky L, Lau CC, Hicks MJ, et
al: A novel prognostic model for osteosarcoma using circulating
CXCL10 and FLT3LG. Cancer. 123:144–154. 2017. View Article : Google Scholar : PubMed/NCBI
|
|
57
|
Hong JY, Ryu KJ, Lee JY, Park C, Ko YH,
Kim WS and Kim SJ: Serum level of CXCL10 is associated with
inflammatory prognostic biomarkers in patients with diffuse large
B-cell lymphoma. Hematol Oncol. 35:480–486. 2017. View Article : Google Scholar : PubMed/NCBI
|
|
58
|
Bai M, Chen X and Ba YI: CXCL10/CXCR3
overexpression as a biomarker of poor prognosis in patients with
stage II colorectal cancer. Mol Clin Oncol. 4:23–30. 2016.
View Article : Google Scholar : PubMed/NCBI
|
|
59
|
Toiyama Y, Fujikawa H, Kawamura M,
Matsushita K, Saigusa S, Tanaka K, Inoue Y, Uchida M, Mohri Y and
Kusunoki M: Evaluation of CXCL10 as a novel serum marker for
predicting liver metastasis and prognosis in colorectal cancer. Int
J Oncol. 40:560–566. 2012.PubMed/NCBI
|
|
60
|
Specht K, Harbeck N, Smida J, Annecke K,
Reich U, Naehrig J, Langer R, Mages J, Busch R, Kruse E, et al:
Expression profiling identifies genes that predict recurrence of
breast cancer after adjuvant CMF-based chemotherapy. Breast Cancer
Res Treat. 118:45–56. 2009. View Article : Google Scholar : PubMed/NCBI
|
|
61
|
K Au K, Peterson N, Truesdell P,
Reid-Schachter G, Khalaj K, Ren R, Francis JA, Graham CH, Craig AW
and Koti M: CXCL10 alters the tumour immune microenvironment and
disease progression in a syngeneic murine model of high-grade
serous ovarian cancer. Gynecol Oncol. 145:436–445. 2017. View Article : Google Scholar : PubMed/NCBI
|
|
62
|
Redjimi N, Raffin C, Raimbaud I, Pignon P,
Matsuzaki J, Odunsi K, Valmori D and Ayyoub M: CXCR3+ T
regulatory cells selectively accumulate in human ovarian carcinomas
to limit type I immunity. Cancer Res. 72:4351–4360. 2012.
View Article : Google Scholar : PubMed/NCBI
|
|
63
|
Sato E, Olson SH, Ahn J, Bundy B,
Nishikawa H, Qian F, Jungbluth AA, Frosina D, Gnjatic S, Ambrosone
C, et al: Intraepithelial CD8+ tumor-infiltrating
lymphocytes and a high CD8+/regulatory T cell ratio are
associated with favorable prognosis in ovarian cancer. Proc Natl
Acad Sci USA. 102:18538–18543. 2005. View Article : Google Scholar : PubMed/NCBI
|
|
64
|
Casrouge A, Decalf J, Ahloulay M, Lababidi
C, Mansour H, Vallet-Pichard A, Mallet V, Mottez E, Mapes J,
Fontanet A, et al: Evidence for an antagonist form of the chemokine
CXCL10 in patients chronically infected with HCV. J Clin Invest.
121:308–317. 2011. View Article : Google Scholar : PubMed/NCBI
|
|
65
|
Rainczuk A, Rao JR, Gathercole JL,
Fairweather NJ, Chu S, Masadah R, Jobling TW, Deb-Choudhury S, Dyer
J and Stephens AN: Evidence for the antagonistic form of CXC-motif
chemokine CXCL10 in serous epithelial ovarian tumours. Int J
Cancer. 134:530–541. 2014. View Article : Google Scholar : PubMed/NCBI
|
|
66
|
Ding Q, Lu P, Xia Y, Ding S, Fan Y, Li X,
Han P, Liu J, Tian D and Liu M: CXCL9: Evidence and contradictions
for its role in tumor progression. Cancer Med. 5:3246–3259. 2016.
View Article : Google Scholar : PubMed/NCBI
|
|
67
|
Chen DS and Mellman I: Oncology meets
immunology: The cancer-immunity cycle. Immunity. 39:1–10. 2013.
View Article : Google Scholar : PubMed/NCBI
|
|
68
|
Peng W, Liu C, Xu C, Lou Y, Chen J, Yang
Y, Yagita H, Overwijk WW, Lizée G, Radvanyi L, et al: PD-1 blockade
enhances T-cell migration to tumors by elevating IFN-γ inducible
chemokines. Cancer Res. 72:5209–5218. 2012. View Article : Google Scholar : PubMed/NCBI
|
|
69
|
Bedognetti D, Spivey TL, Zhao Y, Uccellini
L, Tomei S, Dudley ME, Ascierto ML, De Giorgi V, Liu Q, Delogu LG,
et al: CXCR3/CCR5 pathways in metastatic melanoma patients treated
with adoptive therapy and interleukin-2. Br J Cancer.
109:2412–2423. 2013. View Article : Google Scholar : PubMed/NCBI
|
|
70
|
Harlin H, Meng Y, Peterson AC, Zha Y,
Tretiakova M, Slingluff C, McKee M and Gajewski TF: Chemokine
expression in melanoma metastases associated with CD8+
T-cell recruitment. Cancer Res. 69:3077–3085. 2009. View Article : Google Scholar : PubMed/NCBI
|
|
71
|
Tarhini AA, Lin Y, Lin HM, Vallabhaneni P,
Sander C, LaFramboise W and Hamieh L: Expression profiles of
immune-related genes are associated with neoadjuvant ipilimumab
clinical benefit. Oncoimmunology. 6:e12312912016. View Article : Google Scholar : PubMed/NCBI
|
|
72
|
Ayers M, Lunceford J, Nebozhyn M, Murphy
E, Loboda A, Kaufman DR, Albright A, Cheng JD, Kang SP, Shankaran
V, et al: IFN-γ-related mRNA profile predicts clinical response to
PD-1 blockade. J Clin Invest. 127:2930–2940. 2017. View Article : Google Scholar : PubMed/NCBI
|
|
73
|
Yamazaki N, Kiyohara Y, Uhara H, Iizuka H,
Uehara J, Otsuka F, Fujisawa Y, Takenouchi T, Isei T, Iwatsuki K,
et al: Cytokine biomarkers to predict antitumor responses to
nivolumab suggested in a phase 2 study for advanced melanoma.
Cancer Sci. 108:1022–1031. 2017. View Article : Google Scholar : PubMed/NCBI
|
|
74
|
Choueiri TK, Fishman MN, Escudier B,
McDermott DF, Drake CG, Kluger H, Stadler WM, Perez-Gracia JL,
McNeel DG, Curti B, et al: Immunomodulatory activity of nivolumab
in metastatic renal cell carcinoma. Clin Cancer Res. 22:5461–5471.
2016. View Article : Google Scholar : PubMed/NCBI
|
|
75
|
Hamanishi J, Mandai M and Konishi I:
Immune checkpoint inhibition in ovarian cancer. Int Immunol.
28:339–348. 2016. View Article : Google Scholar : PubMed/NCBI
|
|
76
|
Hamanishi J, Mandai M, Ikeda T, Minami M,
Kawaguchi A, Murayama T, Kanai M, Mori Y, Matsumoto S, Chikuma S,
et al: Safety and antitumor activity of anti-PD-1 antibody,
nivolumab, in patients with platinum-resistant ovarian cancer. J
Clin Oncol. 33:4015–4022. 2015. View Article : Google Scholar : PubMed/NCBI
|
|
77
|
Coosemans A, Decoene J, Baert T, Laenen A,
Kasran A, Verschuere T, Seys S and Vergote I: Immunosuppressive
parameters in serum of ovarian cancer patients change during the
disease course. Oncoimmunology. 5:e11115052016. View Article : Google Scholar : PubMed/NCBI
|