Introduction
The development of cancer is promoted by age,
overweight, obesity, type 2 diabetes mellitus (T2DM) and metabolic
syndrome. T2DM is associated with a significant number of cancers,
such as those of the breast, pancreas, liver, colorectal, renal and
reproductive systems. Diabetic patients with cancer have increased
mortality compared with cancerous non-diabetic individuals
(1).
Hyperglycemia, transient hyperinsulinemia, chronic
inflammation and oxidative stress promote the activation of
signaling mechanisms that favor the initiation, development and
progression of cancer during diabetes (1,2). The
increased plasma levels of insulin-like growth factors, enhanced
production of inflammatory cytokines (IL-6, TNFα and IL1β), low
expression of certain adipokines (adiponectin), and aberrant
protein glycosylation in T2DM organisms induce changes in metabolic
and signaling pathways (2). These
changes help cancer cells adapt to a hyperglycemic environment and
promote the proliferation and acquisition of a migratory and
chemoresistant phenotype (3). The
increased proliferative activity of tumor cells depends on a
continuous supply of biomolecules such as amino acids,
carbohydrates, nucleotides and fatty acids capable of providing the
energy requirements of the cell, favoring the synthesis of DNA,
RNA, proteins and lipids at a higher rate in diabetic patients
(4).
The malignant cells that survive primary treatment
evolve into a population of resistant clones, leading to cancer
progression and patient death (5).
Mortality from breast cancer (BC) is higher in women with diabetes
compared with women without it, since diabetes can exacerbate the
onset and development of cancer by activating various cellular
processes such as proliferation, migration and
epithelial-mesenchymal transition (EMT) (6). Additionally, variations in the
expression and activity of several drug-metabolizing enzymes,
altered drug membrane transport, and evasion of apoptosis play a
critical role in drug resistance (2).
It was found that a high concentration of glucose
promotes an invasive/metastatic phenotype, inducing proliferation,
migration, EMT and cell invasion in MDA-MB-231 cells, which was
associated with increased expression of plasminogen activator
urokinase-type (uPA), its receptor (uPAR), and type 1 inhibitor
(PAI-1), leading to the activation of plasminogen activation system
and AKT signaling (4,6). EMT is one of the mechanisms to enhance
migratory and invasive properties of tumor cells, together with
cell survival, invasiveness and chemotherapy drug resistance
(7).
Elevated blood glucose levels regulate the
chemoresistance in BC (2,3,8).
Hyperglycemia and diabetes promote the sensitivity of BC cells or
breast tumors to some DNA repair inhibitors (8). On the other hand, the development of
resistance to cisplatin and other drugs by BC cells is frequently
mediated by the prevention of apoptosis, increased EMT, DNA repair,
Wnt and PI3K pathways, since cisplatin leads to apoptosis through
increased reactive oxygen species, which leads to DNA damage
(9). However, the genes and
signaling pathways implicated in the development of chemoresistant
and aggressive BC phenotype by high glucose (HG) in diabetic
patients have not been fully explored.
It was aimed to detect the action of HG on the
chemoresistance to cisplatin and changes in gene expression in
MDA-MB-231 BC-derived cells. In addition, to analyze the genes,
metabolic and signaling pathways that can mediate the promotion of
cisplatin resistance and a migratory phenotype by HG.
Materials and methods
Cell culture
MDA-MB-231 BC cells were acquired from the American
Type Culture Collection (ATCC) and cultured in Dulbecco's Modified
Eagle's Medium/Ham's Nutrient Mixture F12 (DMEM-F12;
MilliporeSigma). The medium was supplemented with 10% fetal bovine
serum (FBS; Biowest) and the following antibiotics: penicillin 100
U/ml and streptomycin 100 µg/ml (Thermo Fisher Scientific, Inc.).
The cells were authenticated by the 17 short tandem repeat
profiling (ATCC Cell Line Authentication Service) in August 2020.
The RNA extraction and microarray were processed in 2019, and the
corresponding microarray series GSE136277 was made public in August
2019. Most of the experiments were concluded in 2020. Cultures were
routinely tested for mycoplasma contamination using a PCR-based
detection kit (cat. no. ab289834; Abcam). For propagation, cells
were seeded and cultured in monolayers in 75-cm2 tissue
culture flasks. For some experiments, cells cultured in
6.0-cm-diameter culture plates to 60-80% confluence were cultured
for 48 h in the following conditions: i) Normal glucose (NG), 5.6
mmol/l; ii) 30 mmol/l (HG); iii) HG + 60 µmol/l cisplatin
(MilliporeSigma); and iv) NG + 60 µmol/l cisplatin. The cells were
detached with 0.25% trypsin-EDTA solution (Biowest).
Supplementation with ~5.6 mmol/l D-glucose
approximates normal blood sugar levels, whereas concentrations ~10
mmol/l and above mimic pre-diabetic and diabetic conditions,
respectively. In most studies, HG conditions use 25-30 mmol/l
glucose. In previous studies, it was found that 30 mmol/l glucose
produced the most evident and reproducible effects on MDA-MB-231
cells (4,6). Furthermore, interstitial glucose can
be similar to blood glucose, considering that interstitial glucose
concentrations in skeletal muscle of patients with T2DM during a
glucose tolerance test were similar to blood glucose levels
(10).
MTT assay
The MTT method is a quantitative colorimetric assay
that measures the metabolic activity of cells, which is
proportional to changes in the cell populations. This assay was
used to determine the changes in the cell population and the median
lethal concentration (LC50) of cisplatin under standard
culture (17.5 mmol/l glucose), NG and HG conditions, and using an
osmotic control of glucose 5.6 mmol/l plus mannitol 19.4 mmol/l
(Mannitol). A total of 5,000 cells per well were seeded in 96-well
plates and exposed to different concentrations of cisplatin (15-90
µmol/l). The culture medium was replaced with 200 µl serum-free
DMEM and 50 µl of MTT solution (5 mg/ml) after 48 h of incubation
at 37˚C. Then, the cells were incubated for an additional 4 h, the
medium was removed, and 100 µl of dimethyl sulfoxide was added to
dissolve the formazan crystals. The plate was read at 570 nm
wavelength using a microplate reader iMark (Bio-Rad Laboratories,
Inc.).
Western blotting
The cells were washed with PBS and lysed in RIPA
Buffer (cat. no. 89900; Thermo Fisher Scientific, Inc.), containing
a protease inhibitor cocktail (cat. no. I3786; MilliporeSigma) to
prevent protein degradation. Proteins were quantified by the
Bradford assay, and the cell lysates were stored at -70˚C. Equal
amounts of protein (100 µg per well) were mixed with Laemmli sample
buffer and separated by 10% SDS-polyacrylamide gel electrophoresis.
The transfer was realized in a PVDF membrane (0.8
mm/cm2, 2 h), using Tris buffer 25 mmol/l, glycine 192
mmol/l and methanol 20%. Membranes were then blocked with 5% BSA in
TBS for 1 h at room temperature to prevent non-specific binding.
Subsequently, membranes were incubated overnight at 4˚C with
primary anti-caspase-3 antibody (1:500; cat. no. sc-7272; Santa
Cruz Biotechnology, Inc.) in TBS-T (0.1% Tween-20) containing 1%
BSA. Antibody binding was detected using an HRP-conjugated
secondary antibody (1:5,000; cat. no. 7076S; Cell Signaling
Technology, Inc.), incubated for 1 h at room temperature, followed
by visualization with an enhanced chemiluminescence kit (Clarity
Western ECL substrate, Bio-Rad Laboratories, Inc.), according to
the manufacturer's instructions. The images were obtained using the
C-Digit Blot Scanner (LI-COR Biosciences). The bands were
quantified by densitometry analysis using the Image Studio 4.0
software (LI-COR Biosciences).
RNA extraction
Total RNA was extracted using TRIzol (Invitrogen;
Thermo Fisher Scientific, Inc.), according to the manufacturer's
instructions. RNA quality was verified by 2% agarose gel
electrophoresis, followed by ethidium bromide staining and
visualization under UV light and quantified using a NanoDrop
ND-1000 spectrophotometer (Thermo Fisher Scientific, Inc.).
Hybridization and microarray
analysis
A total of 10 µg of total RNA obtained from cells
cultured in NG and HG media was used for cDNA synthesis and
labeling with the Superscript II kit (Invitrogen; Thermo Fisher
Scientific, Inc.), incorporating dUTP-Cy5 for HG samples and
dUTP-Cy3 for NG (control) samples. The absorbance was measured at
655 nm for Cy5 and 555 nm for Cy3. Fluorophore-labeled cDNAs were
hybridized in similar quantities to the Human 10K 50-mer
oligonucleotide collection (MWG Biotech Oligo Bio Sets).
Microarray images were acquired and quantified using
a ScanArray 4000 scanner with QuantArray software (Packard
BioChips; PerkinElmer, Inc.), and data were analyzed using
Array-Pro Analyzer software (Media Cybernetics, Inc.). Background
correction, normalization, intensity filtering, replicate analysis,
and the selection of differentially expressed genes were performed
using genArise, a free program developed by the Computing Unit of
the Cellular Physiology Institute, National Autonomous University
of Mexico (http://www.ifc.unam.mx/genarise/). The data generated
in the present study were deposited in Gene Expression Omnibus
(GEO) platform under accession number GSE136277 (https://www.ncbi.nlm.nih.gov/geo/query/acc.cgi?acc=GSE136277).
Differentially expressed genes were identified using the following
statistical cutoffs: Z-score ≥2 or ≤-2 for biological significance,
and a false discovery rate (FDR) ≤0.05 to account for multiple
testing. These thresholds were applied from the outset of the
analysis to ensure the robustness of the candidate genes included
in subsequent evaluations.
Reverese transcription-quantitative
PCR (RT-qPCR)
The microarray analysis was validated by RT-qPCR for
frizzled 3 (FZD3) and tetraspanin 1 (TSPAN1). Total
RNA (1 µg) was reverse-transcribed using the SuperScript™ III
First-Strand Synthesis System (Invitrogen; Thermo Fisher
Scientific, Inc.) according to the manufacturer's protocol (50˚C
for 60 min, followed by enzyme inactivation at 70˚C for 15 min).
Alternatively, when individual components were used, reverse
transcription was performed in a 20 µl reaction mixture containing
200 U M-MLV reverse transcriptase, 1X first-strand buffer, 0.5 mM
dNTP mix (Thermo Fisher Scientific, Inc.), 25 µg/ml oligo(dT)
primers (Invitrogen; Thermo Fisher Scientific, Inc.), and 40 U
RNase inhibitor, incubated at 37˚C for 60 min with enzyme
inactivation at 95˚C for 15 min. The resulting cDNA was amplified
using the Maxima SYBR Green/ROX qPCR Master Mix (Fermentas; Thermo
Fisher Scientific, Inc.) on a StepOnePlus™ Real-Time PCR System
(Applied Biosystems; Thermo Fisher Scientific, Inc.).
The resulting cDNA was amplified using the Maxima
SYBR Green/ROX qPCR Master Mix (Fermentas; Thermo Fisher
Scientific, Inc.) in a StepOnePlus™ Real-Time PCR System
(Applied Biosystems; Thermo Fisher Scientific, Inc.) with the
following thermocycling conditions: Initial activation at 95˚C for
15 min; 40 cycles of 95˚C for 15 sec and annealing at the
primer-specific melting temperature for 1 min; followed by a final
extension at 72˚C for 10 min. Expression of the selected genes was
normalized to hypoxanthine-guanine phosphoribosyltransferase
(HPRT). The primer sequences used were as follows:
FZD3 forward, 5'-CATGGAGATGTTTGGTGTTCCTT-3' and reverse,
5'-AAGTCGAGGATATGGCTCATCAC-3'; TSPAN1 forward,
5'-TGGGCTGCTATGGTGCTA-3' and reverse, 5'-TGCAGGTTTCATTGGCTGT-3';
and HPRT forward, 5'-CATTATGCTGAGGATTTGGAAAGG-3' and
reverse, 5'-CTTGAGCACACAGAGGGCTACA-3'. Relative expression levels
were calculated using the 2-ΔΔCq method (11).
HPRT was used as a housekeeping gene because
its expression has been considered moderately stable in BC cell
lines, including MDA-MB-231 cells (12). Under hyperglycemic conditions, Liu
et al (13) identified the
HPRT gene as one of the more reliable reference genes in
retinal pigment epithelial cells, and even HPRT expression
was more stable than ACTB and GAPDH genes.
Additionally, no changes in the expression of this gene under HG
were found in our microarray study.
Immunohistochemical (IHC) expression
of TSPAN-1 and FZD3 in BC tissue
IHC expression of TSPAN1 and FZD3 in BC
tissue. To investigate the protein expression patterns of TSPAN1
and FZD3, representative IHC images of ductal breast carcinoma were
analyzed from 50 samples available in the Human Protein Atlas
database (https://www.proteinatlas.org/), corresponding to women
aged 30-37 years. Adjacent normal breast tissue and adenoma samples
were used as controls.
Gene analysis and Gene Ontology
(GO)
The analysis of genes differentially regulated by HG
and their associated functions, including GO categories (cellular
components, molecular functions and biological processes), as well
as biological pathways, was performed using Gene Set Enrichment
Analysis (GSEA). For this purpose, the WEB-based GEne SeT AnaLysis
Toolkit (WebGestalt; http://www.webgestalt.org/) and WikiPathways Cancer
were employed. Gene sets were considered significant at an FDR
≤0.05. In addition, Kyoto Encyclopedia of Genes and Genomes (KEGG)
pathway analysis (https://www.genome.jp/kegg/pathway.html) was used to
determine the interactions of differentially expressed genes within
metabolic and signaling pathways.
Functional association network and
selection of genes involved in chemoresistance
All the overexpressed and downregulated genes
associated with cancer were uploaded into the program STRING
(https://string-db.org/), which predicts the
protein-protein interaction (PPI) network. The confidence score for
displaying interaction was 0.9. The formatted PPI networks were
uploaded and visualized with the Cytoscape software (version
3.10.1) (14). Due to the
complexity of this network, the CytoHubba plugin was used to select
the 50 nodes with the highest degree score, and their interaction
network was constructed (15).
Furthermore, the overexpressed genes with at least 2-fold change
and their involvement in chemoresistance, according to scientific
studies (16-19),
were selected, and their possible participation in HG-dependent
chemoresistance was considered.
Kaplan-Meier (KM) plot analysis
Overall survival (OS) analysis was performed for the
key genes YBX3 (also known as CSDA), amphiregulin
(AREG), amyloid precursor protein (APP) and
N-cadherin (CDH2) using the KM Plotter database (20); (https://kmplot.com) to assess the prognostic value of
the genes associated with cisplatin resistance in BC. A cohort of
153 patients with TNBC who were split into high and low expression
groups was selected, considering the median expression of the gene.
OS plots were created using data from BC samples negative for
estrogen, progesterone and HER2 receptors, as detected by IHC and
microarray. The hazard ratio (HR) with 95% confidence intervals
(CIs) and log-rank P-values were calculated.
Coexpression analysis
To evaluate whether the selected genes are
coexpressed in a cohort of patients with BC and the potential
molecular and regulatory interactions between proteins codified by
them, the coexpression of AREG, FZD3, APP and
CDH2 with YBX3 was performed using R2: Genomics
Analysis and Visualization Platform (http://r2.amc.nl)
on TCGA Breast Invasive Carcinoma (BRCA) datasets (1,097 samples)
with R2 internal identifier ps_avgpres_tcgabrca1097_tcgars. Pearson
correlation coefficients and associated P-values were calculated,
with scatter plots and linear regression used for
visualization.
Statistical analysis
All experiments were performed in at least three
independent replicates. Data are expressed as the mean ± SD.
One-way ANOVA followed by Tukey's multiple comparison test was used
for MTT, western blotting and RT-qPCR analyses, and performed using
GraphPad Prism 8.02 software (Dotmatics). P≤0.05 was considered to
indicate a statistically significant difference. Microarray and
GSEA analyses were considered significant with fold-change ≥1.5 and
FDR≤0.05, respectively. Co-expression analyses of AREG,
FZD3, APP and CDH2 with YBX3 were
performed using the R2 Genomics platform https://hgserver1.amc.nl/cgi-bin/r2/main.cgi, and
survival analyses were conducted using the KM Plotter, with HRs,
95% CIs and log-rank P-values. P≤0.05 was considered to indicate a
statistically significant difference.
Results
Previously, it was found that HG increases cell
population growth, migration, invasion and EMT in MDA-MB-231 cells
(4). In the present study, the
effect of HG was analyzed on cisplatin resistance, cell death and
changes in gene expression. Additionally, it was analyzed how the
change in gene expression is associated with a chemoresistant and
aggressive phenotype.
Hyperglycemia-induced resistance to
cisplatin
To investigate whether HG induces drug resistance,
the LC50 of cisplatin for MDA-MB-231 cells was
determined under standard culture conditions (glucose 17.5 mmol/l),
NG, NG with mannitol (osmotic control) and HG. The osmotic control
group showed no difference compared with the NG group. Cell
viability progressively decreased as cisplatin concentration
increased from 15 to 90 µmol/l in a concentration-dependent manner,
with LC50 values of 60, 15 and 75 µmol/l for standard,
NG and HG conditions, respectively. These findings indicated that
cells cultured under HG and standard conditions were more resistant
to cisplatin compared with those cultured under NG. Thus, in the
present study, cisplatin resistance was directly proportional to
glucose concentration (Fig. 1A and
B).
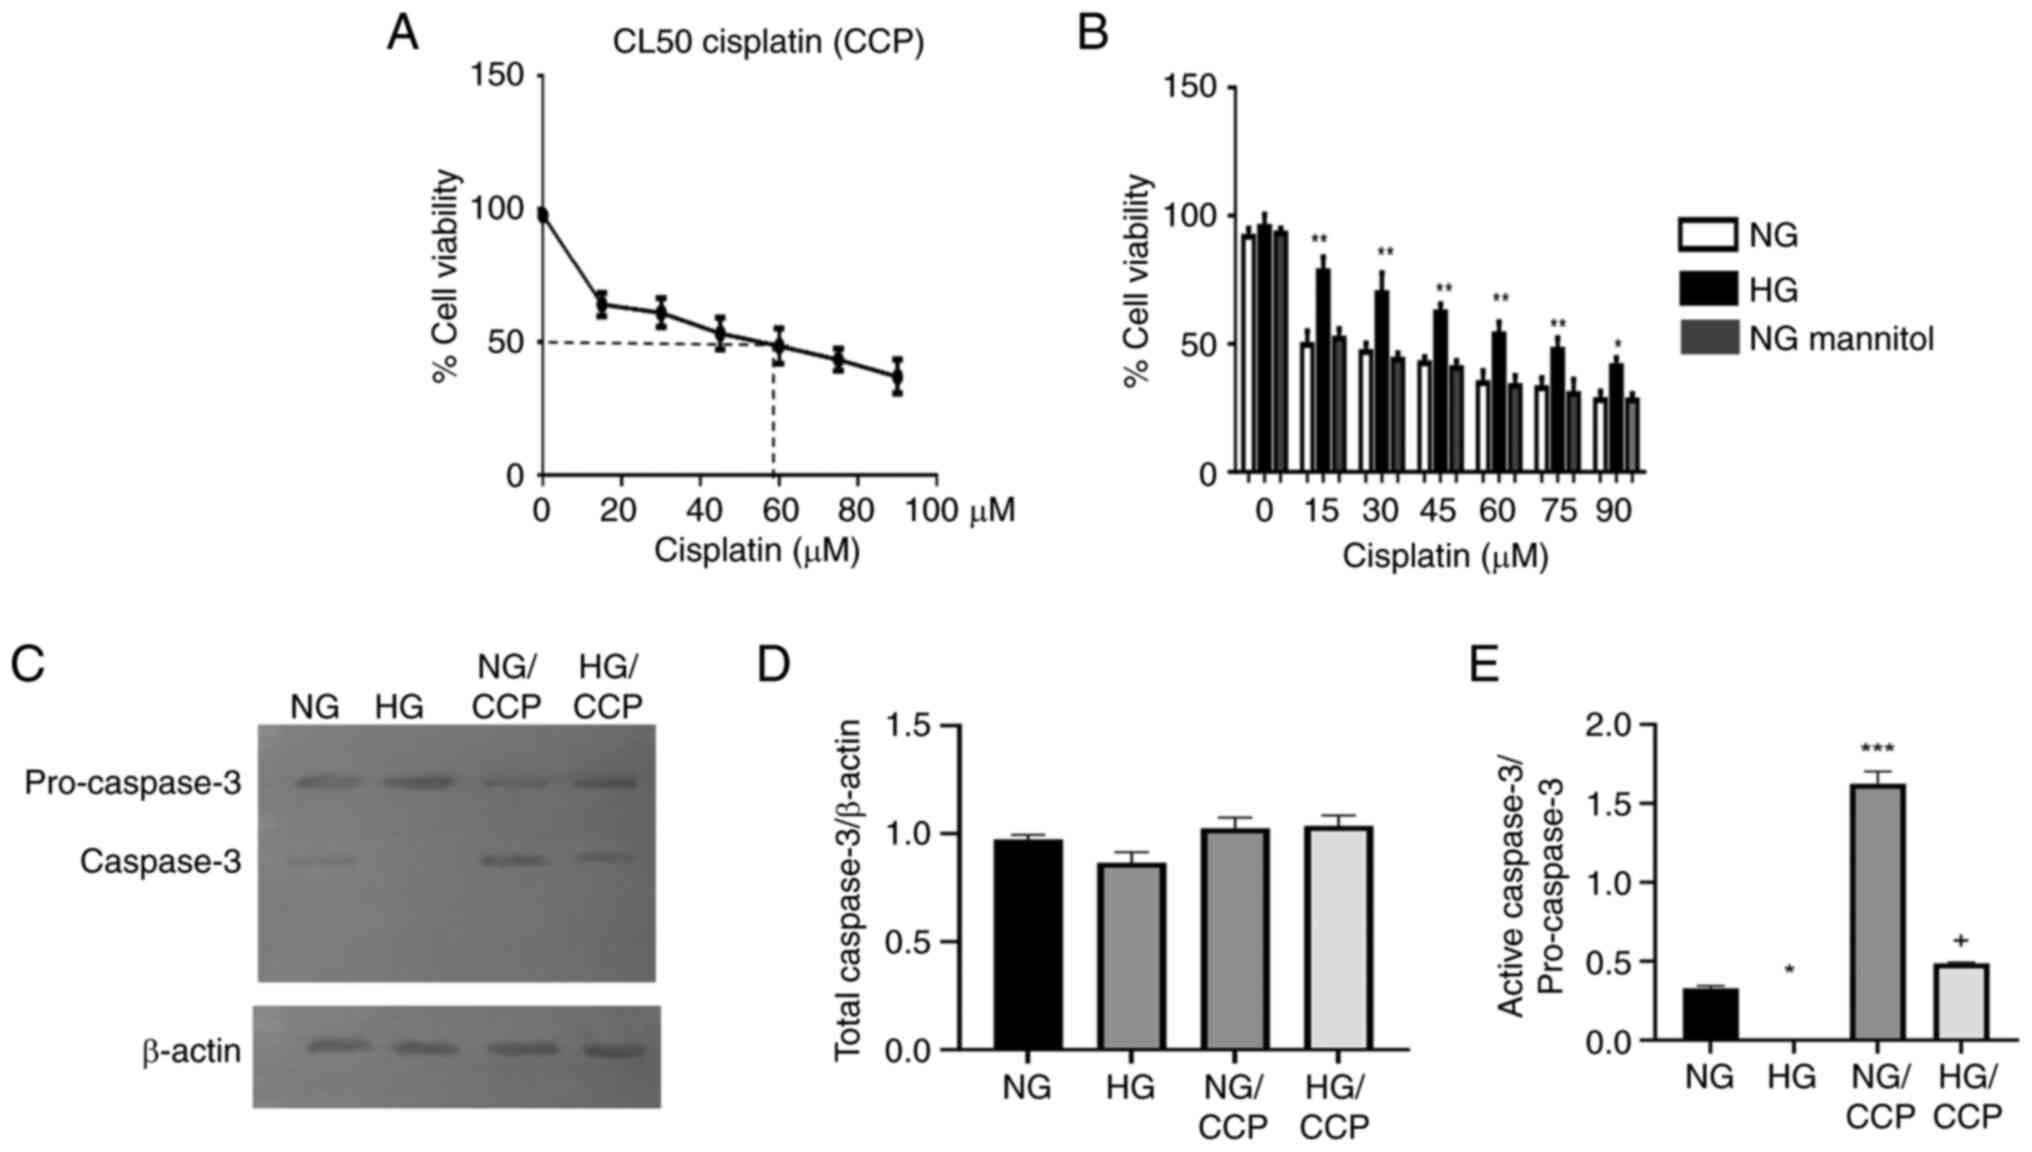 | Figure 1HG attenuates the effect of cisplatin
on the cell population and prevents apoptosis. (A and B) MDA-MB-231
cells were treated for 48 h with CCP. The growth of the cell
population was evaluated by the MTT assay in standard, (NG), HG,
and mannitol osmotic control (NG Mannitol) culture conditions.
*P≤0.01 and **P≤0.001 vs. the respective NG
for each cisplatin concentration. No significant differences were
observed between the NG and mannitol-treated groups. (C-E)
Additionally, the activation of caspase 3 was evaluated by western
blotting and densitometry in lysates of cells cultured for 48 h, in
NG and HG conditions, and treated with cisplatin (NG/CCP and
HG/CCP). The intensities of the bands were calculated after
background subtraction, and the sum of the bands (total caspase 3)
and active caspase 3 were normalized to (D) β-actin and (E)
procaspase 3, respectively. Data are presented as the mean ± SD of
three independent experiments. *P≤0.05 and
***P≤0.001 vs. NG, and + P≤0.001 vs. HG.
HG, high glucose; NG, normal glucose; CCP, cisplatin. |
Hyperglycemia prevents the apoptosis
induced by cisplatin
Apoptosis induced by cisplatin under normoglycemic
and hyperglycemic conditions was evaluated in MDA-MB-231 cells by
western blot analysis of caspase-3 activation. The caspase 3
antibody recognizes two band, one of higher molecular weight (MW)
corresponding with the procapase 3, and other of lower MW
corresponding to the cleaved/active caspase 3 (Fig. 1C). Both NG and HG groups exhibited
similar levels of total caspase 3 independently of the cisplatin
treatment (Fig. 1D). Whereas,
cisplatin induced a significant increase in the proportion of
active caspase 3 in both NG (P≤0.001) and HG (P≤0.001) conditions
(Fig. 1E). Notably, the NG and
NG/cisplatin groups displayed higher levels of active caspase-3
than the corresponding HG and HG/cisplatin groups (Fig. 1E). These results indicated that HG
attenuated cisplatin-induced apoptosis, thereby promoting cisplatin
chemoresistance.
Overall changes in gene
expression
Considering an expression change equal to or greater
than 1.5-fold, 1,099 genes were differentially expressed. Among
these, 457 were overexpressed, while 642 were downregulated under
the HG condition. The top 15 overexpressed and downregulated genes
in the HG microenvironment are presented in Table I. All differentially expressed genes
are listed in Tables SI and
SII.
 | Table ITop 15 upregulated and downregulated
genes in a hyperglycemic environment. |
Table I
Top 15 upregulated and downregulated
genes in a hyperglycemic environment.
| Upregulated |
|---|
| ID | Genes | Z score | Full name |
|---|
| NM_032741 | AGPAT1 | 4.152511 |
1-Acylglycerol-3-phosphate
O-acyltransferase 1 |
| NM_003043 | SLC6A6 | 4.058222 | Taurine
transporter |
| NM_005727 | TSPAN-1 | 3.811546 | Tetraspanin 1 |
| NM_004189 | SOX14 | 3.648091 | SRY-box 14 |
| NM_021625 | TRPV4 | 3.609894 | Transient receptor
potential cation channel subfamily V member 4 |
| NM_016176 | SDF4 | 3.445534 | Stromal cell
derived factor 4 |
| NM_006213 | PHKG1 | 3.320789 | Phosphorylase
kinase catalytic subunit gamma 1 |
| NM_020649 | CBX8 | 3.251316 | Chromobox 8 |
| NM_001252 | TNFSF7 | 3.129304 | CD70 molecule |
| NM_005919 | MEF2B | 3.041269 | BORCS8-MEF2B
readthrough |
| NM_002600 | PDE4B | 3.035975 | Phosphodiesterase
4B |
| NM_002150 | HPD | 2.983852 |
4-Hydroxyphenylpyruvate dioxygenase |
| NM_014610 | GANAB | 2.950495 | Glucosidase II
alpha subunit |
| NM_017412 | FZD3 | 2.854118 | Frizzled class
receptor 3 |
| Downregulated |
| NM_006544 | SEC10L1 | -4.523611 | Exocyst complex
component 5 |
| NM_012261 | LAMP5 | -4.45501 | Lysosomal
associated membrane protein family member 5 |
| NM_012070 | ATRN | -4.333672 | Attractin |
| NM_004185 | WNT2B | -3.908675 | Wnt family member
2B |
| NM_001697 | ATP5O | -3.87772 | ATP synthase, H+
transporting, mitochondrial F1 complex, O subunit |
| NM_053004 |
FLJ21125 | -3.814458 | G protein subunit
beta 1 like |
| NM_003692 | TMEFF1 | -3.744839 | Transmembrane
protein with EGF like and two follistatin like domains 1 |
| NM_006866 | LILRB1 | -3.717488 | Leukocyte
immunoglobulin like receptor A2 |
| NM_003072 | SMARCA4 | -3.709549 | SWI/SNF related,
matrix associated, actin-dependent regulator of chromatin,
subfamily A, member 4 |
| NM_021176 | G6PC2 | -3.584369 |
Glucose-6-phosphatase catalytic subunit
2 |
| NM_004937 | CTNS | -3.50955 | Cystinosin,
lysosomal cystine transporter |
| NM_004208 | PDCD8 | -3.506222 | Apoptosis-inducing
factor, mitochondrion-associated, 1 |
| NM_013335 | GMPPA | -3.505725 | GDP-mannose
pyrophosphorylase A |
| NM_017882 | CLN6 | -3.495366 |
Ceroid-lipofuscinosis, neuronal 6, late
infantile, variant |
| NM_022444 | SLC13A1 | -3.435806 | Solute carrier
family 13 (sodium/sulfate symporters), member 1 |
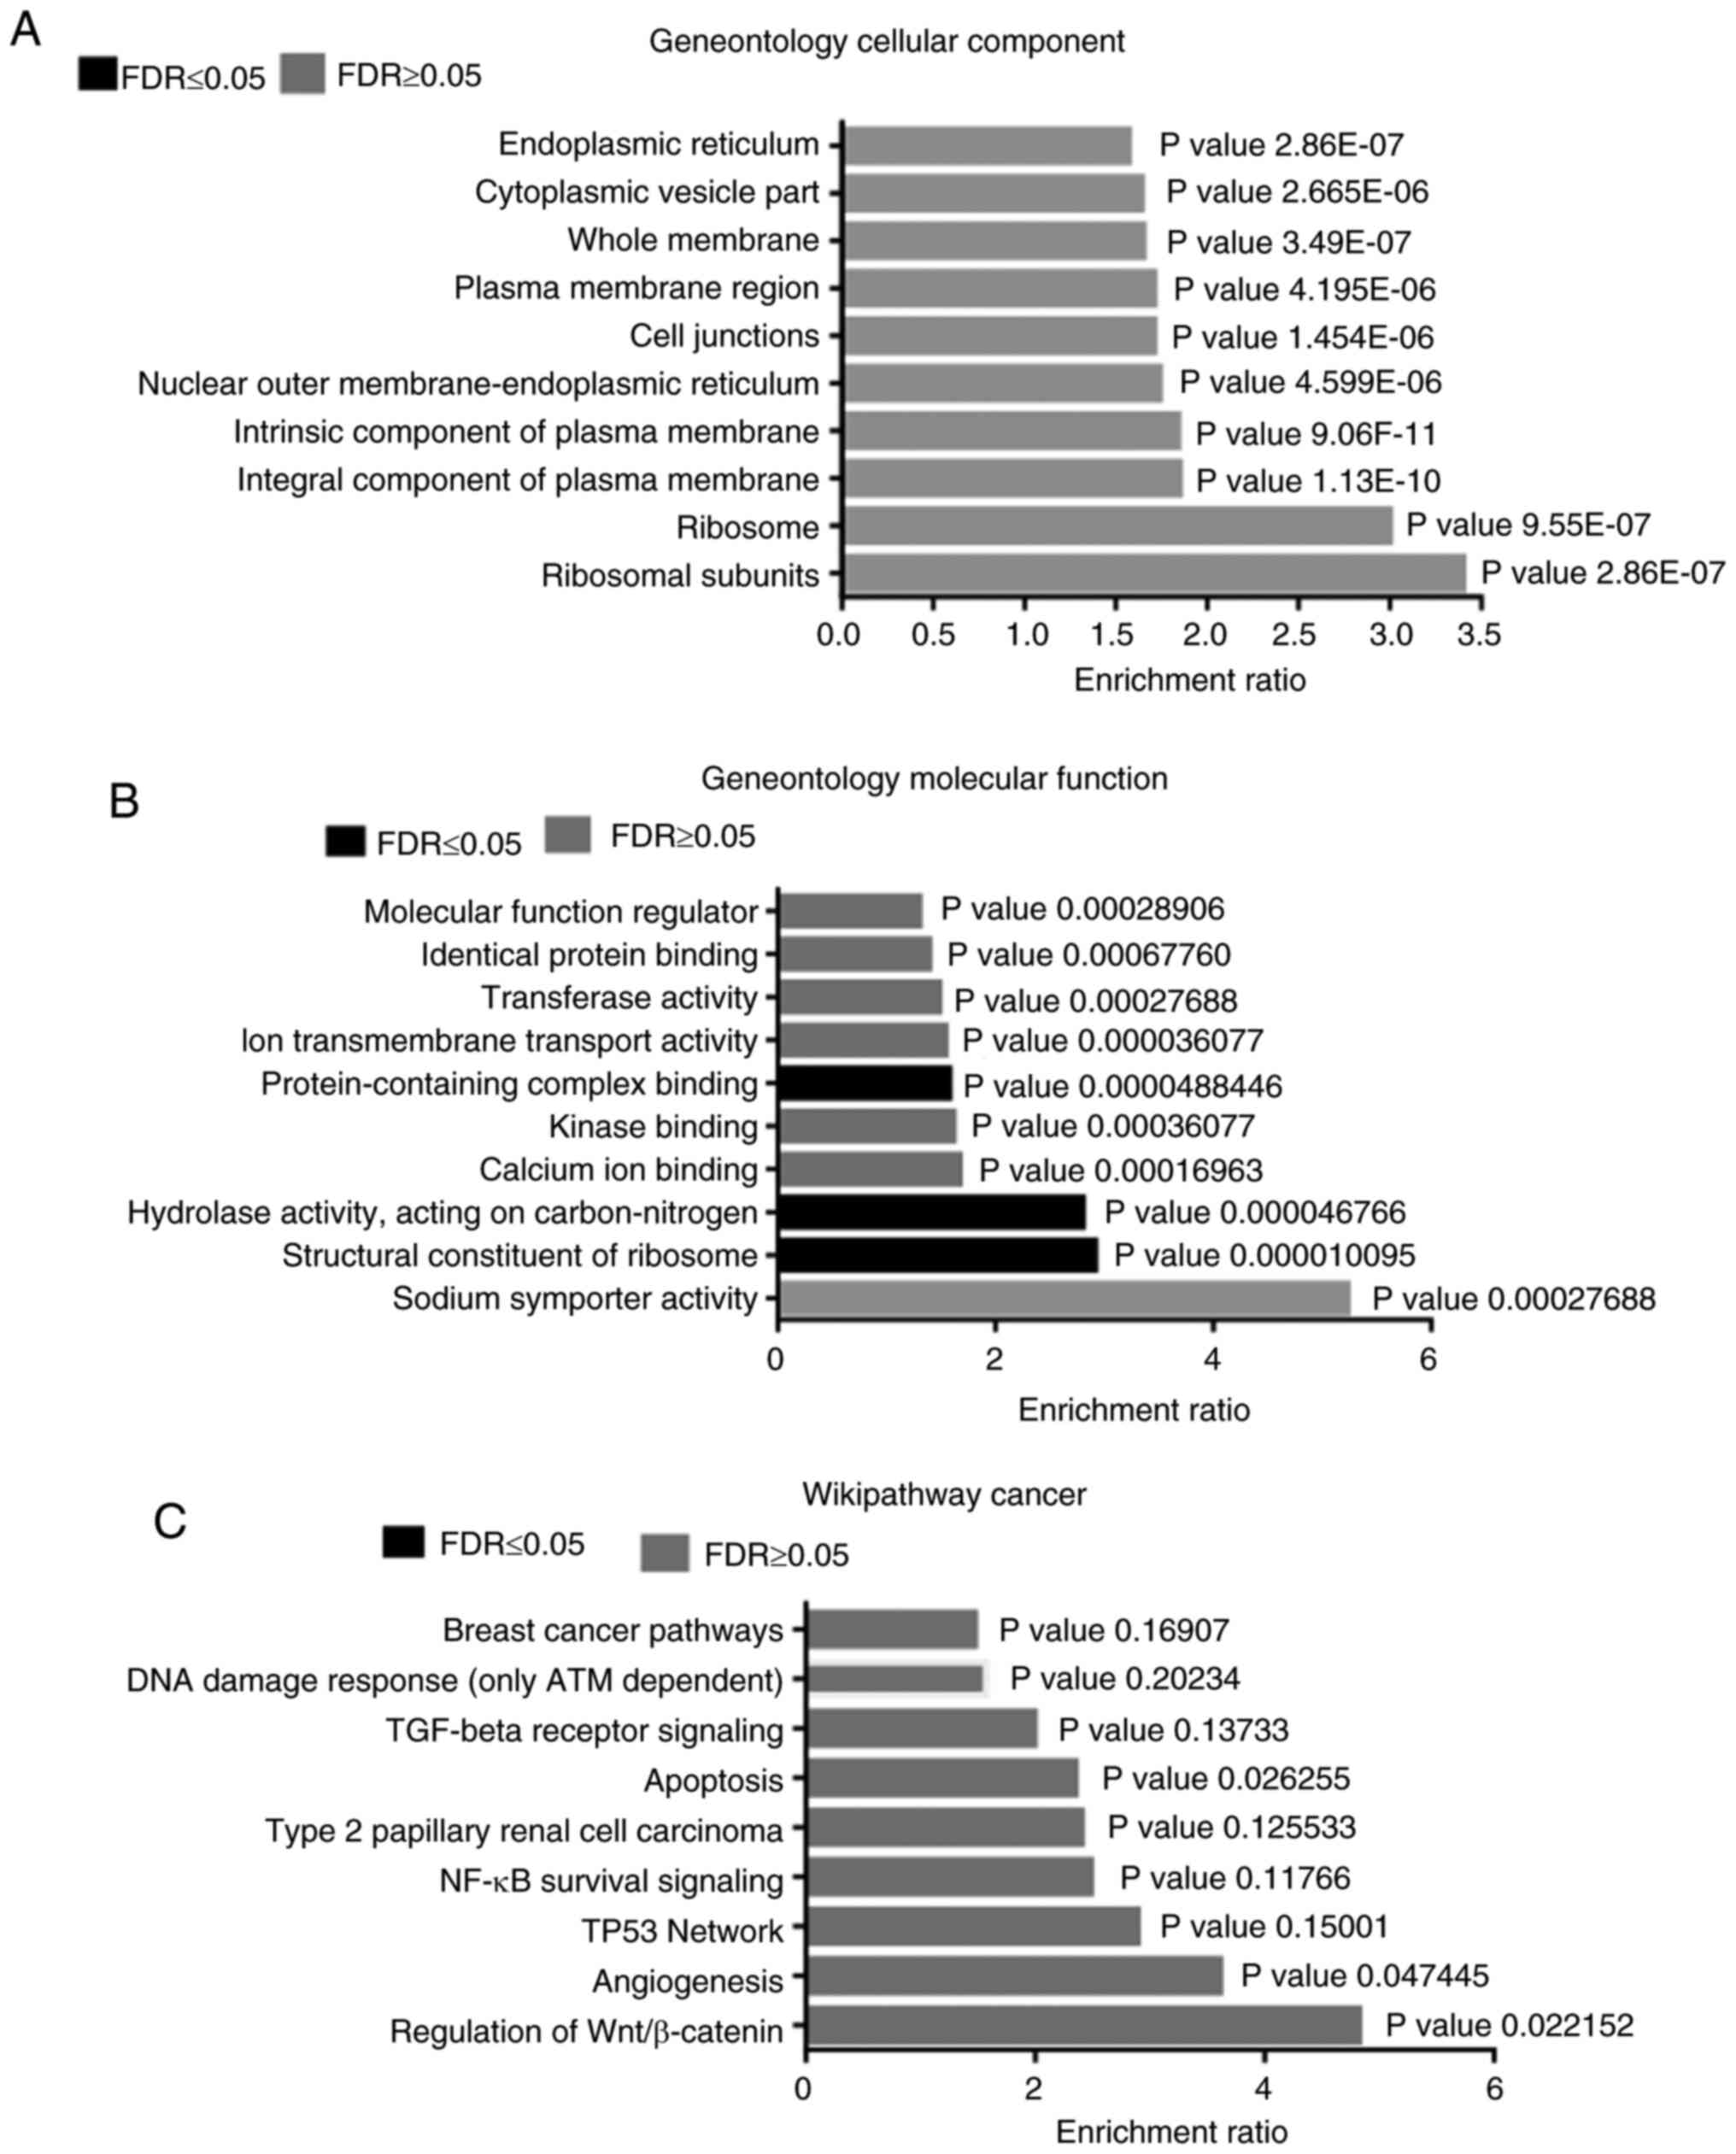
GSEA
Microarray data were subjected to functional
enrichment analysis using WEB-Gestalt and the WikiPathways
database. In the cellular component analysis, an activation of
genes that encode protein constituents of the ribosomes, plasma
membrane, cell junctions and endoplasmic reticulum was found
(Fig. 2A). This was also reflected
in the molecular function analysis, where changes in structural
constituents of ribosomes, sodium symporter activity and ion
transmembrane transport were identified. In addition, changes in
hydrolase activity, calcium ion binding, kinase binding and
protein-containing complex binding were observed (Fig. 2B). According to the enrichment
analysis, the following signaling pathways were enriched in a
hyperglycemic microenvironment: Wnt/β-catenin, angiogenesis, TP53
network, NF-κB survival signaling, apoptosis, TGF-beta receptor
signaling and ATM-dependent DNA damage response (Fig. 2C).
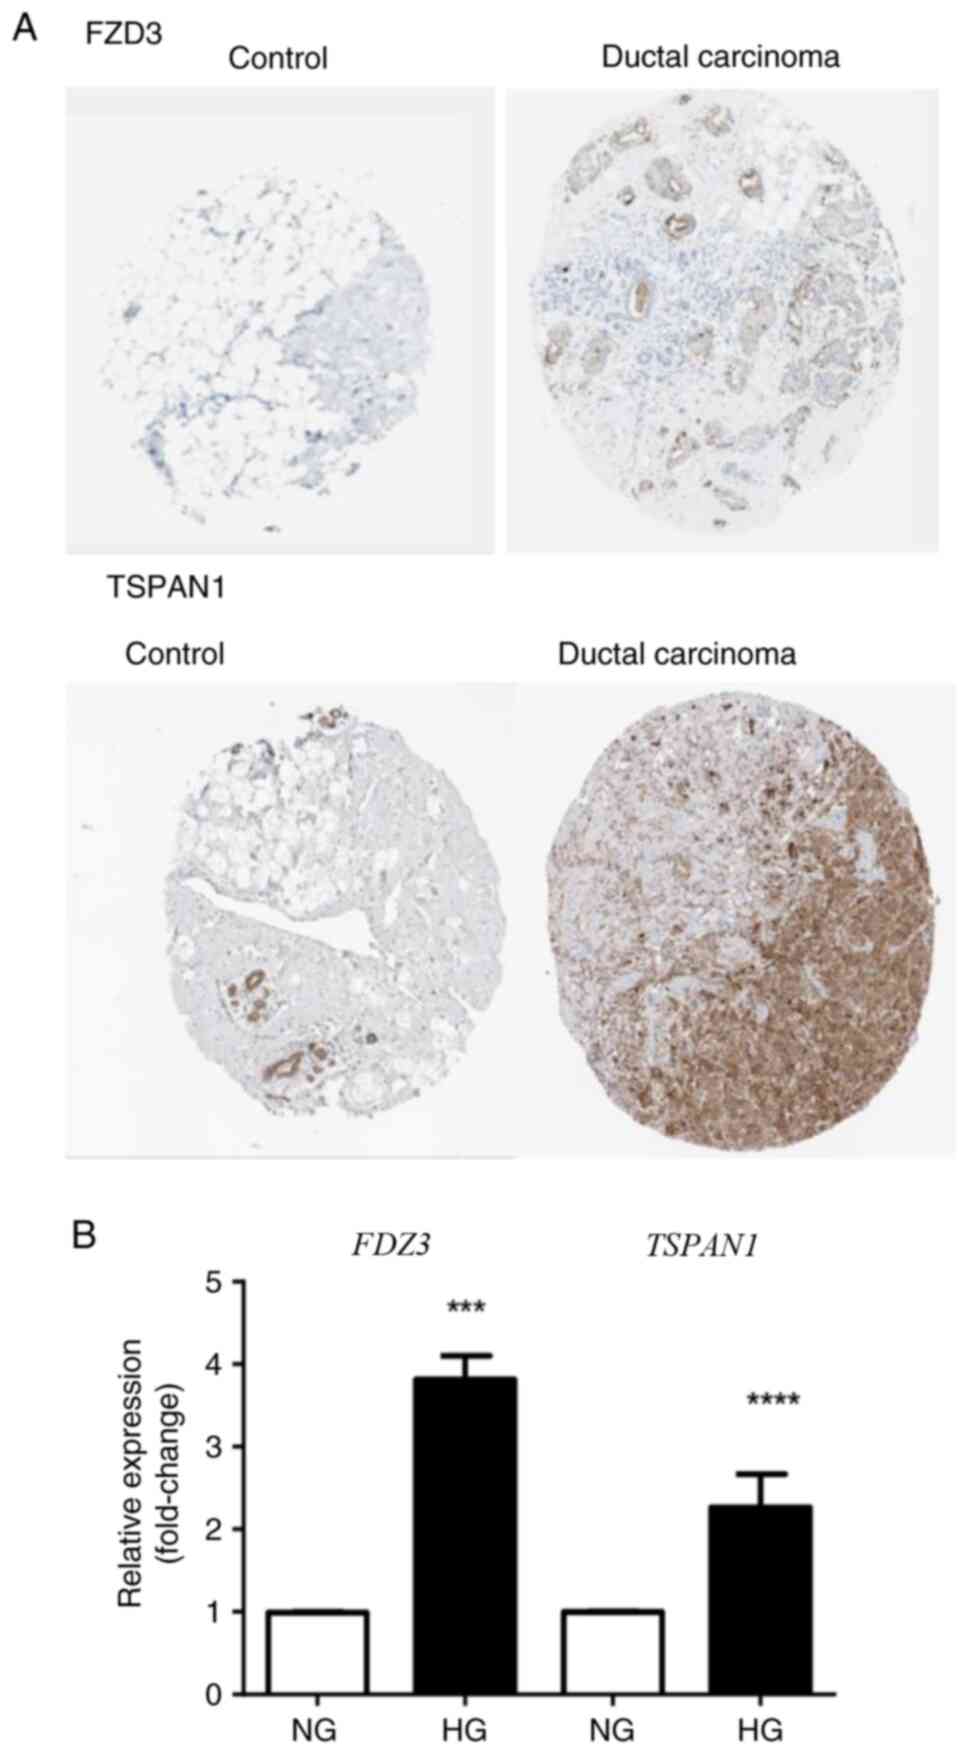
Gene validation
The expression of TSPAN1 and FZD3 was
evaluated by RT-qPCR to validate the microarray analysis. Both
genes are associated with an aggressive BC phenotype and showed
some of the highest Z-scores (3.81 for TSPAN1 and 2.85 for
FZD3). In particular, FZD3, a protein of the Wnt/β-catenin
pathway, exhibited the highest Z-score. RT-qPCR analysis confirmed
that FZD3 expression under HG conditions was 3.81-fold
higher compared with NG (Fig. 3).
Similarly, TSPAN1 expression under HG conditions was
2.26-fold higher than under NG conditions, consistent with the
microarray results (Fig. 3). These
findings are also supported by data from the Human Protein Atlas,
which shows higher expression of TSPAN1 and FZD3 proteins in BC
tissues compared with healthy mammary tissue (Fig. 3).
Hyperglycemia alters genes associated
with metabolism
According to the aforementioned analysis with the
KEGG pathways program, it was found that a high number of genes of
transmembrane transporters and ribosomal proteins were
differentially expressed in HG conditions (Table II). Additionally, several genes
associated with other metabolic processes were found, including: i)
Synthesis of DNA, RNA and proteins; and ii) purine, pyrimidine and
lipid metabolism. Noteworthy, the upregulation of some genes of
electron chain transport or ECT (COX41, COX61,
COX7B and NDUFB3) indicated an increase in the
electron flux through this chain. However, subunits ATP5O
and ATP5D of the ATP synthase were downregulated, suggesting
the uncoupling between the ECT and ATP synthesis.
| Table IIKyoto Encyclopedia of Genes and
Genomes pathways associated with genes regulated by
hyperglycemia. |
Table II
Kyoto Encyclopedia of Genes and
Genomes pathways associated with genes regulated by
hyperglycemia.
| Metabolic or
signaling pathway | Total genes | Genes
upregulated | Genes
downregulated |
|---|
| Transmembrane
transport | 27 | SLC6A6,
SLC44A4, SLC35F2, SLC16A8, SLC13A2,
SLC6A20, SLC23A2, SLC25A19, SLC39A7,
SLC22A18AS, SLC25A5 | SLC13A1,
SLC22A7, SLC26A3, SLC7A7, SLC2A8,
SLC35B3, SLC6A12, SLC1A7, SLC39A6,
SLC39A4, SLC35C2, SLC38A3, SLC16A10,
SLC44A2, SLC25A17, SLC28A2 |
| Cytokine-cytokine
receptor interaction | 24 | CXCL1,
CXCR3, PDGFRA, IL9R, IL21R,
IL1RA, EPOR, IL17RA, IL17RB,
TNFSF7, CCL20, IL32 | TNIP2,
CCR9, CXCR2, CXCR4, CXCR6,
CCRL1, TGFBR2, TGFBR1, CXCL6,
IFNA8, IL4, IL17C |
| Regulation of
cytoskeleton | 24 | CHRM4,
FGFR1, PDGFRA, VAV3, CFL, ITGB4,
RASAL-1, RIN1, CDC42BPA, RAB9A,
RHOB | PIK3C2B,
PIK3R5, CHRM1, FGF20, FGFR2,
ACTN3, VCL, VAV2, ILK, ARHGDIB,
RDX, RRAS, RASSF7 |
| Ribosomal proteins
(extra and intramitochondrial) | 20 | RPS13,
RPS17, RPS21, RPS3A, RPS8, RPS7,
RPL23A, RPL13A, RPL15, RPL9,
MRPS18B, MRPS7, MRPL15, MRLP17,
MRPL49 | MRPS31,
MRPL11, RPL23, MRPL33, MRPL42 |
| Purine, pyrimidine
metabolism/nucleic acid synthesis | 22 | XDH,
POLA2, POLG, GUCY2F, PDE1B,
PAPSS2, PDE2A, UPB1, PDE4B,
ADCY7, NME1, ECGF, NOC3L,
ATIC | CDA,
NT5E, AK3, AMPD2, AMPD3, ADA2,
MTAP, DNPH1 |
| MAPK | 20 | FGFR1,
PDGFRA, MKNK, DUSP4, RIN1,
MAPK8IP1, RASGRF1 | PPP3C,
FGF20, TGFBR2, MAP2K3, MAPKAPK5,
MEF2C, BLK, DUSP5, TGFBR1,
FGFR2, RRAS, RAPGEF2, RASSF7 |
| Ras | 19 | FGFR1,
PDGFRA, TEK, RIN1, RASGRF1,
SPEC1, RASAL-1, RIN1 | PIK3C2B,
PIK3R5, FGF20, GNB1, FGFR2,
ANGPT1, RRAS, RALA, RAPGEF2,
RASSF7, PLAAT1 |
| Apoptosis | 19 | TRAF1,
CASP10, XIAP, BCL2L2, BIRC2,
RHOB, PERP | PTPN13,
PIK3C2B, PIK3R5, PDCD8, PDCD5,
BIRC3, BIK, DAPK1, CCAR2, BNIP1,
TNIP2, RASSF7 |
| Wnt β-catenin | 17 | FZD3,
FZD4, LPR8, DVL2, WNT1, LEF1,
DKKL1, RHOB, PPP2R3B | WNT2B,
TGFBR2, BMP2, TGFBR1, ID1,
PPP3CA, TBL1, CAMK2B |
| Focal adhesion | 17 | PDGFRA,
XIAP, VAV3, LAMC2, ITGB4,
PPP2R5B, PPP2R5C, RASGRF1 | PIK3C2B,
PIK3R5, THBS2S, ACTN3, VCL, BLK,
VAV2, BIRC2, ILK |
| Glycerophospholipid
metabolism | 16 | AGPAT1,
MBOAT7, CEPT1, GLA, PNLIPRP2,
ACHE, LYPLA1, PLA2G2A | AGPAT4,
CDIPT, CHPT1, PCYT1B, PLA2G2D,
TAZ, PAFAH1B3, PLAAT1 |
| Jak-STAT | 14 | PIM1,
PIAS1, IL9R, IL21R, EPOR,
PTPN6 | PIK3C2B,
PIK3R5, BLK, SOCS5, IFNA8, IL4,
IL17C, GFAP |
| Oxidative
phosphorylation | 10 | COX4I1,
COX6A1, COX7B, NDUFB3 | ATP5O,
ATP5D, COX7A1, NDUFA13, NDUFB4,
E2IG2 |
Hyperglycemia alters genes associated
with apoptosis and cell survival
On the other hand, it was found that HG induces
increased expression of some genes that promote cell survival
(TNFSF7 and TRAF1) (21) or prevent apoptosis (XIAP and
BCL2L2) (22,23). Additionally, HG leads to low
expression of proapoptotic factors (BIK, PDCD8, PDCD5, BNIP1,
DAPK1 and CCAR2) (24-26).
These data indicated that HG prevents BC cell death and promotes
cell survival under stress conditions, such as the presence of
chemotherapeutic agents, such as cisplatin (Fig. 1).
Signal pathways associated with the
adaptation to hyperglycemia
The KEGG pathways program indicates that
Wnt-β-catenin, Jak/STAT and Ras-MAPK are involved in the action of
HG, together with processes such as cytokine-cytokine receptor
interaction, regulation of actin cytoskeleton and focal adhesion
(Table II). These results and the
PPI analysis suggested that the Wnt-β-catenin signaling has a
significant role in the action of HG.
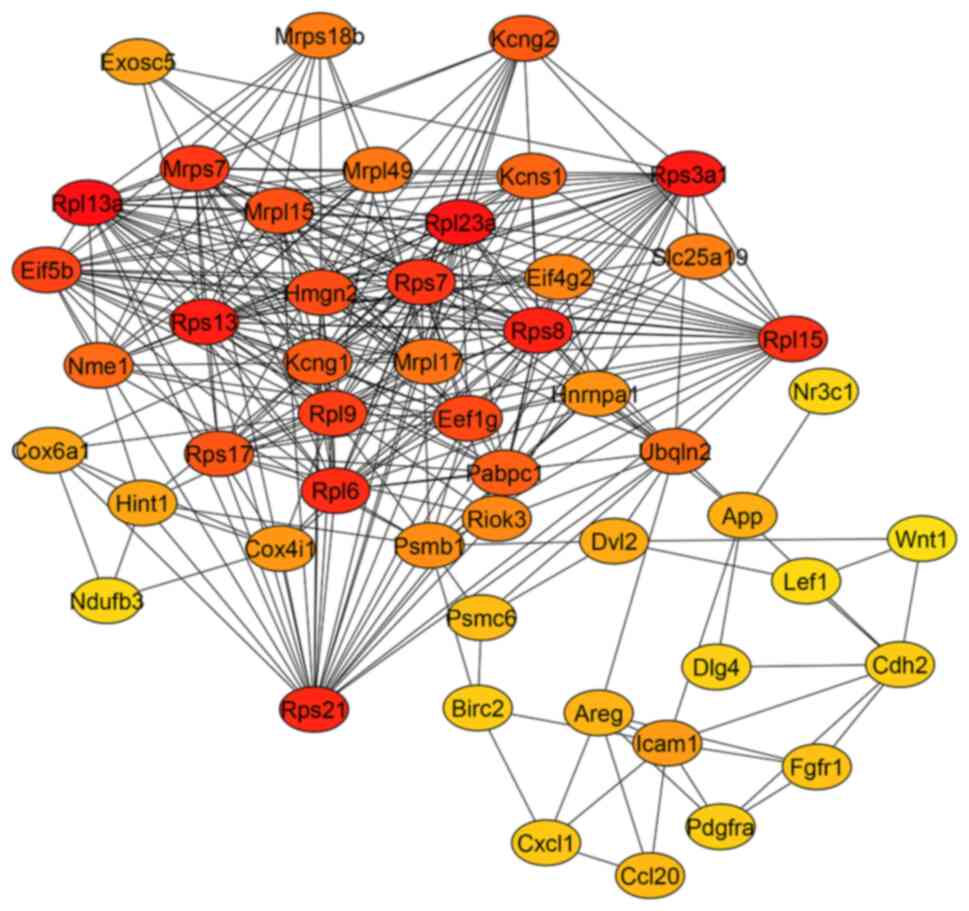
Selection of hub genes and PPI
In the PPI network of overexpressed genes
constructed by Cytoscape, a total of 303 nodes and 834 edges were
arranged (data not shown); further analysis by cytoHubba based on
this network revealed a network with 50 principal nodes (Fig. 4). Between the highest degree score
hubs, genes for ribosomal proteins were found, such as
RPL13a, RPL23a, RPS3a1, RPS13,
RPS8, RPS21, RPL6, RPL15, RPS7,
MRPS7 and RPL9 with a high degree of interaction
shown in red (Fig. 3). Interacting
with these nodes genes coding for transcription and protein
synthesis (PABPC1, EIF4G2, EIF5B, EEF1G
and HNRNPA1), potassium channels (KCNG2, KCNG1
and KCNS1) and metabolism (COX4I1, COX6A1 and
NDUFB3) were found. Other important hubs were associated
with the Wnt/canonical pathway, such as WNT-1, DVL2
and LEF1. Other proteins related to cancer progression were
also represented (APP, AREG and CDH2). It is
noteworthy that ribosomal proteins were overrepresented and had the
highest degree scores (red and orange in Fig. 4). Because of this, nodes of
important proteins had lower degree scores (orange and yellow in
Fig. 4). The PPI network according
to the enrichment analysis indicates the relevance of Wnt/β-catenin
(Fig. 2C).
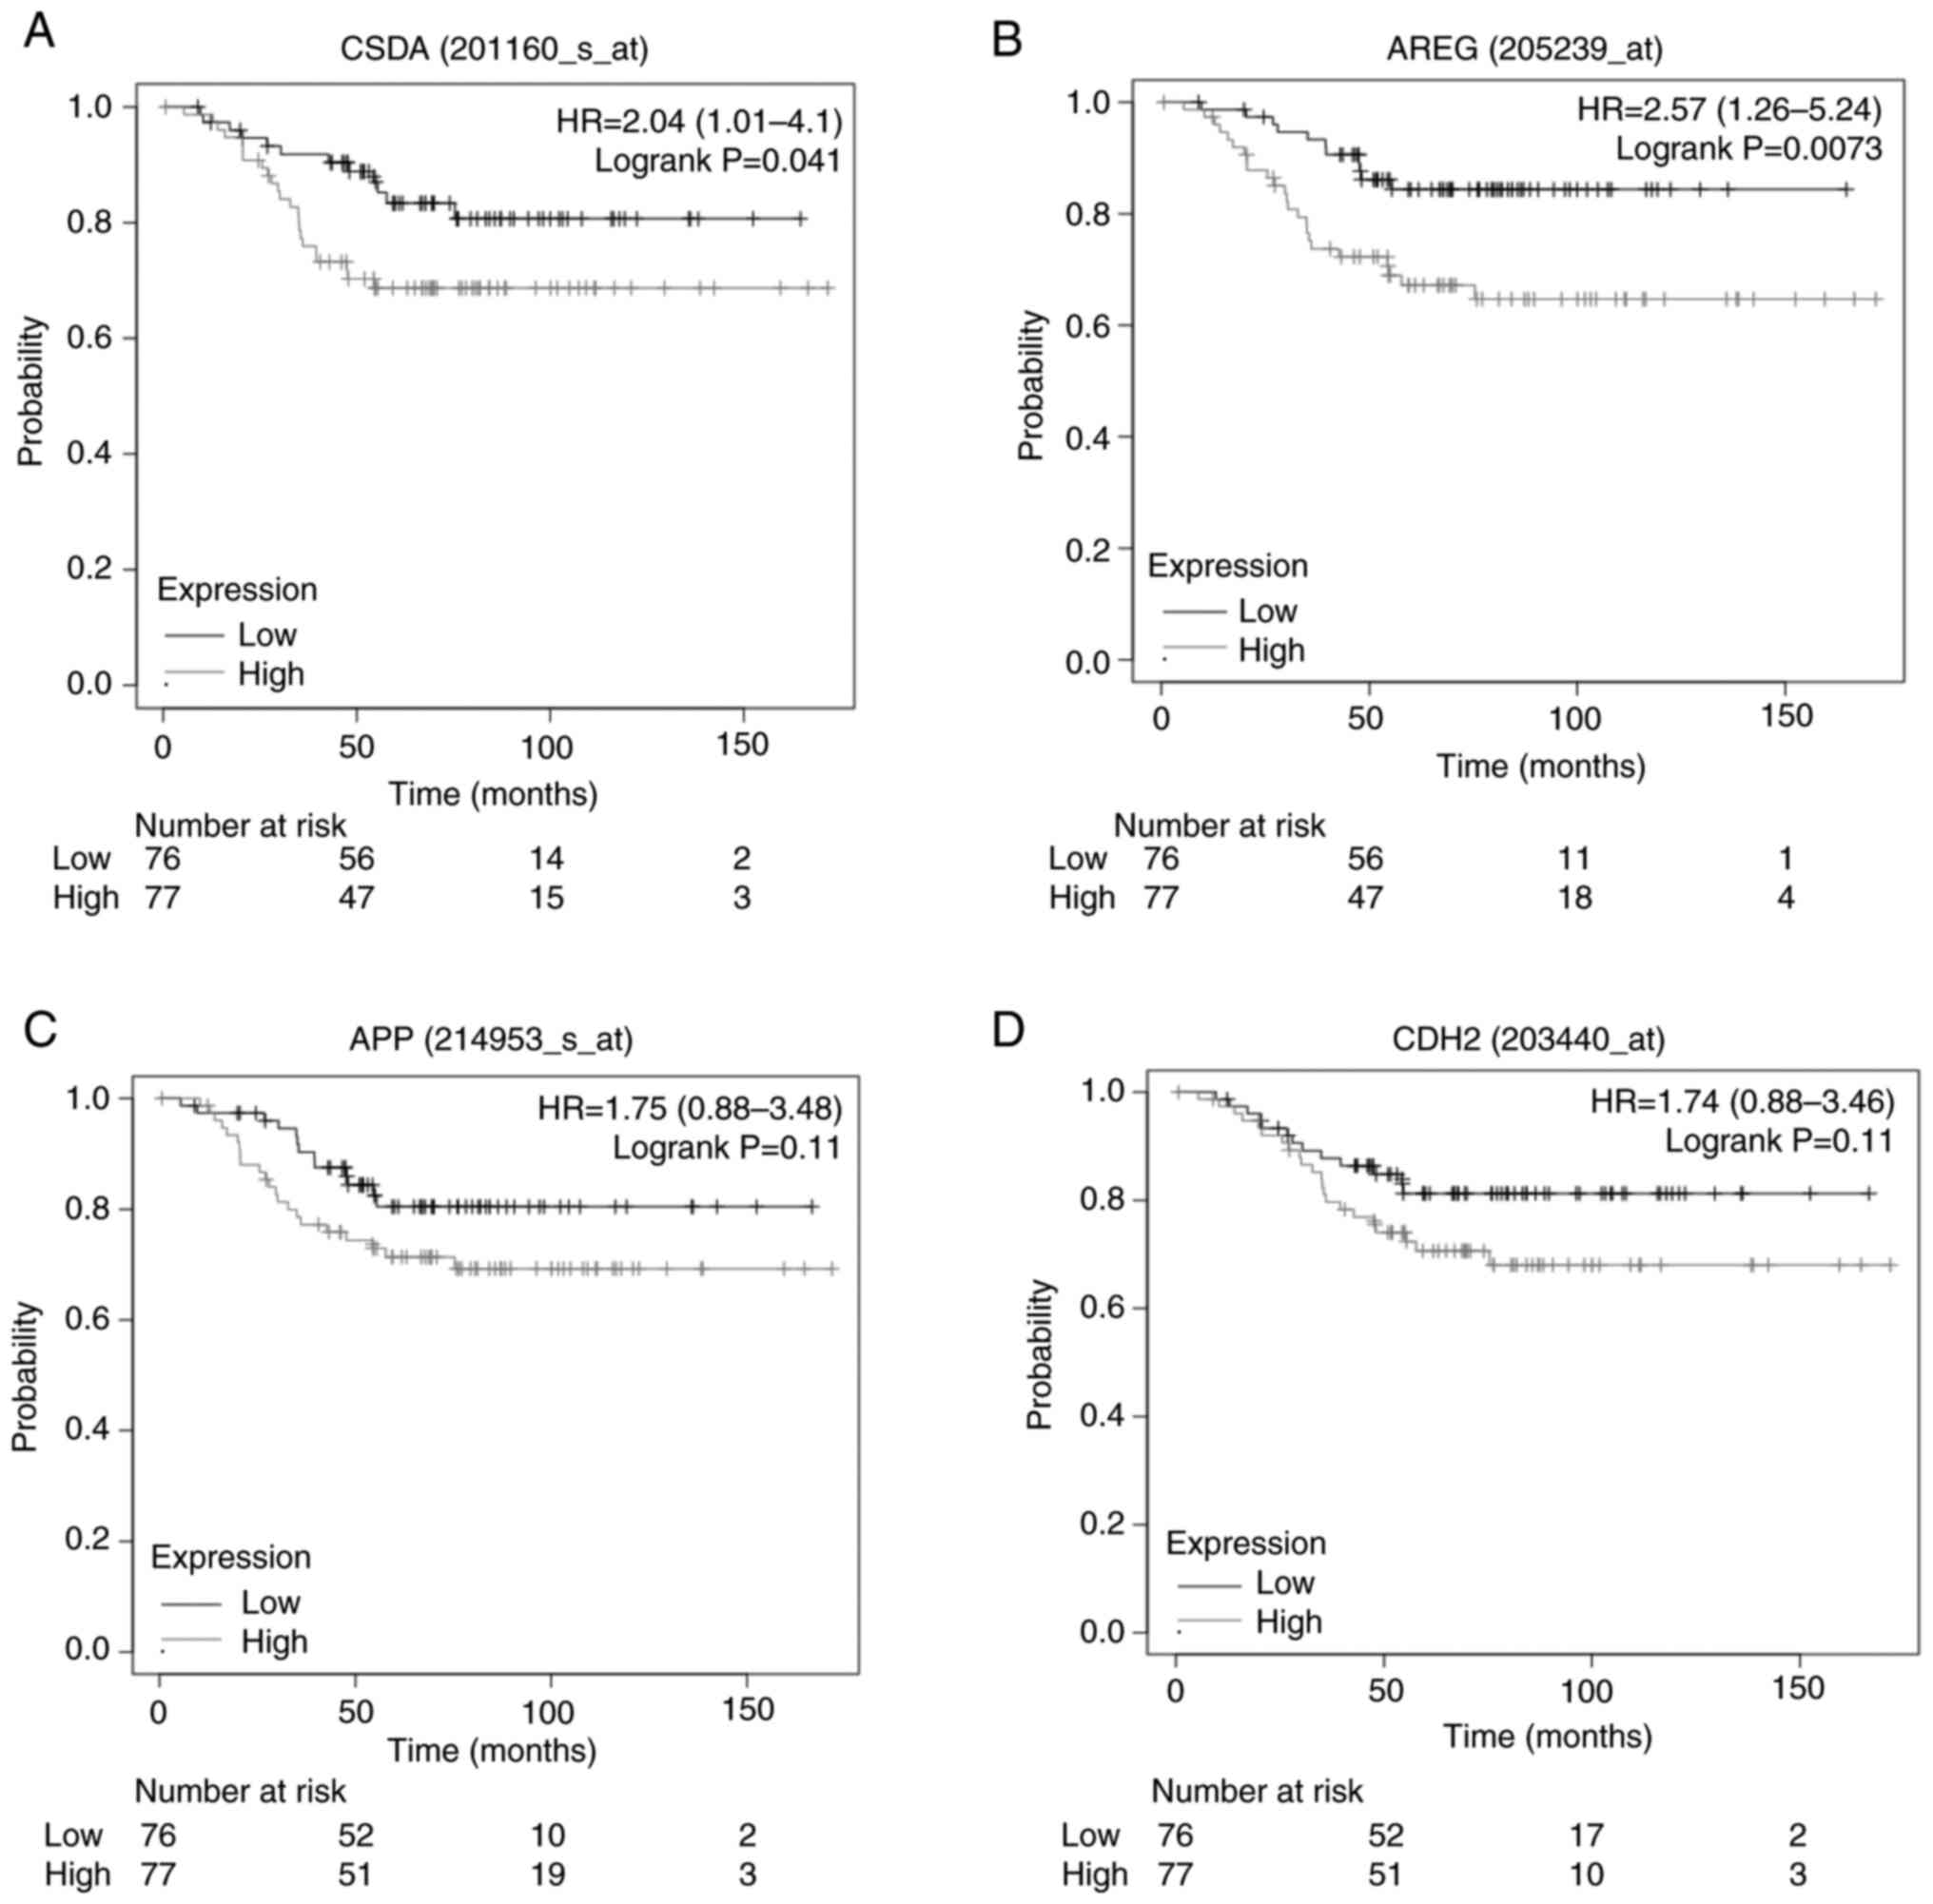
Prognostic value of Hub genes YBX3,
AREG, APP and CDH2
Considering the hub genes with the highest number of
interactions obtained from the CytoHubba analysis and their
prognostic evaluation using the KM-plot platform, YBX3 or
CSDA (HR=2.04; 95% CI, 1.01-4.01; P=0.041), AREG
(HR=2.57; 95% CI, 1.26-5.24; P=0.0073), APP (HR=1.73; 95%
CI, 0.87-3.44; P=0.11) and CDH2 (HR=1.74; 95% CI, 0.88-3.46;
P=0.11) were associated with poor prognosis in diabetic patients
with BC (Fig. 5). These data
demonstrate that high expression of YBX3 and AREG is
significantly associated with reduced survival probability, whereas
APP and CDH2 did not reach statistical significance.
Nevertheless, elevated YBX3 and AREG levels may serve
as potential biomarkers for identifying diabetic patients with BC
with a worse prognosis.
Coexpression of hub genes YBX3, AREG,
APP and CDH2
The coexpression analysis was performed in a cohort
of 1,097 patients diagnosed with breast invasive carcinoma, aged 26
to 90 years, with heterogeneous clinical characteristics (Fig. 6), including estrogen receptor status
(ER+ 71.7%, ER- 22%), progesterone receptor
status (PR+ 63.7%, PR- 31.4%), HER2 status
(HER2+ 14%, HER2- 51.3%) and metastatic
condition (M0 82.6%, MX 14.8% and M1 2%). The analysis revealed
that APP and AREG expression were significantly
correlated with YBX3 (R=0.373 and R=0.119, respectively),
indicating that higher YBX3 expression is associated with
increased APP and AREG expression. A positive but
weak correlation was observed between YBX3 and FZD3
(R=0.139). Importantly, CDH2 and YBX3 also exhibited
a weak but statistically significant correlation (R=0.131;
P=1.29x10⁻⁵).
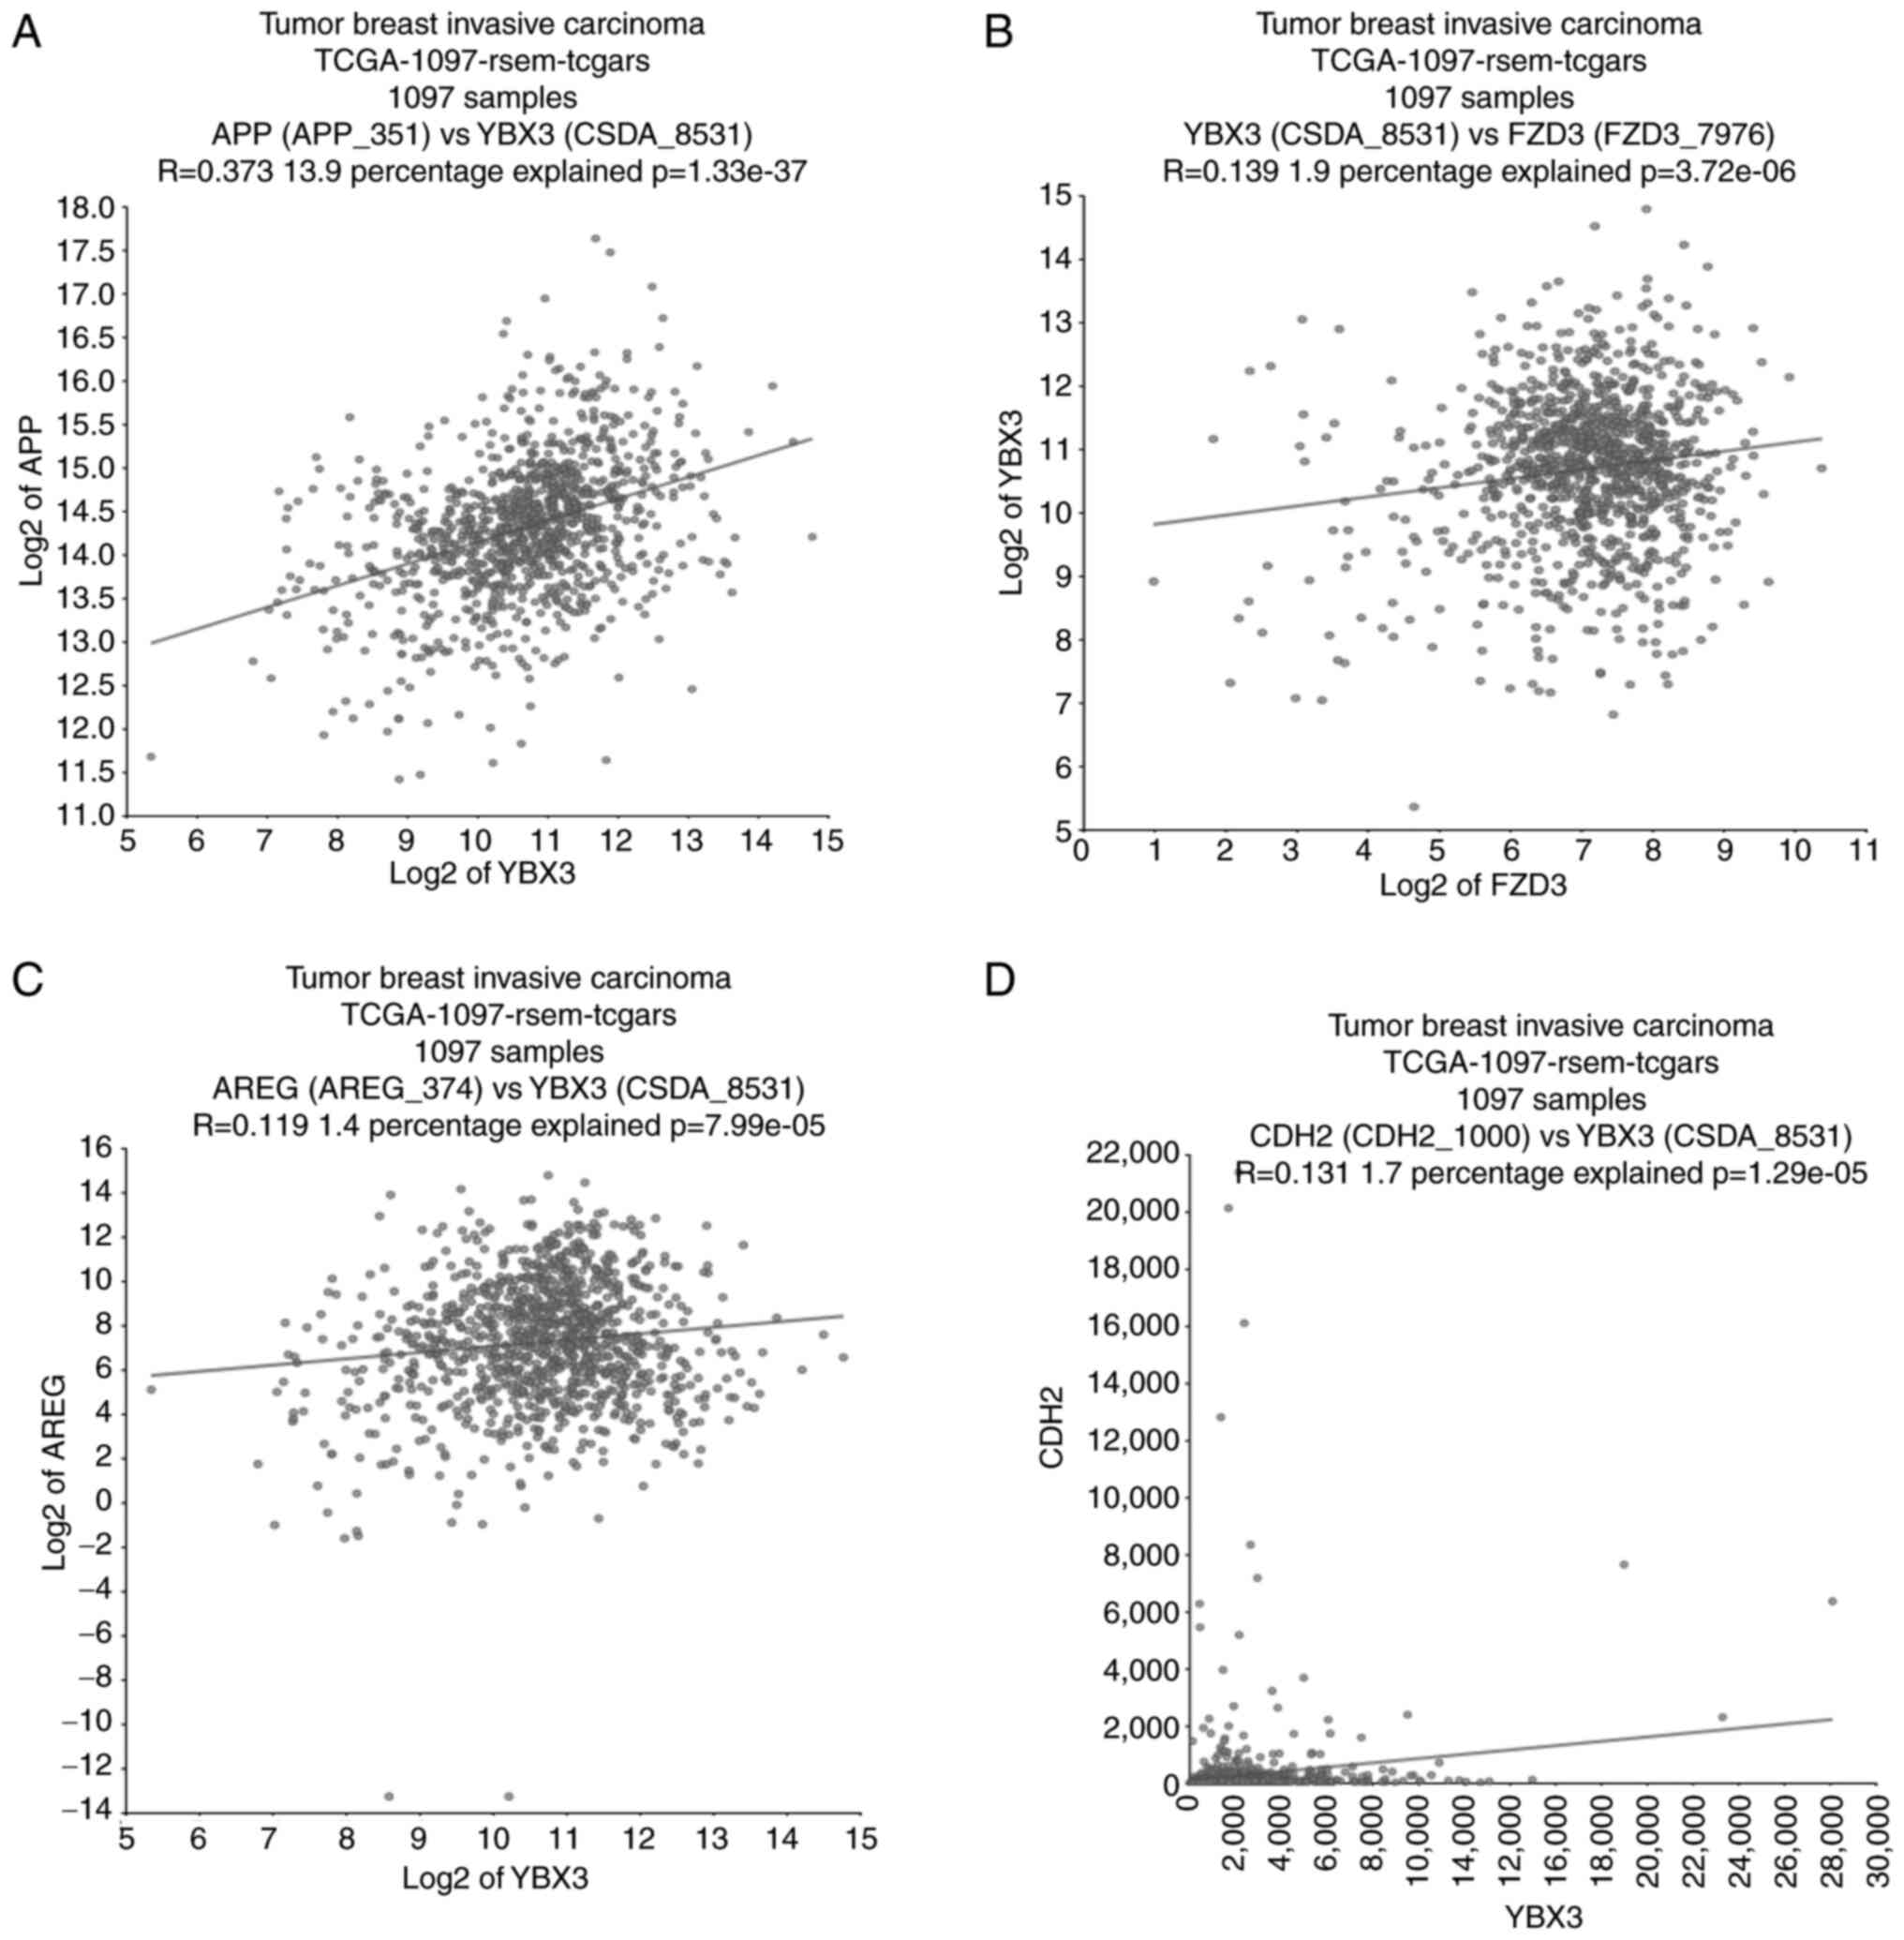 | Figure 6Correlation analysis of gene hubs.
(A-D) Correlation analysis of gene expression was performed using
the R2 Genomics platform (http://r2.amc.nl) in a cohort of 1,097 patients
diagnosed with breast invasive carcinoma (TCGA), aged 26 to 90
years, with heterogeneous hormone receptor status (ER+
71.7%, ER- 22%, PR+ 63.7%, PR-
31.4%, HER2+ 14%, and HER2- 51.3%), and
metastatic condition (M0 82.6%, MX 14.8% and M1 2%). Scatter plots
show the relationships between (A) APP and YBX3, (B)
YBX3 and FZD3, (C) AREG and YBX3, and
(D) CDH2 and YBX3. Each plot includes a regression
line, the Pearson correlation coefficient (R), and the statistical
significance (P-value). TCGA, The Cancer Genome Atlas. |
Discussion
Hyperglycemia is one of the most important factors
considered a promoter of cancer in T2DM. In the present study, it
was detected that HG induces cisplatin resistance and changes in
gene expression in MDA-MB-231 cells. These changes indicate a
variety of alterations in metabolic and signaling pathways that may
be related to preventing cell death and increased chemoresistance
associated with an aggressive phenotype. Additionally, some genes
(AREG and YBX3) were selected as possible biomarkers
of chemoresistance and prognostic indicators. Furthermore, it was
confirmed that hyperglycemia increases the migratory phenotype in
these cells.
HG induces resistance to cisplatin. The
prometastatic action of HG on MDA-MB-231 cells has been
demonstrated. In our previous studies, HG promoted the growth of
the cell population, EMT, clonogenicity, cell migration and cell
invasion compared with NG and the control of osmolality (4,6). It
was also described that T2DM promoted the progression of BC in mice
(27). In the present study, the
lower IC50 for cisplatin in cell cultures with HG
indicated the induction of cisplatin resistance by HG,
corroborating that HG is a promoter of chemoresistance (2,3,8).
Chemoresistance is associated with an invasive phenotype, and both
are dependent on the prevention of apoptosis and the induction of
EMT, cancer stemness, oncogenes, tumor suppressors, and metabolic
and cell signaling reprogramming, involving transporter pumps,
mitochondrial alterations, DNA repair and autophagy (28).
Prevention of cisplatin-induced apoptosis by
HG. To confirm if the prevention of the cytotoxic effect of
cisplatin by HG is due to the prevention of cell death, caspase-3
was assessed. Caspase-3 is involved in the final stages of
apoptosis, participating in the amplification of intracellular
apoptotic signals as a consequence of the caspase cascade induced
by both intrinsic and extrinsic signaling (26). In the present study, it was found
that HG prevents caspase-3 activation and, therefore, apoptosis,
which explains the increased chemoresistance to cisplatin (Fig. 1). HG induces apoptosis in normal
cells; however, in cancer cells, HG prevents a variety of
proapoptotic mechanisms and promotes their proliferation and
invasiveness (4,6,28).
Additionally, the microarray analysis indicated that HG prevents
the cytotoxic action of cisplatin through the increased expression
of genes related to cell survival. (TNFSF7 and TRAF1)
(Table II) (21), and inhibition of apoptosis
(XIAP and BCL2L2) (Table
II) (22,23), together with diminished expression
of proapoptotic factors (BIK, PDCD8, PDCD5,
BNIP1, DAPK1 and CCAR2) (24,25).
The overexpression of BCL2L2 has been associated with an
aggressive and radioresistant BC phenotype (22).
Genes involved in metabolism are associated with
chemoresistance. Diabetes and hyperglycemia are frequently
associated with metabolic disorders. The data suggest that cancer
metabolism is intimately linked to drug resistance. The enrichment
analysis indicates the differential expression of numerous genes
for components of membranes and ribosomes in HG conditions. The
first is related to metabolite and ion transporters, and suggests
the reprogramming of solute interchange (ions and nutrients)
through the cell membranes. The second could be associated with the
increased synthesis of proteins.
The reprogramming of membrane transport is
suggested because of changes in the expression of 27 solute carrier
transporters (SLC) and 10 ATP-dependent transporters in the HG
condition (Tables II, SI and SII). The overexpression of SLC that
controls the entry of essential amino acids, monocarboxylates,
vitamins, glucose, nucleotides and organic cations indicates an
increased flux of nutrients, favoring the biosynthetic and
energetic demands of cancer cells. The SLC may be novel therapeutic
targets and predictive markers of chemoresistance. Among the
transporter-coding genes upregulated in the HG condition,
SLC6A6 (4.05 fold) and SLC39A7 (1.57-fold) have been
related to multidrug and cisplatin resistance in colorectal and
non-small cell lung cancers (16,29).
The dysregulation of genes coding for ribosomal
proteins promotes BC metastasis. Among them, RPS13 was
upregulated more than 2-fold during HG treatment and promoted drug
resistance in gastric cancer cells, suppressing apoptosis (17).
Recently, changes in lipid metabolism have been
recognized as important mediators of drug resistance. The gene
coding for 1-acylglycerol-3-phosphate O-acyltransferase 1
(AGPAT1) was the most highly overexpressed in HG. It is
highly expressed in breast tumor tissues, and it has been proposed
as a component of a gene signature for prognosis in BC (30). More studies are required to
determine its role in chemoresistance under HG conditions; some
members of the AGPAT gene family are upregulated in multiple
cancers and are associated with drug resistance and poor prognosis
(31).
Crosstalk between different oncogenic signaling
pathways in hyperglycemia. The metabolic alterations and
changes in gene expression induced by HG suggest the implication of
multiple signaling pathways that favor an aggressive phenotype and
chemoresistance in MDA-MB-231 cells. RT-qPCR confirmed the
overexpression of TSPAN1 and FZD3 genes, and several
studies suggested their role in cancer progression and
chemoresistance. TSPAN-1 promotes the proliferation and development
of a migratory-invasive phenotype through the induction of EMT and
activation of the PI3K/Akt signaling (32). In addition, the suppression of
TSPAN1 expression prevented BC tumor growth in mice
(18). These data are in agreement
with the high expression of TSPAN1 and FZD3 proteins in breast
ductal carcinoma in women of reproductive age (Fig. 3).
The finding that FZD3 and other members of
the Wnt canonical signaling [WNT1, FZD-4, disheveled 2
(DVL2), lymphoid enhancer factor 1 (LEF1) and
LRP8] were overexpressed in a hyperglycemic microenvironment
indicates the participation of Wnt signaling in the promotion of an
aggressive and chemoresistant phenotype by hyperglycemia, which was
supported by the enrichment and the PPI analyses. The altered
expression of genes of the Wnt pathway has been related to cancer
progression and poor prognosis (33,34).
WNT1 can induce transformation of the mouse mammalian cell line
C57MG (34). The expression of
WNT1 and LEF1 is upregulated in human breast
carcinoma (35). Whereas the
upregulation of FZD4 in glioma cells is correlated with
resistance to drug-induced cell death, partly due to the activation
of Wnt/β-catenin and downregulation of proapoptotic genes
(CASP3 and PDCD4) (36). The silencing of LRP8 by
interference RNA attenuates Wnt/β-catenin, decreases the metastatic
potential, and sensitizes BC cells to chemotherapy (37). As a consequence of the activation of
the Wnt pathway, LEF-1 and T cell factor (TCF) form a complex and
activate the expression of genes such as MDR1, C-MYC,
MET, MMP7, C-JUN and CCND1,
contributing to carcinogenesis and tumor progression in several
cancers (33,35). In MCF7 BC cells, LEF1 induces
resistance to docetaxel (DTX), and the inhibition of LEF1 with
quercetin reestablishes sensitivity to DTX (38). LEF1 is a transcription factor that
controls gene expression dependent or independent of Wnt/β-catenin
signaling and increases the expression of EMT effectors, such as
snail, vimentin and N-cadherin; the gene that encodes N-cadherin,
CDH2, was also found to be overexpressed in the HG condition
(Table SI). The potential role of
the Wnt pathway in the promotion of BC under hyperglycemic
conditions requires further studies.
The non-canonical signaling of Wnt can also be
implicated in the promotion of BC by hyperglycemia. Two genes that
encode CDC42 effectors were overexpressed by 2-fold in HG
conditions, including CDC42 binding protein kinase alpha and CDC42
small effector 1. The binding of WNT1 with FZD-3 induces the
activation of CDC42 in a β-catenin independent signaling, and CDC42
induces the reorganization of the cytoskeleton and cell migration
(39).
As the PPI indicates, the ATM-dependent
DNA-repairing pathway is of special interest, considering that
platinum salts are DNA-damaging agents. ATM improves the
ability to repair double-strand DNA breaks and can lead to
increased resistance to DNA-damaging chemotherapeutic agents, such
as platinum salts (40).
Potential genes associated with
chemoresistance induced by hyperglycemia
Through the evaluation of hub genes with a greater
number of interactions (Fig. 4),
the survival of TNBC patients using the KM plotter (Fig. 5) and coexpression analysis (Fig. 6), the authors propose YBX3 as
a central regulator positively correlated with AREG,
APP and FZD3, suggesting that these genes may
participate in a signaling network that promotes proliferation,
invasion and therapy resistance under hyperglycemic conditions. In
particular, YBX3 and AREG showed significant
prognostic value, as their high expression was associated with
reduced survival in patients with BC, highlighting their potential
as biomarkers of poor outcome (Fig.
5).
By contrast, APP and CDH2 did not
reach statistical significance in survival analyses, but
coexpression studies demonstrated that both genes are positively
correlated with YBX3 (Fig.
6). This finding suggests that APP and CDH2 may
not act as independent prognostic markers, but rather as
cooperative elements within YBX3-driven regulatory networks,
thereby contributing indirectly to tumor progression and
aggressiveness. Importantly, recent studies have shown that
YBX3 is overexpressed in multiple cancer types and
contributes to chemoresistance by regulating transcriptional and
translational programs involved in EMT, proliferation, and survival
pathways (19,41,42).
Moreover, YBX3 regulates the expression of growth factors and
ligands such as AREG, creating a positive feedback loop that
amplifies growth factor signaling, enhances EMT, and promotes
chemoresistance (43).
AREG is the primary EGFR ligand in MDA-MB-231
cells, and its binding to EGFR promotes BC growth and metastasis
(44). APP overexpression drives
EMT, proliferation and migration/invasion in BC cells, and it has
been proposed as a risk factor for lymph node metastasis and poor
prognosis in non-luminal BCs, including TNBC (45). CDH2 is a mesenchymal marker induced
by EMT that facilitates migration and invasion, and its high
expression correlates with poor prognosis in invasive
micropapillary BC (46,47).
Taken together, these findings suggest that while
AREG and CDH2 emerge as potential prognostic
biomarkers, APP and CDH2 may act primarily as
modulators of YBX3-driven transcriptional networks that
support tumor progression rather than serving as independent
prognostic indicators. Nevertheless, despite these associations,
the current evidence remains insufficient to establish these hub
genes as reliable biomarkers, underscoring the need for further
validation in larger patient cohorts and in-depth functional
studies.
It must be considered that an increase in the mRNA
level of a gene is not always followed by an increase in the
codified protein, and the protein generally realizes a function in
metabolism, secretion, or gene expression regulation. This
situation limits the conclusions of the estimations of the OS based
on mRNA values, as our data were derived from the KM plot
analysis.
Therapeutic implications and resistance bypass
strategies. The present results provide a foundation for
therapeutic strategies aimed at overcoming hyperglycemia-induced
chemoresistance in TNBC. Previous studies have shown that
inhibitors or interfering RNAs targeting YBX3 increase
chemosensitivity, highlighting a promising approach for TNBC
(19,42). Other potential therapeutic targets
include metabolic reprogramming and transporter activity,
considering the SLC6A6, SLC39A7 and RPS13
genes (16,17,29),
which are overexpressed in HG and aforementioned. Pharmacological
inhibition of these transporters, or modulation of glucose and
lipid metabolism, could sensitize TNBC cells to chemotherapy.
Combined strategies that target metabolic and oncogenic signaling
pathways may prove particularly effective. The inhibition of the
Wnt/β-catenin pathway or ATM-mediated DNA repair, in combination
with chemotherapy, could synergistically reduce tumors. These
findings support a framework for personalized combinatorial
therapies in diabetic patients with BC, integrating metabolic
modulators, inhibitors of YBX3-regulated networks, and
conventional chemotherapeutics to overcome resistance and improve
clinical outcomes.
Limitations of the present study. The
present study has potential limitations. It was based on the
analysis of the changes induced by HG in an invasive BC cell line,
using an in vitro experimental and bioinformatics approach.
Although the MDA-MB-231 cell line has been widely used as a model
of invasive BC, it does not represent the genetic heterogeneity of
invasive breast tumors. Therefore, the current findings need to be
validated in other experimental models and clinical cohorts.
However, the present study provides important insights and allows
us to better understand the behavior of this type of cancer under
HG conditions, as well as to identify potential signaling pathways
and genes associated with chemoresistance and prognosis in patients
with T2DM.
Although the use of HPRT as a housekeeping
gene is considered unreliable for comparing the gene expression
between cancerous and non-cancerous tissues (48), this gene has been recommended in
hyperglycemic conditions (13), and
its expression is moderately stable in BC cell lines (12), although in hyperglycemic conditions,
it has been validated in other types of cells. Therefore, the use
of an additional reference gene is recommended to further
consolidate the overexpression of TSPAN and FZD3
genes.
The present findings and bibliographic references
suggest that TSPAN1 and FZD3 play an important role
in the induction of chemoresistant and invasive phenotypes by HG
(18,32). However, gene knockdown experiments
are required to better understand their roles.
The clinical implications were partially validated
using public patient datasets and informatics platforms; however,
these platforms are generally based on non-diabetic patients, and
the estimation of the effect of selected overexpressed genes on OS
was therefore performed in non-diabetic conditions. These results
should be interpreted with caution, highlighting the need for
further validation in diabetic patient cohorts.
Additionally, both diabetes and cancer are complex
processes involving multiple genetic and environmental contexts;
therefore, further studies are required to validate the clinical
implications of our findings. These include validation at both
protein (western blotting and IHC) and mRNA (RT-qPCR) levels of
overexpressed genes (FZD3 and TSPAN1), as well as of
potential genes associated with chemoresistance and prognosis
(AREG and YBX3) in breast tumor tissues of diabetic
patients.
In addition, changes in gene expression and the
induction of cisplatin chemoresistance by diabetes in a mouse model
of syngeneic BC are currently studied, and patient-derived
organoids can be used to analyze cisplatin action under HG
conditions in human tissues. Finally, the correlation of the
selected genes and clinical outcomes should be studied in other
patient cohorts, preferably in diabetic patients with BC.
In conclusion, these data indicate that alterations
in gene expression induced by hyperglycemia lead to changes in the
metabolism of cancer cells, affecting a variety of processes that
promote a more aggressive phenotype through the activation of
Wnt/β-catenin, NF-κB survival, angiogenesis and PI3K/AKT signaling,
contributing to enhanced proliferation, migration, invasion and
inhibition of apoptosis. Some potential biomarkers of cisplatin
resistance under hyperglycemia could be AREG and
YBX3.
Supplementary Material
Upregulated genes in MDA-MB-231 cells
supplemented with glucose 30 mmo/l.
Downregulated genes in MDA-MB-231
cells supplemented with glucose 30 mmo/l.
Acknowledgements
The authors would like to thank Ms Lorena Chávez,
Dr José Luis Santillán, Mr Simón Guzmán and Dr Jorge Ramírez for
performing the microarray analysis at the Instituto de Fisiología
Celular, National Autonomous University of Mexico. The authors
thank student Mr Jael Gutiérrez Savedra for his technical
assistance, and Dr Leticia Moreno Fierros for her technical advice
[both are affiliated to the National Autonomous University of
Mexico (UNAM), FES-Iztacala].
Funding
Funding: The present study was supported by the Programa de
Apoyo a Proyectos de Investigación e Innovación Tecnológica
(PAPIIT), Dirección General de Apoyo al Personal Académico (DGAPA),
Universidad Nacional Autónoma de México (UNAM), (grant nos.
IN223121 and IN220024), by the Financing for Research of Women
Scientists (grant no. FICDTEM-2023-56) and by the Fiscal Resources
Program for Research of the National Institute of Pediatrics (grant
no. 2020/016).
Availability of data and materials
The data generated in the present study may be
found in the Gene Expression Omnibus under accession number
GSE136277 or at the following URL: https://www.ncbi.nlm.nih.gov/geo/query/acc.cgi?acc=GSE136277.
The data generated in the present study are included in the figures
and/or tables of this article.
Authors' contributions
ARVR, MGMH and LABG contributed to the conception
and design of the study. ARVR, MGMH, LAFL, MÁVF, RREG and JRPB
performed material preparation, data collection and analysis. ARVR
and LABG wrote the first draft of the manuscript. All authors
commented on previous versions of the manuscript. All authors read
and approved the final version of the manuscript. ARVR and
LABG confirm the authenticity of all the raw data.
Ethics approval and consent to
participate
Not applicable.
Patient consent for publication
Not applicable.
Competing interests
The authors declare that they have no competing
interests.
References
|
1
|
Ryu TY, Park J and Scherer PE:
Hyperglycemia as a risk factor for cancer progression. Diabetes
Metab J. 38:330–336. 2014.PubMed/NCBI View Article : Google Scholar
|
|
2
|
Varghese E, Samuel SM, Líšková A, Samec M,
Kubatka P and Büsselberg D: Targeting glucose metabolism to
overcome resistance to anticancer chemotherapy in breast cancer.
Cancers (Basel). 12(2252)2020.PubMed/NCBI View Article : Google Scholar
|
|
3
|
Qiu J, Zheng Q and Meng X: Hyperglycemia
and chemoresistance in breast cancer: From cellular mechanisms to
treatment response. Front Oncol. 11(628359)2021.PubMed/NCBI View Article : Google Scholar
|
|
4
|
Flores-López LA, Martínez-Hernández MG,
Viedma-Rodríguez R, Díaz-Flores M and Baiza-Gutman LA: High glucose
and insulin enhance uPA expression, ROS formation and invasiveness
in breast cancer-derived cells. Cell Oncol (Dordr). 39:365–378.
2016.PubMed/NCBI View Article : Google Scholar
|
|
5
|
Bergandi L, Mungo E, Morone R, Bosco O,
Rolando B and Doublier S: Hyperglycemia promotes chemoresistance
through the reduction of the mitochondrial DNA damage, the
Bax/Bcl-2 and Bax/Bcl-XL ratio, and the cells in sub-G1 phase due
to antitumoral drugs induced-cytotoxicity in human colon
adenocarcinoma cells. Front Pharmacol. 9(866)2018.PubMed/NCBI View Article : Google Scholar
|
|
6
|
Viedma-Rodríguez R, Martínez-Hernández MG,
Flores-López LA and Baiza-Gutman LA: Epsilon-aminocaproic acid
prevents high glucose and insulin induced-invasiveness in
MDA-MB-231 breast cancer cells, modulating the plasminogen
activator system. Mol Cell Biochem. 437:65–80. 2018.PubMed/NCBI View Article : Google Scholar
|
|
7
|
Huang Y, Hong W and Wei X: The molecular
mechanisms and therapeutic strategies of EMT in tumor progression
and metastasis. J Hematol Oncol. 15(129)2022.PubMed/NCBI View Article : Google Scholar
|
|
8
|
Panigrahi G, Candia J, Dorsey TH, Tang W,
Ohara Y, Byun JS, Minas TZ, Zhang AL, Ajao A, Cellini A, et al:
Diabetes-associated breast cancer is molecularly distinct and shows
a DNA damage repair deficiency. JCI Insight.
8(e170105)2023.PubMed/NCBI View Article : Google Scholar
|
|
9
|
Ashrafizadeh M, Zarrabi A, Hushmandi K,
Kalantari M, Mohammadinejad R, Javaheri T and Sethi G: Association
of the epithelial-mesenchymal transition (EMT) with cisplatin
resistance. Int J Mol Sci. 21(4002)2020.PubMed/NCBI View Article : Google Scholar
|
|
10
|
Frossard M, Blank D, Joukhadar Ch, Bayegan
K, Schmid R, Luger A and Müller M: Interstitial glucose in skeletal
muscle of diabetic patients during an oral glucose tolerance test.
Diabet Med. 22:56–60. 2005.PubMed/NCBI View Article : Google Scholar
|
|
11
|
Schmittgen TD and Livak KJ: Analyzing
real-time PCR data by the comparative C(T) method. Nat Protoc.
3:1101–1108. 2008.PubMed/NCBI View Article : Google Scholar
|
|
12
|
Gorji-Bahri G, Moradtabrizi N, Vakhshiteh
F and Hashemi A: Validation of common reference genes stability in
exosomal mRNA-isolated from liver and breast cancer cell lines.
Cell Biol Int. 45:1098–1110. 2021.PubMed/NCBI View Article : Google Scholar
|
|
13
|
Liu X, Xie J, Liu Z, Gong Q, Tian R and Su
G: Identification and validation of reference genes for
quantitative RT-PCR analysis of retinal pigment epithelium cells
under hypoxia and/or hyperglycemia. Gene. 580:41–46.
2016.PubMed/NCBI View Article : Google Scholar
|
|
14
|
Doncheva NT, Morris JH, Gorodkin J and
Jensen LJ: Cytoscape StringApp: Network analysis and visualization
of proteomics data. J Proteome Res. 18:623–632. 2019.PubMed/NCBI View Article : Google Scholar
|
|
15
|
Chin CH, Chen SH, Wu HH, Ho CW, Ko MT and
Lin CY: cytoHubba: identifying hub objects and sub-networks from
complex interactome. BMC Syst Biol. 8 (Suppl 4)(S11)2014.PubMed/NCBI View Article : Google Scholar
|
|
16
|
Yasunaga M and Matsumura Y: Role of SLC6A6
in promoting the survival and multidrug resistance of colorectal
cancer. Sci Rep. 4(4852)2014.PubMed/NCBI View Article : Google Scholar
|
|
17
|
Shi Y, Zhai H, Wang X, Han Z, Liu C, Lan
M, Du J, Guo C, Zhang Y, Wu K and Fan D: Ribosomal proteins S13 and
L23 promote multidrug resistance in gastric cancer cells by
suppressing drug-induced apoptosis. Exp Cell Res. 296:337–346.
2004.PubMed/NCBI View Article : Google Scholar
|
|
18
|
Garcia-Mayea Y, Mir C, Carballo L,
Sánchez-García A, Bataller M and ME LL: TSPAN1, a novel tetraspanin
member highly involved in carcinogenesis and chemoresistance.
Biochim Biophys Acta Rev Cancer. 1877(188674)2022.PubMed/NCBI View Article : Google Scholar
|
|
19
|
Tong C, Qu K, Wang G, Liu R, Duan B, Wang
X and Liu C: Knockdown of DNA-binding protein A enhances the
chemotherapy sensitivity of colorectal cancer via suppressing the
Wnt/β-catenin/Chk1 pathway. Cell Biol Int. 44:2075–2085.
2020.PubMed/NCBI View Article : Google Scholar
|
|
20
|
Lánczky A and Győrffy B: Web-based
survival analysis tool tailored for medical research (KMplot):
Development and implementation. J Med Internet Res.
23(e27633)2021.PubMed/NCBI View
Article : Google Scholar
|
|
21
|
Liu N, Sheng X, Liu Y, Zhang X and Yu J:
Increased CD70 expression is associated with clinical resistance to
cisplatin-based chemotherapy and poor survival in advanced ovarian
carcinomas. Onco Targets Ther. 6:615–619. 2013.PubMed/NCBI View Article : Google Scholar
|
|
22
|
Hartman ML and Czyz M: BCL-w: Apoptotic
and non-apoptotic role in health and disease. Cell Death Dis.
11(260)2020.PubMed/NCBI View Article : Google Scholar
|
|
23
|
Bano D and Prehn JHM: Apoptosis-inducing
factor (AIF) in physiology and disease: The tale of a repented
natural born killer. EBioMedicine. 30:29–37. 2018.PubMed/NCBI View Article : Google Scholar
|
|
24
|
Zheng HC: The molecular mechanisms of
chemoresistance in cancers. Oncotarget. 8:59950–59964.
2017.PubMed/NCBI View Article : Google Scholar
|
|
25
|
Gozuacik D, Bialik S, Raveh T, Mitou G,
Shohat G, Sabanay H, Mizushima N, Yoshimori T and Kimchi A:
DAP-kinase is a mediator of endoplasmic reticulum stress-induced
caspase activation and autophagic cell death. Cell Death Differ.
15:1875–1886. 2008.PubMed/NCBI View Article : Google Scholar
|
|
26
|
Porter AG and Jänicke RU: Emerging roles
of caspase-3 in apoptosis. Cell Death Differ. 6:99–104.
1999.PubMed/NCBI View Article : Google Scholar
|
|
27
|
Viedma-Rodríguez R, Martínez-Hernández MG,
Martínez-Torres DI and Baiza-Gutman LA: Epithelial mesenchymal
transition and progression of breast cancer promoted by diabetes
mellitus in mice are associated with increased expression of
glycolytic and proteolytic enzymes. Horm Cancer. 11:170–181.
2020.PubMed/NCBI View Article : Google Scholar
|
|
28
|
Vaughn AE and Deshmukh M: Glucose
metabolism inhibits apoptosis in neurons and cancer cells by redox
inactivation of cytochrome c. Nat Cell Biol. 10:1477–1483.
2008.PubMed/NCBI View Article : Google Scholar
|
|
29
|
Wu DM, Liu T, Deng SH, Han R and Xu Y:
SLC39A4 expression is associated with enhanced cell migration,
cisplatin resistance, and poor survival in non-small cell lung
cancer. Sci Rep. 7(7211)2017.PubMed/NCBI View Article : Google Scholar
|
|
30
|
Ren X, Cui H, Wu J, Zhou R, Wang N, Liu D,
Xie X, Zhang H, Liu D, Ma X, et al: Identification of a combined
apoptosis and hypoxia gene signature for predicting prognosis and
immune infiltration in breast cancer. Cancer Med. 11:3886–3901.
2022.PubMed/NCBI View Article : Google Scholar
|
|
31
|
Wen P, Wang R, Xing Y, Ouyang W, Yuan Y,
Zhang S, Liu Y and Peng Z: The prognostic value of the GPAT/AGPAT
gene family in hepatocellular carcinoma and its role in the tumor
immune microenvironment. Front Immunol. 14(1026669)2023.PubMed/NCBI View Article : Google Scholar
|
|
32
|
Wu Y, Chen W, Gong Y, Liu H and Zhang B:
Tetraspanin 1 (TSPAN1) promotes growth and transferation of breast
cancer cells via mediating PI3K/Akt pathway. Bioengineered.
12:10761–10770. 2021.PubMed/NCBI View Article : Google Scholar
|
|
33
|
Merikhian P, Eisavand MR and Farahmand L:
Triple-negative breast cancer: Understanding Wnt signaling in drug
resistance. Cancer Cell Int. 21(419)2021.PubMed/NCBI View Article : Google Scholar
|
|
34
|
Wong GT, Gavin BJ and McMahon AP:
Differential transformation of mammary epithelial cells by Wnt
genes. Mol Cell Biol. 14:6278–6286. 1994.PubMed/NCBI View Article : Google Scholar
|
|
35
|
Ayyanan A, Civenni G, Ciarloni L, Morel C,
Mueller N, Lefort K, Mandinova A, Raffoul W, Fiche M, Dotto GP and
Brisken C: Increased Wnt signaling triggers oncogenic conversion of
human breast epithelial cells by a Notch-dependent mechanism. Proc
Natl Acad Sci USA. 103:3799–3804. 2006.PubMed/NCBI View Article : Google Scholar
|
|
36
|
Jin X, Jeon HY, Joo KM, Kim JK, Jin J, Kim
SH, Kang BG, Beck S, Lee SJ, Kim JK, et al: Frizzled 4 regulates
stemness and invasiveness of migrating glioma cells established by
serial intracranial transplantation. Cancer Res. 71:3066–3075.
2011.PubMed/NCBI View Article : Google Scholar
|
|
37
|
Lin CC, Lo MC, Moody R, Jiang H, Harouaka
R, Stevers N, Tinsley S, Gasparyan M, Wicha M and Sun D: Targeting
LRP8 inhibits breast cancer stem cells in triple-negative breast
cancer. Cancer Lett. 438:165–173. 2018.PubMed/NCBI View Article : Google Scholar
|
|
38
|
Prieto-Vila M, Shimomura I, Kogure A,
Usuba W, Takahashi RU, Ochiya T and Yamamoto Y: Quercetin inhibits
Lef1 and resensitizes docetaxel-resistant breast cancer cells.
Molecules. 25(2576)2020.PubMed/NCBI View Article : Google Scholar
|
|
39
|
Tümen D, Heumann P, Huber J, Hahn N, Macek
C, Ernst M, Kandulski A, Kunst C and Gülow K: Unraveling cancer's
Wnt signaling: Dynamic control through protein kinase regulation.
Cancers (Basel). 16(2686)2024.PubMed/NCBI View Article : Google Scholar
|
|
40
|
Galland L, Ballot E, Mananet H, Boidot R,
Lecuelle J, Albuisson J, Arnould L, Desmoulins I, Mayeur D,
Kaderbhai C, et al: Efficacy of platinum-based chemotherapy in
metastatic breast cancer and HRD biomarkers: Utility of exome
sequencing. NPJ Breast Cancer. 8(28)2022.PubMed/NCBI View Article : Google Scholar
|
|
41
|
Wang C, You Z, He Y and Chen X:
Identification of RNA-binding protein YBX3 as an oncogene in clear
cell renal cell carcinoma. Funct Integr Genomics.
23(225)2023.PubMed/NCBI View Article : Google Scholar
|
|
42
|
Sun Y, Li Z, Wang W, Zhang X, Li W, Du G,
Yin J, Xiao W and Yang H: Identification and verification of YBX3
and its regulatory gene HEIH as an oncogenic system: A
multidimensional analysis in colon cancer. Front Immunol.
13(957865)2022.PubMed/NCBI View Article : Google Scholar
|
|
43
|
Panupinthu N, Yu S, Zhang D, Zhang F,
Gagea M, Lu Y, Grandis JR, Dunn SE, Lee HY and Mills GB:
Self-reinforcing loop of amphiregulin and Y-box binding protein-1
contributes to poor outcomes in ovarian cancer. Oncogene.
33:2846–2856. 2014.PubMed/NCBI View Article : Google Scholar
|
|
44
|
Bolitho C, Moscova M, Baxter RC and Marsh
DJ: Amphiregulin increases migration and proliferation of
epithelial ovarian cancer cells by inducing its own expression via
PI3-kinase signaling. Mol Cell Endocrinol.
533(111338)2021.PubMed/NCBI View Article : Google Scholar
|
|
45
|
Wu X, Chen S and Lu C: Amyloid precursor
protein promotes the migration and invasion of breast cancer cells
by regulating the MAPK signaling pathway. Int J Mol Med.
45:162–174. 2020.PubMed/NCBI View Article : Google Scholar
|
|
46
|
Cao ZQ, Wang Z and Leng P: Aberrant
N-cadherin expression in cancer. Biomed Pharmacother.
118(109320)2019.PubMed/NCBI View Article : Google Scholar
|
|
47
|
Ge R, Wang Z, Wu S, Zhuo Y, Otsetov AG,
Cai C, Zhong W, Wu CL and Olumi AF: Metformin represses cancer
cells via alternate pathways in N-cadherin expressing vs N-cadherin
deficient cells. Oncotarget. 6:28973–28987. 2015.PubMed/NCBI View Article : Google Scholar
|
|
48
|
Townsend MH, Felsted AM, Ence ZE, Piccolo
SR, Robison RA and O'Neill KL: Falling from grace: HPRT is not
suitable as an endogenous control for cancer-related studies. Mol
Cell Oncol. 6(1575691)2019.PubMed/NCBI View Article : Google Scholar
|