Introduction
Obesity has received considerable attention as a
major health hazard due to the increase in the prevalence of
obesity, not only in industrialized countries, but also in
developing areas (1). Obesity,
particularly abdominal obesity, contributes to many metabolic
disorders, including metabolic syndrome, type 2 diabetes and
cardiovascular diseases (2).
However, the interventions of obesity remain a challenge, since the
underlying mechanisms of its pathogenesis are being disclosed
through a slow process.
Genetic and environmental factors may contribute to
the development of obesity (3). A
high-fat diet is one of the key factors causing body weight gain
and the development of obesity (4). Current methods to treat obesity
primarily involve supervised diet, exercise, behavior modification
and use of anti-obesity drugs (5).
However, some people remain lean despite consumption of a high-fat
diet. The study of resistance to high-fat diet-induced obesity may
be useful to understand the mechanisms involved in the development
of obesity and to find new effective preventative measures.
Commonly, obesity-resistant animals either may eat
less than obesity-prone rats or exhibit an increase total energy
expenditure (6). Different levels
of neuropeptide Y and leptin may also contribute to a propensity to
obesity resistance (7,8). Increased hepatocyte fatty acid
oxidation in animals may be responsible for resistance to
diet-induced obesity (9). However,
the exact molecular mechanisms involved in obesity resistance
require further investigation.
In the present study, we investigated the proteomic
profiling of visceral adipose tissues in obesity-resistant mice
exposed to a high-fat diet to further validate or determine the
potential molecular mechanisms of obesity resistance using
proteomic, Western blotting and real-time PCR methods.
Materials and methods
Animals and diets
Three-week-old male C57BL/6 mice [SPF grade,
certified no. SCXK (Guangdong) 2003-0002] were obtained from
Guangdong Medical Laboratory Animal Center (Guangzhou, Guangdong,
China). Animals were kept in an environmentally controlled breeding
room (temperature, 20±2°C; humidity, 60±5%; 12-h dark/light cycle).
They were fed standard laboratory chow with water ad libitum
and were fasted from 9:00 am to 3:00 pm before the experiments. Our
research was conducted in accordance with the Declaration of
Helsinki and/or with the Guide for the Care and Use of Laboratory
Animals as adopted and promulgated by the United States National
Institutes of Health and approved by the Animal Welfare and Ethics
Committee of Tsinghua University, China. High-fat diets were
purchased from the Institute of Laboratory Animal Science, Chinese
Academy of Medical Science. High-fat diets contained 35% crude
protein, 20% crude fat and 25% crude carbohydrates (g/g). Total
calorie intake from the high-fat diets was 18 KJ per gram (40%
calories in fat).
Experimental procedure
Mice aged 4 weeks were separately placed in
metabolic cages (Tecniplast®, Italy) and had free access
to water and high-fat diets. Body weight was monitored once a week.
Dietary and water intake, urine volume and fecal weight for each
mouse were recorded while in the metabolic cage for 24 h, once a
week. Total calorie intake was calculated according to the dietary
calorie intake and expressed as KJ/g/day. Collected feces were used
for lipid assaying. After 6 weeks of high-fat diet feeding, the
mice were ranked in the upper and lower quarters for weight gain
and designated as obesity-prone and obesity-resistant (n=10),
respectively. On the 6th week, the animals were weighed and
anesthetized by an intraperitoneal injection of pentobarbital at a
dose of 35 mg/kg. Blood was collected from the tail vein prior to
the 6-week treatment and then from the orbital plexus after the
6-week treatment. Serum was isolated by centrifugation at 1,500 × g
at 4°C for 10 min and stored at −80°C until it was used for blood
glucose and lipid assays. Following blood collection, the
anesthetized mice were sacrificed by cervical dislocation. Visceral
adipose tissues (perigonadal fat, the main part of the internal
white adipose tissues) were removed from the animals and
immediately weighed. These samples were instantly frozen in liquid
nitrogen and then stored at −80°C until they were used for
biochemical analysis.
Calculation of the size of single
adipocytes
Part of the freshly removed adipose tissue samples
were fixed in 1% glutaraldehyde in 0.1 M phosphate-buffered saline
(pH 7.4) for 72 h and then processed for routine paraffin-wax
histology. Sections were stained with hematoxylin and eosin.
Non-overlapping adjacent sections were observed for adipocytes to
measure fat cell size from each group sample. The adipocytes
(n=100) in the sections were recorded with x200 magnification by
using a fully automated inverted research microscope (Leica DMI6000
B, Germany). The size of each adipocyte is expressed as the area of
a single adipocyte in the sections and calculated according to the
formula: Area = [π × long diameter (μm) × short diameter
(μm)]/4.
Biochemical analysis
Blood glucose and triglycerides, total cholesterol,
low-density lipoprotein cholesterol and high-density lipoprotein
cholesterol (n=10) were estimated using commercial kits (BioSino
Bio-Technology and Science Inc., Beijing, China) (10–14).
Blood leptin levels were assayed through the avidin-biotin
complex-ELISA kit (Shanghai Westang Bio-Tech, China). Fecal lipid
assays were conducted according to the previous protocol (15).
2-Dimensional electrophoresis
Freshly prepared protein samples from visceral
adipose tissues of three randomly selected animals in each group
were analyzed by 2-dimensional electrophoresis (2DE). Protein
extraction of adipose tissues, isoelectric focusing
electrophoresis, second dimensional separation of samples, gel
staining, image analysis, tryptic in-gel digestion, MALDI-TOF/TOF
mass spectrometric analysis and database search for protein
identification were carried out according to previously described
methods (15).
Western blotting
Freshly prepared visceral adipose tissues (n=5) were
homogenized and lysed with NETN buffer (20 mM Tris-HCl, pH 7.8, 1
mM EDTA, 50 mM sodium chloride and 0.5% NP-40), and lysates were
centrifuged at 12,000 rpm at 4°C for 2–10 min. Supernatants were
collected, and the protein concentration was determined by a
bicinchoninic acid protein assay kit (Nanjing Jiancheng Biotech,
China). Western blot analysis was carried out according to the
manufacturer's protocol. Antibodies against peroxisome
proliferator-activated receptor α and γ (PPARα and PPARγ; Wuhan
Boster Bio-Tech, China), enoyl coenzyme A hydratase 1, peroxisomal
(Ech1; Beijing Aviva Systems Biology, China) and β-actin (Santa
Cruz Biotechnology, Inc.) were used. Protein expression was
visualized with horseradish peroxidase-conjugated secondary
antibodies (Amersham Biosciences, USA; 1:2,000) and enhanced
chemiluminescence (KPL, USA).
Quantitative real-time PCR
Approximately 100 mg of visceral adipose tissues
were removed and immediately frozen in liquid nitrogen (n=5). Total
RNA was extracted using TRIzol reagent (Invitrogen) according to
the manufacturer's instructions. Reverse transcription was carried
out using a PrimeScript™ 1st Strand cDNA Synthesis kit (Takara,
Dalian, P.R. China), and the cDNA fragments were amplified using
Taq DNA polymerase (Takara) according to the manufacturer's
instructions. There are various genes mainly responsible for
mitochondrial and peroxisomal β-oxidation (16). These include the three peroxisomal
β-oxidation genes, acyl-CoA oxidase 1 palmitoyl (Acox1), enoyl-CoA
hydratase/3-hydroxyacyl-CoA dehydrogenase (Ehhadh), 3-oxoacyl-CoA
thiolase (Acaa1); and one mitochondrial β-oxidation gene,
hydroxyacyl-CoA dehydrogenase/3-ketoacyl-CoA thiolase/enoyl-CoA
hydratase (Hadhb, trifunctional protein, β subunit). In the present
study, these genes were chosen for quantitative PCR analysis, and
the primers were synthesized by Invitrogen (Table I). Glyceraldehyde-3-phosphate
dehydrogenase (GAPDH) was used as an internal control for
normalization. Quantitative real-time PCR (q-PCR) analysis was
conducted using the method of SYBR® Green I dye
according to the protocol of the kit (code no. DRR081S; Takara) in
the ABI PRISM 7300 real-time PCR System (Applied Biosystems, USA).
The q-PCR analysis was performed in two steps: i) cDNA samples were
pre-denatured at 95°C for 30 sec in the first stage; and ii)
denatured cDNA samples were amplified by 40 cycles at 95°C for 5
sec and at 60°C for 31 sec in the second stage. Data were expressed
as raw relative quantitation (2−ΔΔCt).
 | Table I.Mitochondrial and peroxisomal
β-oxidation genes. |
Table I.
Mitochondrial and peroxisomal
β-oxidation genes.
| Gene names | NCBI accession
no. | Primers (5′ to
3′) | Sizes (bp) |
|---|
| Acox1 | NM_015729 | Forward:
CCGCCTATGCCTTCCACT
Reverse: ACCGCAAGCCATCCGACA | 182 |
| Ehhadh | NM_023737.3 | Forward:
TGGACCATACGGTTAGAG
Reverse: CAATCCGATAGTGACAGC | 213 |
| Acaa1 | NM_130864.3 | Forward:
GATGACCTCGGAGAATGTGG
Reverse: CCTGAGACACGGTGATGGT | 188 |
| Hadhb | NM_145558 | Forward:
TGTCAGGCACTTCGTAT
Reverse: TAGCCACATTGCTTGTT | 153 |
| GAPDH | NM_008084 | Forward:
TCTCCTGCGACTTCAACA
Reverse: TGGTCCAGGGTTTCTTACT | 178 |
Statistical analysis
Data were expressed as the mean ± SD. Statistical
analysis was performed using ANOVA. The Newman-Keuls comparisons
were used to determine the source of significant differences where
appropriate. P-values <0.05 were considered statistically
significant.
Results
Body weight, visceral fat index, energy
intake, fecal lipid excretion and body temperature
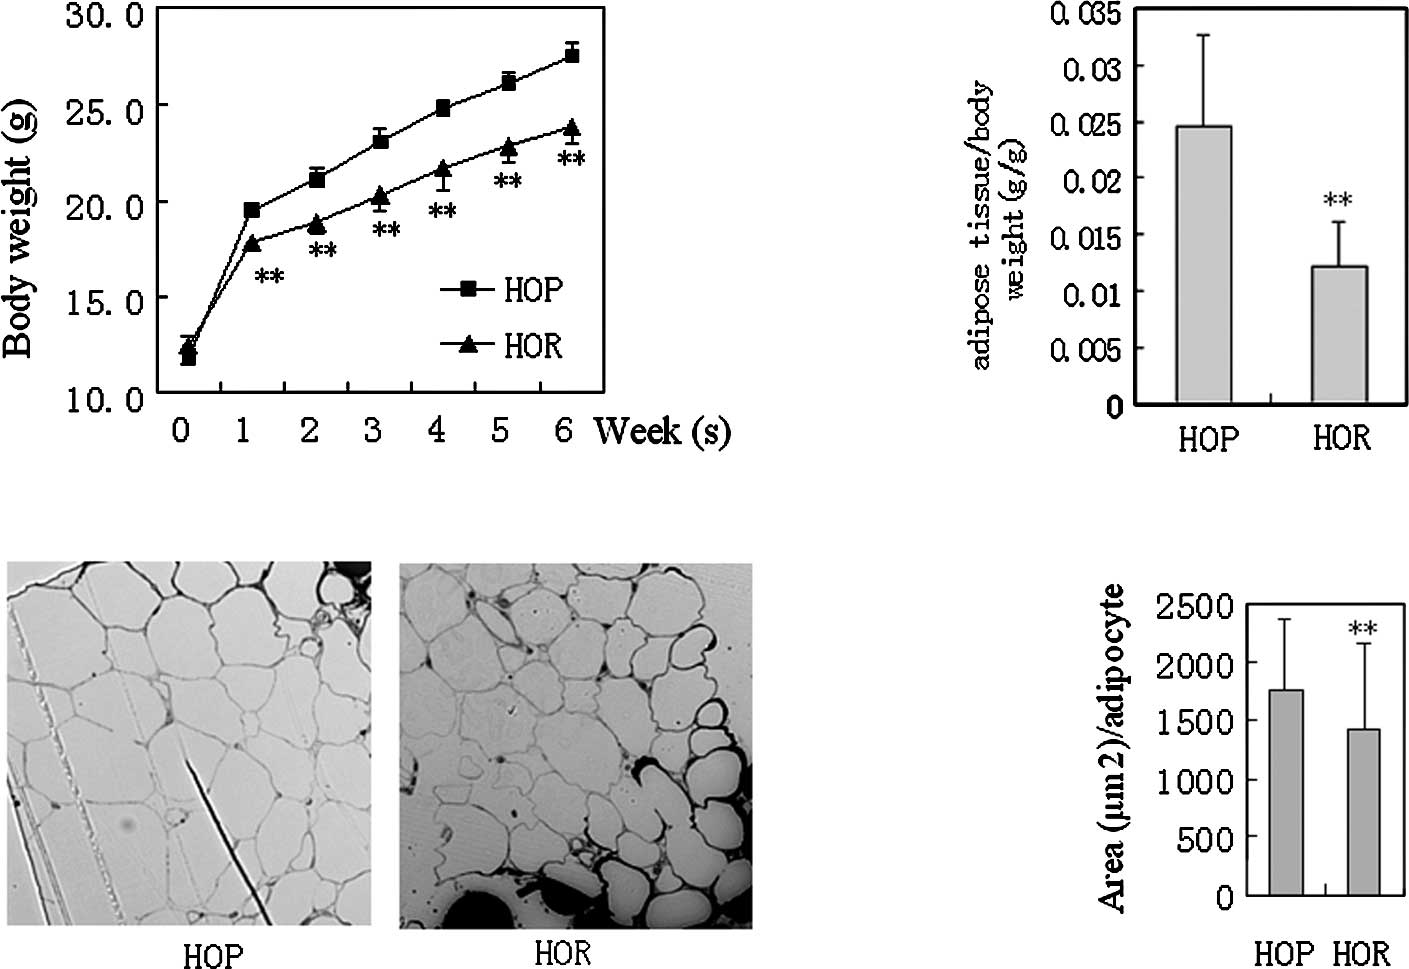
The HOR mice significantly exhibited decreased body
weight (P<0.01 vs. HOP) and visceral adipose tissue weight
(P<0.01 vs. HOP) compared to the HOP control after 6 weeks of
exposure to the high-fat diet (Fig.
1). The size of visceral adipocytes (areas/single cells in
sections) in the HOR mice was 20% less than that in the HOP control
(P<0.01 vs. HOP, n=100). No significant difference in dietary
caloric intake, water intake and urine excretions was observed
between the two groups after normalization for body weight (data
not shown). Total calorie count from fecal fat of each group was
crudely calculated according to fecal weights and fecal
triglycerides and was <1% of the total dietary caloric intake,
although a moderate decrease in fecal lipid excretions was noted in
the HOR mice. Therefore, caloric differences in intestinal lipid
absorption were negligible between the groups.
Serum biochemical parameters
Fasting blood glucose levels did not demonstrate a
significant change between the HOP and HOR mice at any week
(P>0.05) (Table II). A moderate
decrease in the levels of serum triglyceride (P<0.01 vs. HOP),
total cholesterol (P<0.05 vs. HOP) (on the 6th week) and
low-density lipoprotein cholesterol (on the 6th week) (P<0.05
vs. HOP) was observed in the HOR mice compared to the HOP control.
In addition, there was a >50% decrease in the serum leptin
concentration in the HOR mice compared to the HOP control
(P<0.05 vs. HOP); this indicates that HOR mice have less leptin
resistance.
| Table II.Changes in the blood glucose and lipid
parameters in mice after 6 weeks of treatment. |
Table II.
Changes in the blood glucose and lipid
parameters in mice after 6 weeks of treatment.
| HOP | HOR |
|---|
| Week 0 | | |
| Fasting blood
glucose (mmol/l) | 6.05±0.81 | 6.23±0.91 |
| Serum triglycerides
(mmol/l) | 1.13±0.45 | 1.09+0.23 |
| Serum total
cholesterol (mg/dl) | 85.70±15.40 | 89.10±9.70 |
| Week 6 | | |
| Fasting blood
glucose (mmol/l) | 8.79±1.31 | 8.52±0.95 |
| Serum triglycerides
(mmol/l) | 1.08±0.15 | 0.84±0.17b |
| Serum total
cholesterol (mg/dl) | 128.60±11.40 | 117.00±9.30a |
| Low-density
lipoprotein cholesterol (mg/dl) | 62.40±9.50 | 51.80±7.80a |
| High-density
lipoprotein cholesterol (mg/dl) | 45.10±2.90 | 45.50±3.00 |
| Serum leptin
(pg/ml) | 330.00±129.30 | 132.70±77.80a |
Differentially expressed proteins in
adipose tissues detected using 2-dimensional electrophoresis
Adipose tissues serve as the main marker of obesity.
Here, 2DE was used to investigate the differences in the expression
of proteins in adipose tissues between obesity-prone and
obesity-resistant mice. Proteins were regarded as differentially
expressed when the magnitude of the difference was >2-fold; this
result was reproduced twice. As a result, six proteins were found
differentially expressed between the HOP and HOR mouse samples
(Table III). HOR mice displayed a
significant change in the expression of proteins responsible for
cell skeleton, nutritional metabolism, cell proliferation and
divisions. Full images of the 2DE are shown in Fig. 2. Protein spots of interest (those
directly contributing to energy metabolism) are marked and enlarged
in Fig. 3. Ech1 expression, a key
enzyme associated with peroxisomal fat oxidation, was significantly
increased by 3.5-fold in the visceral adipose tissues of the HOR
mice compared to the HOP control.
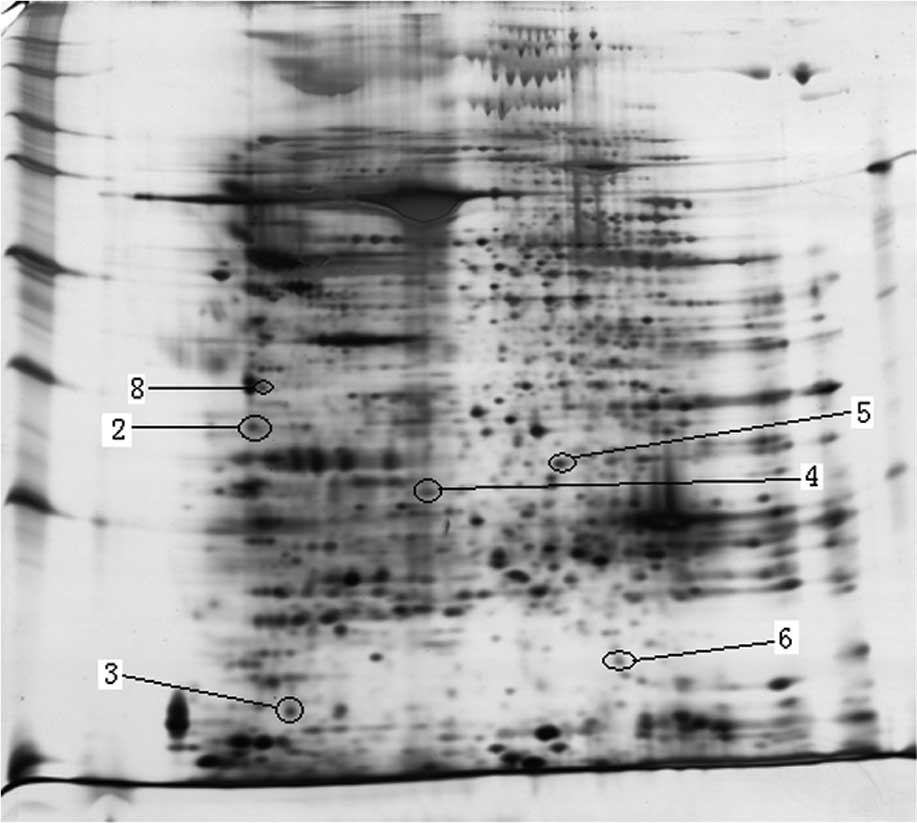 | Figure 2.Image of 2DE of the visceral adipose
tissues in HOP (A) and HOR (B) (n=3) mice. Differentially expressed
proteins are indicated with a circle. Protein spots: 2,
α-tropomyosin; 3, myosin light chain, phosphorylatable, fast
skeletal muscle; 4, purine-nucleoside phosphorylase; 5, enoyl
coenzyme A hydratase 1, peroxisomal; 6, transgelin; 8, vimentin.
HOP, high-fat diet-fed obesity-prone mice; HOR, high-fat diet-fed
obesity-resistant mice. |
| Table III.Differentially expressed proteins in
adipose tissues between the HOR and HOP mice. |
Table III.
Differentially expressed proteins in
adipose tissues between the HOR and HOP mice.
| Spot no. | Protein name | Mr/PI | NCBI accession
no. | Protein score | Sequence coverage
(%) | Fold change |
|---|
| 2 | α-tropomyosin | 32.7/4.7 | GI 157787199 | 108 | 16 | HOR↑ 6.4 |
| 3 | Myosin light chain,
phosphorylatable, fast skeletal muscle | 18.9/4.8 | GI 7949078 | 175 | 52 | HOR↑ 4.5 |
| 4 | Purine-nucleoside
phosphorylase | 32.2/5.8 | GI 7305395 | 104 | 35 | HOR↑ 6.0 |
| 5 | Enoyl coenzyme A
hydratase 1, peroxisomal | 36.1/7.6 | GI 7949037 | 217 | 24 | HOR↑ 3.5 |
| 6 | Transgelin | 22.6/8.85 | GI 6755714 | 129 | 65 | HOR↑ 3.1 |
| 8 | Vimentin | 51.5/5.00 | GI 2078001 | 224 | 28 | HOR (-) |
Ech1, PPARα and PPARγ expression in
adipose tissues detected using Western blotting
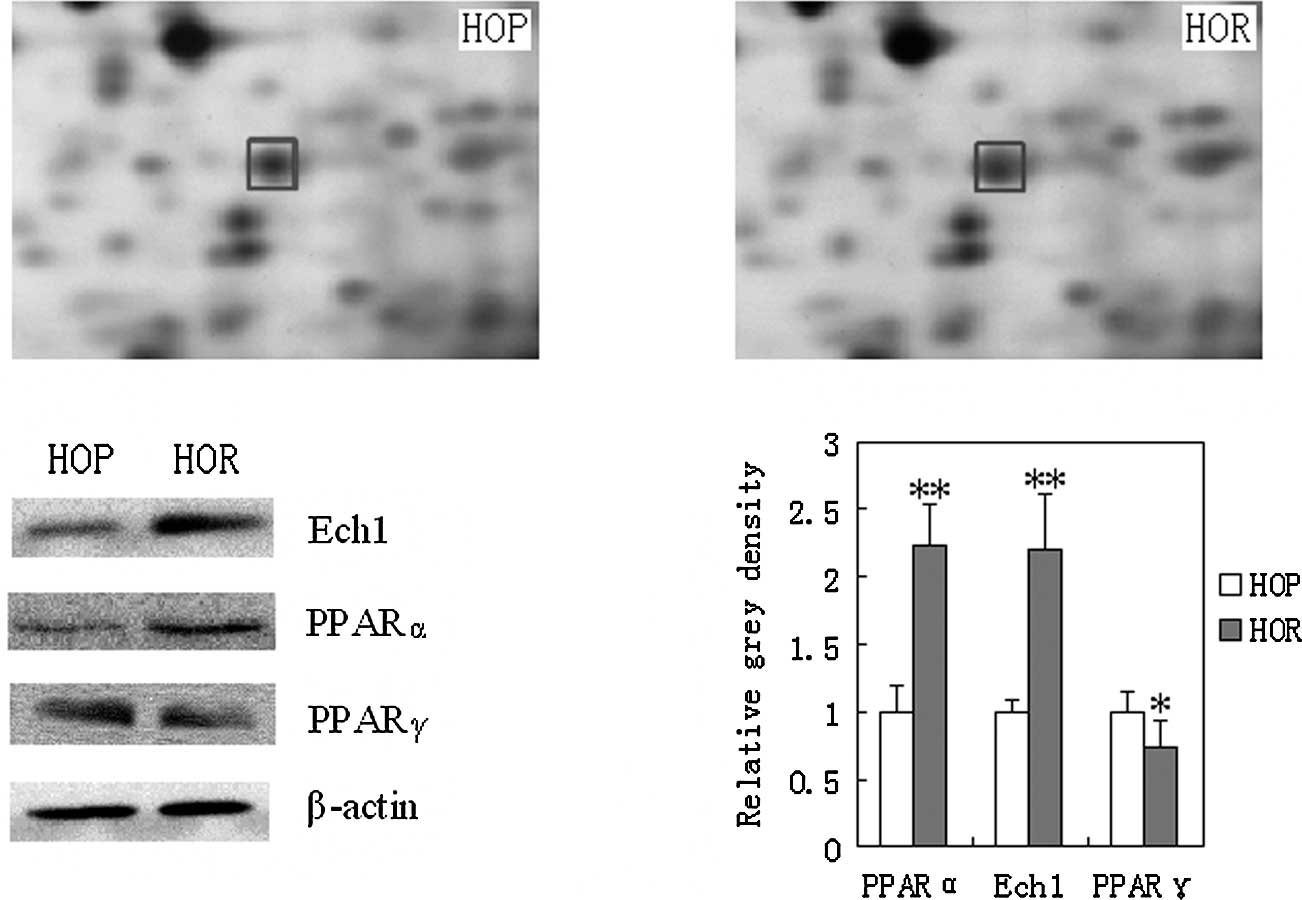
Western blot analysis further confirmed the
expression of Ech1 based on the results from proteomic trials. Ech1
(P<0.01) was significantly increased in the adipose tissues of
HOR mice compared to the HOP control as shown in Fig. 3. In addition, PPARα plays an
important role in fat metabolism by affecting the expression of
related enzymes. In this study, PPARα was significantly increased
in the visceral adipose tissues in both the HOR mice and the HOP
control (P<0.01). Moreover, PPARγ is a key factor responsible
for adipocyte differentiation. Here, the expression of PPARγ was
significantly down-regulated in the adipose tissues of the HOR mice
compared to that of the HOP control (P<0.01).
Expression of mitochondrial and
peroxisomal β-oxidation genes determined by q-PCR
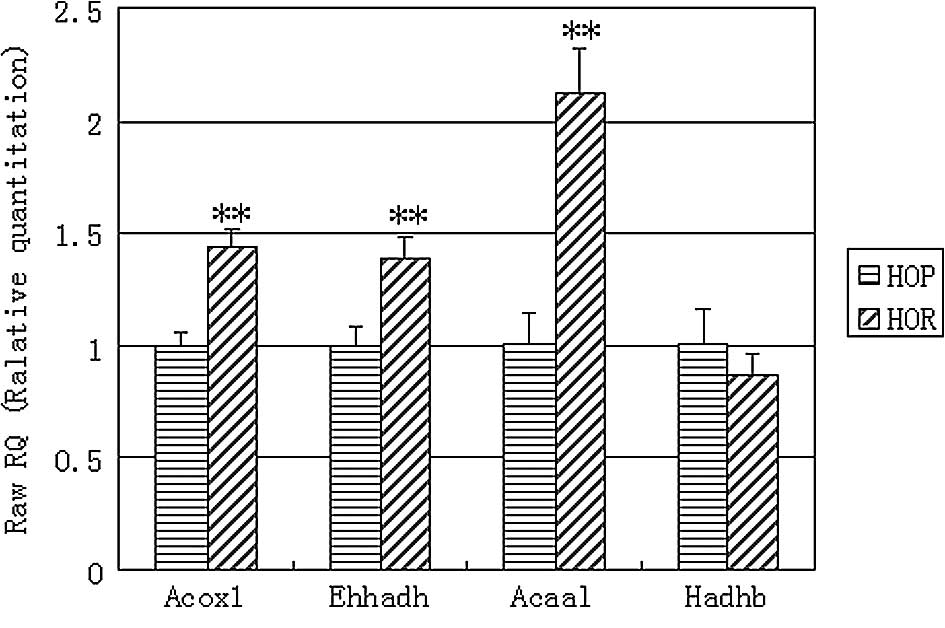
Using q-PCR analysis we further investigated the
expression of other mitochondrial and peroxisomal key β-oxidation
genes to provide additional useful information. The q-PCR results
showed that the expression of Acox1, Ehhadh and Acaal mRNAs was
significantly increased by 43.9 (P<0.01), 39.3 (P<0.01) and
111.4% (P<0.01) in the visceral adipose tissues of the HOR mice
compared to the expression levels in the HOP control (Fig. 4). However, the expression of Hadhb
was not significantly altered in the visceral adipose tissues of
the HOR mice compared to that of the HOP controls.
Discussion
In a previous study, outbred animals that showed
heterogeneous responses to high-fat diets were used to study
obesity-prone and obesity-resistant animals (17). In the present study, inbred animals
(C57BL/6 mice) also displayed different responses to high-fat diets
as previously described (18).
Actually, C57BL/6 mice show obesity-prone and obesity-resistant
phenotypes even when exposed to a low-fat diet (15). Obesity-resistant mice exhibited
reduced body weight and visceral fat accumulation. This may account
for a significant decrease in the serum leptin level, since leptin
is produced principally by white fat (19). Obese individuals, however, often
have increased leptin concentrations and are associated with leptin
resistance (20). However,
obesity-resistant mice appear to have less leptin resistance and
serum lipid levels when exposed to high-fat diets. Both leptin
resistance and hyperlipidemia are associated with cardiovascular
diseases (21,22). Therefore, obesity resistance may be
useful to prevent cardiovascular risks derived from obesity.
Despite this, the mechanisms underlying obesity resistance remain
undetermined.
Caloric intake is an important factor affecting body
weight gain (23). After
normalization of body weight, no significant difference in caloric
intake was observed between obesity-prone and obesity-resistant
animals; this suggests that caloric intake may not have been a key
factor affecting visceral fat accumulation in this study.
Intestinal lipid absorption is an important factor affecting body
weight (24). Here, the difference
in intestinal lipid absorption rate between obesity-prone and
obesity-resistant mice was minimal and did not contribute to
visceral fat accumulation. It is unclear whether high-fat
diet-induced obesity-resistant animals have an altered energy
metabolism potential in visceral adipose tissues, since these
tissues are important markers for obesity.
The proteomic method provides much information
regarding a disease when the mechanisms involved in a certain
disease are not known (25,26),
although it may be considered as a ‘fishing trip’. The previous
study found various differentiated expressed proteins involved in
energy metabolism, glycolysis and fat synthesis in visceral adipose
tissues of low-fat diet-fed obesity-prone and obesity-resistant
mice (15). Here, the HOR mice
displayed a significant change in expression of proteins
responsible for cell skeleton, nutritional metabolism, cell
proliferation and division. Peroxisomal Ech1 functions in the
auxiliary step of the fatty acid β-oxidation pathway (27) and plays an important role in fat
metabolism. In this study, Ech1 expression was significantly
increased in the adipose tissues of the HOR mice, which may be
associated with an accelerated fat metabolism resulting in reduced
visceral fat accumulation and serum lipid levels. Apart from Ech1,
other differentially expressed proteins, such as α-tropomyosin,
myosin light chain, urine-nucleoside phosphorylase and transgelin,
were noted in the HOR mice. Although their functions remain
unknown, they may be utilized in the development of biomarkers of
obesity resistance.
Following proteomic analysis, increased expression
of Ech1 was further confirmed by Western blot analysis. PPARα, an
essential transcription factor, is involved in the up-regulation of
lipid metabolism by affecting fatty acid-metabolizing enzymes
(28). In a previous study,
fenofibrate, a PPARα agonist, reduced the visceral fat accumulation
in mice exposed to high-fat diets (29). PPARα is highly expressed in the
liver and muscles, but is modestly expressed in white adipose
tissues (30). In this study,
increased PPARα expression in the visceral adipose tissues of HOR
mice as determined using Western blotting may have contributed to
enhance fat metabolism. This increase may have up-regulated the
expression of Ech1. Fenofibrate, an agonist of PPARα, was found to
up-regulate the expression of Ech1 (31). PPARγ, an essential transcription
factor, is a critical determinant of body fat distribution in
humans and mice (32). However, in
this study, PPARγ expression was decreased in the visceral adipose
tissues of the HOR mice, suggesting that this decrease may inhibit
adipogenesis. The reasons for the ‘teeter-tottering’ expression of
PPARα and PPARγ require further elucidation.
In addition, the expression of several key genes
responsible for fat β-oxidation were determined using q-PCR
analysis. Acox1, Ehhadh and Acaal are three peroxisomal β-oxidation
marker enzymes, while Hadhb is a key mitochondrial β-oxidation
enzyme (16). Acox1 catalyzes the
first step of peroxisomal β-oxidation and the dehydrogenation of
acyl-CoA esters to trans-2-enoyl-CoAs. Ehhadh catalyzes the second
and third steps of peroxisomal β-oxidation, hydration and
dehydrogenation of enoyl-CoA esters to ketoacyl-CoA. Acaa1 cleaves
3-oxoacyl-CoA to acetyl-CoA. Hadhb, which contains hydroxyacyl-CoA
dehydrogenase, 3-ketoacyl-CoA thiolase and enoyl-CoA hydratase, is
a trifunctional protein β subunit. In this study, increased
expression of the three peroxisomal β-oxidation marker genes, but
not that of the mitochondrial β-oxidation key gene, suggests that
HOR mice may exhibit enhanced expression of peroxisomal β-oxidation
marker enzymes thus promoting peroxisomal β-oxidation metabolism
instead of mitochondrial β-oxidation in visceral adipose tissues.
These up-regulated marker genes further suggest that visceral
adipose tissues may have increased peroxisomal β-oxidation
metabolism.
This study suggests that obesity-resistant animals
may show enhanced peroxisomal β-oxidation metabolism and thus
reduced fat accumulation in visceral adipose tissues by
up-regulation of the expression of Ech1, peroxisomal, or other
peroxisomal β-oxidation marker genes, such as Acox1, Ehhadh and
Acaal. This up-regulation may be driven or enhanced by up-regulated
expression of PPARα. Moreover, other proteins, such as
α-tropomyosin, myosin light chain, urine-nucleoside phosphorylase
and transgelin, may be utilized in the development of biomarkers
for obesity resistance. Further studies should focus on: i) how
peroxisomal β-oxidation metabolism functions in the visceral
adipose tissues of obesity-resistant animals; and ii) which
biomarkers are involved in obesity-resistance to a high-fat
diet.
Acknowledgements
This study was supported by the
National Natural Science Foundation of China (nos. 30871428 and
81072680), the Natural Science Foundation of Guangdong Province
(10151805702000002), the Specialized Research Fund for the Doctoral
Program of Higher Education of China (20100002120017), the China
Postdoctoral Science Foundation (20060390460), and the Tertiary
College Science Foundation of Nanshan, Shenzhen (2008028).
References
|
1.
|
Nguyen DM and El-Serag HB: The
epidemiology of obesity. Gastroenterol Clin North Am. 39:1–7. 2010.
View Article : Google Scholar
|
|
2.
|
Jia WP, Wang C, Jiang S and Pan JM:
Characteristics of obesity and its related disorders in China.
Biomed Environ Sci. 23:4–11. 2010. View Article : Google Scholar : PubMed/NCBI
|
|
3.
|
Schrauwen P and Westerterp KR: The role of
high-fat diets and physical activity in the regulation of body
weight. Br J Nutr. 84:417–427. 2000. View Article : Google Scholar : PubMed/NCBI
|
|
4.
|
Pagliassotti MJ, Gayles EC and Hill JO:
Fat and energy balance. Ann NY Acad Sci. 827:431–448. 1997.
View Article : Google Scholar : PubMed/NCBI
|
|
5.
|
Nair RP and Ren J: Pharmacotherapy of
obesity – benefit, bias and hyperbole. Curr Med Chem. 16:1888–1897.
2009.
|
|
6.
|
Jackman MR, MacLean PS and Bessesen DH:
Energy expenditure in obesity-prone and obesity-resistant rats
before and after the introduction of a high-fat diet. Am J Physiol
Regul Integr Comp Physiol. 299:R1097–R1105. 2010. View Article : Google Scholar : PubMed/NCBI
|
|
7.
|
Takahashi N, Patel HR, Qi Y, et al:
Divergent effects of leptin in mice susceptible or resistant to
obesity. Horm Metab Res. 34:691–697. 2002. View Article : Google Scholar : PubMed/NCBI
|
|
8.
|
Primeaux SD, Barnes MJ and Bray GA:
Olfactory bulbectomy increases food intake and hypothalamic
neuropeptide Y in obesity-prone but not obesity-resistant rats.
Behav Brain Res. 180:190–196. 2007. View Article : Google Scholar : PubMed/NCBI
|
|
9.
|
Ji H and Friedman MI: Reduced hepatocyte
fatty acid oxidation in outbred rats prescreened for susceptibility
to diet-induced obesity. Int J Obesity. 32:1331–1334. 2008.
View Article : Google Scholar : PubMed/NCBI
|
|
10.
|
Trinder P: Determination of glucose in
blood using glucose oxidase with an alternative oxygen acceptor.
Ann Clin Biochem. 6:24–27. 1969. View Article : Google Scholar : PubMed/NCBI
|
|
11.
|
Allain CC, Poon LC, Chan CS, et al:
Enzymatic determination of total cholesterol. Clin Chem.
20:470–475. 1974.PubMed/NCBI
|
|
12.
|
Fossati P and Prencipe L: Serum
triglycerides determined colorimetrically with an enzyme that
produce hydrogen peroxide. Clin Chem. 28:2077–2080. 1982.PubMed/NCBI
|
|
13.
|
Izzo C, Grillo F and Murador E: Improved
method for determination of high-density-lipoprotein cholesterol I.
Isolation of high-density lipoproteins by use of polyethylene
glycol 6000. Clin Chem. 27:371–374. 1981.PubMed/NCBI
|
|
14.
|
Kerscher L, Schiefer S, Draeger B, et al:
Precipitation methods for the determination of LDL-cholesterol.
Clin Biochem. 18:118–125. 1985. View Article : Google Scholar : PubMed/NCBI
|
|
15.
|
Xie WD, Wang H, Zhang JF, et al: Proteomic
profile of visceral adipose tissues between low-fat diet-fed
obesity-resistant and obesity-prone C57BL/6 mice. Mol Med Rep.
3:1047–1052. 2010.PubMed/NCBI
|
|
16.
|
Guo Y, Jolly RA, Halstead BW, et al:
Underlying mechanisms of pharmacology and toxicity of a novel PPAR
agonist revealed using rodent and canine hepatocytes. Toxicol Sci.
96:294–309. 2007. View Article : Google Scholar : PubMed/NCBI
|
|
17.
|
Pagliassotti MJ, Knobel SM, Shahrokhi KA,
et al: Time course of adaptation to a high-fat diet in
obesity-resistant and obesity-prone rats. Am J Physiol.
267:R659–R664. 1994.PubMed/NCBI
|
|
18.
|
Xie WD, Zhang YO, Wang NL, et al: Novel
effects of macrostemonoside A, a compound from Allium
macrostemon Bung, on hyperglycemia, hyperlipidemia, and
visceral obesity in high-fat diet-fed C57BL/6 mice. Eur J
Pharmacol. 599:159–165. 2008.PubMed/NCBI
|
|
19.
|
Trayhurn P and Beattie JH: Physiological
role of adipose tissue: white adipose tissue as an endocrine and
secretory organ. Proc Nutr Soc. 60:329–339. 2001. View Article : Google Scholar : PubMed/NCBI
|
|
20.
|
Rosicka M, Krsek M, Matoulek M, et al:
Serum ghrelin levels in obese patients: the relationship to serum
leptin levels and soluble leptin receptor levels. Physiol Res.
52:61–66. 2003.PubMed/NCBI
|
|
21.
|
Luo JD, Zhang GS and Chen MS: Leptin and
cardiovascular diseases. Timely Top Med Cardiovasc Dis.
9:E342005.PubMed/NCBI
|
|
22.
|
Kannel WB and Vasan RS: Triglycerides as
vascular risk factors: new epidemiologic insights. Curr Opin
Cardiol. 24:345–350. 2009. View Article : Google Scholar : PubMed/NCBI
|
|
23.
|
Swinburn B, Sacks G and Ravussin E:
Increased food energy supply is more than sufficient to explain the
US epidemic of obesity. Am J Clin Nutr. 90:1453–1456. 2009.
View Article : Google Scholar : PubMed/NCBI
|
|
24.
|
Kaplan LM: Pharmacologic therapies for
obesity. Gastroenterol Clin North Am. 39:69–79. 2010. View Article : Google Scholar
|
|
25.
|
Huzarewich RL, Siemens CG and Booth SA:
Application of “omics” to prion biomarker discovery. J Biomed
Biotechnol. 2010:6135042010.
|
|
26.
|
Halvorsen YD, Wilkison WO and Briggs MR:
Human adipocyte proteomics – a complementary way of looking at fat.
Pharmacogenomics. 1:179–185. 2000.
|
|
27.
|
FitzPatrick DR, Germain-Lee E and Valle D:
Isolation and characterization of rat and human cDNAs encoding a
novel putative peroxisomal enoyl-CoA hydratase. Genomics.
27:457–466. 1995. View Article : Google Scholar : PubMed/NCBI
|
|
28.
|
Aoyama T, Peters JM, Iritani N, et al:
Altered constitutive expression of fatty acid-metabolizing enzymes
in mice lacking the peroxisome proliferator-activated receptor
alpha (PPARalpha). J Biol Chem. 273:5678–5684. 1998. View Article : Google Scholar
|
|
29.
|
Xie WD, Nie Y, Du LJ, et al: Preventive
effects of fenofibrate on insulin resistance, hyperglycaemia,
visceral fat accumulation in NIH mice induced by small-dose
streptozotocin and lard. Pharmacol Res. 55:392–399. 2007.
View Article : Google Scholar : PubMed/NCBI
|
|
30.
|
Abbott BD: Review of the expression of
peroxisome proliferator-activated receptors alpha (PPAR alpha),
beta (PPAR beta), and gamma (PPAR gamma) in rodent and human
development. Reprod Toxicol. 27:246–257. 2009. View Article : Google Scholar : PubMed/NCBI
|
|
31.
|
Miyazaki M, Nakagawa I, Koga S, et al:
Proteomics analysis of cardiac muscle from rats with peroxisomal
proliferator-activated receptor alpha (PPARalpha) stimulation. J
Toxicol Sci. 35:131–135. 2010. View Article : Google Scholar
|
|
32.
|
Tsai YS and Maeda N: PPARgamma: a critical
determinant of body fat distribution in humans and mice. Trends
Cardiovasc Med. 15:81–85. 2005. View Article : Google Scholar : PubMed/NCBI
|