Introduction
Cell membrane glycoproteins and glycolipids play a
significant role in a number of biological functions such as
cell-cell interactions, growth regulation, differentiation and
malignant transformation. Metastasis is a selective process by
which certain tumor cells disseminate to form secondary foci at
distant sites (1,2). Tumor cell metastasis requires
alterations in membrane properties determined by cell surface
glycoconjugates (3,4). The biosynthesis of carbohydrate
structures is tissue-specific and developmentally regulated by
glycosyltransferases (5).
Alterations in the expression and activity of glycosyltransferases
could result in structural variations of glycans on glycoproteins
in the cell membrane, which in turn alter their interaction with
carbohydrate-binding proteins and modulate the role of the membrane
glycan in cell adhesion and signal transduction events required for
cell motility. Simultaneous analysis of the expression of all
glycan-related genes clearly gives the advantage of enabling a
comprehensive view of the genetic background of the glycobiological
changes in cancer cells.
Hepatocellular carcinoma (HCC) is an aggressive
cancer with poor prognosis, ranking fourth in the world and second
in China in cancer mortality, despite the advances in surgery. High
recurrence and metastasis rates have been the reason for the poor
long-term survival (6). However,
the universal alteration in the structure and composition of
glycans in the cell membrane protein structure has not yet been
clearly defined in HCC metastasis.
The goal of this study was to identify
differentially expressed glycosyltransferases in HCC
metastasis-specific glycogenes and glycan structures using DNA
microarray analysis and lectin chips. A significant advantage of
gene expression analysis is that it constitutes a simple and
uniform process for material handling. To date, the expression
profile of glycosyltransferases during metastasis has not been
determined. In the present study, using a glycogene microarray
approach that detects the transcript levels of enzymes regulating
glycosylation between the hepatoma cell lines, HCCLM3 (high
metastasis) and Hep3B (low metastasis), while the glycan profile
signature of the membrane protein labeled with Cy3 was assayed
through the lectin-based array. Through ingenuity pathways analysis
(IPA), differentially expressed glycosyltransferases mainly played
a role in biological processes such as angiogenesis, cell adhesion
and invasion. These changes were possibly related to the metastatic
potential of HCCLM3 cells.
Materials and methods
Materials
RPMI-1640, fetal bovine serum, glutamine, guaninium
isothiocyanate/phenol/chloroform and ethidium bromide were
purchased from Gibco BRL (Auckland, NJ, USA); The ProteoExtract™
native membrane extraction kit was from the Calbiochem company of
Merck KGaA (Darmstadt, Germany). The Cy3-monofunctional dye pack
was from GE Healthcare (Piscataway, NJ, USA). The 2D-quantification
kit was from GE Healthcare.
Cell culture
The low-metastatic HCC cell line, Hep3B, a gift from
Cornell University, was cultured with α-MEM medium (Gibco BRL). The
high-metastatic HCC cell line, HCCLM3, established in our
institute, was cultured with Dulbecco's modified Eagle's medium
(Gibco BRL). All culture media were supplemented with 10% fetal
bovine serum (HyClone, Logan, UT, USA) and placed in an incubator
containing 5% CO2 at 37°C.
Glycogene microarray fabrication
The glycogene microarray is an oligonucleotide
microarray designed by the CapitalBio company (Beijing, China). The
array contains 115 genes including 90 glycosyltransferases, 20
glycosidases and 5 nuclear sugar transporters. Individual 70-mer
oligonucleotides complementary to sequences within these human
mRNAs were designed and prioritized using stringent selection
criteria, including minimal secondary structure, minimal homology
to other genes in the available human genomic databases, no low
complexity or repeat regions. The individual oligonucleotide probe
was printed 5 times on chemical modification glass slides and 15x15
spot configuration of each subarray. The spot diameter was 120 μm,
and the distance from center to center was 280 μm.
RNA preparation and chip
hybridization
Total RNA from the cells was extracted with TRIzol
reagent (Invitrogen, Carlsbad, CA, USA), and purified with the
NucleoSpin RNA clean-up kit (Macherey-Nagel, Germany). Total RNA
(40 μg) was labeled by reverse transcription using Superscript II
transcriptase, oligo(dT) primer, Cy3dCTP and Cy5dCTP for Hep3B and
HCCLM3, respectively. The labeled cDNAs were then hybridized to
microarrays at 42°C for 12–18 h. The micro-arrays were scanned
using a dual laser scanner (LuxScan 10K/A; CapitalBio). The figure
signal was then transformed to a digital signal using image
analysis software (LuxScan3.0; CapitalBio). Signal intensities for
each spot were calculated by subtracting the local background from
the total intensities. The experimental data were analyzed with the
QuantArray software package. All the procedures were performed
according to the manufacturer's instructions.
Data acquisition and statistical
analysis
Arrays were scanned at 5 μm resolution on a LuxScan
10KA double channel scanner (CapitalBio) at the maximal laser power
that produced no saturated spots. The adaptive threshold method was
used to differentiate the spot from the background and the spot
intensity was determined using median pixel intensity. Prior to
normalization, quality confidence measurements (spot diameter, spot
area, array footprint, spot circularity, signal:noise ratio, spot
uniformity, background uniformity and replicate uniformity) were
calculated for each scanned array and spots were flagged that did
not pass stringent selection criteria.
Each sample was labeled by Cy3 and Cy5, for each
probe there were 5 repeats in each array. Transformed expression
values for each probe were averaged to get a single expression
value. The statistically significant changes in gene expression
were then identified using the permutation-based, significance
analysis of microarrays (SAM) algorithm (v2.20; Stanford
University, CA, USA), which reports the median false discovery rate
(FDR) as the percentage of genes in the identified gene list that
are falsely reported as showing statistically significant
differential expression. The cut-off value for significance in
these experiments was set at a 5% FDR at a specified 2-fold
change.
Quantitative real-time PCR analysis
The expression levels of selected genes were
validated and analyzed by real-time PCR using Brilliant SYBR-Green
qRT-PCR Master Mix (Stratagene, Santa Clara, CA, USA) on a BioRad
Real-Time PCR System. All primer sets were designed across
intron:exon boundaries (Table I),
with individual primer concentrations and final amplification
conditions optimized for each gene. Dissociation curves were
performed on all reactions to assure product purity. Original input
RNA amounts were calculated by comparison to standard curves using
a purified PCR product as a template for the mRNAs of interest and
were normalized to the amount of actin. Experiments were performed
in triplicate for each data point.
 | Table I.The primers of validated
glycogenes. |
Table I.
The primers of validated
glycogenes.
| Gene | Forward
(5′→3′)
reverse (5′→3′) | Product (bp) |
|---|
| MGAT5 |
GCTGCCCAACTGTAGGAGAC | 127 |
|
GAATCAAGGACTCGGAGCAT | |
| MGAT3 |
GCCTCACCTTGGGAGTTATC | 286 |
|
GCATCATTGGGTAGCGTCTG | |
| FUT8 |
AGCGAACACTCATCTTGGAA | 257 |
|
TTGACAAACTGAGACACCCA | |
| ST3GalI |
CACGAATGGCGTTGGTCTAC | 131 |
|
CTCAATCAAAAGGGATGGCA | |
| β3GalT5 |
CAGATAACCCGTGGGGATAG | 133 |
|
GCACCAAGTGGGAACTAATC | |
| β-actin |
CATGTACGTTGCTATCCAGGC | 250 |
|
CTCCTTAATGTCACGCACGAT | |
Membrane protein labeling and
extraction
A total of 5–10x106 cells were incubated
with 0.5 M EDTA in phosphate-buffered saline (PBS) (pH 7.2) for 10
min, and collected by centrifugation at 500 x g at 4°C for 10 min.
The cells were then washed with PBS twice to remove EDTA, and
resuspended in 200 μl PBS.
A vial of Cy3-monofunctional dye powder (GE
Healthcare) was dissolved with 50 μl DMSO. Dye/DMSO mixture (10 μl)
was added to 200 μl cell suspension, and incubated in the dark at
4°C for 2 h to label the intact cell membrane. The labeled cells
were washed with PBS 3 times and centrifuged at 600 x g 4°C for 10
min to remove redundant fluorescent dyes. Then the labeled samples
were quickly frozen in liquid nitrogen and stored at −80°C in the
dark. The ProteoExtract™ native membrane extraction kit
(Calbiochem) was adopted to extract cell membrane proteins
according to the manufacturer's instructions. 2D-quantification kit
(GE Healthcare) was used to determine the protein
concentration.
Lectin array analysis
To detect the glycan alteration of the membrane
protein, Cy3-labeled membrane glycoprotein was incubated with
lectin array. A total of 13 types of tumor-associated lectins
(Vector Laboratories, Burlingame, CA, USA) were dissolved with
chip-spotting buffer (CapitalBio) at a concentration of 1 mg/ml,
and spotted on a gel-substrate chip using the microarray printing
robot, Smart Arrayer-48 (CapitalBio). The diameter of each point
was 150 μm, and the distance between two points was 400 μm. Each
lectin point had 4 repeats. The chip was then incubated in a vacuum
chamber with humidity greater than 80% at 25°C overnight to
immobilize the lectins.
To block the non-specific binding sites on the chip,
100 μl of 0.1% Tris-HCl were added (25°C, 1 h) and then washed with
0.1% TBS-Tween-20 solution (5 min, 3 times). Next, 10 μg of
Cy3-labeled glycoprotein suspended in TBS (1 mM Ca2+, 2
mM Mg2+) were added to each chip in a final volume of 40
μl and incubated at 25°C for 2 h with gentle rocking. The unbound
glycoprotein was washed off with cold 0.1% TBS-Tween-20 solution
(15 min, 3 times) and immersed in PBS for 5 min. The chip was then
centrifuged at 1,500 rpm to get rid of residual liquid and prepare
it for scanning.
The binding fluorescence signals of the
glycoproteins with lectins on the gel slide were obtained with the
fluorescence scanner LuxScan 3.0 (CapitalBio). The net intensity
value for each spot was calculated by subtracting the background
value. Median rectification was used to calculate the
dye-bias-corrected ratios. Median corrected data were used to
calculate the q-value by T-statistic analysis with SAM version 2.10
software.
Fluoresceinated lectin staining
The HCC cells lines Hep3B and HCCLM3 were cultured
in 24-well plates (Gibco, BRL), and wells at 60–80% confluence were
selected. First, the cells were fixed with ice-cold
paraformaldehyde for 15 min and rinsed three times with PBS, then
the cells were incubated with biotinylated LCA, PHA-E and RCA-1 (5
μg/ml in PBS-T with 5% BSA) for 30 min. After rinsing 3 times with
PBS, cells were then incubated with Streptavidin-Alexa fluor 488
(1:1,000 dilutions in PBS-T with 5% BSA; Molecular Probes, Leiden,
Holland) for 30 min and rinsed 3 times with PBS. Finally, the cells
were incubated with the DAPI (300 nM in PBS; Molecular Probes) for
5 min and washed with PBS 3 times. The images for all the cell
lines were then captured using an inverted microscope (IX81;
Olympus, Tokyo, Japan) under the same conditions.
Functional study of differentially
expressed genes by IPA
Differentially expressed genes were uploaded to the
IPA database to explore the possible biological function in HCC
metastasis. The IPA tool is capable of mapping a gene network based
on the information stored in the IPA database or PubMed. With this
network, the correlation between various genes and the biological
function of target genes in a certain disease or biological process
is capable of being elucidated.
Results
Identification of differentially
expressed glycosyltransferase and glycosidase genes
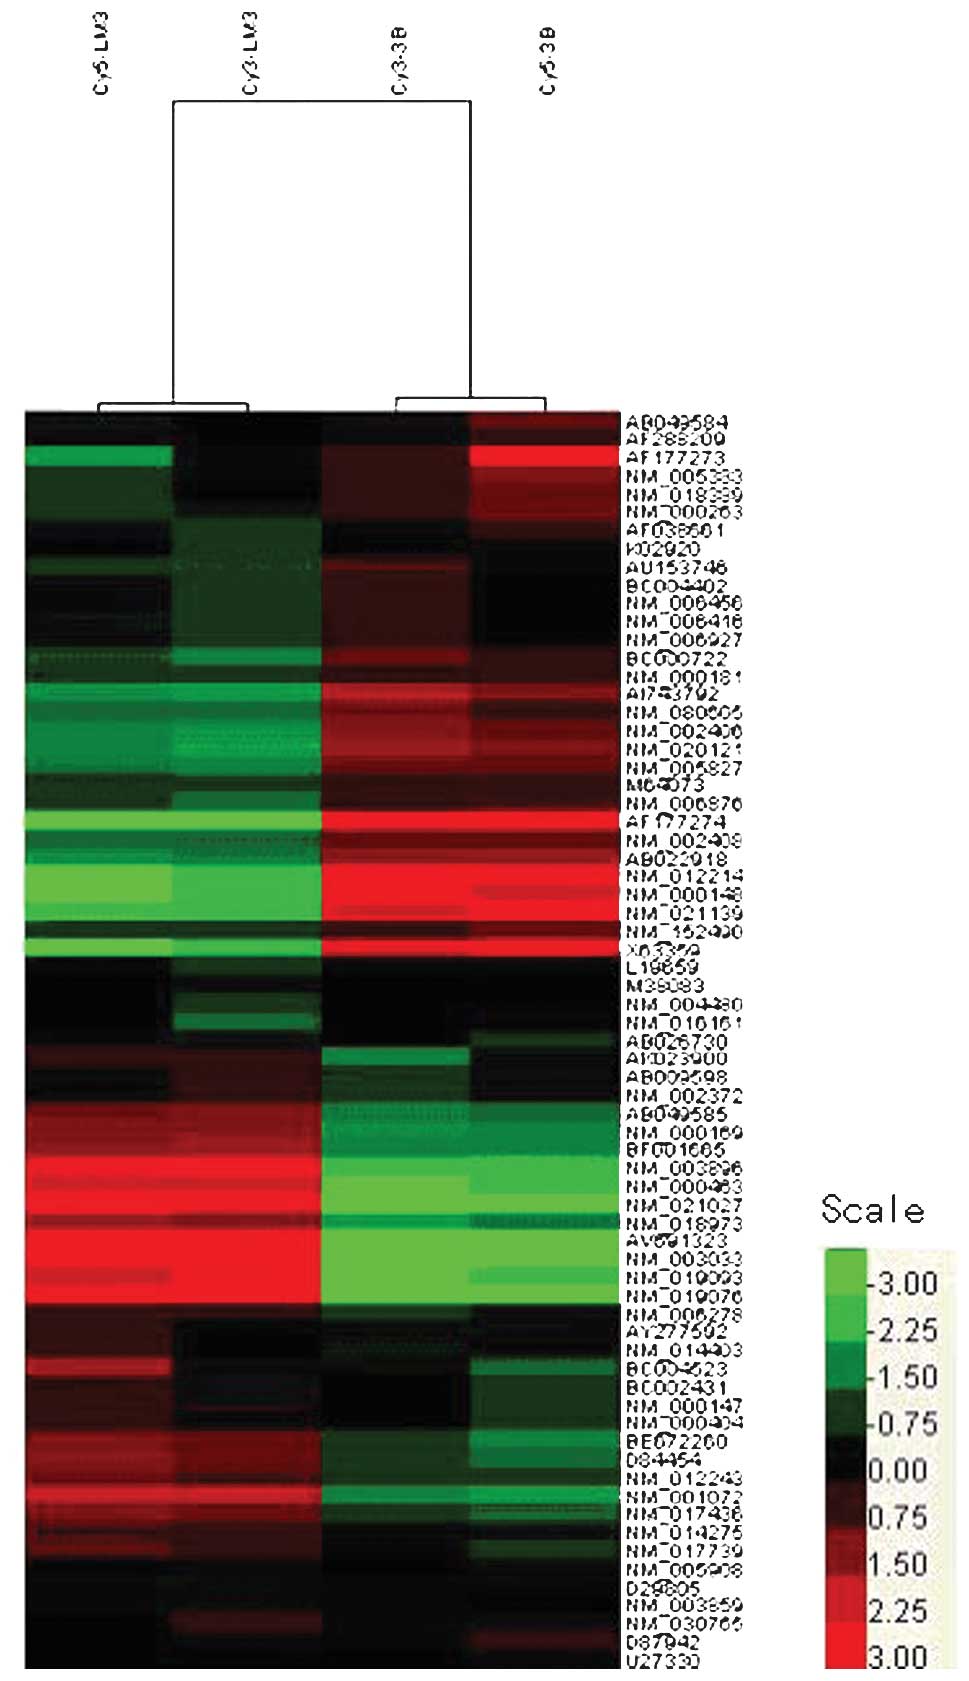
The differentially expressed genes were visualized
as a heat map using Cluster and TreeView software (Fig. 1). This removes all genes that have
missing values in more than 20% of the columns. The color-based
view also demonstrates that HCCLM3 and Hep3B cells present distinct
gene expression profiles from each other. Using the difference ≤0.5
or ≥2 as a criteria, a total of 29 genes were found to be
differentially expressed between Hep3B and HCCLM3 cells. A total of
18 genes were found to be up-regulated, while 11 genes were
down-regulated. Table II
demonstrates the 18 up-regulated genes and 11 down-regulated genes,
which have been grouped in the synthesis of N-glycan, O-glycan,
glycosaminoglycans and hyaluronan synthase using the Kyoto
Encyclopedia of Genes and Genomes (KEGG) database according to the
respective function in glycan synthesis.
| Table II.Differentially expressed glycogenes
categorized according to their specific function in glycan
synthesis. |
Table II.
Differentially expressed glycogenes
categorized according to their specific function in glycan
synthesis.
| Glycan structures
or pathways | Differentially
expressed gene | Ratio
(HCCLM3/Hep3B) | Accession
number | Gene
description |
|---|
| N-glycans | | | | |
| Precursor
synthesis | ManT1 | 2.01363↑ | NM_003859 | Human
dolichyl-phosphate mannosyltransferase polypeptide 1 |
| ManT3 | 4.37367↑ | NM_018973 | Human
dolichyl-phosphate mannosyltransferase polypeptide 3 |
| Core
fucosylation | FUT8 | 6.3533↑ | NM_004480 | Human
α1,6-fucosyltransferase |
| Branching | MGAT1 | 0.48111↓ | NM_002406 | Human mannosyl
(α-1,3-)-glycoprotein β-1,2 -N-acetylglucosaminyltransferase |
| MGAT4 | 0.06468↓ | NM_012214 | Human mannosyl
(α-1,3-)-glycoprotein β-1,4N-acetylglucosaminyltransferase |
| MGAT3 | 10.3469↑ | NM_002409 | Human mannosyl
(β-1,4-)-glycoprotein β-1,4-N-acetyl-gluocosaminyltransferase |
| MGAT5 | 5.3155↑ | NM_002410 | Human mannosyl
(α-1,6-)-glycoprotein β-1,6-N-acetyl-glucosaminyltransferase |
| O-glycans | | | | |
| Sialyl T
synthesis | OGT | 4.13733↑ | BF0016665 | Human O-linked
N-acetylglucosamine (GlcNAc) transferase |
| ST3GalI | 43.6553↑ | NM_003033 | Human ST3
β-galactoside α-2,3-sialyl-transferase 1 |
| ST3GalV | 6.25835↑ | NM_003896 | Human ST3
β-galactoside α-2,3-sialyl-transferase 5 |
| GLA | 3.54975↑ | NM_000169 | Human galactosidase
α |
| A4GalT | 2.61501↑ | NM_017436 | Human
α1,4-galactosyltransferase |
| Mannosidase I | 2.59369↑ | NM_002372 | Human mannosidase,
α, class 2A, member 1 |
| Altered
sialylation | Neu1 | 0.36391↓ | BC000722 | Human sialidase
1 |
| Lewis antigens | | | | |
| Type II Lewis
antigen | ST3GalVI | 0.41396↓ | AB022918 | Human
α2,3-sialyltransferase |
| ST6GalI | 0.39456↓ | AI743792 | Human β-galactoside
α2,6-sialyltransferase I |
| β3GalT5 | 95.4585↑ | NM_006057 | Human
UDP-Gal:βGlcNAc β1,3-galactosyltransferase, polypeptide 5 |
| Type I Lewis
antigen | FUT1 | 0.1745↓ | NM_000148 | Human
fucosyltransferase 1 |
| Sialyl Lewis
a | β3Gn-T3 | 2.75732↑ | AB049585 | UDP-GlcNAc:βGal
β-1,3-N-acetylglucosaminyltransferase 3 |
| Others | | | | |
| B3Gn-T1 | 0.48205↓ | NM_006876 | Human
UDP-GlcNAc:βGal β-1,3-N-acetylglucosaminyltransferase 1 |
| GlcUA T1A1 | 12.9011↑ | NM_000463 | Human UDP
glucuronosyltransferase 1 family, polypeptide A1 |
| GlcUA T1A3 | 7.24136↑ | NM_019093 | Human UDP
glucuronosyltransferase 1 family, polypeptide A3 |
| GlcUA T1A8 | 48.8147↑ | NM_019076 | Human UDP
glucuronosyltransferase 1 family, polypeptide A8 |
| GlcUA T1A9 | 74.7245↑ | NM_021027 | Human UDP
glucuronosyltransferase 1 family, polypeptide A9 |
| GlcUA T1A10 | 37.4103↑ | AV691323 | Human UDP
glucosyltransferase 1 family, polypeptide A10 |
| GlcUA T2B4 | 0.21884↓ | NM_021139 | Human UDP
glucuronosyltransferase 2 family, polypeptide B4 |
| GlcUA T2B10 | 0.08542↓ | X63359 | Human UDP
glucuronosyltransferase 2 family, polypeptide B10 |
| GlcUAT2B28 splice
2 | 0.36287↓ | AF177273 | Human
UDP-glucuronosyltransferase type 2 |
| GlcUAT2B28 splice
3 | 0.16502↓ | AF177274 | Human
UDP-glucuronosyltransferase type 3 |
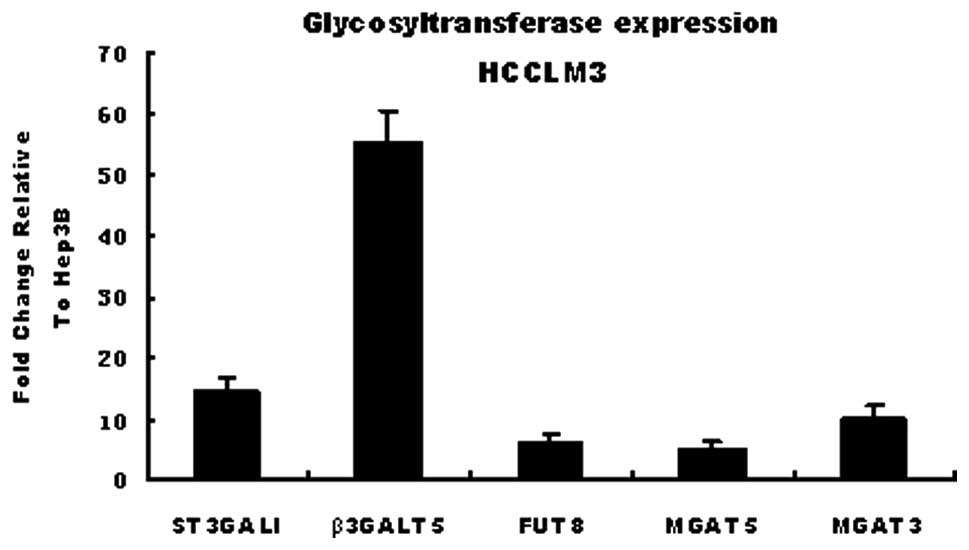
qRT-PCR validation of differentially
expressed genes in cell lines
A total of 5 glycosyltransferases including ST3GalI,
FUT8, MGAT3, MGAT5 and β3GalT5 were selected to verify the results
of the GT oligonucleotide array by methods of real-time PCR.
β-actin was used as a reference. These genes were selected mainly
due to their correlation with lectins MAL-I, MAL-II, LCA and PHA-E.
The affinity of the HCCLM3 and Hep3B cell lines for these lectins
differs. The results of real-time PCR proved that the expressions
of ST3GalI, FUT8, MGAT3, MGAT5 and β3GalT5 were up-regulated to a
different extent in HCCLM3, supporting the data from the chip array
(Fig. 2).
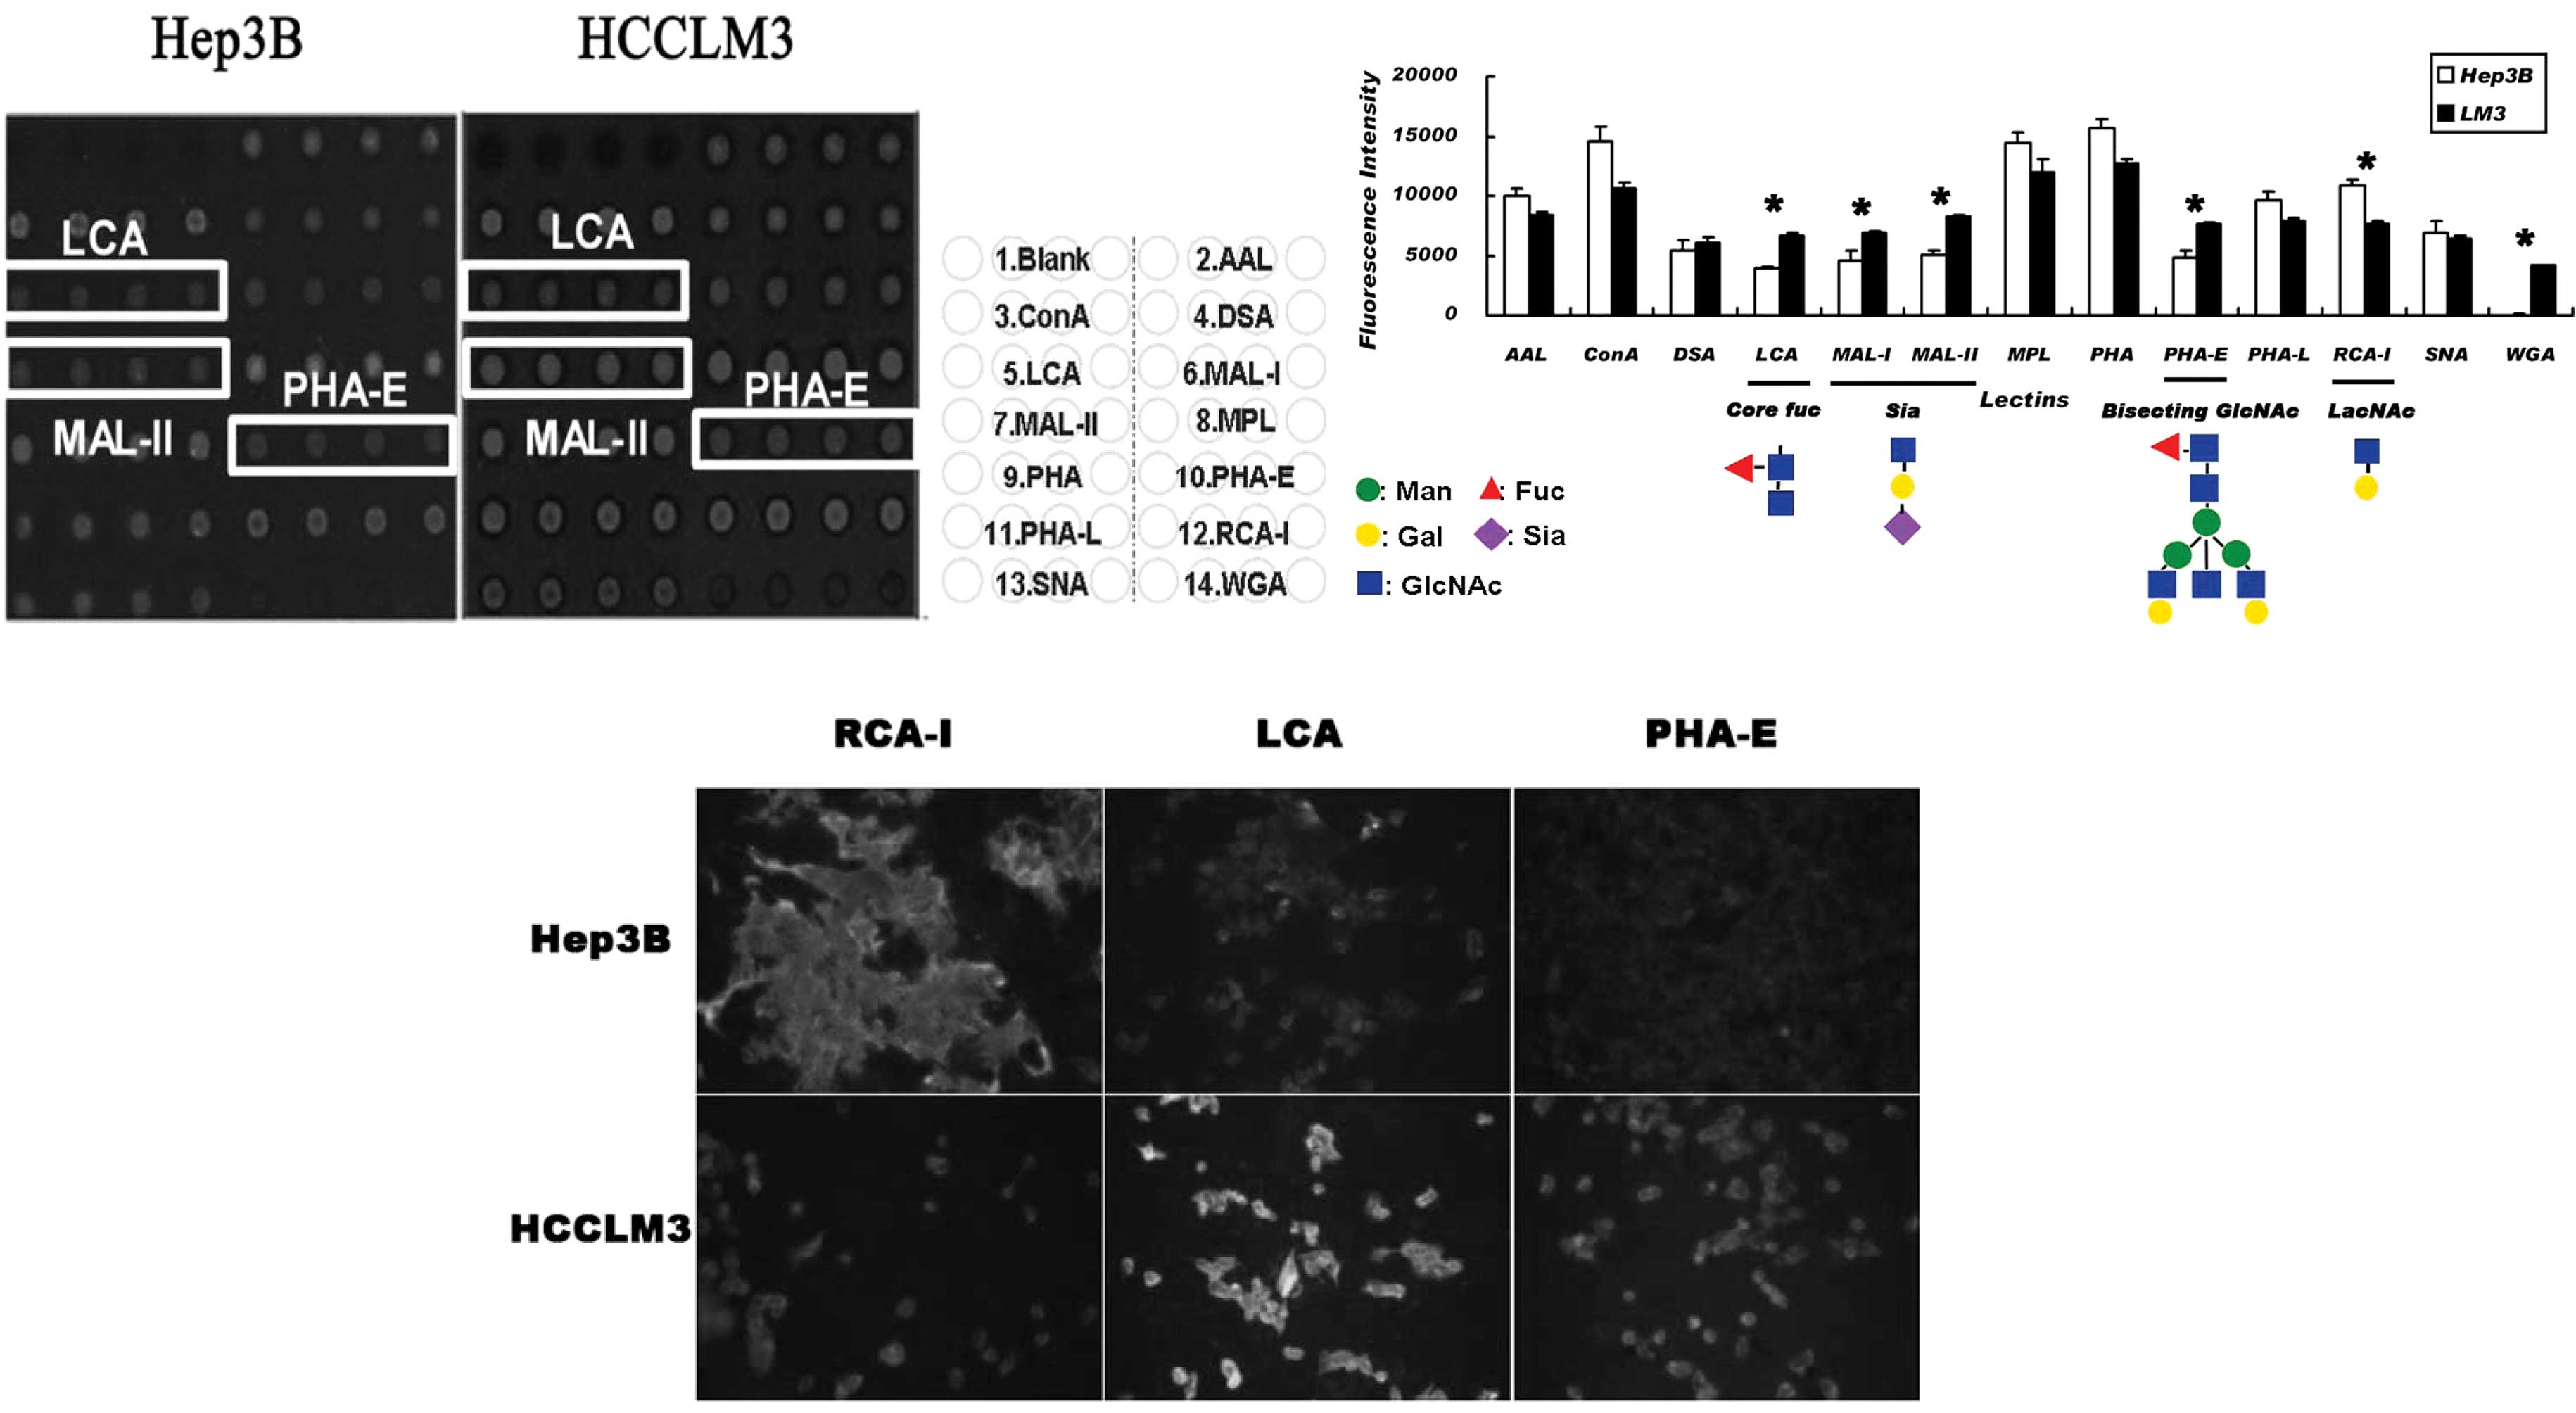
Alteration in transcript levels of
glycosyltransferases is associated with corresponding changes in
the glycan structures of glycoproteins
To examine whether the differential
glycosyltransferases have led to the alteration of the related
glycan structure, the lectin array and fluorescence labeling lectin
staining were selected to compare the cell surface glycan profile
between Hep3B and HCCLM3 cells. It was found that the cell line
with a high metastatic tendency exhibited a higher affinity for
LCA, MAL-I, MAL-II, WGA and PHA-E, and a lower affinity for RCA-I
(Fig. 3A). The core fucose
structure, sialic acid structure (mainly in the 2,3 link),
N-acetylglycosamine and bisecting oligo-glycan were up-regulated,
while end-β1-4-linked galactose was down-regulated (Fig. 3B). Cell surface lectin affinity
chemistry using biotin-labeled LCA, PHA-E and RCA-I reconfirmed the
result of the lectin array (Fig.
3C).
Combined analysis of the results obtained from the
lectin affinity profile and glycogene microarray, showed the
up-regulation of FUT8, MGAT3 and ST3GalI in HCCLM3 cells matched
with the structure of corefucosylation, bisecting
N-acetylglucosamine and α2–3 sialic acid. Therefore, the affinity
increased in the LCA, PHA-E, MAL-I, MAL-II and WGA affinity
assay.
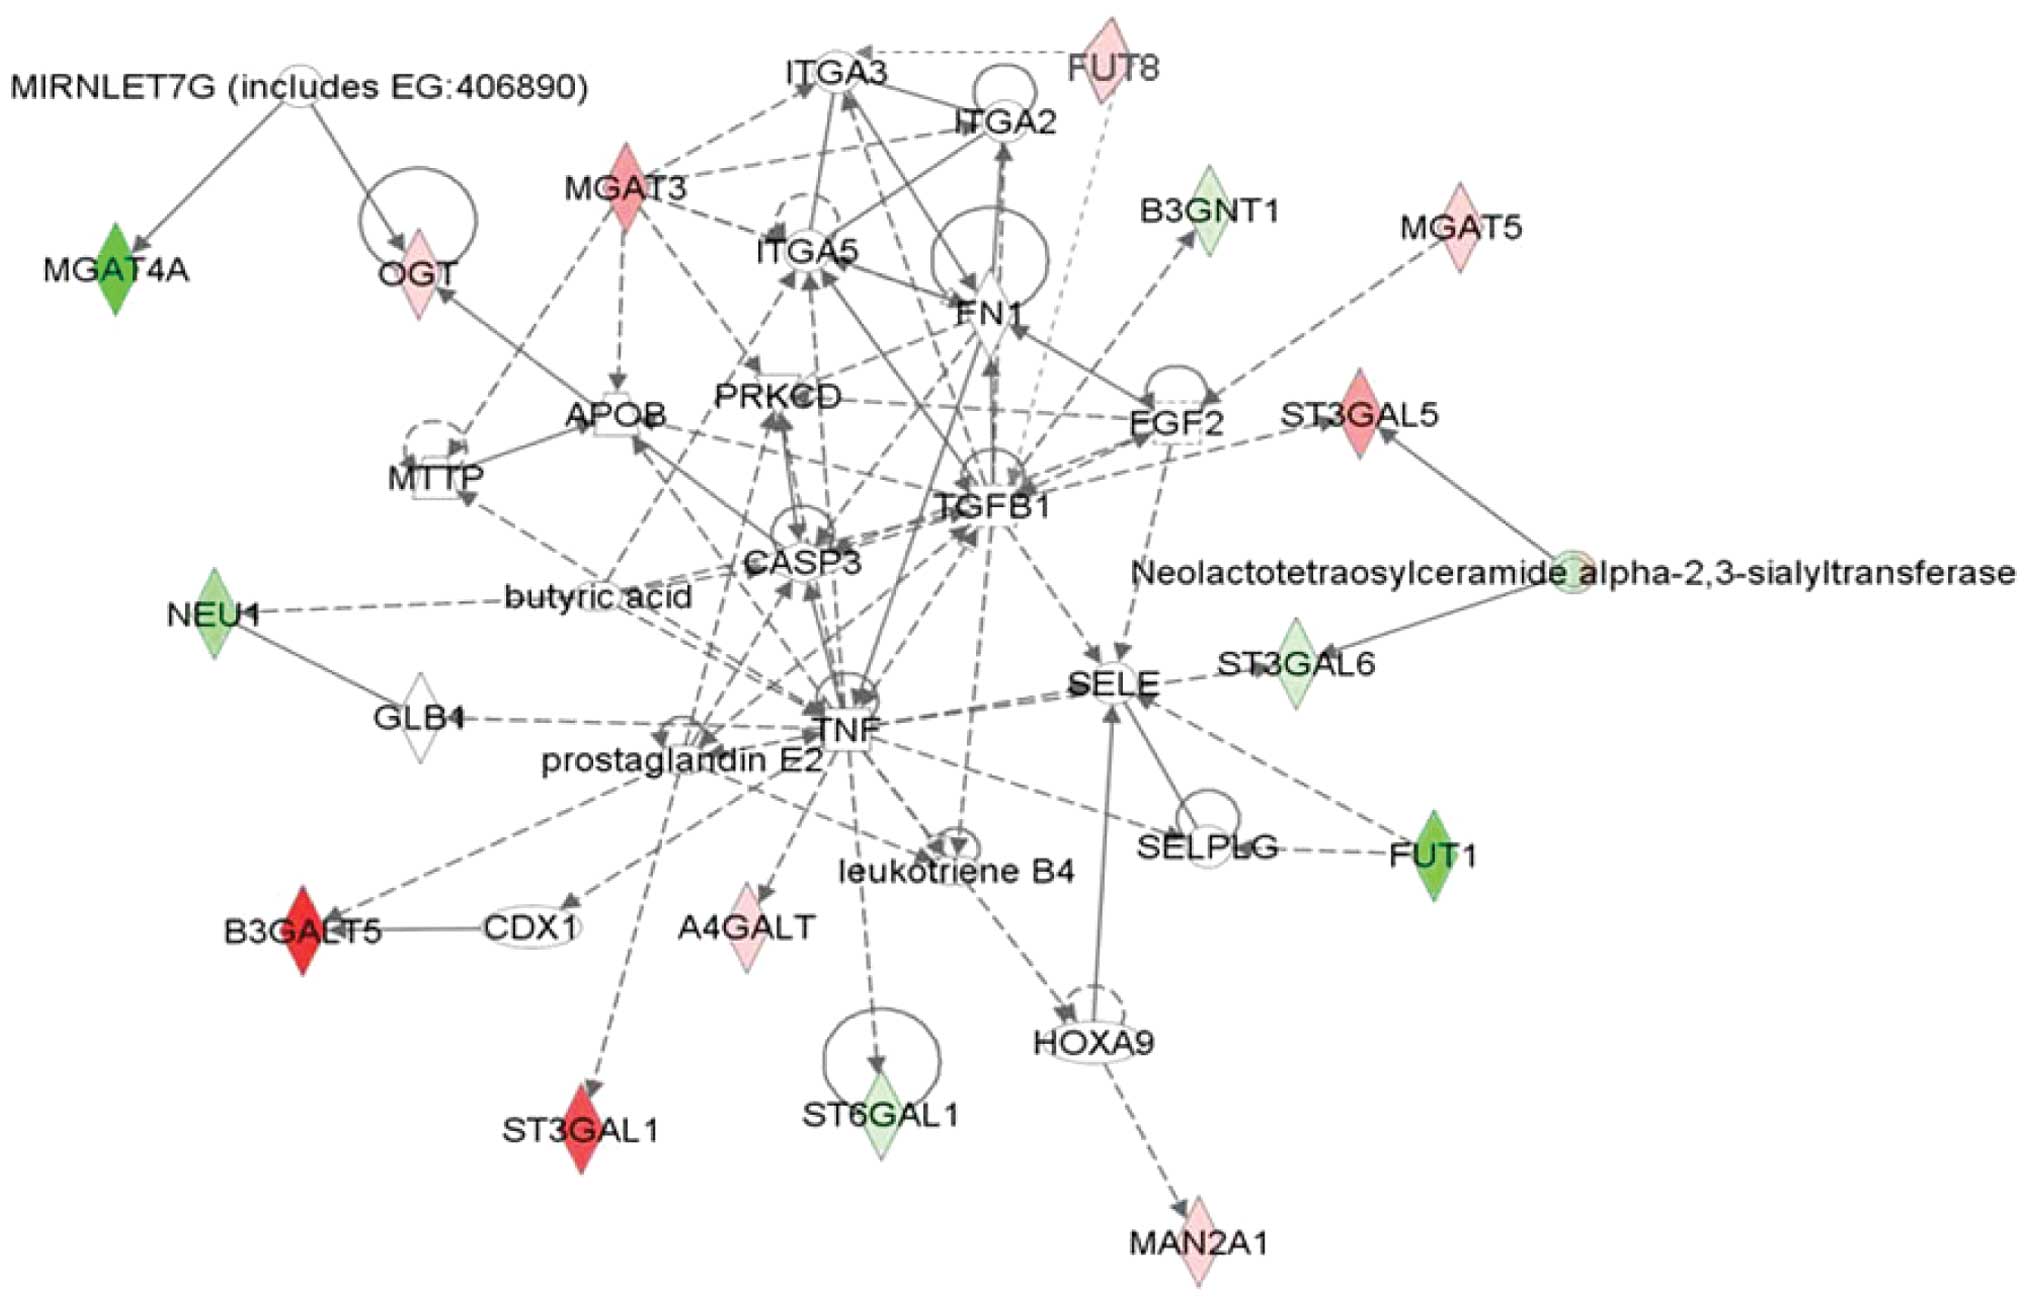
Functional sub-network of differential
expressed genes by IPA
The Search Tool for the Retrieval of Interacting
Proteins (STRING) database was used to establish the gene function
network. It was found that certain genes were responsible for a
change of glycosylation and expression of adhesion molecules or
their receptors such as MGAT3, to influence cell adhesion. Genes
including ST3Gals, β3GalT5, β3Gn-Ts and FUT8 were involved in
sialyl Lewis antigen synthesis. Genes such as MGAT5 may play a role
in the blood vessel growth factor secretion to promote angiogenesis
as well as to regulate the expression of TGF-β, and affect a
variety of signaling pathways such as apoptosis (Fig. 4).
Discussion
Our aim in this study was to identify differentially
expressed glycosyltransferases between two cell lines with
different metastatic potential, and to validate whether the glycan
alteration in membrane proteins between the 2 cell lines was
related to the glycogene changes. Although there are various
technologies that are capable of decoding glycan structure, such as
mass spectrometry, affinity chromatography technology, nuclear
magnetic resonance and carbohydrate microarray, none of them have
enabled systematic analysis of the altered carbohydrate structure.
The microarray strategies, including lectin, glycan and glycogene
arrays, represent a set of essential tools to speed up the
development of functional glycomics (7). Exploring gene expression is
experimentally more tractable than comprehensively characterizing
glycan structures associated with metastatic tendency. The
expression alterations in glycogenes have previously been examined
using focused microarrays or PCR arrays designed to specifically
measure the relevant transcripts (7,8). In
this study, we demonstrate the use of glycan gene expression
profiling and membrane glycoprotein lectin array assay to capture
the metastasis-related information of HCC. The gel-substrate lectin
microarray was established in our laboratory, by which the altered
glycosylation was capable of being analyzed in a rapid, sensitive
and high-throughput manner. In a previous study, we screened the
glycan profiles of a number of glycoprotein standards and compared
the glycan profiles of AFP derived from various sources (9).
Through the profile comparison we found a group of
differences in glycogenes between the 2 HCC cell lines, which were
further categorized according to their specific function listed in
Table II. The alteration mainly
focused on the aspects of N-glycan, O-glycan, sialic acid change,
Lewis structure and glycosaminoglycans. Of these 18 genes, genes
related to N-glycan synthesis are: MGAT1, MGAT3, MGAT4 and MGAT5
mainly participate in branching of N-glycan, FUT8 is responsible
for core fucosylation formation through an α1,6 link, and ManT1 and
ManT3 provide dolichol phosphate mannose involving the N-glycan
precursor. Branched N-glycans, such as bisecting GlcNAc, β1,6
GlcNAc and core fucose (α1,6 fucose), are enzymatic products of
N-acetylglucosaminyltransferase III (encoded by MGAT3),
N-acetylglucosaminyltransferase V (encoded by MGAT5) and α-1,6
fucosyltransferase (encoded by FUT8), respectively. These
structures are highly associated with various biological functions
of cell adhesion molecules, including cell adhesion and cancer
metastasis (10). These structures
on proteins, including growth factor receptors and integrins, are
shown to enhance growth signaling in motile tumor cells. Core
fucosylation is of special interest due to its ability to modulate
growth and development through altering functional properties of
integrins. For example it has been shown that core decoration by
α1,6 fucose of certain motifs of the α3β1 integrin complex is
essential for its association and activity (11). Bisecting GlcNAc structure
synthesized by MGAT3 was increased in HCCLM3 cells, data from the
lectin microarray and GTs chip supported this finding. The
bisecting GlcNAc structure has been reported to be correlated with
the onset of hepatoma in rats and humans, and also a characteristic
structure of AFP derived from liver cancer (12,13).
The overexpressed bisecting GlcNAc structure on integrin
down-regulated the binding capacity of integrin with its ligand,
leading to reduced cell adhesion and cell migration (14). The introduction of the bisecting
GlcNAc structure into the CD44 adhesion molecule promoted tumor
formation and metastasis (11).
In the current study, we found the increased
expression of ST3GalI and ST3GalIV in HCCLM3 cells compared to
Hep3B cells, which synthesizes the α2–3-linked sialic acid. The
result from the increased lectin affinity fluorescent intensity of
MAL-I, MAL-II and WGA for HCCLM3 also shows this alteration.
According to previous reports, the increased sialic acid reduces
the adhesion of tumor cells to the cell matrix, facilitating the
shedding of tumor cells from the primary sites into the blood.
α2–3-linked sialic acid plays a role in the composition of the
sialyl Lewis structure (15,16).
Once tumor cells release into the blood, they bind to
interleukin-secreting cells and platelets through the interaction
of the sialyl Lewis structure on the tumor cell surface with the
selectins on interleukin-secreting cells and platelets, leading to
hematogenous metastasis. Tumor cells may also be settled in a new
place through the binding of the sialyl Lewis structure with the
selectin expressed on endothelial cells (17). Therefore, ST3GalI and ST3Galv may
promote HCC cell metastasis by regulating cell adhesion through the
α2–3-linked sialic acid structure.
Another finding is that UDP glucuronosyltransferase
family members (UGTs) differ in the two liver cancer cell lines.
The UGTs are a family of enzymes, the substrates of which include
drugs, xenobiotics and products of endogenous catabolism. The main
source of the majority of UGT enzymes is the liver, a major organ
in the detoxification and inactivation of compounds. Due to the
importance of UGTs in forming conjugates between steroids and
glucuronic acid, thereby inactivating them and targeting them for
removal, the estrogen-induced up-regulation of UGTs might affect
estrogen and androgen concentrations, thereby reducing their
signaling in breast cancer cells (18). Hepatic UGT mRNA levels are reduced
while the tissue is inflamed, but they are not affected in the
non-inflamed, chronically diseased liver (19). To date, there has been no report on
the correlation between liver cancer and UGTs. However, UGT mRNA
and protein levels are down-regulated or are completely absent in a
number of cancer tissues such as those in the breast and prostate
cancer (20).
Through protein interaction analysis, we observed
two significant nodes in the IPA map: transforming growth factor-β
(TGF-β) and tumor necrosis factor-α (TNF-α). The function of TGF-β
is affected by glycosyltransferase FUT8 and MGAT5 (21), and it in turn has an impact on the
function of other nodes such as TNF-α. TGF-β and TNF-α are key
molecules involved in numerous biological functions, such as cell
proliferation, differentiation and apoptosis. The involvement of
TGF-β and TNF-α in the glycogene IPA map indicates that glycogene
tumor metastasis is regulated by a variety of mechanisms in
collaboration, and those involved factors are mutually
affected.
It should be noted that this study has examined only
the cell lines with different metastatic potential and the clinical
samples with different metastasis were not available for
examination of the differential glycogenes. We could then collect
the relative clinical samples to compare and validate the
prognostic value of glycogenes.
The results of these analyses reveal that mRNA
levels for a number of these genes differ significantly between the
metastatic and non-metastatic HCC cell lines, indicating that
synthesis, degradation and adhesion mediated by glycans may be
altered drastically in HCC. Meanwhile we used lectin chips to
validate the differences of the glycome. It was shown that
increased expression of α2–3sialic acid, core fucose and bisecting
GlcNAc may be characteristic changes correlated with HCC
metastasis. They may affect HCC metastasis by regulating cell
adhesion, cell migration, angiogenesis and apoptosis. In the
future, efforts should be made to understand how changes in mRNA
levels of glycan genes affect a cell's glycome. The precise role of
such altered glycan structures in disease remains to be
elucidated.
Acknowledgements
We thank Mr. Yang Zhang (Institute of
Biomedical Science, Fudan University) for his help in the
bioinformatics analysis. We also thank Mr. HongMing Zhang and
HouLong Cheng (CapitalBio, Beijing, China) for their technical help
in the preparation of the lectin microarray and analysis of the
results. This study was financially supported by the Major State
Basic Research Development Program of China (973 Program)
(2011CB910604), Natural Science Foundation of China (81101636), and
the Ph.D. Programs Foundation of University Education of China
(200802461155).
References
|
1.
|
CL ChafferRA WeinbergA perspective on
cancer cell
metastasisScience33115591564201110.1126/science.120354321436443
|
|
2.
|
S HakomoriAberrant glycosylation in tumors
and tumor-associated carbohydrate antigensAdv Cancer
Res52257331198910.1016/S0065-230X(08)60215-82662714
|
|
3.
|
K OhtsuboJD MarthGlycosylation in cellular
mechanisms of health and
diseaseCell126855867200610.1016/j.cell.2006.08.01916959566
|
|
4.
|
FL WangSX CuiLP SunHigh expression of
alpha 2, 3-linked sialic acid residues is associated with the
metastatic potential of human gastric cancerCancer Detect
Prev32437443200910.1016/j.cdp.2009.01.00119232843
|
|
5.
|
G LaucV ZoldosProtein glycosylation - an
evolutionary crossroad between genes and environmentMol
Biosyst623732379
|
|
6.
|
PA FaraziRA DePinhoHepatocellular
carcinoma pathogenesis: from genes to environmentNat Rev
Cancer6674687200610.1038/nrc193416929323
|
|
7.
|
EM ComelliSR HeadT GilmartinA focused
microarray approach to functional glycomics: transcriptional
regulation of the
glycomeGlycobiology16117131200610.1093/glycob/cwj04816237199
|
|
8.
|
AV NairnWS YorkK HarrisEM HallJM PierceKW
MoremenRegulation of glycan structures in animal tissues:
transcript profiling of glycan-related genesJ Biol
Chem2831729817313200810.1074/jbc.M80196420018411279
|
|
9.
|
P ChenY LiuX KangL SunP YangZ
TangIdentification of N-glycan of alpha-fetoprotein by lectin
affinity microarrayJ Cancer Res Clin
Oncol134851860200810.1007/s00432-008-0357-718264723
|
|
10.
|
C SaravananZ CaoSR HeadN PanjwaniAnalysis
of differential expression of glycosyltransferases in healing
corneas by glycogene
microarraysGlycobiology201323201010.1093/glycob/cwp13319736239
|
|
11.
|
Y ZhaoS ItohX WangDeletion of core
fucosylation on alpha3beta1 integrin down-regulates its functionsJ
Biol Chem2813834338350200610.1074/jbc.M60876420017043354
|
|
12.
|
M OhnoA NishikawaM KoketsuEnzymatic basis
of sugar structures of alpha-fetoprotein in hepatoma and
hepatoblastoma cell lines: correlation with activities of alpha 1–6
fucosyltransferase and N-acetylglucosaminyltransferases III and
VInt J Cancer5131531719921373706
|
|
13.
|
AS SultanE MiyoshiY IharaA NishikawaY
TsukadaN TaniguchiBisecting GlcNAc structures act as negative
sorting signals for cell surface glycoproteins in forskolin-treated
rat hepatoma cellsJ Biol
Chem27228662872199710.1074/jbc.272.5.28669006930
|
|
14.
|
Y ZhaoY SatoT IsajiBranched N-glycans
regulate the biological functions of integrins and cadherinsFEBS
J27519391948200810.1111/j.1742-4658.2008.06346.x18384383
|
|
15.
|
J DennisC WallerR TimplV
SchirrmacherSurface sialic acid reduces attachment of metastatic
tumour cells to collagen type IV and
fibronectinNature300274276198210.1038/300274a07144883
|
|
16.
|
M UgorskiA LaskowskaSialyl Lewis(a): a
tumor-associated carbohydrate antigen involved in adhesion and
metastatic potential of cancer cellsActa Biochim
Pol49303311200212362971
|
|
17.
|
MM FusterJR BrownL WangJD EskoA
disaccharide precursor of sialyl Lewis X inhibits metastatic
potential of tumor cellsCancer Res6327752781200312782582
|
|
18.
|
WR HarringtonS SenguptaBS
KatzenellenbogenEstrogen regulation of the glucuronidation enzyme
UGT2B15 in estrogen receptor-positive breast cancer
cellsEndocrinology14738433850200610.1210/en.2006-035816690804
|
|
19.
|
M CongiuML MashfordJL SlavinPV DesmondUDP
glucuronosyltransferase mRNA levels in human liver diseaseDrug
Metab Dispos30129134200210.1124/dmd.30.2.12911792680
|
|
20.
|
ZM ZhangXY YangJH YuanZY SunYQ
LiModulation of NRF2 and UGT1A expression by
epigallocatechin-3-gallate in colon cancer cells and BALB/c
miceChin Med J (Engl)12216601665200919719968
|
|
21.
|
P HerrG KorniychukY YamamotoK GrubisicM
OelgeschlagerRegulation of TGF-(beta) signalling by
N-acetylgalactosaminyltransferase-like
1Development13518131822200810.1242/dev.01932318417620
|