Introduction
microRNAs (miRNAs) are endogenous small
single-strand non-coding RNAs of approximately 22 nucleotides
(1) that have emerged as a
prominent class of gene regulators. miRNAs may have causal roles in
numerous normal cellular and tumor processes, such as development,
differentiation, proliferation and apoptosis (2,3).
Moreover, a growing number of miRNAs have been classified as
oncogenes or tumor-suppressor genes (4,5).
Over the past decade, an increasing number of studies have shown
dysregulation of miRNA expression in numerous tumor types including
esophageal (6), lung (7), liver (8), pancreatic (9), bladder (10), ovarian (11) and gastric cancer (12).
In previous studies, the evidence has revealed that
several miRNA expression levels were aberrant in colorectal cancer
(CRC). Cummins et al (13)
indicated that 53 miRNAs were expressed at significantly different
levels between CRC tissues and normal colonic epithelium by
microarray and qRT-PCR methods. Moreover, Chen et al
(14) indicated that miR-148a and
-152 were downregulated, as shown by real-time PCR assay, in a
large number of cases with CRC and were significantly related to
tumor size and depth of invasion. Our previous study showed similar
results, in that miR-203 was significantly downregulated in CRC by
real-time PCR assay. Also, the low expression of miR-203 was
correlated with increased tumor size and advanced depth of invasion
(15). Furthermore, Georges et
al (16) reported that miR-192
and -215 were downregulated by microarray and qRT-PCR methods in
human CRC cell lines, and these miRNAs, as tumor suppressors, led
to cell cycle arrest.
In this study, we detected the expression levels of
miR-192, -194 and -215 in a large number of CRC tissues, relative
to their non-tumor counterparts, by real-time PCR assay, as well as
in three CRC cell lines. Further investigation revealed that
aberrant expression of these miRNAs was, notably, correlated with
clinicopathological characteristics in CRC. Moreover, we studied
the association between miR-194 and cell proliferation in
vitro by MTT assay. Our findings will help to elucidate the
functions of miRNAs and their role in carcinogenesis.
Material and methods
Tissues samples
A total of 107 pairs of CRC tissues and non-tumor
adjacent tissues (NATs; as the controls) were obtained from
patients that underwent radical resection between 2007 and 2010 at
the First Hospital of China Medical University (Shenyang, China).
The non-tumor counterparts were obtained from a section of the
resected specimen at the farthest distance from the tumor. The
samples were snap-frozen in liquid nitrogen immediately following
surgery and were stored at −80°C until use. No previous local or
systemic treatment had been conducted on these patients prior to
surgery.
CRC was subsequently diagnosed based on
histopathological evaluation. One section of each sample was
stained with hematoxylin-eosin (H&E). The histological grade of
cancer was classified using the TNM staging system of the American
Joint Committee on Cancer (AJCC; 2010) and the International Union
Against Cancer (UICC), according to the standard of the World
Health Organization (WHO). Informed consent was obtained from all
patients. The study was approved by the Research Ethics Committee
of China Medical University (Shenyang, China).
Cell lines
Human CRC cell lines (HT-29, HCT-116 and SW-620)
were obtained from the Institute of Biochemistry and Cell Biology
at the Chinese Academy of Sciences (Shanghai, China). HT-29 and
HCT-116 were cultured in McCoy's 5A medium (Invitrogen, Carlsbad,
CA, USA); SW-620 was cultured in Leibovitz's L-15 medium
(Invitrogen). All of the cell lines were cultured at 37°C in a
humidified atmosphere of 5% CO2. Media were supplemented
with 10% fetal bovine serum (FBS).
RNA isolation and reverse transcription
reaction
Total RNA was isolated from the specimens using a
mirVana miRNA Isolation kit (Ambion, Austin, TX, USA) according to
the manufacturer's instructions. A UV spectrophotometry
NanoPhotometer UV/Vis spectrophotometer (Implen, Schatzbogen,
München, Germany) was used to determine the concentration and
purity of RNA. A poly(A) tail was added to RNA in a 37°C water bath
for 30 min by Escherichia coli poly(A) polymerase (E-PAP)
using a Poly(A) Tailing kit, according to the manufacturer's
instructions (Ambion) (17).
Following purification by phenol-chloroform and ethanol, RNAs were
dissolved in diethyl pyrocarbonate (DEPC)-treated water. The
first-strand cDNA was synthesized with the SuperScript®
III First-Strand Synthesis System using a reverse
transcription-polymerase chain reaction kit (Invitrogen). To
generate cDNA of miRNA, a 10 μl reverse transcription reaction
mixture containing 1 μg of the RNA sample, 1 μl RT-primer (Table I), 1 μl 10 mM deoxyribonucleotide
triphosphate (dNTP) mix and DEPC-treated water at 65°C was
incubated for 5 min. Then, a 10 μl mixture containing 2 μl 10X RT
buffer, 4 μl 25 mM MgCl2, 2 μl 0.1 M DTT, 1 μl RNaseOUT
(40 U/μl) and 1 μl SuperScript III RT (200 U/μl) was added. The
total reaction mixture was incubated in a 96-well plate of a
GeneAmp PCR 9700 Thermocycler (Applied Biosystems, Hayward, CA,
USA) for 50 min at 50°C, 5 min at 85°C, and 20 min at 37°C after
adding 1 μl RNase H to the mixture, and held at 4°C.
 | Table I.RT-PCR primers for amplification of
miR-192, -194 and -215 expression and the sequences of miR-194
mimics and NC. |
Table I.
RT-PCR primers for amplification of
miR-192, -194 and -215 expression and the sequences of miR-194
mimics and NC.
| Primer | Primer sequence
(5′-3′) |
|---|
| RT-primer-1 |
GCTGTCAACGATACGCTACGTAACGGCATGACAGTGTTTTTTTTTTTTTTTTTTTTTTTTA |
| RT-primer-2 |
GCTGTCAACGATACGCTACGTAACGGCATGACAGTGTTTTTTTTTTTTTTTTTTTTTTTTG |
| RT-primer-3 |
GCTGTCAACGATACGCTACGTAACGGCATGACAGTGTTTTTTTTTTTTTTTTTTTTTTTTC |
| miR-192-Fa |
CTGACCTATGAATTGACAGCCA |
| miR-192-Rb |
GCTGTCAACGATACGCTACGT |
| miR-194-Fa |
TGTAACAGCAACTCCATGTGGA |
| miR-194-Rb |
GCTGTCAACGATACGCTACGT |
| miR-215-Fa |
ATGACCTATGAATTGACAGACAA |
| miR-215-Rb |
GCTGTCAACGATACGCTACGT |
| U6 RNA-Fa |
CGCTTCGGCAGCACATATAC |
| U6 RNA-Rb |
TTCACGAATTTGCGTGTCAT |
| miR-194-mimics |
UGUAACAGCAACUCCAUGUGGA |
|
CACAUGGAGUUGCUGUUACAUU |
| NC |
UUCUUCGAACGUGUCACGUTT |
|
ACGUGACACGUUCGGAGAATT |
Real-time PCR
According to the manufacturer's instructions,
real-time PCR was performed using the SYBR Premix Ex Taq™ II kit
(Takara Bio, Kyoto, Japan) with a Rotor-gene 6000 system (Qiagen,
Valencia, CA, USA) (17). The 25
μl mixture of PCR consisted of 12.5 μl SYBR Green supermix, 8.5 μl
RNase-free water, 1 μl forward primers, 1 μl reverse primers and 2
μl reverse transcribed product. Threshold cycle data were
determined by setting a default threshold. The reactive condition
was 45 amplification cycles of 95°C for 5 sec, 58°C for 20 sec and
72°C for 30 sec in a 36-well optical plate using a Rotor-gene 6000
system. The U6 RNA was selected as an endogenous reference to
calculate the relative expression levels of miR-192, -194 and -215
in cancerous samples compared to non-tumor counterparts using the
2−ΔΔCt method (18).
All samples were performed in triplicate and repeated three times.
The products of real-time PCR were confirmed by TA cloning and a
sequencing assay. The primers for miR-192, -194 and -215 and the
endogenous control U6 are shown in Table I.
Cell transfection and MTT assay
miR-194 mimics were composed of an RNA duplex
(Table I) designed as described
previously (19). Non-specific
sequences were non-homologous to any human genome sequences as a
negative control RNA duplex (named as NC, Table I). Corresponding 2-O-methyl
analogues were used to substitute for all pyrimidine nucleotides in
the miR-194 mimics or NC to improve RNA stability for an MTT assay
in vitro. miR-194 mimics (50 nM) and NC were transiently
transfected in cultured SGC-7901 cells at 30-50% confluence using
Lipofectamine 2000 (Invitrogen). All the RNA oligoribonucleotides
were chemically synthesized by GenePharma (Shanghai, China).
The
3-(4,5-dimethylthiazol-2-yl)-2,5-diphenyltetrazolium bromide (MTT)
assay was performed to measure the capacity for cellular
proliferation. A total of 24 h following transfection, cells
(approximately 0.4×10⁴) were seeded into 96-well
microtiter plates for 24, 48, 72 and 96 h. Then, the cells were
incubated with 20 μl of MTT (5 mg/ml) for 4 h at 37°C and 150 μl of
dimethyl sulfoxide (DMSO) was added to solubilize the crystals for
20 min at room temperature. A spectrophotometer (Multiskan MK3;
Thermo, Waltham, MA, USA) was used to measure the optical density
(OD) at a wavelength of 490 nm. All experiments were performed
three times to calculate the average results. The growth inhibition
rate was calculated as follows: (AC - AT)/AC x 100% (AC =
absorbance value of the NC; AT = absorbance value of the
experimental group) (20).
Statistical analysis
For real-time PCR, the threshold cycle of
fluorescence (Ct) for each sample was determined to
evaluate the association between CRC tissues and matched NATs by
the 2−ΔΔCt method. ΔΔCt indicates the
difference in the ΔCt value between cancer tissue and
the corresponding control (ΔΔCt = ΔCt cancer
− ΔCt control) and ΔCt is the difference of
the Ct value between the target and U6 (ΔCt =
Ct target − Ct U6). Finally, the
2−ΔΔCt value (fold value) was calculated and
distinguished as 1-fold, and a fold value of less than 1-fold was
defined as low expression (15,21).
Differences in miRNA expression were measured by comparing the
values of ΔCt cancer and ΔCt control, and
statistical differences in miRNA expression levels were determined
using a paired t-test in cancer tissues and cancer cell lines
relative to non-tumor counterparts, as well as comparing the effect
of miR-194 on cell proliferation in HCT-116 cells by MTT assay.
Moreover, the association between miRNA expression levels and
clinicopathological parameters was analyzed by a non-parametric
test (Mann-Whitney U test between two groups and Kruskal-Wallis H
test for three or more groups). P<0.05 was considered to
indicate a statistically significant difference. Statistical
analyses were performed using the Statistical Program for Social
Sciences (SPSS) software 16.0 (SPSS Incorporated, Chicago, IL,
USA).
Results
Expression of miR-192, -194 and -215 in
CRC
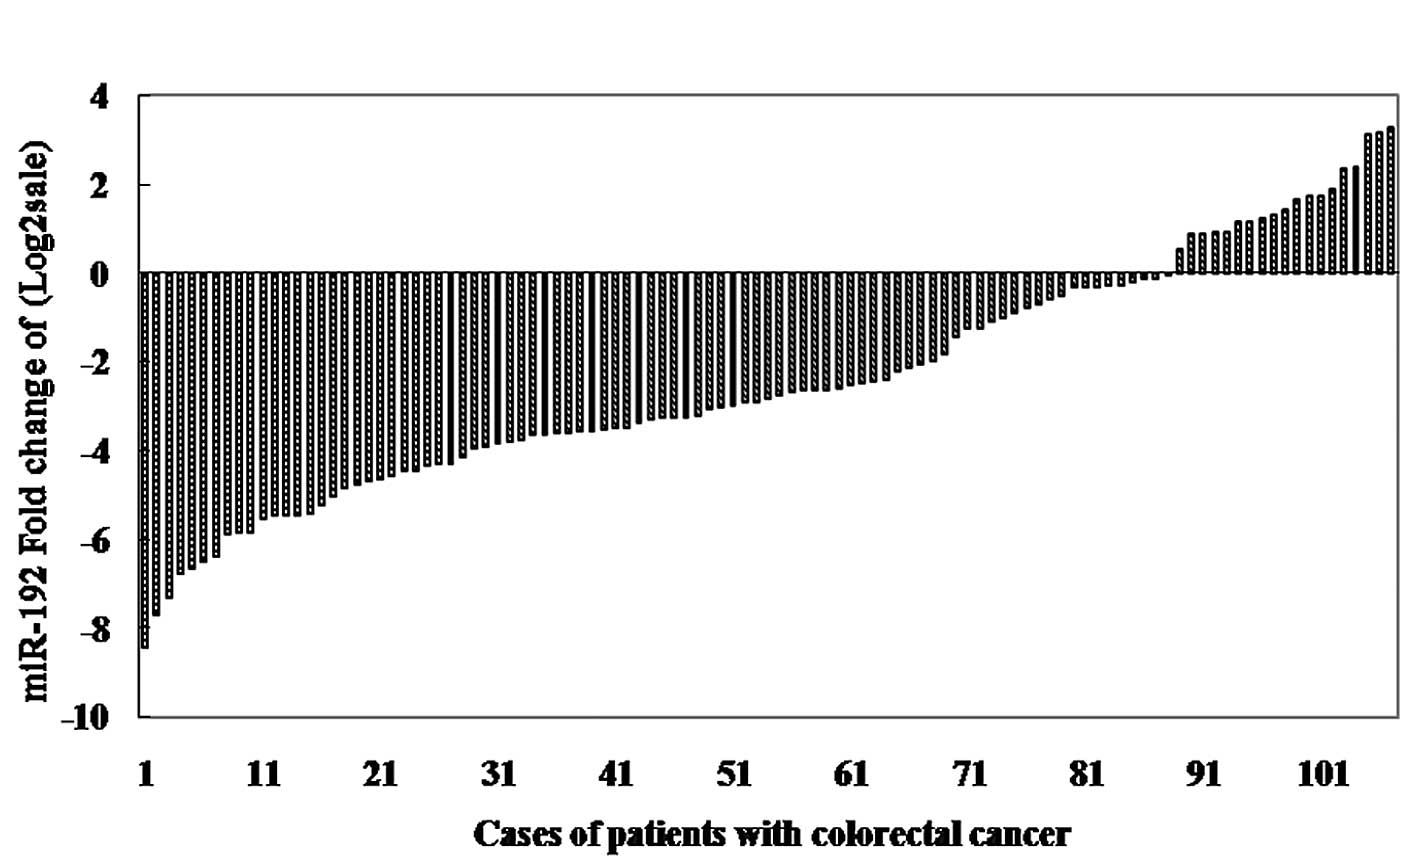
Among 107 patients with CRC, expression levels of
miR-192, -194 and -215 were detected using real-time PCR in cancer
tissues compared to matched non-tumor counterparts and the values
of ΔCt (means ± SD) were 4.632±2.090, 4.680±2.170 and
6.483±2.242 in cancer tissues, and 2.207±2.704, 2.780±2.922 and
4.032±2.768 in non-tumor counterparts, respectively. Moreover,
miR-192, -194 and -215 were significantly downregulated in CRC
tissues with the median 0.13-fold, 0.23-fold, and 0.15-fold
relative to the control group, respectively (all p<0.001, paired
t-test; Fig. 1). Furthermore, in
87 of 107 (81.30%), 85 of 107 (79.44%) and 86 of 107 (80.37%)
cases, miR-192, -194 and -215 expression levels revealed a >50%
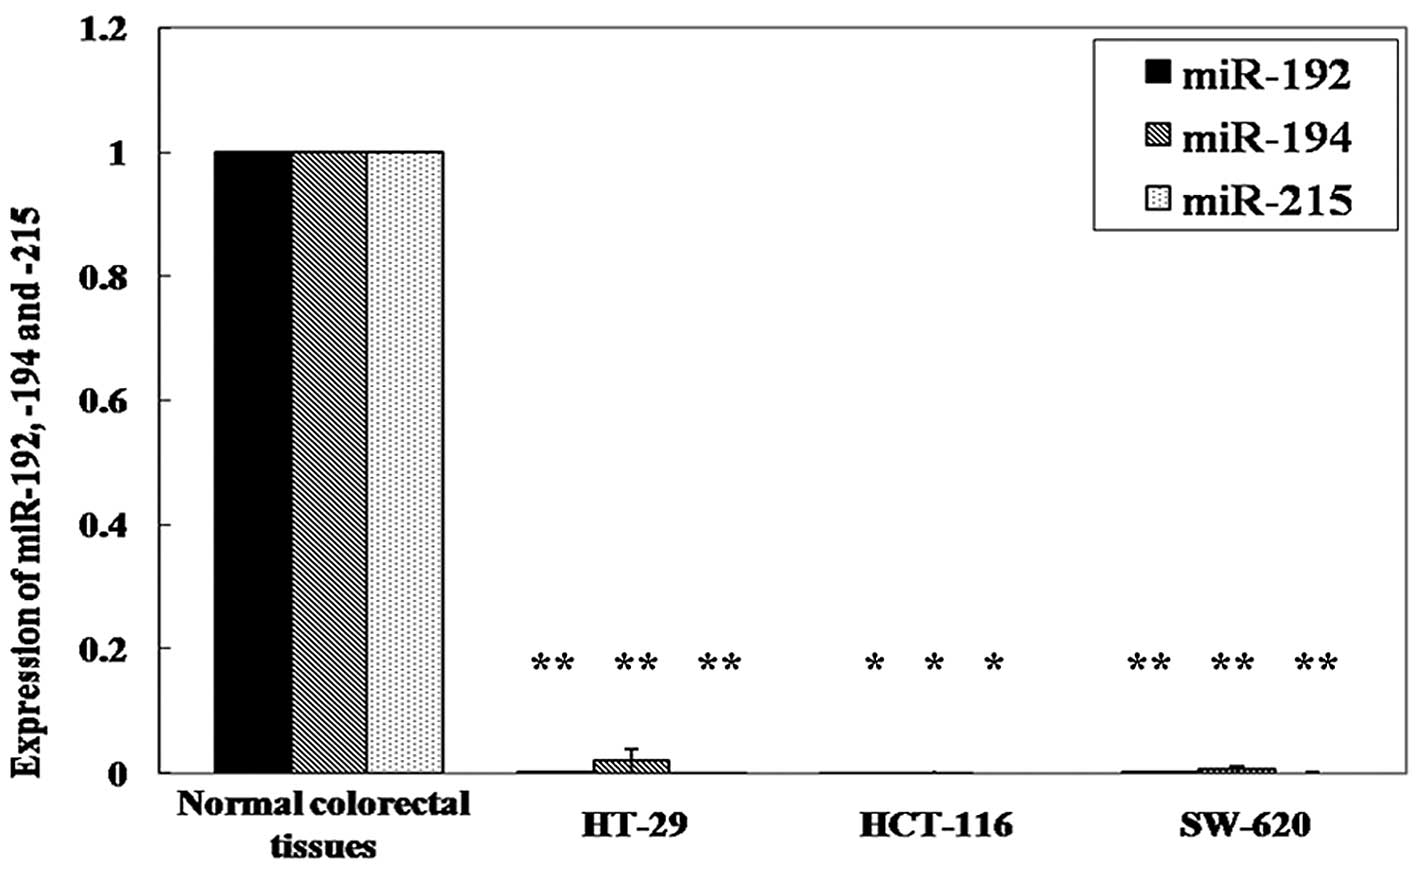
reduction between the two types of tissues. In the cell lines, we
also found a significantly lower expression of miR-192, -194 and
-215 in HT-29 cells (p=0.003, p=0.016, and p=0.002, respectively;
paired t-test), HCT-116 cells (p=0.003, p=0.014 and p=0.001,
respectively) and SW-620 cells (p=0.002, p=0.010 and p=0.002,
respectively) compared to normal colorectal tissues (Fig. 2).
Association between expression of miRNAs
and clinicopathological characteristics in CRC
In our study, there was an association between miRNA
expression levels and clinicopathological characteristics in CRC.
Lower expression levels of miR-192, -194 and -215 in patients with
CRC tended to be associated with increased tumor sizes as shown by
non-parametric tests (p=0.027, p=0.018 and p=0.027, respectively;
Mann-Whitney U test, Table II).
There was no significant difference between low expression of the
miRNAs and other clinicopathological characteristics such as
gender, age, histological grade, pT stage, pN stage, clinical
stage, lymph node metastasis rate and lymphatic vessel
invasion.
| Table II.Association between miR-192, -194 and
-215 expression and clinicopathological features in patients with
colorectal cancer. |
Table II.
Association between miR-192, -194 and
-215 expression and clinicopathological features in patients with
colorectal cancer.
| Colorectal
cancer | n | miR-192a | miR-194a | miR-215a |
|---|
| Gender | | | | |
| Male | 64 | 0.121
(0.047–0.748) | 0.193
(0.085–0.727) | 0.151
(0.041–0.586) |
| Female | 43 | 0.189
(0.069–0.909) | 0.265
(0.118–1.257) | 0.195
(0.066–0.623) |
| p-value | | 0.360 | 0.225 | 0.382 |
| Age (years) | | | | |
| <65 | 59 | 0.159
(0.073–0.825) | 0.234
(0.118–0.772) | 0.177
(0.074–0.578) |
| ≥65 | 48 | 0.111
(0.047–0.797) | 0.227
(0.085–0.727) | 0.116
(0.032–0.622) |
| P-value | | 0.208 | 0.507 | 0.146 |
| Tumor size
(cm) | | | | |
| <5 | 46 | 0.221
(0.079–1.849) | 0.331
(0.127–1.562) | 0.205
(0.077–1.793) |
| ≥5 | 61 | 0.106
(0.039–0.416) | 0.174
(0.064–0.452) | 0.112
(0.034–0.557) |
| p-value | | 0.027b | 0.018b | 0.027b |
| Tumor location | | | | |
| Colon | 48 | 0.114
(0.041–0.764) | 0.176
(0.062–0.703) | 0.113
(0.031–0.647) |
| Rectum | 59 | 0.142
(0.074–0.809) | 0.261
(0.123–0.875) | 0.165
(0.074–0.578) |
| p-value | | 0.301 | 0.158 | 0.250 |
| Histological
grade | | | | |
| Well/moderately
well differentiated | 84 | 0.132
(0.053–0.855) | 0.231
(0.115–0.972) | 0.153
(0.048–0.654) |
| Poorly
differentiated | 23 | 0.159
(0.051–0.492) | 0.227
(0.067–0.489) | 0.174
(0.047–0.557) |
| p-value | | 0.562 | 0.363 | 0.985 |
| pT stage | | | | |
| T2+T3 | 80 | 0.155
(0.065–0.809) | 0.258
(0.118–0.848) | 0.163
(0.064–0.639) |
| T4 | 27 | 0.106
(0.023–0.614) | 0.204
(0.028–0.735) | 0.113
(0.023–0.618) |
| p-value | | 0.168 | 0.181 | 0.213 |
| pN stage | | | | |
| N0 | 67 | 0.142
(0.057–0.809) | 0.227
(0.115–0.735) | 0.154
(0.058–0.664) |
| N1 | 30 | 0.132
(0.036–0.794) | 0.248
(0.059–0.798) | 0.150
(0.040–0.565) |
| N2 | 10 | 0.159
(0.061–0.912) | 0.222
(0.105–1.282) | 0.135
(0.046–0.958) |
| p-value | | 0.836 | 0.884 | 0.936 |
| pTNM stage | | | | |
| I+II | 67 | 0.142
(0.057–0.809) | 0.227
(0.115–0.735) | 0.154
(0.058–0.664) |
| III | 40 | 0.132
(0.051–0.797) | 0.248
(0.073–0.849) | 0.150
(0.043–0.581) |
| p-value | | 0.718 | 0.779 | 0.804 |
| Invasion into
lymphatic vessels | | | | |
| Negative | 97 | 0.131
(0.054–0.796) | 0.227
(0.114–0.741) | 0.154
(0.051–0.604) |
| Positive | 10 | 0.203
(0.048–1.612) | 0.227
(0.084–1.317) | 0.218
(0.044–1.090) |
| p-value | | 0.604 | 0.957 | 0.696 |
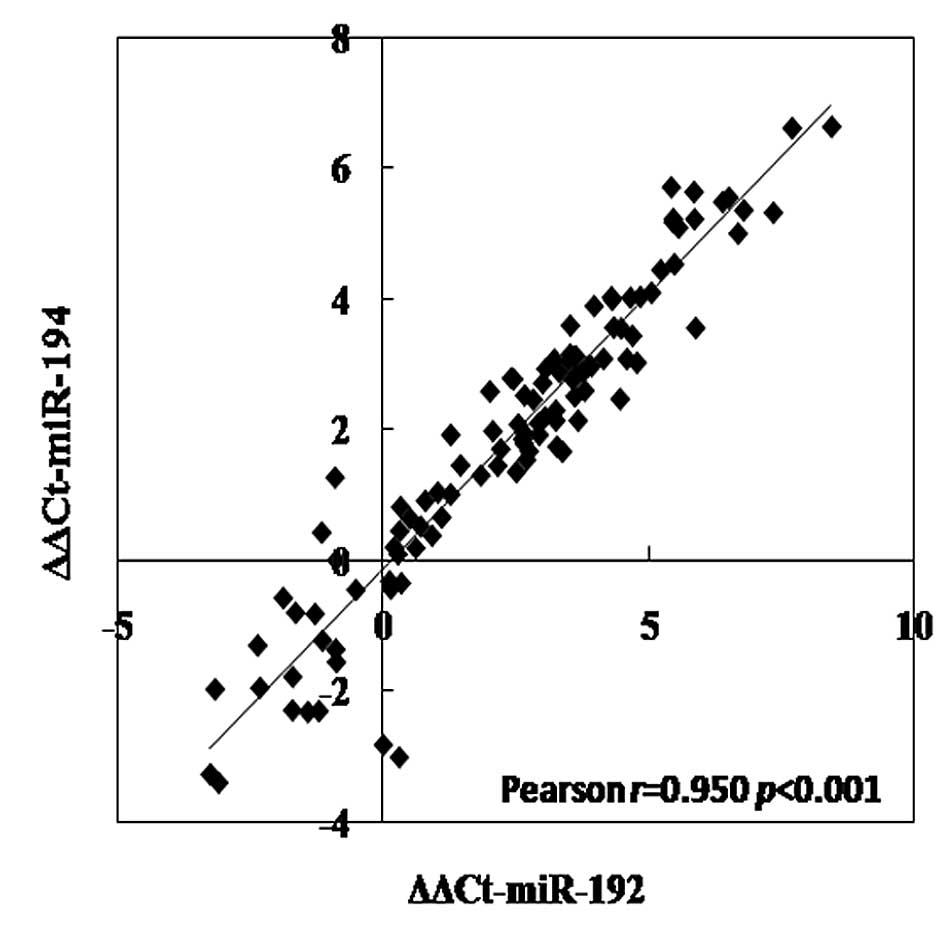
Marked correlations among miR-192, -194
and -215
There were marked correlations between miR-192 and
-194, miR-192 and -215, and miR-194 and -215 in CRC tissues, which
were evaluated by Pearson's regression analysis (all p<0.001;
Fig. 3). The correlation
coefficients were 0.950, 0.895, and 0.856, respectively.
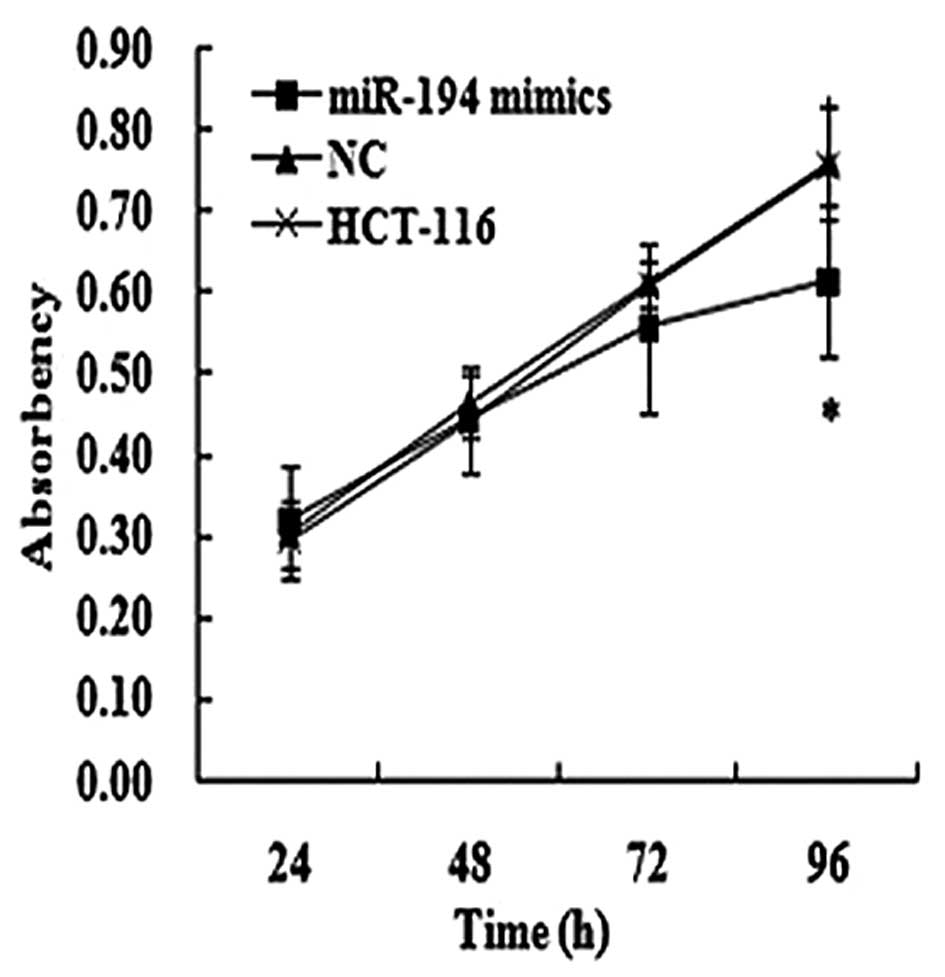
Effects of miR-194 on cell
proliferation
The effect of miR-194 on cell proliferation was
assessed in HCT-116 cells. The transfection efficiency was detected
by the real-time PCR method 48 h following transfection. Moreover,
we found that the cells that were transfected with miR-194 mimics
in HCT-116 cells had marked growth inhibition at the point of 96 h
post-transfection compared to the matched NC and SCG-7901 cells, as
shown by the MTT assay (Fig. 4).
Furthermore, the inhibition rate was 19.20% at the point of 96 h
post-transfection in HCT-116 cells.
Discussion
In recent years, studies have shown that miRNA
alterations may function as a novel class of oncogenes and tumor
suppressors, which could be used for the diagnosis and treatment of
cancer (22). Mathé et al
(6) reported that miR-192 and -194
were upregulated in 107 patients with esophageal cancer compared to
non-tumor counterparts by microarray assay. Moreover, Jin et
al (23) indicated that
miR-192 and -215 in gastric cancer tissues and cell lines were
upregulated by microarray and qRT-PCR methods. Furthermore, more
evidence revealed the upregulated miR-192 in lung cancer,
overexpression of miR-194 in highly metastatic pancreatic ductal
adenocarcinoma, and overexpression of miR-215 in hepatocellular
carcinoma by microarray and real-time PCR methods (7–9).
However, miR-194 in mouse hepatocellular carcinoma and cancer cell
lines was downregulated by the real-time PCR method (24). Therefore, the altered miRNA
expression levels may cause tissue-specific differences. Just as
Baffa et al suggested, the various miRNA expression levels,
which were observed in different organs of origin, were markedly
tissue-specific (25). In the
future, the correlation between miRNAs and cancer could become a
focus of cancer studies.
miRNAs can be quantified by microarray assay,
bead-based flow cytometric assay and real-time PCR assay. The main
advantage of real-time PCR is that it is more quantitative and
sensitive than other assays. Therefore, we performed real-time PCR
on a large number of cases to assess the expression levels of
miR-192, -194 and -215 in CRC. The significantly lower expression
of these miRNAs was found in 107 cancer tissues compared to
non-tumor counterparts. Moreover, research on the miRNA expression
levels in CRC cell lines also provided similar significant results.
In previous studies, similar results indicated that miR-192, -194
and -215 were downregulated in CRC cell lines and rat colon tissues
(16,26,27).
Furthermore, our studies revealed that the increased tumor size in
CRC was closely correlated with the low expression of miR-192, -194
and -215. There was also an inverse correlation between tumor size
and miRNA expression levels, with lower expression levels being
associated with increased tumor size. Although the increased tumor
size in CRC was not part of the staging system, previous studies
have suggested that tumor size is also an important prognostic
factor in CRC (28). Thus,
miR-192, -194 and -215 might be important biological markers in the
carcinogenesis of CRC and the low expression of these miRNAs may
contribute to the proliferation of CRC.
In the present study, we found a marked correlation
between miR-192 and -194, miR-192 and -215, and miR-194 and -215 in
CRC tissues. As shown on the miRBase and HGNC website, miR-192 and
-215 have the same ‘seed region’; miR-192 and -194-2 are on the
same chromosome at the 11q13.1 and miR-194-1 and -215 are on 1q41.
Moreover, the mature sequence of miR-194-1 and -194-2 is miR-194.
We therefore suggest that miRNAs may contribute to the
carcinogenesis of CRC in synergism. Confirmation of this theory
requires further investigation.
In a previous study, Boni et al indicated
that miR-192 and -215 in DLD-1 CRC cell lines induced the
accumulation of p53 and suppressed cell proliferation in a
partially, but not completely, p53-dependent pathway (29). Furthermore, Song et al also
found similar results in HCT-116 CRC cell lines transfected with
miR-215. Their results suggest that the reduced proliferation rate
is due to a decreased S phase and increased G2 checkpoint control
(30). More evidence was observed
that miR-192 and -215 may function as tumor suppressors capable of
inhibiting cell proliferation, suppressing carcinogenesis through
p21 accumulation, and causing cell cycle arrest in CRC cell lines
(16,26,31).
In the present study, cell proliferation assays were performed in
HTC-116 cells to investigate the potential impact of miR-194 on
cell growth. Our results showed that miR-194 mimics transfection in
HCT-116 cells was significantly lower than the NC group and blank
group by MTT assay. Thus, we suggest that the overexpression of
miR-194 may be a potential biological marker for the inhibition of
cell proliferation in CRC. Future studies on the functions of these
miRNAs are required to further the investigation of CRC.
There are a number of factors that may reduce miRNA
expression, including transcriptional factors, mutations, deletions
and methylation. Recent studies have shown that hypermethylation of
the miR-194-2 and -192 cluster promoter in multiple myeloma (MM)
cell lines suggests that epigenetic downregulation of these miRNAs,
which leads to an increase in murine double minute 2 (MDM2) mRNA
and protein expression, decreases the ability of p53 to
downmodulate MDM2 expression (32). Moreover, Hino et al
(33) indicated that miR-194 was
transcriptionally upregulated in a gastrointestinal tract enriched
nuclear receptor by the hepatic nuclear factor 1α (HNF1-α) in
intestinal epithelial cells. Therefore, considering these reasons,
we speculate that hypermethylation and transcription factors may be
mechanisms for the downregulation of miR-192, -194 and -215 in
CRC.
In a large number of CRC tissues, miR-192, -194 and
-215 were significantly downregulated relative to their non-tumor
counterparts, as well as in the three CRC cell lines. Also, a
significant association between these miRNA expression levels and
increased tumor size was found in CRC. Moreover, there was a marked
correlation among these miRNAs in CRC tissues. An in vitro
cell proliferation assay revealed that the miR-194 mimics
transfection in HCT-116 cells was significantly lower than
controls. The present study indicates a basis for further studies
on target genes and identification of more functions of these
miRNAs in CRC. In future studies, the associations between these
miRNAs and the prognosis of patients with CRC need to be confirmed
using large-scale and long-term follow-up studies.
Acknowledgements
This study was supported by grants
from the National Science Foundation of China (No. 30972879 and No.
81000943), Specialized Research Fund for the Doctoral Program of
Higher Education (No. 200801590006) and Natural Science Foundation
of Liaoning Province (No. 20092129).
References
|
1.
|
DP BartelMicroRNAs: genomics, biogenesis,
mechanism, and
functionCell116281297200410.1016/S0092-8674(04)00045-514744438
|
|
2.
|
GA CalinCM CroceMicroRNA-cancer
connection: the beginning of a new taleCancer
Res6673907394200610.1158/0008-5472.CAN-06-080016885332
|
|
3.
|
M LiJ LiX DingM HeSY ChengmicroRNA and
cancerAAPS J12309317201010.1208/s12248-010-9194-0
|
|
4.
|
WC ChoOncomiRs: the discovery and progress
of microRNAs in cancersMol
Cancer660200710.1186/1476-4598-6-6017894887
|
|
5.
|
GA CalinCM CroceMicroRNA signatures in
human cancerNat Rev Cancer6857866200610.1038/nrc199717060945
|
|
6.
|
EA MathéGH NguyenED BowmanMicroRNA
expression in squamous cell carcinoma and adenocarcinoma of the
esophagus: associations with survivalClin Cancer
Res1561926200200919789312
|
|
7.
|
N YanaiharaN CaplenE BowmanUnique microRNA
molecular profiles in lung cancer diagnosis and prognosisCancer
Cell9189198200610.1016/j.ccr.2006.01.02516530703
|
|
8.
|
J GuiY TianX WenSerum microRNA
characterization identifies miR-885-5p as a potential marker for
detecting liver pathologiesClin
Sci120183193201110.1042/CS2010029720815808
|
|
9.
|
ST MeesWA MardinC WendelEP300 - a
miRNA-regulated metastasis suppressor gene in ductal
adenocarcinomas of the pancreasInt J
Cancer126114124201010.1002/ijc.2469519569050
|
|
10.
|
F GottardoCG LiuM FerracinMicro-RNA
profiling in kidney and bladder cancersUrol
Oncol25387392200710.1016/j.urolonc.2007.01.01917826655
|
|
11.
|
MV IorioR VisoneG Di LevaMicroRNA
signatures in human ovarian cancerCancer
Res6786998707200710.1158/0008-5472.CAN-07-193617875710
|
|
12.
|
YX SongZY YueZN WangMicroRNA-148b is
frequently down-regulated in gastric cancer and acts as a tumor
suppressor by inhibiting cell proliferationMol
Cancer101201110.1186/1476-4598-10-121205300
|
|
13.
|
JM CumminsY HeRJ LearyThe colorectal
microRNAomeProc Natl Acad Sci
USA10336873692200610.1073/pnas.051115510316505370
|
|
14.
|
Y ChenY SongZ WangZ YueH XuC XingZ
LiuAltered expression of miR-148a and miR-152 in gastrointestinal
cancers and its clinical significanceJ Gastrointest
Surg1411701179201010.1007/s11605-010-1202-220422307
|
|
15.
|
Y ChiangY SongZ WangAberrant expression of
miR-203 and its clinical significance in gastric and colorectal
cancersJ Gastrointest
Surg156367201110.1007/s11605-010-1367-821063914
|
|
16.
|
SA GeorgesMC BierySY KimCoordinated
regulation of cell cycle transcripts by p53-Inducible microRNAs,
miR-192 and miR-215Cancer
Res681010510112200810.1158/0008-5472.CAN-08-184619074876
|
|
17.
|
R ShiVL ChiangFacile means for quantifying
microRNA expression by real-time
PCRBiotechniques39519525200510.2144/00011201016235564
|
|
18.
|
KJ LivakTD SchmittgenAnalysis of relative
gene expression data using real-time quantitative pcr and the 2
(delta delta c(T))
methodMethods25402408200110.1006/meth.2001.126211846609
|
|
19.
|
LP LimNC LauP Garrett-EngeleMicroarray
analysis shows that some microRNAs downregulate large numbers of
target mRNAsNature433769773200510.1038/nature0331515685193
|
|
20.
|
S LuanL SunF HuangMicroRNA-34a: a novel
tumor suppressor in p53-mutant glioma cell line U251Arch Med
Res416774201010.1016/j.arcmed.2010.02.00720470934
|
|
21.
|
CJ WangZG ZhouL WangClinicopathological
significance of microRNA-31, -143 and -145 expression in colorectal
cancerDis Markers262734200910.1155/2009/92190719242066
|
|
22.
|
A Esquela-KerscherFJ SlackOncomirs -
microRNAs with a role in cancerNat Rev
Cancer6259269200610.1038/nrc1840
|
|
23.
|
Z JinFM SelaruY ChengMicroRNA-192 and -215
are upregulated in human gastric cancer in vivo and suppress ALCAM
expression in
vitroOncogene3015771585201110.1038/onc.2010.53421119604
|
|
24.
|
Z MengX FuX ChenmiR-194 is a marker of
hepatic epithelial cells and suppresses metastasis of liver cancer
cells in miceHepatology5221482157201010.1002/hep.2391520979124
|
|
25.
|
R BaffaM FassanS VoliniaMicroRNA
expression profiling of human metastatic cancers identifies cancer
gene targetsJ Pathol219214221200910.1002/path.258619593777
|
|
26.
|
CJ BraunX ZhangI Savelyevap53-Responsive
micrornas 192 and 215 are capable of inducing cell cycle
arrestCancer
Res681009410104200810.1158/0008-5472.CAN-08-156919074875
|
|
27.
|
LA DavidsonN WangMS ShahJR LuptonI
IvanovRS Chapkinn-3 Polyunsaturated fatty acids modulate
carcinogen-directed non-coding microRNA signatures in rat
colonCarcinogenesis3020772084200910.1093/carcin/bgp24519825969
|
|
28.
|
SR HamiltonLA AaltonenPathology and
genetics of tumours of the digestive systemWorld Health
Organization Classification of TumoursP KleihuesvLH SobinIARC
PressLyon1031442000
|
|
29.
|
V BoniN BitarteI CristobalmiR-192/miR-215
influence 5-fluorouracil resistance through cell cycle-mediated
mechanisms complementary to its post-transcriptional thymidilate
synthase regulationMol Cancer
Ther922652275201010.1158/1535-7163.MCT-10-0061
|
|
30.
|
B SongY WangMA TitmusG BotchkinaA
FormentiniM KornmannJ JuMolecular mechanism of chemoresistance by
miR-215 in osteosarcoma and colon cancer cellsMol
Cancer996201010.1186/1476-4598-9-9620433742
|
|
31.
|
B SongY WangK KudoEJ GavinY XiJ JumiR-192
Regulates dihydrofolate reductase and cellular proliferation
through the p53-microRNA circuitClin Cancer
Res1480808086200810.1158/1078-0432.CCR-08-1422
|
|
32.
|
F PichiorriSS SuhA RocciDownregulation of
p53-inducible microRNAs 192, 194, and 215 impairs the p53/ MDM2
autoregulatory loop in multiple myeloma developmentCancer
Cell18367381201010.1016/j.ccr.2010.09.00520951946
|
|
33.
|
K HinoK TsuchiyaT FukaoK KigaR OkamotoT
KanaiM WatanabeInducible expression of microRNA-194 is regulated by
HNF-1alpha during intestinal epithelial cell
differentiationRNA1414331442200810.1261/rna.81020818492795
|