Introduction
The prevalence of type 2 diabetes is rising
exponentially and has become a global health priority (1,2). The
International Diabetes Federation has predicted that the number of
individuals with diabetes is likely to increase from 240 million in
2007 to 380 million in 2025 (1,3).
More than 60% of the world’s population with diabetes are likely to
come from Asia since this geographic region remains the world’s
most populated area (4). It is
also noted that the number of individuals with diabetes and
impaired glucose tolerance (IGT) in each Asian country, including
Japan, is likely to increase sustainedly in coming decades.
Currently, the prevention of type 2 diabetes in
subjects with IGT involves lifestyle modifications, including
increased physical activity and weight control by reduced caloric
intake (5,6). Moreover, the dietary recommendations
for individuals who are at risk of type 2 diabetes emphasize the
intake of various plant food products, including whole grains,
berries, fruits and vegetables, all known to be not only excellent
sources of dietary fiber, but also good sources of variable
polyphenolic compounds as reviewed by Hanhineva et
al(7). These compounds affect
glucose metabolism by several different mechanisms, including
inhibition of carbohydrate digestion and glucose absorption in the
intestine, stimulation of glucose release from the liver,
activation of insulin receptors and glucose uptake in the
insulin-sensitive tissues and modulation of hepatic glucose
output.
An essential group of polyphenolic compounds are
flavonoids encompassing various structural classes, including
flavones, flavonols, flavans, flavanones, anthocyanins, chalcones,
aurones and isoflavones. Representing the most common flavonoids
consumed in the diet, flavan-3-ols have been reported to exhibit
several health-beneficial effects by acting as antioxidant,
anticarcinogenic, cardiopreventive, antimicrobial, antiviral and
neuroprotective agents (8).
Acacia mearnsii (black wattle) grows
naturally on the mainland of south-eastern Australia and in
Tasmania. A. mearnsii was first introduced from Australia to
South Africa in 1864 and since then its plantations have been
established not only in South Africa, but also in eastern Africa
and South America (9). The aqueous
extracts of the bark of A. mearnsii contain significant
amounts of polyphenols, referred to as acacia polyphenol (AP),
whose major components are unique flavan-3-ol oligomers and
polymers consisting of 4 or 5 monomeric units, including
robinetinidol, fisetinidol, catechin and gallocatechin (10–14).
In Japan, a tablet-form product of AP preparation, which contains
∼80% (w/v) polyphenols with molecular weights ranging from 300 to
3,000 kDa (15,16), is commercially available. With this
AP-containing supplementary diet product (referred to as AP
supplement), Ikarashi et al conducted animal studies using
KKAy mice, model animals for obesity and type 2 diabetes, to
evaluate its anti-obesity and antidiabetic effects, and identified
that oral doses of the AP supplement significantly inhibited body
weight gain and reduced hyperglycemia and insulin resistance
(17,18). Our previous clinical study
demonstrated that healthy adults had a high tolerance for the
4-week intake of AP supplement in daily doses ≤1,000 mg AP
(19).
The promising results of these animal and human
studies led us to conduct a clinical trial to evaluate the effect
of short-term intake of this AP supplement on glucose and insulin
responses to an oral glucose tolerance test (OGTT) in non-diabetic
adult subjects presenting IGT.
Subjects and methods
Subjects
Male and female Japanese participants with diagnosed
IGT, aged 20–70 years, were included in this study. The diagnosis
of IGT was made by an OGTT with a 250–300 ml solution of 75 g
anhydrous glucose. Plasma glucose at 120 min after loading was ≥140
and <200 mg/dl according to the Guidelines for the Treatment of
Diabetes 2001–2003 (20) and the
American Diabetes Association criteria for IGT (21). Participants were excluded if they
had clinically overt diabetes with current 2-h plasma glucose
levels in a 75 g OGTT >200 mg/dl and hemoglobin Alc (HbAlc)
levels >6.5% or if they were receiving antidiabetic,
antihyperlipidemic and/or antihypertensive treatment(s) or other
medications that may have affected their glucose metabolism, lipid
metabolism and/or blood pressure. Participants were also excluded
if they currently suffered from familial hyperlipidemia, chronic
renal failure, cardiovascular dysfunction or systemic infection or
had a past history of such medical conditions and/or any other
serious diseases. The other exclusion criteria were: routine intake
of antioxidant health food or red wine; participation in another
clinical study at the start time of the present study; known
allergies to any food or medicine; being a pregnant woman, nursing
mother or a woman of childbearing potential; and the presence of
any clinically significant medical condition judged by the
investigator to preclude the participant’s inclusion in the
study.
Study design
A randomized, multicenter, placebo-controlled study
was designed to assess the efficacy and safety of the AP supplement
for improving the IGT in enrolled subjects when compared with the
placebo. The study was performed from June 2006 to October 2006 and
involved five clinical service organization centers in Japan. The
study protocol was approved by the institutional ethics committees.
The study was conducted in accordance with the principles of the
Declaration of Helsinki in 1995 (as revised in Edinburgh, 2000) and
the Ethical Guidelines for Epidemiological Research (enacted by the
Japanese Government in 2004). Written informed consent was obtained
from all participants prior to their enrollment in the study. The
overall design of the study consisted of an 8-week intervention
period preceded by a ∼4-week run-in period, during which eligible
subjects were screened.
Intervention and subject assignment
The AP supplement used in this study was a 300 mg
tablet preparation containing 250 mg AP in a daily dose of four
tablets. The AP sample was prepared from hot-water extracts of the
bark of A. mearnsii that was derived from a plantation in
South Africa. As shown in Table I,
there was no nutritionally significant difference in carbohydrate
content (and thus in energy) between the AP tablet and the AP-free
placebo tablet. In addition, the AP and placebo tablets were
similar in color and packaging.
 | Table IComposition of the AP and placebo
tablets used in the present study. |
Table I
Composition of the AP and placebo
tablets used in the present study.
| Composition | Amount per daily dose
(mg) |
|---|
|
|---|
| AP tablet | Placebo tablet |
|---|
| AP | 250.1 | 0 |
| Sugar estersa | 36.0 | 36.0 |
| Dextrina | 360.0 | 480.0 |
| Reduced
maltosea | 180.0 | 180.0 |
| Cellulose | 353.3 | 442.2 |
| Caramela | 20.6 | 61.8 |
| Total
carbohydrates | 596.6 | 757.8 |
The study intervention started ∼1 week after
screening of eligible subjects. The subjects were sequentially
assigned based on random number tables to one of the two masked
products and randomized (1:1) to the AP supplement (AP group) and
the placebo (placebo group). All subjects were required to take
four tablets of the allocated product over the 8-week intervention
period, to accomplish full clinical and laboratory examinations at
the start of intervention (baseline) and after 4 and 8 weeks
intervention and to self-record their intake of the allocated
tablet and occurring adverse events in a study diary. In addition,
subjects were instructed to maintain their usual diet and to
continue their usual physical activity behaviors throughout the
intervention.
OGTT results-based efficacy
assessment
To evaluate the effectiveness of the AP supplement
in improving IGT, an OGTT was performed in each subject at the
start of intervention (baseline) and after 4 and 8 weeks of
intervention, following a 10–14 h overnight fast and ≥12 h from the
last study tablet intake. Plasma glucose and insulin concentrations
at 0, 30, 60, 90 and 120 min after the glucose load were determined
to assess efficacy upon glucose metabolism. The 2-h area under the
curve (AUC0→2h) values for glucose and insulin were the
additional measures for efficacy assessment. The OGTT values for
plasma levels of glucose and insulin at 0 min (G0 and
I0, respectively) were also utilized for measurement of
an index of insulin resistance, the homeostasis model assessment of
insulin resistance (HOMA-IR), calculated as follows: HOMA-IR =
G0 (mg/dl) × I0(μU/ml)/405 (20,22–25).
Measurement of hematochemical,
hematological and anthropometric parameters
Total cholesterol, low-density lipoprotein
(LDL)-cholesterol, high-density lipoprotein (HDL)-cholesterol,
triglycerides, serum electrolytes and other routine hematochemical
laboratory test variables, including total protein, albumin,
alkaline phosphatase, lactate dehydrogenase, aspartate
aminotransferase, alanine aminotransferase,
γ-glutamyltranspeptidase, urea nitrogen, uric acid and creatinine,
were measured in serum samples collected from individual subjects
after an overnight fast at baseline and at 4 and 8 weeks after the
start of treatment. HbA1c, red blood cell count, white blood cell
count, platelet count, hemoglobin and hematocrit were measured in
whole blood. In addition, several anthropometric parameters,
including body mass index (BMI), blood pressure values and heart
rate were also measured at the same time points during the study
period.
Safety assessment
Safety was assessed on the basis of the incidence
and severity of intervention-related adverse events reported
throughout the 8-week intervention period, as well as abnormal
changes in hematochemical and hematological laboratory test
variables and those in anthropometric parameters.
Statistical analysis
The data were analyzed with PASW Statistics 18
(SPSS, Inc., Chicago, IL, USA). Continuous normally distributed
data are expressed as means ± standard error of the mean (SEM). The
significance of differences in mean values and proportions of
parameters between the test (AP) and placebo groups was assessed by
the Student’s unpaired t-test and the Chi-square test,
respectively. Changes from baseline were calculated by subtracting
the value at the baseline from the value after the 4- or 8-week
intervention. The Student’s paired t-test was used to assess
within-group differences between the values at the baseline and
those after the 4- or 8-week intervention. Plasma glucose and
insulin concentrations were measured at all time points (0, 30, 60,
90 and 120 min) during the OGTT. AUC0→2h values for
glucose and insulin were calculated using the trapezoid rule.
P<0.05 was considered to indicate a statistically significant
difference.
Results
Baseline characteristics of the study
population
A total of 34 subjects were eligible. Seventeen
subjects were assigned to each of the AP supplement (AP group) and
the placebo (placebo group), and all of the subjects completed the
entire study. The baseline characteristics of the two study groups
are presented in Table II. The
data shown in Table II were
obtained on the first study day after the run-in period was
completed. All subjects met the IGT inclusion criteria and none had
diagnosed diabetes or insulin resistance when assessed on the basis
of the fast plasma glucose concentration, serum HbA1c, 2-h plasma
glucose level in 75 g OGTT and HOMA-IR determined at the end of the
2-week run-in. The HbA1c values and systolic and diastolic blood
pressures were within the normal range in all the enrolled
subjects, although a number of patients had a marginally high BMI
and/or serum triglycerides.
| Table IIBaseline characteristics of 34
subjects in the two study groups who completed the entire
study. |
Table II
Baseline characteristics of 34
subjects in the two study groups who completed the entire
study.
| Clinical
variable | Placebo group
(n=17) | AP group (n=17) | P-value |
|---|
| Gender (male/female;
n) | 13/4 | 13/4 | |
| Age (years) | 55.1±2.0 | 49.6±1.5 | 0.038 |
| Height (cm) | 167±3 | 166±2 | 0.822 |
| Weight (kg) | 69.3±1.8 | 69.8±2.8 | 0.882 |
| BMI
(kg/m2) | 24.8±0.6 | 25.1±0.8 | 0.765 |
| Fasting plasma
glucose (mg/dl) | 114±2 | 112±3 | 0.631 |
| Fasting plasma
insulin (μU/ml) | 4.4±0.4 | 5.7±0.6 | 0.080 |
| 2-h plasma glucose
level in 75 g OGTT (mg/dl) | 181±9 | 173±9 | 0.545 |
| HOMA-IR | 1.2±0.1 | 1.6±0.2 | 0.083 |
| Hemoglobin A1c
(%) | 5.5±0.1 | 5.5±0.1 | 0.635 |
| Systolic blood
pressure (mmHg) | 122.4±4.4 | 125.2±2.3 | 0.565 |
| Diastolic blood
pressure (mmHg) | 76.7±2.7 | 81.5±2.1 | 0.171 |
| Total cholesterol
(mg/dl) | 201.9±8.5 | 208.2±8.2 | 0.593 |
| LDL-cholesterol
(mg/dl) | 135.1±7.1 | 135.3±8.3 | 0.983 |
| HDL-cholesterol
(mg/dl) | 50.5±3.3 | 49.8±3.0 | 0.886 |
| Triglycerides
(mg/dl) | 135.3±12.7 | 191.8±24.3 | 0.048 |
At baseline, although mean values of almost all
clinical variables, with the exception of the 2-h plasma glucose
level in the OGTT in the two groups, were within the normal range,
the mean values of serum triglycerides for the AP group (191.8±24.3
mg/dl) were above the normal range. Significant differences between
the two groups were observed in mean values of age and serum
triglycerides (P<0.05; Table
II).
Effect on IGT
Table III shows the
plasma glucose response to a 2-h OGTT at baseline and after 4- and
8-week interventions. In the placebo group, there was no
statistically significant difference in the mean value of plasma
glucose concentrations at each time point of the OGTT from 0 to 120
min throughout the 8-week intervention period. By contrast, the
mean values at 90 and 120 min for the AP group were significantly
or near-significantly reduced after the 8-week intervention,
compared with the baseline value (P=0.014 and 0.051, respectively).
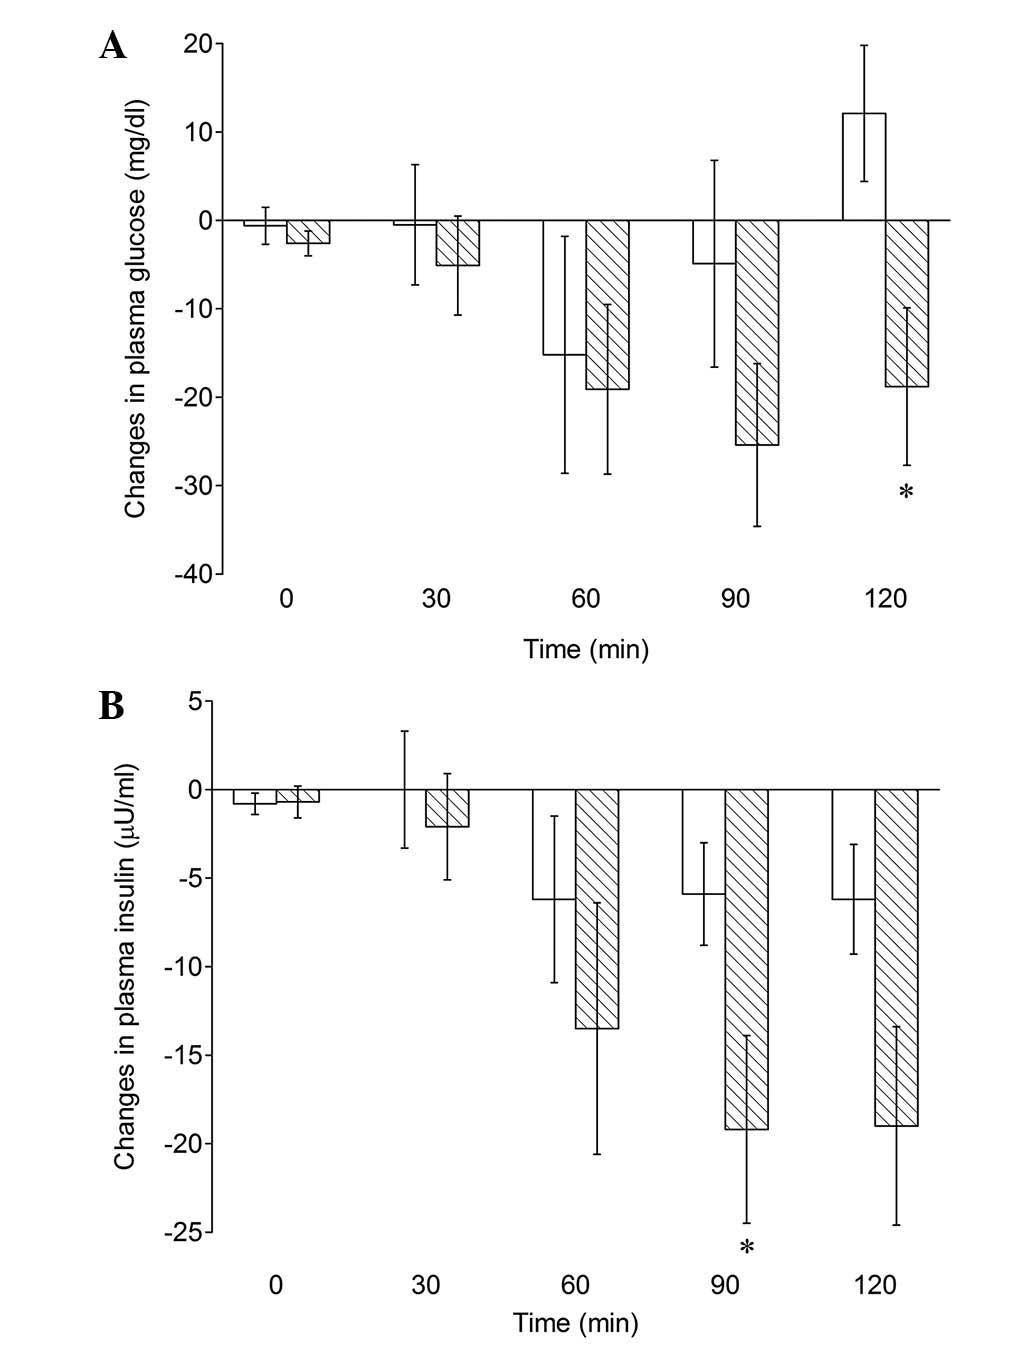
Moreover, as shown in Fig. 1A,
there appeared to be clear differences in changes of plasma glucose
from baseline at 90 and 120 min of the OGTT after the 8-week
intervention between the AP and placebo groups, with the 120 min
values reaching a statistical significance (−18.8±8.9 mg/dl vs.
12.1±7.7 mg/dl; P=0.013).
| Table IIIPlasma glucose concentrations during
an OGTT conducted immediately prior to the start of intervention
(baseline) and after 4 and 8 weeks of intervention with the placebo
(placebo group) or the AP supplement (AP group). |
Table III
Plasma glucose concentrations during
an OGTT conducted immediately prior to the start of intervention
(baseline) and after 4 and 8 weeks of intervention with the placebo
(placebo group) or the AP supplement (AP group).
| Study group | Intervention
period | Plasma glucose
(mg/dl) |
|---|
|
|---|
| 0 min | 30 min | 60 min | 90 min | 120 min |
|---|
| Placebo (n=17) | Baseline | 114±2 | 199±8 | 234±12 | 214±13 | 181±9 |
| 4 weeks | 117±3 (0.109) | 205±9 (0.281) | 229±12 (0.550) | 220±14 (0.313) | 190±12 (0.340) |
| 8 weeks | 113±3 (0.761) | 199±7 (0.945) | 219±12 (0.272) | 209±14 (0.682) | 193±10 (0.137) |
| AP (n=17) | Baseline | 112±3 | 185±7 | 221±10 | 206±10 | 173±9 |
| 4 weeks | 110±2 (0.204) | 190±6 (0.269) | 220±10 (0.965) | 201±9 (0.666) | 162±10 (0.202) |
| 8 weeks | 110±2 (0.069) | 180±6 (0.379) | 202±11 (0.065) | 181±12 (0.014) | 154±9 (0.051) |
Intake of the AP supplement for 8 weeks also induced
a similar downward trend in plasma insulin at 90 and 120 min of the
OGTT (Table IV); mean plasma
insulin concentrations at 90 and 120 min were significantly lowered
compared with the baseline figures (P=0.002 and 0.004,
respectively). Fig. 1B shows that
there were significant differences in changes of plasma insulin
from baseline for the 90 min value between the AP and placebo
groups (−19.2±5.3 vs. −5.9±2.9 μU/ml; P=0.032).
| Table IVPlasma insulin concentrations during
an OGTT conducted prior to the start of intervention (baseline) and
after 4 and 8 weeks of intervention with the placebo (placebo
group) or the AP supplement (AP group). |
Table IV
Plasma insulin concentrations during
an OGTT conducted prior to the start of intervention (baseline) and
after 4 and 8 weeks of intervention with the placebo (placebo
group) or the AP supplement (AP group).
| Study group | Intervention
period | Plasma insulin
(μU/ml) |
|---|
|
|---|
| 0 min | 30 min | 60 min | 90 min | 120 min |
|---|
| Placebo (n=17) | Baseline | 4.4±0.4 | 18.0±2.0 | 29.4±4.3 | 31.2±3.2 | 31.2±3.7 |
| 4 weeks | 5.5±0.8
(0.159) | 23.2±3.1
(0.042) | 35.9±7.0
(0.230) | 37.9±5.7
(0.092) | 40.2±6.8
(0.090) |
| 8 weeks | 3.6±0.5(0.192) | 18.1±3.8
(0.989) | 23.2±4.5
(0.208) | 25.5±4.4
(0.071) | 25.0±3.3
(0.063) |
| AP (n=17) | Baseline | 5.7±0.6 | 23.3±3.0 | 42.5±7.3 | 50.5±8.2 | 51.4±9.1 |
| 4 weeks | 6.5±0.9
(0.449) | 29.0±4.4
(0.062) | 47.2±8.9
(0.499) | 60.7±10.6
(0.080) | 52.4±7.7
(0.822) |
| 8 weeks | 5.0±0.9
(0.472) | 21.1±3.9
(0.489) | 29.0±5.4
(0.075) | 31.3±6.5
(0.002) | 32.4±5.1
(0.004) |
Moreover, the 8-week intake of the AP supplement
significantly lowered the glucose and insulin AUC0→2h
values compared with the baseline levels (P=0.018 and 0.009,
respectively), although there was no significant difference in
changes of AUC0→2h values for glucose or insulin from
base-line between the AP and placebo groups (Table V). These results indicate that
plasma glucose and insulin responses to the OGTT may be improved by
the intake of an AP supplement for 8 weeks.
| Table VPlasma glucose and insulin responses
to an OGTT conducted prior to the start of intervention (baseline)
and after 8 weeks of intervention with the placebo (placebo group)
or the AP supplement (AP group) as revealed by glucose
AUC0→2h and insulin AUC0→2h. |
Table V
Plasma glucose and insulin responses
to an OGTT conducted prior to the start of intervention (baseline)
and after 8 weeks of intervention with the placebo (placebo group)
or the AP supplement (AP group) as revealed by glucose
AUC0→2h and insulin AUC0→2h.
| Variable | Intervention
period | Measures of
variance | Between-group
difference in variance (P-value) |
|---|
|
|---|
| Placebo group
(n=17) | AP group
(n=17) |
|---|
| Glucose
AUC0→2h (mg/dl/h) | Baseline | 397.2±17.1 | 377.2±14.3 | |
| 8 weeks | 389.7±17.7
(0.622) | 347.1±14.2
(0.018) | |
| Change from
baseline | −7.4±14.8 | −30.1±11.4 | 0.234 |
| Insulin
AUC0→2h (μU/dl/h) | Baseline | 48.2±5.0 | 72.4±11.0 | |
| 8 weeks | 40.5±6.8
(0.159) | 50.0±8.5
(0.009) | |
| Change from
baseline | −7.6±5.2 | −22.3±7.6 | 0.119 |
Effect on other glucose
metabolism-related variables
Fasting plasma glucose and insulin concentrations
shown as the values at 0 min of the OGTT before the start of
intervention were not significantly affected by the 4- or 8-week
intake of the AP supplement (Tables
III and IV). Similarly, the
insulin resistance index, HOMA-IR, as well as HbA1c concentrations,
were also scarcely altered during intervention in the AP and
placebo groups (Table VI).
| Table VIHOMA-IR and hemoglobin Alc values
determined prior to the start of intervention (baseline) and after
4 and 8 weeks of intervention with the placebo (placebo group) or
the AP supplement (AP group). |
Table VI
HOMA-IR and hemoglobin Alc values
determined prior to the start of intervention (baseline) and after
4 and 8 weeks of intervention with the placebo (placebo group) or
the AP supplement (AP group).
| Parameter | Intervention
period | Measures of
variance | Between-group
difference in variance (P-value) |
|---|
|
|---|
| Placebo group
(n=17) | AP group
(n=17) |
|---|
| HOMA-IR | Baseline | 1.2±0.1 | 1.6±0.2 | |
| 4 weeks | 1.6±0.3
(0.144) | 1.7±0.2
(0.606) | |
| Change from
baseline | 0.4±0.2 | 0.1±0.3 | 0.503 |
| 8 weeks | 1.0±0.1
(0.606) | 1.4±0.2
(0.349) | |
| Change from
baseline | −0.2±0.2 | −0.3±0.3 | 0.924 |
| Hemoglobin Alc
(%) | Baseline | 5.5±0.1 | 5.6±0.1 | |
| 4 weeks | 5.5±0.1
(0.119) | 5.4±0.1
(0.396) | |
| Change from
baseline | 0 | −0.1±0.1 | 0.931 |
| 8 weeks | 5.6±0.1
(0.154) | 5.4±0.1
(0.318) | |
| Change from
baseline | 0.1±0.0 | −0.1±0.1 | 0.111 |
Safety assessment
Two subjects in the placebo group and no subjects in
the AP group reported adverse events. The correlation of adverse
events with the allocated tablet was not ruled out during the study
period. One of the two adverse events reported from the placebo
group was gastralgia and the other was allergic symptoms. The two
events were mild in severity and occurred only temporarily. In the
two groups, routine laboratory tests and anthropometric parameters
(body weight, BMI, blood pressure and pulse rate) did not show any
significant abnormalities throughout the duration of the
intervention.
Discussion
IGT, as well as insulin resistance, is known to be
associated with an increased risk of type 2 diabetes and
hypertension, which are well-recognized risk factors for
cardiovascular diseases (26–28).
Considering the heavy burden of these metabolic disorders on the
public health, improvement of IGT and/or insulin resistance is a
supremely important health issue. It has been reported from animal
experiments, in which KKAy mice with high-fat diet-induced obesity
were used, that AP reduces hyperglycemia and hyperinsulinemia by
increasing adiponectin secretion and suppressing TNF-α secretion by
white adipocytes, as well as by enhancing the expression of GLUT4
in skeletal muscle. AP was also effective in decreasing the HOMA-IR
value to a significant level (17). In consistent with this animal
study, the present randomized, placebo-controlled trial in
otherwise healthy subjects with IGT demonstrated that AP supplement
intake for up to 8 weeks significantly reduced (improved) overall
glucose and insulin responses to an oral glucose load in the OGTT,
indicating a beneficial effect of the AP supplement on glucose
homeostasis. When comparing the AP supplement with the placebo,
there was no difference in the early plasma glucose and insulin
responses, as presented by the similar mean incremental glucose
values for the two study groups at 30 min after the start of OGTT.
The major effects of the AP supplement were observed at 90 or 120
min, where there were significant reductions in plasma glucose and
insulin relative to the placebo. By contrast, the AP supplement did
not show any recognizable effects on plasma glucose nor insulin
within the first 30 min. Thus, it is likely that, in our study
designed to investigate the chronic effect of the AP supplement,
its intake may be implicated in the improvement of glucose
metabolism rather than the inhibition of glucose absorption from
the small intestine.
In contrast to the positive effect on glucose
intolerance, AP supplement intake did not alter the HOMA-IR value.
This may be explained, partly at least, by the finding that the
mean HOMA-IR values for the AP and placebo groups at baseline
(1.2±0.1 and 1.6±0.2, respectively) were within the normal range
(20), implying that the majority
of subjects did not have insulin resistance (26,29–31).
Promising results concerning the effects of various
dietary polyphenols, including flavonoids, phenolic acid,
proanthocyanidins and resveratrol, on carbohydrate homeostasis have
been obtained from numerous in vitro and animal studies as
previously documented (7).
However, there are extremely few controlled studies investigating
the positive effects of specific polyphenols. Among them is the
present study, which demonstrated that AP may have favorable
metabolic effects and thereby further prevent the development of
type 2 diabetes and, ultimately, cardiovascular diseases.
Currently, the relevant mechanisms underlying the beneficial
effects of AP on glucose metabolism are difficult to postulate
since the molecular mechanism have not been comprehensively
studied. For an improved understanding of the role of AP in the
regulation of glucose metabolism, further studies assessing its
effects on insulin and other hormonal responses are required.
Throughout the 8-week intervention period, no AP
supplement-related adverse events were reported. The safety of the
AP supplement is supported by our previous study demonstrating that
a 4-week intake of the AP supplement in daily doses ≤1,000 mg AP
was safe in healthy male adults (19). Further clinical trials are
warranted to confirm the potential nutritional usefulness of the AP
supplement in the improvement of glucose intolerance in populations
affected by IGT or insulin-resistant conditions, including
hyperglycemia and hyperinsulinemia, as well as obesity,
hypertension and hyper-lipidemia.
Based on the results from the current study on
efficacy and safety assessments, we conclude that the AP supplement
may be safely administered and may improve glucose homeostasis in
non-diabetic subjects with IGT.
Acknowledgements
The authors would like to thank Dr T.
Yamamoto for his advice and support and Dr E. Yamamoto and M.
Iizuka for their statistical expertise and help in preparation of
the manuscript. SO and TM are employees and TK is the president of
mimozax Co., Ltd. The other authors declare no competing
interests.
References
|
1.
|
Wild S, Roglic G, Green A, Sicree R and
King H: Global prevalence of diabetes: estimates for the year 2000
and projection for 2030. Diabetes Care. 27:1047–1053.
2004.PubMed/NCBI
|
|
2.
|
Danaei G, Finucane MM, Lu Y, et al:
National, regional, and global trends in fasting plasma glucose and
diabetes prevalence since 1980: systematic analysis of health
examination surveys and epidemiological studies with 370
country-years and 2.7 million participants. Lancet. 378:31–40.
2011.
|
|
3.
|
International Diabetes Federation:
Diabetes Atlas. 3rd edition. International Diabetes Federation;
Brussels, Belgium: 2006
|
|
4.
|
Chen JCN, Malik V, Jia W, Kadowaki T,
Yajnik CS, Yoo KH and Hu FB: Diabetes in Asia: epidemiology, risk
factors, and pathophysiology. JAMA. 301:2129–2140. 2009. View Article : Google Scholar : PubMed/NCBI
|
|
5.
|
Tuomilehto J, Lindström J, Eriksson JG, et
al: Prevention of type 2 diabetes mellitus by changes in lifestyle
among subjects with impaired glucose tolerance. N Engl J Med.
344:1343–1350. 2001. View Article : Google Scholar : PubMed/NCBI
|
|
6.
|
Lindström J, Ilanne-Parikka P, Peltonen M,
et al: Sustained reduction in the incidence of type 2 diabetes by
lifestyle intervention: Follow-up of the Finish Diabetes Prevention
Study. Lancet. 368:1673–1679. 2006.PubMed/NCBI
|
|
7.
|
Hanhineva K, Törrönen R, Bondia-Pons I,
Pekkinen J, Kolehmainen M, Mykkänen H and Poutanen K: Impact of
dietary polyphenols on carbohydrate metabolism. Int J Mol Sci.
11:1365–1402. 2010. View Article : Google Scholar : PubMed/NCBI
|
|
8.
|
Aron PM and Kennedy JA: Flavan-3-ols:
nature, occurrence and biological activity. Mol Nutr Food Res.
52:79–104. 2008. View Article : Google Scholar : PubMed/NCBI
|
|
9.
|
Yazaki Y: Acacia storyi: a
potential tannin-producing species. Australian Forestry. 60:24–28.
1997. View Article : Google Scholar
|
|
10.
|
Roux DG and Maihs EA: Condensed tannins. 3
Isolation and estimation of (−)-7:3′:4′:5′-tetrahydroxyflavan-3-ol,
(+)-catechin and (+)-gallocatechin from black-wattle-bark extract.
Biochem J. 74:44–49. 1960.
|
|
11.
|
Roux DG and Paulus E: Condensed tannins. 7
Isolation of (−)-7:3′:4′-trihydroxyflavan-3-ol [(−)-fisetinidol], a
naturally occurring catechin from black-wattle heartwood. Biochem
J. 78:120–123. 1961.
|
|
12.
|
Roux DG, Maihs EA and Paulus E: Condensed
tannins. 9 Distribution of flavonoid compounds in the heartwood and
barks of some interrelated wattles. Biochem J. 78:834–839.
1961.PubMed/NCBI
|
|
13.
|
Kusano R, Ogawa S, Matsuo Y, Tanaka T,
Yazaki Y and Kouno I: α-Amylase and lipase inhibitory activity and
structural characterization of acacia bark proanthocyanidins. J Nat
Prod. 74:119–128. 2011.
|
|
14.
|
Drewes SE and Roux DG: Condensed tannins.
15 Interrelationships of flavonoid components in wattle-bark
extract. Biochem J. 87:167–172. 1963.PubMed/NCBI
|
|
15.
|
Roux DG and Evelyn SR: Condensed tannins.
1 A study of complex leuco-anthocyanins present in condensed
tannins. Biochem J. 69:530–538. 1958.PubMed/NCBI
|
|
16.
|
Zheng G, Lin Y and Yazaki Y: Comparing
molecular size distribution of tannin extracts from Acacia
mearnsii bark from different countries. Holzforschung.
42:407–408. 1988.
|
|
17.
|
Ikarashi N, Toda T, Okaniwa T, Ito K,
Ochiai W and Sugiyama K: Anti-obesity and anti-diabetic effects of
acacia polyphenol in obese diabetic KKAy mice fed high-fat diet.
Evid Based Complement Alternat Med. 2011:9520312011. View Article : Google Scholar : PubMed/NCBI
|
|
18.
|
Ikarashi N, Takeda R, Ito K, Ochiai W and
Sugiyama K: The inhibition of lipase and glucosidase activities by
acacia polyphenol. Evid Based Complement Alternat Med.
2011:2720752011. View Article : Google Scholar : PubMed/NCBI
|
|
19.
|
Kataoka T, Ogawa S, Matsumae T, Yazaki Y
and Yamaguchi H: Safety of acacia polyphenol dietary supplement:
safety evaluation studies in healthy male adults. Pharmacometrics.
80:43–52. 2011.(In Japanese).
|
|
20.
|
Japan Diabetes Society: Guidelines for
Treatment of Diabetes 2002–2003. Bunkodo, Tokyo: 2002, (In
Japanese).
|
|
21.
|
American Diabetes Association: Diagnosis
and classification of diabetes mellitus. Diabetes Care. 27(Suppl
1): S5–S10. 2004. View Article : Google Scholar
|
|
22.
|
Katz A, Nambi SS, Mather K, Baron AD,
Follmann DA, Sullivan G and Quon MJ: Quantitative insulin
sensitivity check index: a simple, accurate method for assessing
insulin sensitivity in humans. J Clin Endocrinol Metab.
85:2402–2410. 2000. View Article : Google Scholar : PubMed/NCBI
|
|
23.
|
Bonora E, Kiechl S, Willeit J, et al:
Prevalence of insulin resistance in metabolic disorders: the
Bruneck Study. Diabetes. 47:1643–1649. 1998. View Article : Google Scholar : PubMed/NCBI
|
|
24.
|
Grassi D, Lippi C, Necozione S, Desideri G
and Ferri C: Short-term administration of dark chocolate is
followed by a significant increase in insulin sensitivity and a
decrease in blood pressure in healthy persons. Am J Clin Nutr.
81:611–614. 2005.PubMed/NCBI
|
|
25.
|
Grassi D, Desideri G, Necozione S, et al:
Blood pressure is reduced and insulin sensitivity increased in
glucose-intolerant, hypertensive subjects after 15 days of
consuming high-polyphenol dark chocolate. J Nutr. 138:1671–1676.
2008.
|
|
26.
|
The DECODE study group on behalf of the
European Diabetes Epidemiology Group: Glucose tolerance and
mortality comparison of WHO and American Diabetes Association
diagnostic criteria. Lancet. 354:617–662. 1999. View Article : Google Scholar : PubMed/NCBI
|
|
27.
|
Osei K, Rhinesmith S, Gaillard T and
Schuster D: Impaired insulin sensitivity, insulin secretion, and
glucose effectiveness predict future development of impaired
glucose tolerance and type 2 diabetes in prediabetic African
Americans: implications for primary diabetes prevention. Diabetes
Care. 27:1439–1446. 2004. View Article : Google Scholar
|
|
28.
|
Thalhammer C, Balzuweit B, Busjahn A,
Walter C, Luft FC and Haller H: Endothelial cell dysfunction and
arterial wall hypertrophy are associated with disturbed
carbohydrate metabolism in patients at high risk for cardiovascular
disease. Arterioscler Thromb Vas Biol. 19:1173–1179. 1999.
View Article : Google Scholar : PubMed/NCBI
|
|
29.
|
McNeeley MJ, Boyko EJ, Leonetti DL, Kahn
SE and Fujimoto WY: Comparison of a clinical model, the oral
glucose tolerance test, and fasting glucose for prediction of type
2 diabetes risk in Japanese Americans. Diabetes Care. 26:758–763.
2003. View Article : Google Scholar : PubMed/NCBI
|
|
30.
|
McLaughlin T, Abbasi F, Cheal K, Chu J,
Lamendola C and Reaven G: Use of metabolic markers to identify
overweight individuals who are insulin resistant. Am Intern Med.
139:802–809. 2003. View Article : Google Scholar : PubMed/NCBI
|
|
31.
|
Kashiwabara H, Inaba M, Maruno Y, et al:
Insulin levels during fasting and the glucose tolerance test and
Homa’s index predict subsequent development of hypertension. J
Hypertens. 18:83–88. 2000.
|