Introduction
Since the 1990s, the proportions of overweight and
obese Chinese adolescents have significantly increased (1). The prevalence of obesity in
adolescents contributes to the early onset of obesity-associated
diseases, including type 2 diabetes, hypertension and dislipidemia.
The prevalence of obesity continues to increase (2,3).
Obesity is the main risk factor for the early onset of type 2
diabetes. Insulin resistance (IR) and defects in islet β-cell
insulin secretion are the main causes of impaired glucose tolerance
(IGT) and overt type 2 diabetes in obese adults and adolescents
(4–6).
In adults with normal glucose tolerance (NGT), the
various extents of IR and insulin secretion have previously been
identified between normal weight and obese individuals (7,8).
Numerous studies have focused on metabolic abnormalities in
adolescents with diabetes and IGT (9,10).
However, among Asian adolescents with NGT, the changes in IR and
insulin secretion remain unclear. We hypothesize that differences
exist in the IR and secretion among normal weight, overweight and
obese adolescents with NGT.
Subjects and methods
Subjects
A total of 124 adolescents (59 males and 65 females,
mean age plus or minus standard deviation=13.6±0.7 years) from a
high school (27th High School, Beijing, China) volunteered to
participate in this study. The volunteers were asked to answer a
questionnaire concerning their health and family history under the
direction of the doctors. Maturational status was divided into
pubertal and prepubertal based on the onset of menarche in girls
and semen production in boys. After explaining the study procedures
and protocol to the participants and their parents, informed
consents were obtained prior to the initiation of the study. The
study was approved by the Ethics Committee of the Beijing Sport
University (Beijing, China) and the Ministry of Education (Beijing,
China).
The subjects were divided into three groups
according to their body mass index (BMI): the obese (n=41,
BMI=24.7–34.1 kg/m2), overweight (n=52, BMI=22.4–27.7
kg/m2) and normal weight (n=31, BMI=14.6–21.9
kg/m2) groups. The age- and gender-specific BMI cutoff
points used in this study were those defined by the Group of China
Obesity Task Force (11). The
subjects were not taking any medications and had not previously
suffered from any disease known to influence body composition,
insulin sensitivity, physical activity or dietary intake.
Anthropometry and measurement of body
composition
The measurements included anthropometry (height,
body weight and BMI) and fat distribution (percentage body fat and
percentage truncal fat). Body weight and height were measured to an
accuracy of 0.1 kg and 0.1 cm, respectively. BMI was calculated as
the body weight in kilograms divided by the square of the height in
centimeters. Body and truncal fat were measured by dual-energy
X-ray absorptiometry (Lunar DPX-L; Lunar Corporation, Madison, WI,
USA) and expressed as a percentage.
Oral glucose tolerance test (OGTT), IR
and secretion
Each participant was subjected to a 120 min OGTT
(dextrose, 1.75 g/kg body weight; up to 75 g) after 10 h of
overnight fasting (12). Venous
blood samples were obtained at 0, 30 and 120 min to determine the
plasma glucose levels (G0, G30 and
G120) using the glucose oxidase method (Beckman,
Albertville, MN, USA), and the insulin levels (I0,
I30 and I120) using chemiluminescence (DPC
Immulite, Los Angeles, CA, USA), respectively.
The homeostasis model assessment estimate of IR
(HOMA-IR) was calculated from fasting insulin (I0) and
fasting glucose (G0) as follows:
HOMA-IR=(I0×G0)/22.5, with insulin levels in
μU/ml and glucose levels in mmol/l (13). First-phase insulin secretion was
estimated using the following index equation: early insulin release
index (IRI)=Δ30 insulin (I30−I0)/Δ30 glucose
(G30−G0). The IRI is an indicator of β-cell
function (9).
Statistical analyses
All variables were examined for normalities of
distribution by the Kolmogorov-Smirnov test. Due to the abnormal
distributions, the insulin levels and associated data were
subjected to natural logarithm transformation (expressed by
LnI0, LnI30, LnI120, LnHOMA-IR and
LnIRI). Continuous measurement data are expressed as the mean ±
standard deviation. Comparisons among groups were evaluated using
one-way ANOVA and the differences were further evaluated using
Fisher’s least significant difference test. Numerical data were
expressed as rates and compared using the χ2 test.
Spearman’s correlation coefficients were used to determine
bivariate relation for either two parameters. P<0.05 was
considered to indicate a statistically significant result. All data
were analyzed with SPSS 17.0 software (SPSS, Inc., Chicago, IL,
USA).
Results
The girls in this study were more mature than the
boys (prepubertal/pubertal; 3/58 in girls vs. 30/21 in boys,
P<0.0001). Twelve adolescents (4 girls and 8 boys) failed to
report their maturational status. The girls had a significantly
higher percentage of body and truncal fat compared with boys in all
three groups (data not shown). No significant gender difference was
observed in LnHOMA-IR and LnIRI. Therefore, data from the girls and
boys were combined for all other analyses.
Table I shows
significant differences in anthropometric measurements and the
percentage of fat among the normal weight, overweight and obese
groups. By contrast, no significant difference was observed in age,
gender, birth weight, maturational status and family history of
type 2 diabetes among the three groups.
 | Table I.Subject characteristics. |
Table I.
Subject characteristics.
| Variable | Group
| P-value
|
|---|
| NW | OW | OB | P1 | P2 | P3 |
|---|
| Number of cases | 31 | 52 | 41 | | | |
| Age (years)a | 13.6±0.6 | 13.7±0.6 | 13.1±0.8 | 0.860 | 0.417 | 0.265 |
| Male/female | 13/18 | 22/30 | 24/17 | 0.672 | 0.264 | 0.084 |
|
Prepubertal/pubertal | 8/20 | 13/35 | 12/24 | 0.889 | 0.683 | 0.535 |
| Birth weight
(kg)a | 3.4±0.6 | 3.4±0.5 | 3.4±0.6 | 0.991 | 0.868 | 0.838 |
| Family history of DM
(Y/N) | 13/18 | 17/35 | 15/26 | 0.396 | 0.645 | 0.695 |
| BMI
(kg/m2)a | 19.3±2.2 | 24.9±1.3 | 29.7±2.4 | <0.001 | <0.001 | 0.000 |
| Body fat
(%)a | 24.5±8.7 | 33.8±4.9 | 36.6±7.5 | <0.001 | <0.001 | 0.022 |
| Truncal fat
(%)a | 21.9±8.8 | 33.3±5.6 | 36.2±4.3 | <0.001 | <0.001 | 0.033 |
| Waist circumference
(cm)a | 65.2±4.8 | 81.8±7.1 | 94.6±7.1 | <0.001 | <0.001 | <0.001 |
| Hip circumference
(cm)a | 85.8±4.6 | 97.5±4.7 | 105.7±5.3 | <0.001 | <0.001 | <0.001 |
Fig. 1A shows that
the blood glucose levels of all subjects at various time points
were within the normal range. The blood glucose levels at various
time points were not significantly different between the overweight
and obese groups. However, the blood glucose levels at 0 and 120
min of these two groups were both higher than those of the normal
weight group (P<0.001 and P<0.05), whereas no significant
difference was observed in the 30 min glucose levels among the
three groups (P>0.05).
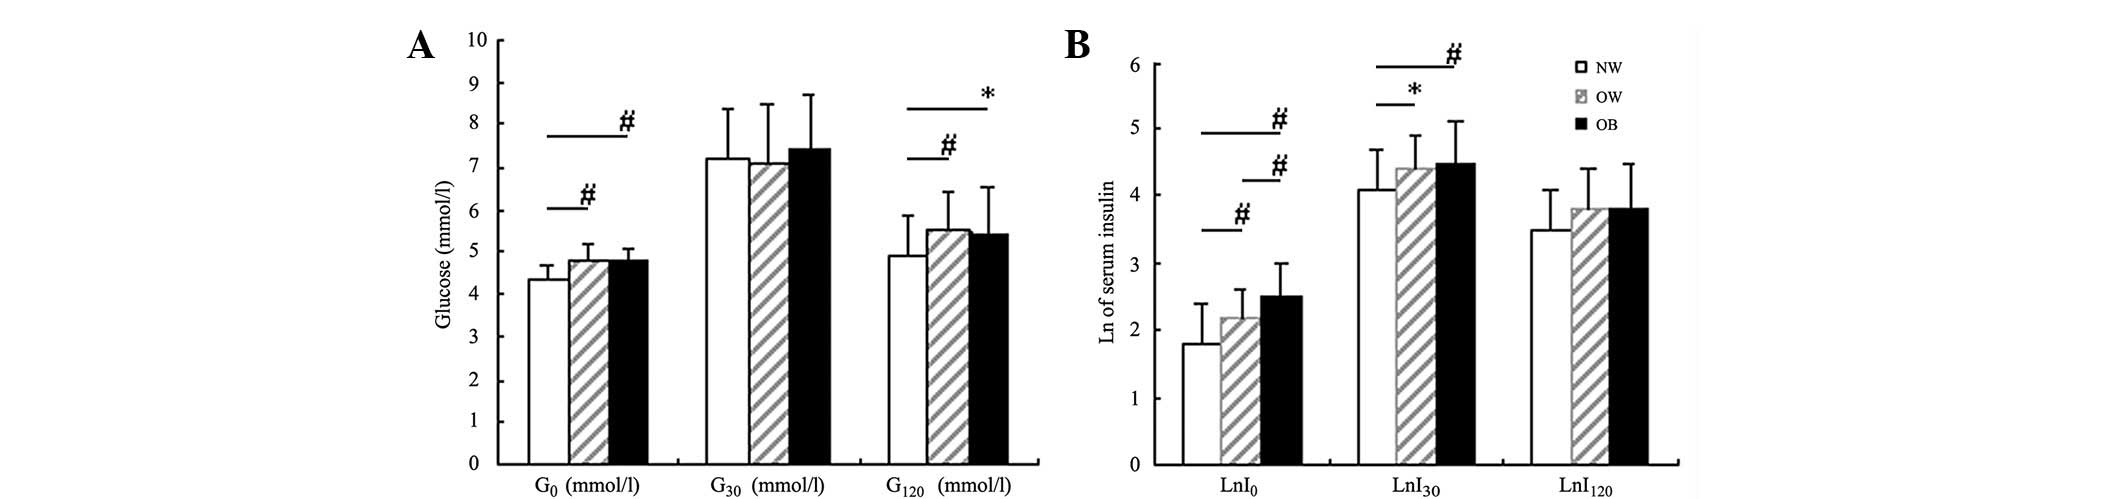 | Figure 1.Comparisons of blood glucose and
natural logarithm (Ln) of insulin levels among the three groups.
(A) Comparison of blood glucose levels at fasting, 30 and 120 min
(G0, G30 and G120, respectively)
via separate oral glucose tolerance tests among the three groups:
NW, normal weight group; OW, overweight group; OB, obese group. (B)
Comparison of Ln of blood insulin levels at fasting, 30 and 120 min
(LnI0, LnI30 and LnI120,
respectively) via separate oral glucose tolerance tests among the
three groups: NW, normal weight group; OW, overweight group; OB,
obese group. *P<0.05, #P<0.01. |
Fig. 1B shows that
with increased severity of obesity, LnI0 gradually
increased among the three groups (P<0.01). LnI30 was
not significantly different between the overweight and the obese
groups, but was higher than that of the normal weight group
(P<0.05 and P<0.001). LnI120 was similar among all
three groups.
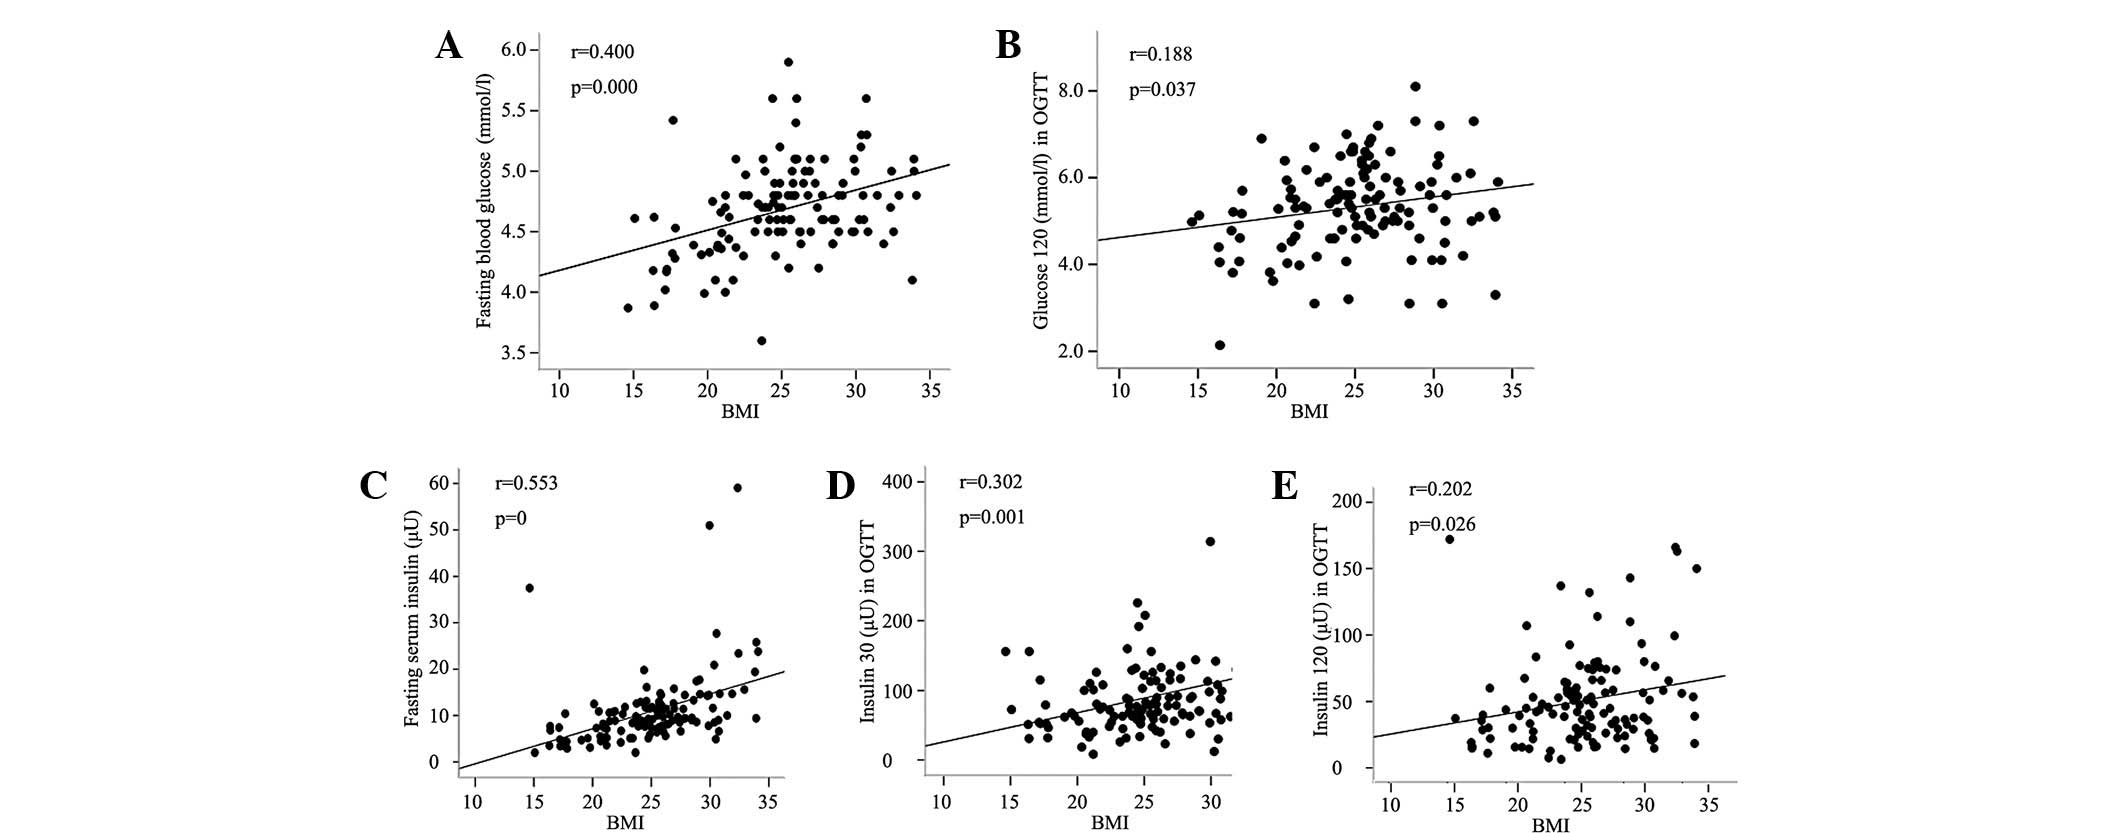
Fig. 2 shows that
the BMI was positively correlated with the G0 and
G120 levels. The BMI was also positively correlated with
the insulin levels at three time points (P<0.05). The percentage
of body and truncal fat was observed to have a similar correlation
with G0, G120 and insulin levels
(r=0.268–0.452, P<0.001–0.003). With regard to the association
between blood glucose and insulin levels, each corresponding time
point (0 to 0, 30 to 30, and 120 to 120 min) exhibited a
significant positive correlation (P<0.01), and the blood glucose
level at 30 min was also correlated with the insulin level at 120
min (r=0.282, P=0.002).
LnIRI in the normal weight group was significantly
lower than that in the overweight and obese groups (P<0.05),
whereas no significant difference was observed between the latter
two groups (Fig. 3A). Fig. 3B shows that among the three groups,
the degree of IR increased with increased severity of obesity
(P<0.01).
 | Figure 3.Comparisons of IRI and HOMA-IR among
the three groups. (A) Comparison of natural logarithm (Ln) of
ΔI30/ΔG30 among the three groups: NW, normal
weight group; OW, overweight group; OB, obese group. (B) Comparison
of Ln of HOMA-IR among the three groups: NW, normal weight group;
OW, overweight group; OB, obese group. *P<0.05,
#P<0.01. IRI, insulin release index; HOMA-IR,
homeostasis model assessment estimate of insulin resistance;
ΔI30/ΔG30=(I30−I0)/(G30−G0);
I0, fasting insulin level; I30, insulin level
at 30 min; G0, fasting glucose level; G30,
glucose level at 30 min. |
Fig. 4 shows that
HOMA-IR and IRI were positively correlated with BMI as well as
truncal and body fat percentages. HOMA-IR was significantly
correlated with the 30 and 120 min insulin levels (r=0.454 and
0.314, respectively; P<0.001), except for the fasting blood
glucose and insulin level. ΔI30/ΔG30 was not
correlated with the blood glucose or insulin levels at 120 min,
with the exception of fasting blood glucose, fasting and 30 min
insulin levels.
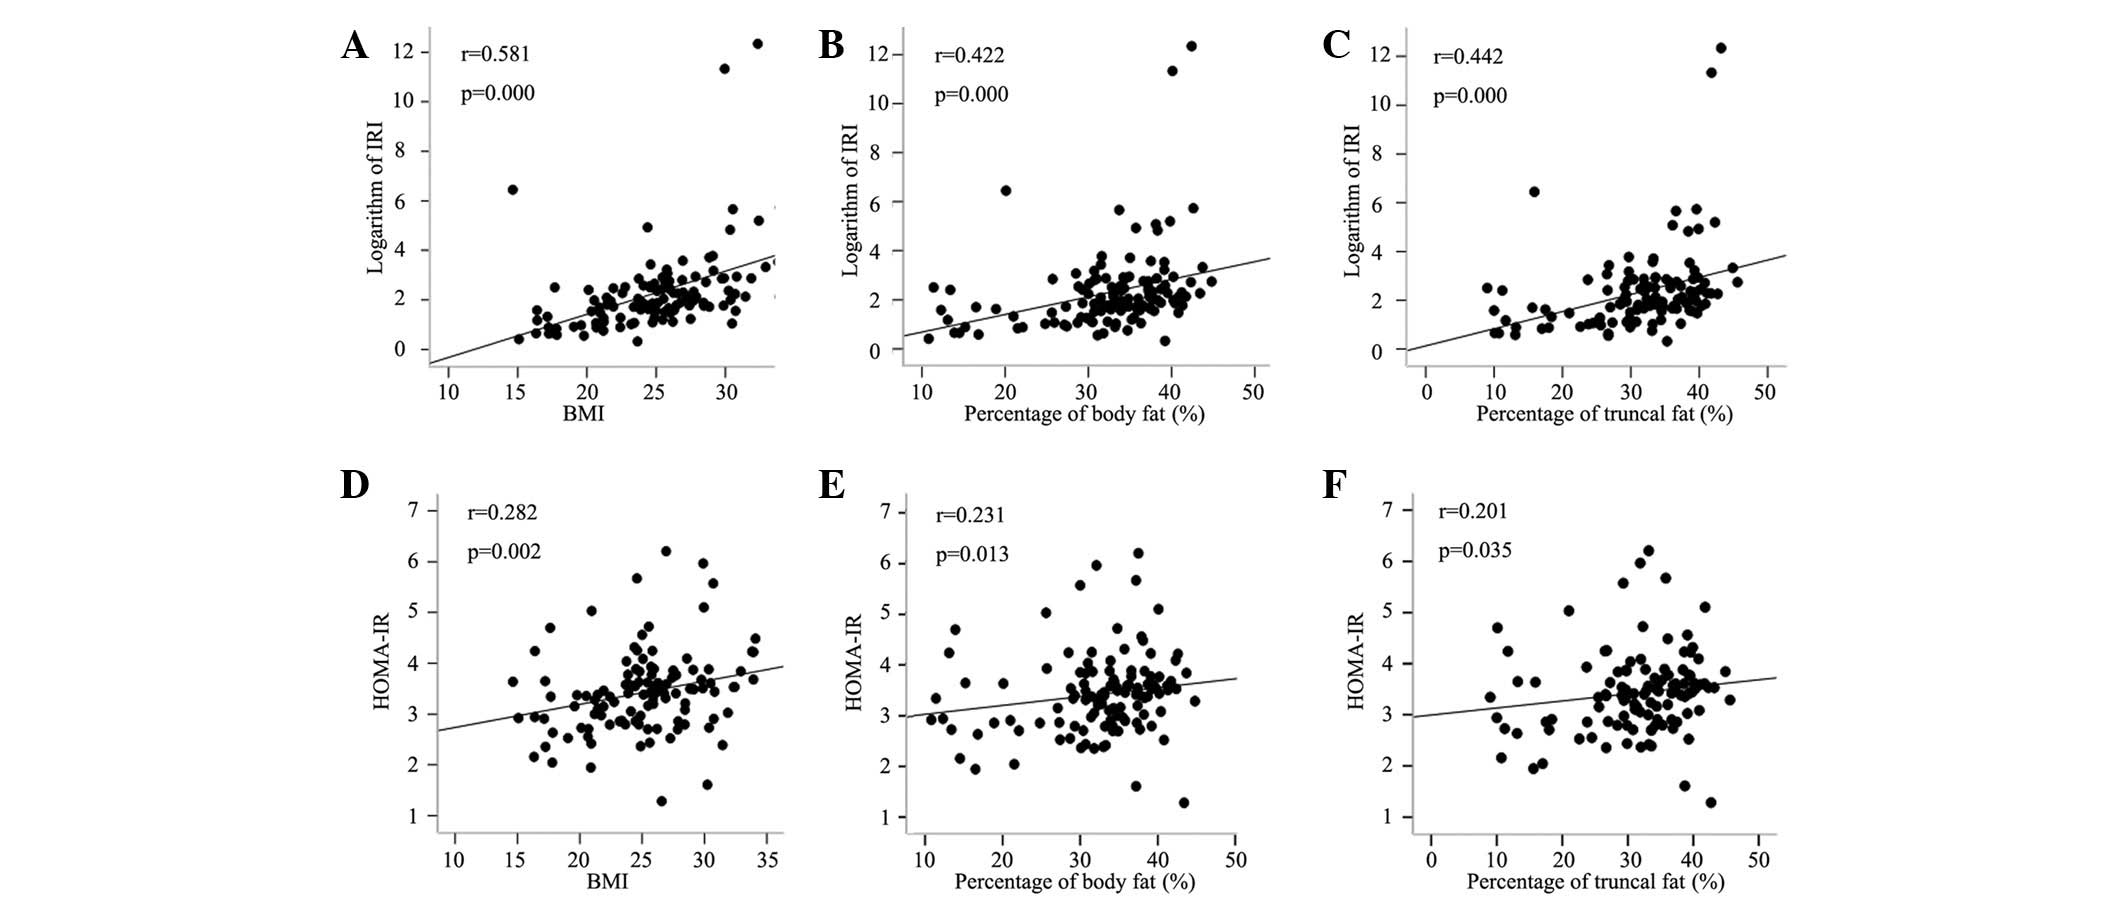 | Figure 4.Correlation analyses between variables
and HOMA-IR, as well ΔI30/ΔG30 (IRI).
Correlation analyses between LnIRI and (A) BMI, (B) percentage of
body fat and (C) percentage of truncal fat. Correlation analyses
between HOMA-IR and (D) BMI, (E) percentage of body fat and (F)
percentage of truncal fat. r, correlation coefficient; HOMA-IR,
I0 (μU/ml) × G0 (mmol/l)/22.5;
ΔI30/ΔG30=(I30−I0)/(G30−G0);
I0, fasting insulin level; I30, insulin level
at 30 min; G0, fasting glucose level; G30,
glucose level at 30 min; IRI, insulin release index; Ln, natural
logarithm; BMI, body mass index. |
Discussion
Insulin is an important hormone that maintains blood
glucose in homeostasis. The secretion of insulin is regulated by
the blood glucose level. With decreased insulin sensitivity caused
by IR, the islet β cells maintain the blood glucose in a stable
state through a compensatory increase in insulin secretion. With
increased dedifferentiation of β cells, early decompensation
involving increased glucose levels occurs (13). The main cause of the early onset of
type 2 diabetes in adolescents has been shown to be the marked loss
of β-cell function (6). However,
numerous studies on adolescents have demonstrated that in the
overweight or obese stage, the β-cell function remains stable or
exhibits higher activity even with impaired glucose metabolism
(14,15). β-cell hyperactivity, with increased
pancreatic β-cell mass that may be associated with increased free
fatty acids, contributes to insulin oversecretion in response to IR
in obese individuals (15).
To the best of our knowledge, the current study is
the first to reveal the characteristics of IR and β-cell function
on glucose regulation in normal weight, overweight and obese Asian
adolescents. Our data suggests that IR exists in over-weight and
obese adolescents, and the degree of IR correlates with the
severity of obesity. Islet β cells are able to maintain a normal
blood glucose level in overweight adolescents through increased
early insulin secretion. However, once the body weight reaches the
obesity stage, further insulin secretion does not occur.
We observed that the glucose levels at fasting and
120 min after glucose challenge were higher in overweight and obese
adolescents, and were positively correlated with BMI as well as
body and truncal fat percentages, although glucose tolerance was
normal in all subjects. These results indicated that the increase
in blood glucose levels, which was associated with the increase in
body weight and adipose tissue, emerged in the euglycemic stage,
even though the weight gain was only maintained in the overweight
stage.
To further understand the increase in glucose at the
early stages of becoming overweight, we analyzed the levels of IR
and early insulin secretion. IR is a main feature of obesity that
reportedly exists persistently throughout the entire disease
process of type 2 diabetes (10).
HOMA-IR has been demonstrated to be a feasible method of estimating
insulin sensitivity in prepubertal and pubertal obese subjects
(16). As expected, insulin
sensitivity was clearly observed in the overweight and obese
groups. We demonstrated that the fasting insulin levels and HOMA-IR
progressively increased with increased obesity. IR has been
demonstrated to be the main prognostic factor for IGT in obese
adolescents (17). The prevalence
of impaired glucose metabolism escalates in overweight adolescents,
even at minimally overweight levels, and is associated with
pronounced deterioration of insulin sensitivity (14). Correlation analysis revealed that
fasting glucose was positively correlated with HOMA-IR but not with
IRI, and the coefficient correlation of fasting glucose with BMI
was also higher than that of the other time point of glucose levels
with BMI. We suggest that the higher fasting glucose levels in
overweight and obese groups occurred in the early normal
glycometabolism stage, and were mainly caused by the reduced
insulin sensitivity associated with increased obesity. This result
was in accordance with the study by O’Malley et al (17), which suggests that in obese youth,
insulin sensitivity declines when the normal fasting plasma glucose
level changes from low to high. In addition, the odds of presenting
with IGT were reported to increase by 4.5% with each 0.06 mmol/l
increase in fasting plasma glucose.
Our data showed that although higher fasting glucose
levels existed in the overweight and obese groups, the 30 min
glucose levels demonstrated no difference among the three groups.
We observed that the IR-associated 30 min insulin secretion
increased in the overweight and obese groups. This observation may
be attributed to a compensatory mechanism under the reduced insulin
sensitivity, which maintained the higher level of early IRI,
thereby ensuring that the 30 min blood glucose levels were
consistent with those of the normal-weight group.
IR progressively increased with increased obesity.
However, the IRI did not further increase in the obese group, and
the 120 min insulin levels in all three groups returned to similar
levels. These results may explain the higher blood glucose levels
at 120 min in the overweight and obese groups compared with those
of the normal group. These findings also suggest that when the
compensatory capacity reached a certain degree, islet β-cell
secretion did not further increase to offset the effect of insulin
sensitivity deterioration and to maintain blood glucose in a stable
state.
Our results were consistent with those of a study on
obese youth with NGT by Yeckel et al (18). Yeckel et al showed that
increased 120 min plasma glucose within the NGT range was
associated with a specific impairment in β-cell responsiveness
distinct from the deterioration of insulin sensitivity.
Notably, the 30 min glucose and 120 min insulin
levels in the overweight and obese groups did not differ from those
in the normal weight group. However, a positive correlation existed
between these two variables. Therefore, with the exception of the
early-phase compensation insulin release, delayed second-phase
secretion may also exist in healthy overweight adolescents in
addition to the impaired glucose regulation in youth (19).
In summary, the fasting and 120 min blood glucose
levels following glucose challenge were higher in overweight and
obese adolescents than in normal weight adolescents, although the
glucose levels were all within the normal range. IR played an
important role in glucose regulation throughout the process from
the overweight to the obese stage and may be a hallmark feature of
obesity in adolescents.
Although islet β-cell secretion increased in the
overweight stage, the degree of compensatory increase in insulin
secretion reached a plateau, even with increased obesity. This
phenomenon may explain the development of impaired glucose
regulation in obese adolescents. Therefore, the prevention of type
2 diabetes in adolescents should start in the early over-weight
stage when the glucose metabolism is normal.
Acknowledgements
This project was funded by the
National Social Science Foundation, the Ministry of Education of
China (BLA060052), the Natural Science Foundation of Beijing
(7092090) and the Health public welfare scientific research project
(201002002). Clinical trial registry: ChiCTR-TNRC-00000227.
References
|
1.
|
Ji CY, Sun JL and Chen TJ: Dynamic
analysis on the prevalence of obesity and overweight school-age
children and adolescents in recent 15 years in China. Zhonghua Liu
Xing Bing Xue Za Zhi. 25:103–108. 2004.(In Chinese).
|
|
2.
|
Chen CM: Overview of obesity in Mainland
China. Obes Rev. 9(Suppl 1): 14–21. 2008. View Article : Google Scholar
|
|
3.
|
Johnson WD, Kroon JJ, Greenway FL,
Bouchard C, Ryan D and Katzmarzyk PT: Prevalence of risk factors
for metabolic syndrome in adolescents: National Health and
Nutrition Examination Survey (NHANES), 2001–2006. Arch Pediatr
Adolesc Med. 163:371–377. 2009.
|
|
4.
|
Mitrakou A, Kelley D, Mokan M, et al: Role
of reduced suppression of glucose production and diminished early
insulin release in impaired glucose tolerance. N Engl J Med.
326:22–29. 1992. View Article : Google Scholar : PubMed/NCBI
|
|
5.
|
Weiss R and Gillis D: Patho-physiology and
dynamics of altered glucose metabolism in obese children and
adolescents. Int J Pediatr Obes. 3(Suppl 1): 15–20. 2008.
View Article : Google Scholar : PubMed/NCBI
|
|
6.
|
Burns N, Finucane FM, Hatunic M, et al:
Early-onset type 2 diabetes in obese white subjects is
characterised by a marked defect in beta cell insulin secretion,
severe insulin resistance and a lack of response to aerobic
exercise training. Diabetologia. 50:1500–1508. 2007. View Article : Google Scholar
|
|
7.
|
Succurro E, Marini MA, Frontoni S, et al:
Insulin secretion in metabolically obese, but normal weight, and in
metabolically healthy but obese individuals. Obesity (Silver
Spring). 16:1881–1886. 2008. View Article : Google Scholar : PubMed/NCBI
|
|
8.
|
Erdmann J, Kallabis B, Oppel U, Sypchenko
O, Wagenpfeil S and Schusdziarra V: Development of hyperinsulinemia
and insulin resistance during the early stage of weight gain. Am J
Physiol Endoc Metab. 294:E568–E575. 2008. View Article : Google Scholar : PubMed/NCBI
|
|
9.
|
Sinha R, Fisch G, Teague B, et al:
Prevalence of impaired glucose tolerance among children and
adolescents with marked obesity. N Engl J Med. 14:802–810. 2002.
View Article : Google Scholar : PubMed/NCBI
|
|
10.
|
Druet C, Tubiana-Rufi N, Chevenne D, Rigal
O, Polak M and Levy-Marchal C: Characterization of insulin
secretion and resistance in type 2 diabetes of adolescents. J Clin
Endocrinol Metab. 91:401–404. 2006.PubMed/NCBI
|
|
11.
|
Group of China Obesity Task Force: Body
mass index reference norm for screening overweight and obesity in
Chinese children and adolescents. Zhonghua Liu Xing Bing Xue Za
Zhi. 25:97–102. 2004.(In Chinese).
|
|
12.
|
Weiss R, Dziura J, Burgert TS, et al:
Obesity and the metabolic syndrome in children and adolescents. N
Engl J Med. 350:2362–2374. 2004. View Article : Google Scholar : PubMed/NCBI
|
|
13.
|
Yeckel CW, Weiss R, Dziura J, et al:
Validation of insulin sensitivity indices from oral glucose
tolerance test parameters in obese children and adolescents. J Clin
Endocrinol Metab. 89:1096–1101. 2004. View Article : Google Scholar : PubMed/NCBI
|
|
14.
|
Velasquez-Mieyer PA, Cowan PA, Neira CP
and Tylavsky F: Assessing the risk of impaired glucose metabolism
in over-weight adolescents in a clinical setting. J Nutr Health
Aging. 12:750S–757S. 2008.PubMed/NCBI
|
|
15.
|
Mercado AB and Castells S: Pancreatic
beta-cell hyperactivity in morbidly obese adolescents. Pediatr
Endocrinol Rev. 3(Suppl 4): 560–563. 2006.PubMed/NCBI
|
|
16.
|
Guzzaloni G, Grugni G, Mazzilli G, Moro D
and Morabito F: Comparison between beta-cell function and insulin
resistance indexes in prepubertal and pubertal obese children.
Metabolism. 51:1011–1016. 2002. View Article : Google Scholar : PubMed/NCBI
|
|
17.
|
O’Malley G, Santoro N, Northrup V, et al:
High normal fasting glucose level in obese youth: a marker for
insulin resistance and beta cell dysregulation. Diabetologia.
53:1199–1209. 2010.PubMed/NCBI
|
|
18.
|
Yeckel CW, Taksali SE, Dziura J, et al:
The normal glucose tolerance continuum in obese youth: evidence for
impairment in beta-cell function independent of insulin resistance.
J Clin Endocrinol Metab. 90:747–754. 2005. View Article : Google Scholar : PubMed/NCBI
|
|
19.
|
Cali’ AMG, Bonadonna RC, Trombetta M,
Weiss R and Caprio S: Metabolic abnormalities underlying the
different prediabetic phenotypes in obese adolescents. J Clin
Endocr Metab. 93:1767–1773. 2008.PubMed/NCBI
|