Introduction
In 1950, Levey and Jennings introduced the
statistical control theory of industrial product manufacturing into
the clinical laboratory and established the initial clinical
examination analysis quality control (QC) (1). This advancement raised the curtain
for medical laboratory internal QC (IQC). Medical laboratory IQC is
an indispensable part of a complete medical laboratory QC system.
According to the IQC managerial system, the corresponding standards
and the operation procedures, laboratory staff select suitable
examination methods and procedures to evaluate consecutively the
stability of the examination work performed in their laboratory.
This procedure is performed to supervise and to control the
precision of the examination work and to increase consistency
within the same batch and between different batches. Moreover, this
procedure will also determine whether the examination result is
sufficiently reliable for issuance in a report, thus enabling a
real-time evaluation of laboratory examination work (1–5).
Several countries have raised the requirements
related to IQC of blood transfusion compatibility testing (6–9).
Blood transfusion compatibility testing includes ABO
classification, RhD blood grouping, irregular antibody screening
and cross matching. These examinations are gradually expected to
become the industry standard. Whole blood samples are used for such
examinations and most IQC products are whole blood samples. Such
samples are, however, more difficult to preserve and are less
stable than serum or plasma IQC products that are required for
traditional examinations. Given the short shelf life of commercial
whole blood IQC products, the requirement of blood transfusion
compatibility testing cannot be met. In this regard, blood
transfusion compatibility testing laboratories have an advantage
because of their access to sample resources. After blood components
are issued, a few samples from these donors may still be used for
the production of IQC products in the laboratory. Based on the
early research on the conditions for preservation of whole blood
IQC products (10), improvements
have been achieved in the methods for the preparation and
preservation of samples for the production of stable IQC products
that can be effectively preserved and used for laboratory IQC. The
preparation methods and the performance evaluation results of IQC
products are given in the subsequent sections.
Materials and methods
Sample preparation
This study was conducted in accordance with the
declaration of Helsinki and with the approval of the Ethics
Committee of PLA General Hospital (permit number 20060828001).
Written informed consent was obtained from all participants. All
blood specimens were extracted from healthy donors, whose alanine
aminotransferase, hepatitis B surface antigen, hepatitis C virus
antibody, human immuno-deficiency virus (HIV) antibody and syphilis
antibody all met the donor health examination requirements. The
whole blood specimens were collected within 10 days prior to the
analysis. No hemolysis or abnormal agglutination was observed
following centrifugation. Both irregular antibody screening and the
direct antiglobulin test showed negative results.
Evaluation of the titer of commercial IgG
anti-D reagent
A concentration of 100 μl IgG anti-D was
multiplied, continuously diluted with saline and evaluated with an
as-prepared 1% O-type RhD-positive erythrocyte suspension.
Micro-column gel anti-globulin cards were then used to determine
the concentration of dilution when the last agglutination strength
of 2+ appeared.
Preparation process of IQC samples
Several B-group RhD-negative samples from healthy
donors were selected for mixing and centrifuged at 1760 × g for 5
min. The supernatant was again subjected to 1760 × g centrifugation
for 5 min to remove precipitates. The fluid was used to prepare a
plasma pool. The remainder of the hematocrit-mixed erythrocytes
were divided into two groups. One group was washed twice with a
preservative (centrifugation condition, 1760 × g; 5 min), while the
other group was washed twice with saline (centrifugation condition,
1760 × g; 5 min). The two groups of erythrocytes were mixed with a
preservative and the prepared plasma pool in a volume proportion of
1:2:3, respectively.
Gentamicin sulphate 0.05 mg/ml was always added to
IQC products. Commercial IgG anti-D reagent was added to IQC
products at the dilution rate of the initially occurring
agglutination of 2+. The two groups of modified whole blood samples
were placed in hard plastic tubes, with 10 products in each group.
The tubes were sealed with a cap and preserved at 4°C, with 1 h
exposure at room temperature daily.
Preparation of reagent erythrocyte for
reverse-typing
Five units of 0.5 ml group A, B and O, RhD-positive
hematid were randomly selected. Once the groups were mixed, the
erythrocytes were washed three times with saline (centrifugation
conditions, 1760 × g; 5 min). ABO forward grouping was then
implemented on the erythrocytes from types A, B and O,
respectively, mixed with anti-A, anti-B and standard serum. When
grouping was confirmed, the erythrocytes were diluted with saline
to obtain a 1% reverse-grouping erythrocyte reagent. The type-O
hematocrit was prepared with low ionic strength solution (LISS) to
obtain a ready-to-use 1% erythrocyte suspension. All reagent
erythrocytes were prepared on the examination day.
Performance index measurement
Measurements were taken at 0, 35, 42 and 49 days
after the preparation of the IQC products, including the items
below.
Erythrocyte B antigen, plasma IgM anti-A
and IgG anti-D reaction activity determination
A WADiana DG-57 (Diagnostic Grifols, Barcelona,
Spain) automatic blood matching system, DG Gel ABO-CDE blood type
card and DG Gel Coombs card (Grifols), as well as the as-prepared
1% A1 and B reverse-grouping reagent erythrocyte and O-group
RhD-negative 1% erythrocyte suspension were used for ABO forward
and reverse grouping. The RhD grouping determination and irregular
antibody screening of all the IQC products (used to examine the
erythrocyte B antigen), plasma IgM anti-A and IgG anti-D reaction
activity, as well as all agglutination intensity data, were
recorded and scored statistically. The scoring criteria (11) had six grades: Grade 5, 12 scores;
Grade 4, 10 scores; Grade 3, 8 scores; Grade 2, 5 scores; Grade 1,
3 scores; and Grade 0 (negative), 0 score.
Determination of Na+,
K+, lactate dehydrogenase (LDH) and lactic acid
A VITROS 5.1 FS Chemistry System and the auxiliary
reagent were used in the evaluation (Johnson & Johnson, New
Brunswick, NJ, USA).
Free hemoglobin determination of the
supernatant fluid of IQC products
The Trinder reaction method was adopted. A
concentration of 0.05 ml plasma was added to the examining tube, HB
working solution was added into the standard tube and 0.05 ml
saline was added into the empty tube. A concentration of 2.5 ml
chromogen buffer was added into each tube and mixed with the
contents. Subsequently, 0.5 ml 0.29 mol/l
H2O2 was added to the mixtures, which were
kept at room temperature for 20 min. The tube samples were examined
using Multiskan-Mk3 ELISA and the color comparison was read at 492
nm. The following is the obtained result: FHb (mg/l) =
(Aexamining-Aempty) /
(Astandard-Aempty) × 100.
Hemolysis may occur in the samples during
preservation. The hemolysis condition was divided into four grades
according to FHb content in the supernatant fluid. The four grades
are as follows: Grade 0, no hemolysis (FHb <500 mg/l); Grade 1,
light hemolysis (500 mg/l ≤FHb <1000 mg/l); Grade 2, medium
hemolysis (1000 mg/l ≤FHb <2000 mg/l); and Grade 3, serious
hemolysis. If the condition of any sample reached or went beyond
Grade 2, the sample was not included in the experiment.
Erythrocyte morphology observation
An S-4500N scanning electron microscope (Hitachi,
Tokyo, Japan) was used to examine the morphology of erythrocytes in
the control sample.
Survey of bacterial pollution in IQC
products
The supernatant from each tube of IQC product was
observed for any colony. Special agglutination and obvious color
changes were observed.
Statistical analysis
The data obtained were presented as the mean ±
standard deviation (SD). A t-test was used to compare the time data
of the two groups. One-way analysis of variance (ANOVA) was used to
compare the data on various preservation periods within the same
sample. P<0.05 was considered to indicate a statistically
significant result.
Results
Reaction activity of the antigen
During preservation, no obvious change (P>0.05)
in agglutination was observed between the hematocrit of the RBC B
antigen and standard anti-B serum in the two groups. In addition,
no apparent difference (P>0.05) was observed between the two
groups within the same preservation period. Fluctuation (P<0.01)
occurred in the hematocrit of the agglutination of the IgM anti-A
antibody and reverse grouping RBC. Likewise, no obvious difference
(P>0.05) was found between the two groups preserved for an equal
length of time. No change (P>0.05) was observed in the
agglutination of IgG anti-D antibody and O-group RhD-positive RBC.
Finally, no obvious difference (P>0.05) was found in the two
groups preserved for the same length of time (Fig. 1).
Changes in biochemical indicators
During the preserving process, the Na+
concentration of the supernatant of both groups continuously
declined as the preservation period lengthened. Both groups were
preserved for 0 days and the saline group was found to have a
higher Na+ concentration than the PS sample (P<0.01).
No difference was observed between the two samples when preserved
for 35 or 42 days. A longer preservation period resulted in higher
supernatant K+ in the samples (P<0.01). Meanwhile, no
obvious difference (P>0.05) was observed between the two groups
preserved for 0, 35 or 42 days. The supernatant LDH concentration
of the two groups increased slightly (P>0.05). The lactic acid
concentration in the supernatant of the two groups increased
(P<0.01). The FHb content in the supernatant of two groups
increased as the preservation period lengthened. When preserved for
49 days, the increment reached its peak (P<0.01). The FHb in
some IQC products reached Grade 2 hemolysis, with no obvious
difference (P>0.05) between the two groups preserved for 0, 35,
42 and 49 days (Table I).
 | Table IParameter changes of prepared controls
in the preservative (PS) and saline groups during preservation
(mean ± SD, n=10). |
Table I
Parameter changes of prepared controls
in the preservative (PS) and saline groups during preservation
(mean ± SD, n=10).
| Parameter | Time (days) | PS group | Saline group |
|---|
| B antigen
(Score) | 0 | 12.0±0 | 12.0±0 |
| 35 | 12.0±0 | 12.0±0 |
| 42 | 12.0±0 | 12.0±0 |
| 49 | 12.0±0 | 12.0±0 |
| IgM anti-A antibody
(Score) | 0 | 11.0±1.1 | 11.3±1.0 |
| 35 | 11.3±1.0 | 11.7±0.8 |
| 42 | 12.0±0c | 11.7±0.8 |
| 49 | 12.0±0c | 12.0±0c |
| IgG anti-D antibody
(Score) | 0 | 8.0±0 | 8.0±0 |
| 35 | 8.0±0 | 8.0±0 |
| 42 | 7.5±1.2 | 7.5±1.2 |
| 49 | 8.0±0 | 8.0±0 |
| Na+
(mmol/l) | 0 | 139.8±1.9 | 141.8±1.0b |
| 35 | 129.8±2.6c | 131.6±4.1c |
| 42 | 124.9±1.9c |
126.8±1.4a,c |
| 49 | - | - |
| K+
(mmol/l) | 0 | 9.2±1.4 | 9.4±1.1 |
| 35 | 12.7±1.3c | 12.5±1.3c |
| 42 | 14.4±1.4c | 14.3±1.7c |
| 49 | - | - |
| LDH (U/l) | 0 | 241.1±40.6 | 247.0±34.6 |
| 35 | 262.9±43.1 | 280.4±55.1 |
| 42 | 278.7±51.6 | 287.5±58.9 |
| 49 | - | - |
| Lactate (mmol/l) | 0 | 8.4±2.2 | 8.5±1.7 |
| 35 | 10.7±1.5c | 11.3±1.0c |
| 42 | 10.9±1.6c | 11.6±1.1c |
| 49 | - | - |
| FHb (mg/l) | 0 | 72.8±7.7 | 69.1±18.3 |
| 35 | 94.5±33.5 | 75.8±32.9 |
| 42 | 159.4±51.9 | 182.2±109.9 |
| 49 | 857.1±301.5c | 595.3±334.9c |
Changes in erythrocyte morphology
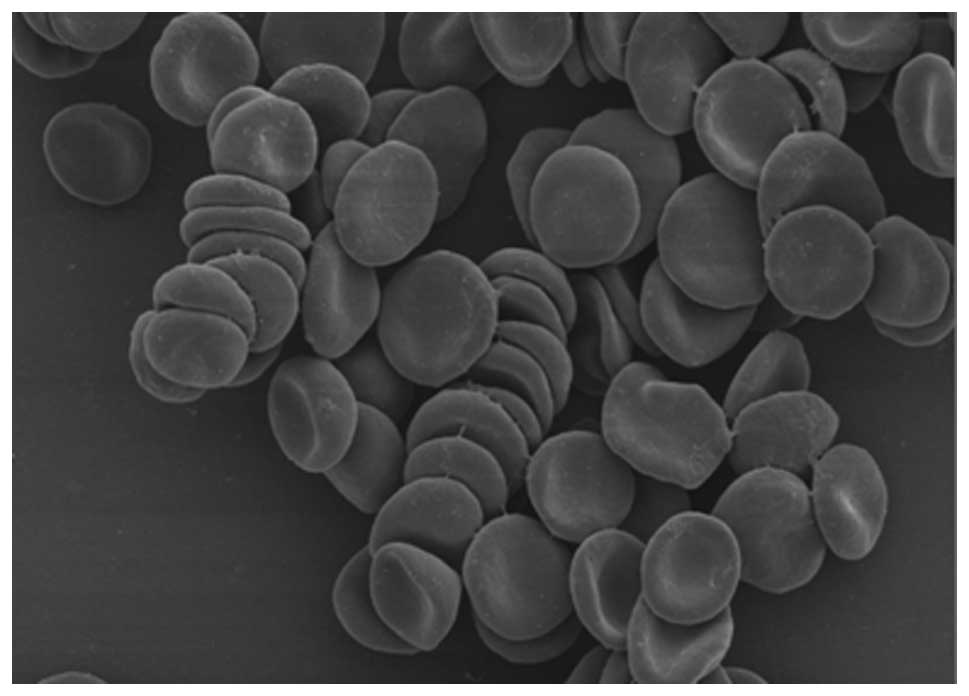
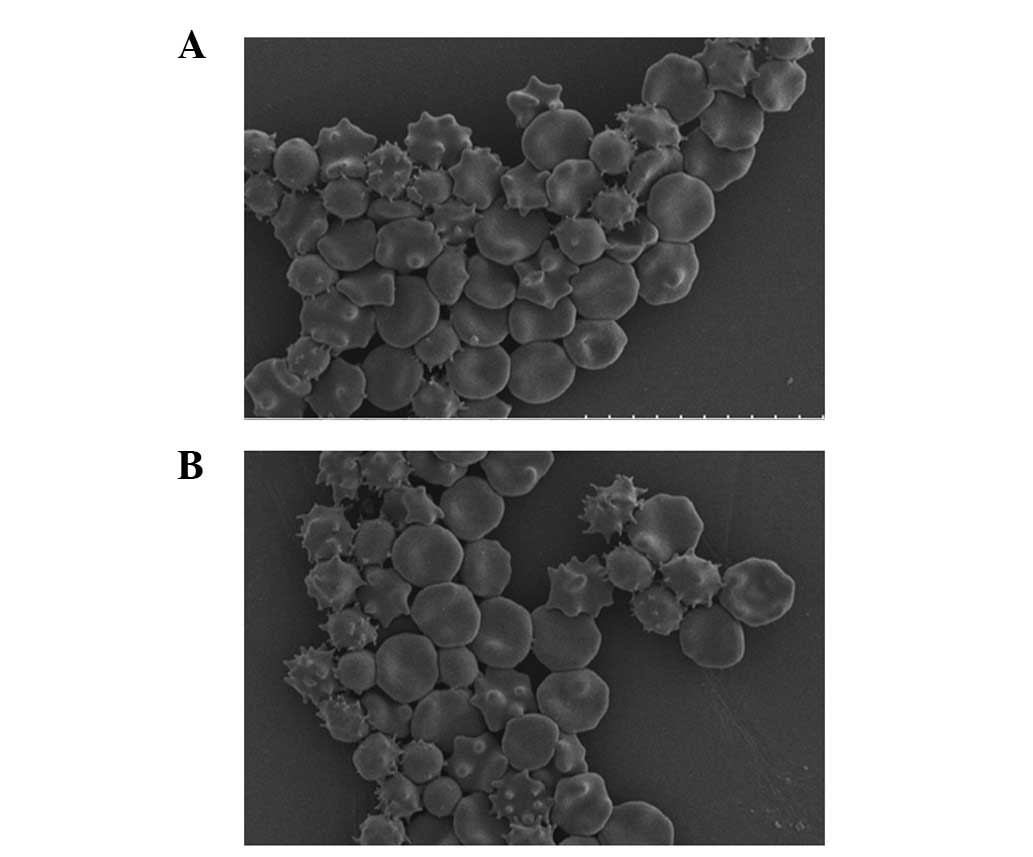
The morphology of most erythrocytes in the mixed
control resembled a double-cave round-shaped disk (Fig. 1). When the control was observed
after 35 days, significant crimple and spinous processes were found
on ∼30–40% of the erythrocytes of the PS and saline groups
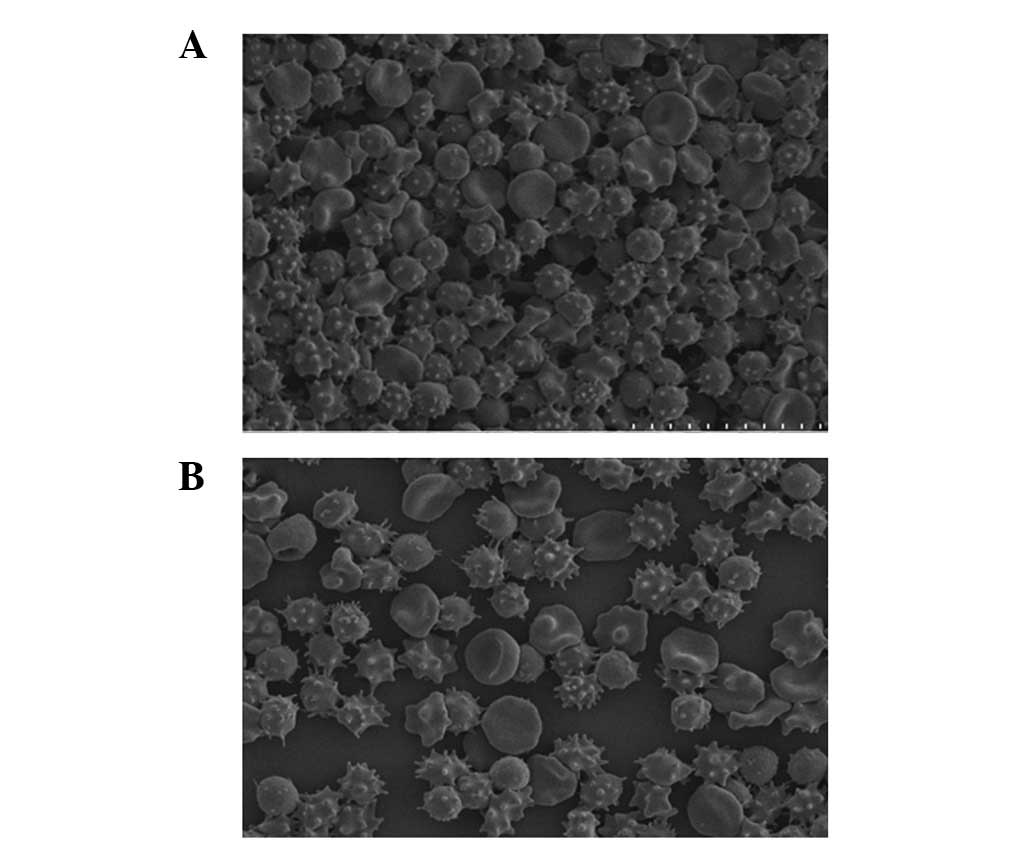
(Fig. 2). Moreover, no obvious
difference was found between the two groups. After 42 days,
significant crimples and spinous processes were found on ∼70–80% of
erythrocytes of the PS and saline groups (Fig. 3). Similarly, no distinct difference
was observed between the two groups.
Bacterial pollution observation on IQC
products
No bacteria colony, obvious RBC agglutination or
color change was observed.
Discussion
IQC is an important measure in ensuring precise
medical laboratory test results and is also a basic requirement
(12) of the Accreditation
Criteria for the Quality and Competence of Medical Laboratories.
The use of approved IQC products is one of the key factors to
having guaranteed QC results. Ideally, IQC products should be kept
in the same preservation condition as the examined samples to
prevent any discrepancy between IQC products and ordinary samples
(5,12). The current blood transfusion
compatibility testing, especially automated testing, examines the
reaction activity of both RBC blood group antigens and serum blood
group antibodies. Thus, the test requires IQC products with quality
that is consistent with or close to that of ordinary samples. Such
products will be suitable for preservation for an extended time and
are likely to have low variability.
The IQC products prepared and preserved based on the
previous research conducted in our laboratory may be kept for more
than 35 days (13). This type of
control, however, was prepared from samples extracted from
different donors, with different batch numbers. These products are
thus only suitable for laboratories requiring small-scale control.
If a laboratory has a large-scale requirement for IQC products, the
frequent replacement of IQC products or the use of products from
different sources and/or of different batches would be unavoidable.
Hence, the vial-to-vial variation will reduce the comparability of
the laboratory test results. Therefore, minimum vial-to-vial
variation must be one of the features of IQC products.
The ideal situation would be to have absolutely no
vial-to-vial variation. When preparing IQC products for blood
transfusion compatibility testing, the operators should make use of
the best actual laboratory conditions and the best existing sample
resources. Operators should also minimize the difference within the
same batch to ensure that the test result will be effective and
comparable. Accordingly, blood samples collected from several
healthy donors within 10 days of the examination were used. The
samples, which can be obtained by almost every blood transfusion
compatibility testing laboratory, have no use after their
corresponding RBCs have been used on patients. The samples were
mixed on the basis of their blood groups and were then washed and
centrifuged to obtain the raw material for IQC products, which are
relatively consistent in both RBC blood group antigen and serum
antibody. Naturally, the raw material is a necessity for IQC
product preparation.
The stability of the analytic indicators is the most
important feature of IQC products and equally important is the
elimination of interference factors (14–16).
The research showed that washing the raw material of IQC products
is necessary to remove protein agglutination and some aged RBC
segments from the RBC-reducing non-specific interference during
control. Conversely, the washing process may eliminate the lactic
acid accumulated on the RBC for better preservation. Changes in
Na+, K+, LDH, lactic acid and FHb in the
supernatant of the control are important indices that reveal RBC
damage. Traditionally, saline-washed RBC is believed to be
preserved for only 24 h since hemolysis occurs during prolonged
preservation. In the present research, saline and isotonic MAP RBC
preservative were used to wash the RBC material. The K+,
LDH and lactic acid contents of both groups increased as the
preservation time increased (P<0.01 or P>0.05, Table I). However, no obvious difference
was observed between the two groups when preserved for 35 and 42
days (P>0.05, Table I).
Na+ content decreased during the same
extended period (P<0.01, Table
I), which can be attributed to the RBC preservation injury that
induced K+ to flow out and be exchanged with
Na+. When preserved for 0 and 42 days, the
Na+ content in saline samples was higher than that in
the PS group (P<0.01, Table I).
This finding may be attributed to the inherent difference in
Na+ content of the samples from the two groups.
The FHb content in both groups increased with
prolonged preservation time. The peak occurred at 49 days
(P<0.01, Table I) and no
obvious statistical difference was found between the two groups
(P>0.05, Table I). Moreover, no
obvious change in the agglutination of RBC B antigen and anti-B
serum, or in the IgG anti-D antibody and group O RhD-positive RBC
(P>0.05, Table I) was observed
between the two groups after being preserved for an equal period of
time (P>0.05, Table I).
Although fluctuations occurred in the agglutination of the IgM
anti-A antibody and reverse-grouping A cell (P<0.01, Table I), the change of agglutination
strength was no more than 1+, which may be due to systematic
errors, thus satisfying the basic requirements of IQC.
The result of scanning electron microscopy showed
that the number of crimples was increasing and that spinous
processes occurred as the preservation prolonged, but no obvious
difference was found between the two groups preserved for the same
time. Thus, we believe that no obvious difference arises when using
saline and isotonic RBC preservative to wash the RBC material.
In the late preservation time of IQC products (∼42
days), injury occurred on RBC to some extent, including an increase
in K+, LDH, lactic acid and FHb, and a change in RBC
shape. However, no obvious impact on the main performance indices
of IQC products was observed ,and the reactive behavior of the RBC
blood group antigen and serum antibody was maintained.
When IQC products were preserved for 49 days, the
remaining supernatant in every sample was insufficient. Thus, only
one biochemical index, FHb, was tested. The test showed that
certain IQC products reached Grade 2 hemolysis. The above findings
prove that whole blood IQC products retained good stability within
42 days.
The addition of an RBC preservative into whole blood
or RBC may effectively extend the shelf life of blood products
(17–19). To preserve whole blood IQC products
that contain RBC effectively, the substance that may provide RBC
metabolic energy, which acts against hemolysis, should be added.
IQC products are usually kept in an open environment at 4°C.
Bacteriostasis should also be considered. The
initial research showed that whole blood IQC products with added
glucose, adenine and mannite were preserved at 4°C for over 35
days. In this research, the washing hematocrit RBC and RBC
preservative were mixed with plasma at 1:2:3. The mixed liquid was
then placed into hard plastic tubes, each of which contained 6 ml
control. Then, 0.05 mg/ml gentamicin sulphate was added.
The difference between IQC products prepared using
the proposed method and the ordinary test samples was evident in
the supernatant (RBC preservative and plasma). The supernatant of
the former was more significant than that of the latter. The amount
of plasma used for IQC products is significantly greater than that
used for hematocrit RBC. This feature of IQC products enables the
preservation and increases the utilization efficiency of RBC.
Although the addition of preservative into IQC products may dilute
the antibody to a certain extent, the effect on the reactive
intensity remains within the acceptable range. Moreover, the weakly
positive antibody control material caused by dilution contributed
to the monitoring of the sensitivity of detection system. Clean
containers and a bacteria-free solution were used in the
preparation and some antibiotics were added to prevent bacteria
from growing. The IQC products in the two groups could be
effectively preserved for more than 42 days.
In summary, IQC products prepared using the proposed
technique have the advantages of long preservation time, low
vial-to-vial variation and stable antigen and antibody reaction
activity, thus satisfying the requirements of blood transfusion
compatibility testing. Such IQC products are suitable for
application in the field of blood transfusion compatibility
testing.
Acknowledgements
The authors acknowledge Li Yuchuan,
the Fifth Institution Pathology Laboratory of Academy of Military
Medical Science of the Chinese PLA, for his help and support with
respect to scanning electron microscopy of red cells.
References
|
1.
|
Levey S and Jennings ER: The use of
control charts in the clinical laboratory. Am J Clin Pathol.
20:1059–1066. 1950.PubMed/NCBI
|
|
2.
|
Lewis SM: Quality assurance programmes in
the United Kingdom. Ann Ist Super Sanita. 31:53–59. 1995.
|
|
3.
|
World Health Organization: Strategies for
Safe Blood Transfusion. World Health Organization; Geneva: pp.
511998
|
|
4.
|
Vidal JL, Vega AB, López FJ and Frenich
AG: Application of internal quality control to the analysis of
quaternary ammonium compounds in surface and groundwater from
Andalusia (Spain) by liquid chromatography with mass spectrometry.
J Chromatogr A. 1050:179–184. 2004. View Article : Google Scholar
|
|
5.
|
Lock RJ: My approach to internal quality
control in a clinical immunology laboratory. J Clin Pathol.
59:681–684. 2006. View Article : Google Scholar : PubMed/NCBI
|
|
6.
|
Chapman JF, Elliott C, Knowles SM, Milkins
CE and Poole GD: Guidelines for compatibility procedures in blood
transfusion laboratories. Transfus Med. 14:59–73. 2004. View Article : Google Scholar : PubMed/NCBI
|
|
7.
|
American Association of Blood Banks:
Technical Manual. 16th edition. Maryland, USA: pp. 15–39. 2008
|
|
8.
|
Scientific Subcommittee of the Australian
and New Zealand Society of Blood Transfusion Inc: Guidelines for
Pretransfusion Testing. 4th edition. Sydney, Australia: pp. 19–23.
2002
|
|
9.
|
Chinese Ministry of Health: Accreditation
standards of level 3 comprehensive hospital (2011 version).
Beijing, China: pp. 1252012
|
|
10.
|
Yu Y, Ma CY, Feng Q, et al: Inside quality
control for whole blood preservation performed at blood transfusion
compatibility testing laboratory. Zhongguo Shi Yan Xue Ye Xue Za
Zhi. 18:780–784. 2010.(In Chinese).
|
|
11.
|
National Blood Service: Guidelines for the
Blood Transfusion Services in the United Kingdom (7th edition).
148–175. 2005.
|
|
12.
|
International Organization for
Standardization (ISO): Medical laboratories - particular
requirements for quality and competence. Geneva, Switzerland: ISO
Standard 15189. 5.6. 2007
|
|
13.
|
Thompson M and Wood R: Harmonised
guidelines for IQC in analytical chemistry laboratories. Pure Appl
Chem. 67:649–666. 1995. View Article : Google Scholar
|
|
14.
|
Petersen PH, Ricós C, Stöckl D, et al:
Proposed guidelines for the internal quality control of analytical
results in the medical laboratory. Eur J Clin Chem Clin Biochem.
34:983–999. 1996.PubMed/NCBI
|
|
15.
|
Thompson M: Internal quality control in
routine analysis. Royal Soc Chem. 2010.
|
|
16.
|
Gardner MJ: The quotation overleaf is from
quality control techniques for chemical analysis: some current
shortcomings and possible future developments. Accred Qual Assur.
12:653–657. 2007. View Article : Google Scholar
|
|
17.
|
D’Alessandro A, Liumbruno G, Grazzini G
and Zolla L: Red blood cell storage: the story so far. Blood
Transfus. 8:82–88. 2010.PubMed/NCBI
|
|
18.
|
Mollison PL: The introduction of citrate
as an anticoagulant and of glucose as a red cell preservative. Br J
Haematol. 108:13–18. 2000. View Article : Google Scholar : PubMed/NCBI
|
|
19.
|
Hess JR and Greenwalt TJ: Storage of red
blood cells: new approaches. Transfus Med Rev. 16:283–295. 2002.
View Article : Google Scholar : PubMed/NCBI
|