Introduction
Chronic obstructive pulmonary disease (COPD) has a
high incidence worldwide and a high mortality rate. According to
data from the World Health Organization (WHO), it is predicted that
COPD, which was the sixth most common cause of mortality in 1990,
is likely to the third most common cause by 2020 (1,2).
Malnutrition is frequently reported in COPD patients
and is an indicator of poor prognosis (3–8).
Being underweight is associated with a high mortality rate in
patients with COPD (7), which may
be explained by the weakening of the respiratory and skeletal
muscles (9).
Specific hypothalamic neuropeptides, including
orexin, are generally affected by nutritional status and dietary
food intake (10,11). Ghrelin is also an important
polypeptide that stimulates food intake (12,13).
Orexins play an important role in various physiological events,
including the stress response and the sleep/wake cycle (14). In a previous study, orexin-A levels
in patients with COPD were reported to be lower than those in the
control group. Furthermore, the levels of orexin-A were found to be
lower in underweight COPD patients when compared with those in
normal weight patients with COPD (8). Ghrelin stimulates food intake,
increases adiposity by decreasing lipid oxidation and maintains the
energy balance (12,13,15).
Itoh et al (16) indicated
that plasma ghrelin levels were higher in underweight patients with
COPD than in normal weight patients with COPD.
There are a limited number of studies that evaluate
the association between plasma orexin-A and ghrelin levels with
body composition and dietary intake in patients with COPD. To the
best of our knowledge, there are no similar studies concerning
patients with COPD in Turkey. For this reason, the present study
aimed to investigate a possible correlation between plasma orexin-A
and ghrelin levels with body composition and food consumption.
Materials and methods
Subjects
A total of 40 patients with stable phase COPD (44–80
years old) who were admitted to the Department of Pulmonary
Diseases, Faculty of Medicine, Gazi University (Ankara, Turkey)
between July 2012 and July 2013 volunteered for this study. The
study was conducted in accordance with the regulations of Gazi
University Clinical Research Ethics Committee and each participant
signed a voluntary participation form. Due to financial problems,
we did not use control patients in this research.
Experimental design
Following a fasting period of 8–12 h, 7-ml blood
samples were extracted from the patients and into tubes containing
EDTA (Phoenix Pharmaceuticals, Inc., Belmont, CA, USA). A protease
inhibitor, aprotinin, was added to the tubes (100 μl/ml blood), as
recommended by the manufacturer of the ELISA kits (Phoenix
Pharmaceuticals, Inc.). The samples were centrifuged at 1,600 × g
at 4°C for 15 min. The plasma samples were separated and maintained
at −32°C until required for analysis (17,18).
The samples were analysed in duplicates.
Orexin-A and ghrelin levels in the plasma samples
were analysed via an ELISA method, an immunoassay that determines
antigen-antibody interactions, using ELISA kits purchased from
Phoenix Pharmaceuticals, Inc. (17,18).
According to the manufacturer’s instructions, the minimum detection
limits of orexin-A and ghrelin were 0.2 and 0.13 ng/ml,
respectively.
Data were collected from the patients during a
face-to-face interview with qualified dieticians. In the interview,
a questionnaire was used to determine the general features (age,
gender, educational status and occupation), smoking habits, alcohol
use and diet habits of the patients. Food consumption was measured
with a 24-h dietary recall. During the interview, food models and
photos of common Turkish foods of various portion sizes, as well as
household cups and measures, were used to assess the type and
amount of food and beverage consumed during the previous day
(19). The average daily energy
and macro- and micronutrient intakes were calculated using the
computer software Nutrition Information Systems (BeBiS, Version
7.0, Pasific Company, Stuttgart, Germany). These values were
compared with the recommended daily allowance values to determine
the energy and nutrient requirement meeting status and the
requirement meeting percentages were calculated (20). The dietary guidelines for Turkey
were used for the assessment of specific nutrients (21).
All anthropometric measurements were obtained by
trained dieticians, as described in a previous study (11). Body composition parameters,
including weight, total body water, fat mass, lean mass and fat
percentages of the patients, were measured using an InBody720
Bioelectrical Impedance Analyzer (Biospace, Seoul, Korea). The body
mass index (BMI) was calculated as weight/(height)2 and
BMI classifications were determined according to the WHO standards
(22).
Statistical analysis
Data analysis was performed using SPSS software,
version 16.0 (SPSS, Inc., Chicago, IL, USA). As the data did not
exhibit normal distribution, the median and interquartile range
values were used to conduct statistical analyses of the daily
dietary energy and nutrient intakes and body compositions, however,
the mean and SD values are also presented. The Mann-Whitney U test
was used for statistical comparison of the genders. Spearman’s
correlation test was used to analyse correlations between the
parameters, including the correlation between energy and nutrient
intake and body composition with orexin-A and ghrelin levels;
regression analysis was performed for the associated parameters.
The statistical significance level was selected as 95% and
P<0.05 was considered to indicate a statistically significant
difference (23).
Results
Patient characteristics
In total, 40 adult patients with COPD, 9 female
(22.5%) and 31 male (77.5%) with an average age of 65.0±14.50
years, volunteered for the study. The general features and plasma
orexin-A and ghrelin levels of the patients are shown in Table I. Plasma orexin-A levels in male
and female patients were found to be 1.3±0.37 and 1.4±0.13 ng/ml,
respectively, whereas the average plasma ghrelin levels were
25.9±7.31 and 27.3±8.54 ng/ml, respectively. No statistically
significant differences were observed between the two groups with
regard to age, time course of COPD diagnosis and plasma orexin-A
and ghrelin levels (P>0.05).
 | Table IGeneral features and the plasma
orexin-A and ghrelin levels of the patients. |
Table I
General features and the plasma
orexin-A and ghrelin levels of the patients.
| Female (n=9) | Male (n=31) | Total (n=40) | |
|---|
|
|
|
| |
|---|
| Feature | Mean ± SD | Median/IQR | Mean ± SD | Median/IQR | Mean ± SD | Median/IQR | P-value |
|---|
| Age (years) | 61.3±8.54 | 62.0±11.50 | 65.5±8.82 | 65.0±14.00 | 64.6±8.83 | 65.0±14.50 | 0.237 |
| Time course of COPD
diagnosis (months) | 42.8±39.92 | 60.0±69.00 | 55.0±49.99 | 54.0±92.00 | 52.3±47.70 | 57.0±79.75 | 0.436 |
| Orexin-A
(ng/ml) | 1.4±0.13 | 1.38±0.20 | 1.3±0.37 | 1.25±0.40 | 1.3±0.34 | 1.32±0.37 | 0.308 |
| Ghrelin
(ng/ml) | 27.3±8.54 | 26.2±10.90 | 25.9±7.31 | 27.9±13.90 | 26.2±7.51 | 27.0±12.96 | 0.771 |
Antropometric measurements
Anthropometric measurements of the patients are
presented in Table II. When
differences between genders were investigated, significant
differences (P<0.05) were identified for the basal metabolic
rate (P=0.004), lean body mass (P=0.004), total body water
(P=0.004), skeletal-muscle weights (P=0.009)and intracellular
(P=0.004) and extracellular (P=0.000) fluid amounts between the two
groups.
| Table IIBody composition of the patients. |
Table II
Body composition of the patients.
| Female (n=9) | Male (n=31) | Total (n=40) | |
|---|
|
|
|
| |
|---|
| Body feature | Mean ± SD | Median/IQR | Mean ± SD | Median/IQR | Mean ± SD | Median/IQR | P-value |
|---|
| Body weight
(kg) | 72.2±19.45 | 68.1±28.00 | 78.7±17.02 | 76.4±19.60 | 77.2±17.55 | 74.5±21.60 | 0.271 |
| Height (cm) | 160.6±4.88 | 160.0±9.00 | 168.7±7.76 | 167.0±11.00 | 166.9±7.94 | 166.0±11.75 | 0.006a |
| BMI
(kg/m2) | 28.3±8.98 | 26.3±12.40 | 27.9±4.52 | 26.6±6.40 | 27.9±5.69 | 26.6±6.77 | 0.674 |
| BMR (kcal) | 1370.7±354.66 | 1295.0±154.30 | 1526.6±170.50 | 1545.0±218.00 | 1491.5±229.2 | 1488.0±272.00 | 0.004a |
| Waist/hip
ratio | 0.9±0.07 | 0.9±0.10 | 0.9±0.05 | 0.9±0.07 | 0.9±0.05 | 0.9±0.07 | 0.435 |
| Fat mass (kg) | 25.9±10.73 | 27.6±15.60 | 27.4±11.89 | 25.6±13.60 | 27.1±11.53 | 26.1±13.60 | 0.796 |
| Fat (%) | 35.6±10.57 | 37.6±20.00 | 31.9±6.33 | 31.1±10.10 | 32.8±7.49 | 31.4±10.90 | 0.271 |
| Lean body mass
(kg) | 46.3±16.43 | 42.8±7.10 | 53.6±7.89 | 54.4±10.10 | 51.9±10.61 | 51.8±12.60 | 0.004a |
| Total body water
(kg) | 33.5±10.55 | 31.4±5.20 | 39.6±5.81 | 40.2±7.30 | 38.2±7.44 | 38.4±9.10 | 0.004a |
| Skeletal-muscle
weight (kg) | 26.8±13.37 | 22.9±4.60 | 29.5±4.66 | 30.1±5.40 | 28.9±7.16 | 28.8±7.40 | 0.009a |
| Intracellular fluid
amount (l) | 21.5±9.74 | 19.1±3.80 | 24.2±3.58 | 24.6±4.10 | 23.6±5.53 | 23.4±6.02 | 0.004a |
| Extracellular fluid
amount (l) | 12.0±1.10 | 12.3±1.90 | 15.4±2.25 | 15.6±2.80 | 14.6±2.49 | 14.7±3.78 | 0.000a |
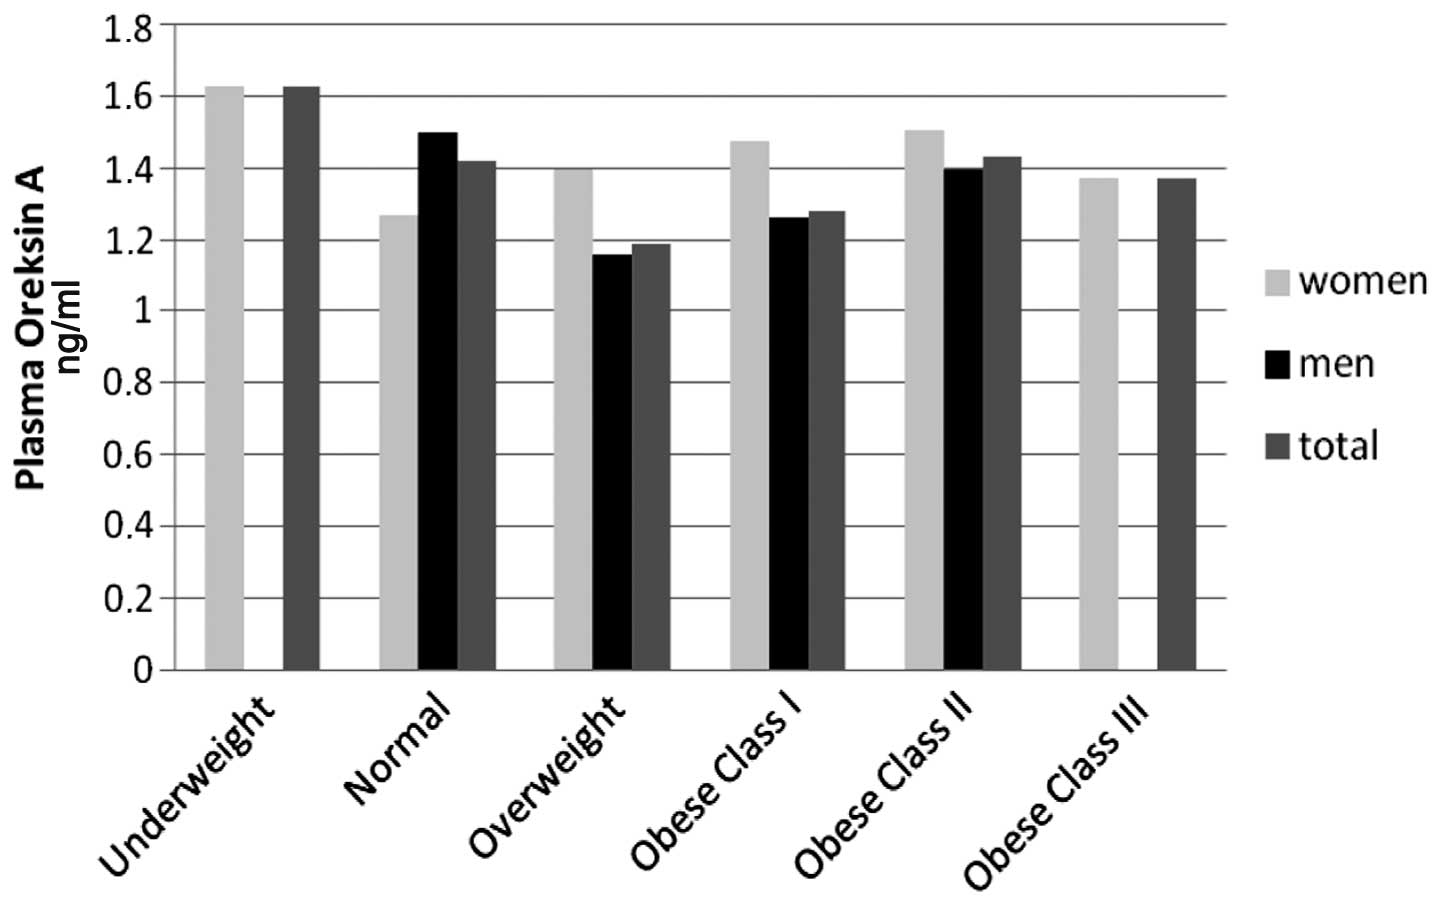
Orexin-A and ghrelin levels with BMI
The highest plasma orexin-A levels were identified
in underweight female patients (BMI<18.5 kg/m2) and
the lowest levels were identified in female patients with a normal
BMI. However, as the number of underweight female patients was low,
they were excluded from the statistical evaluation. Plasma orexin-A
levels were only higher than those in female patients in male
patients with a normal BMI (18.5–24.9 kg/m2). When the
patients were classified according to their BMIs, the plasma
orexin-A levels of the BMI groups were observed to be similar
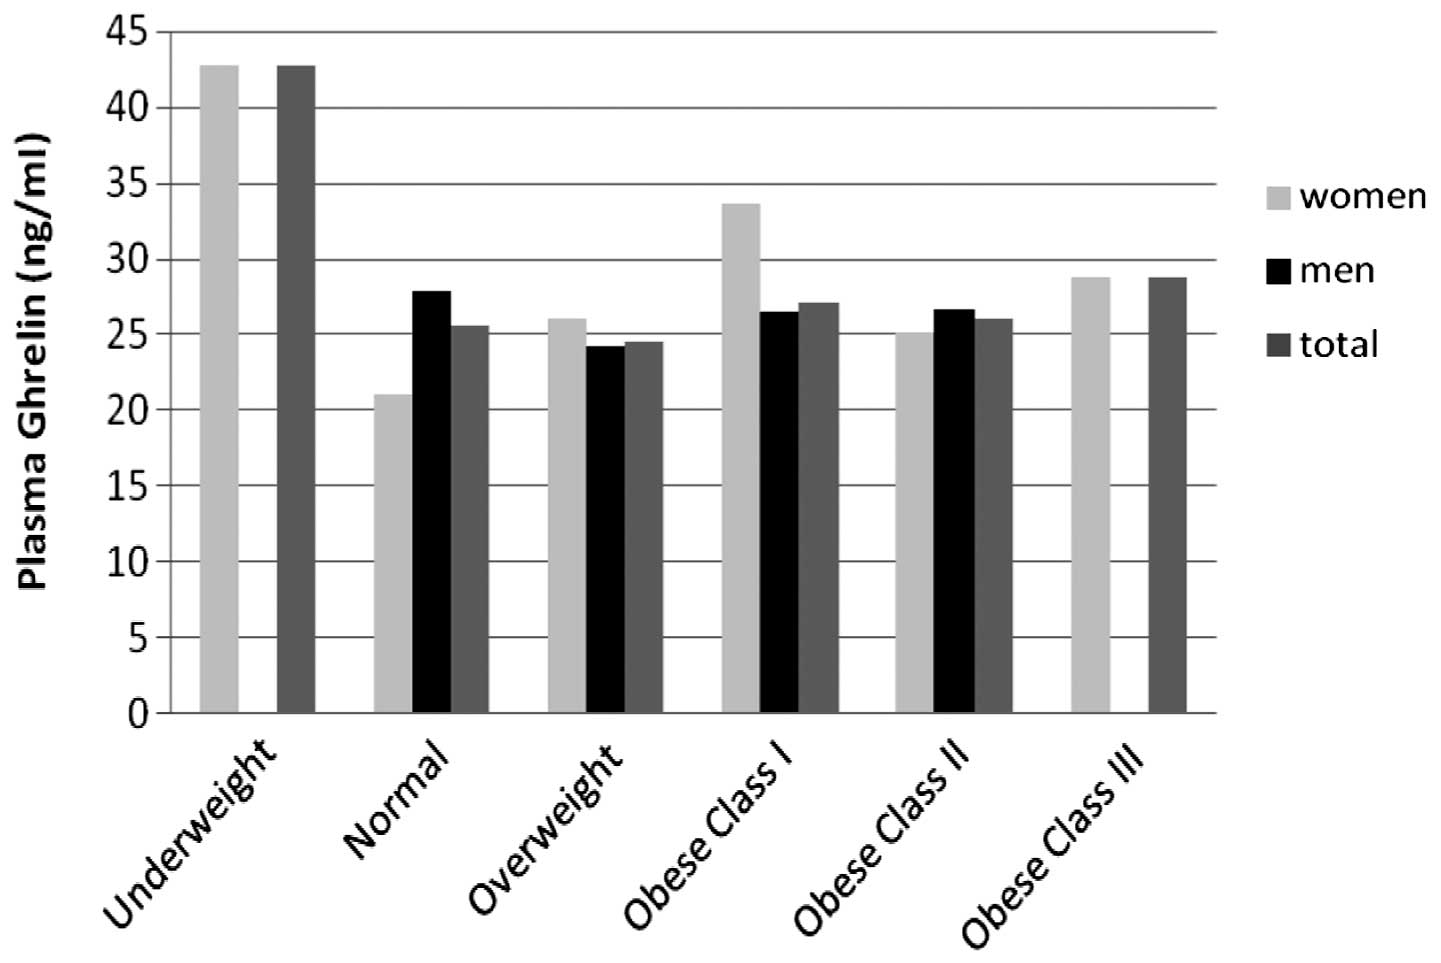
(P>0.05; Fig. 1). Similarly, no
significant difference in ghrelin levels was identified according
to the patient BMI classification (P>0.05; Fig. 2).
Dietary intake and requirements
Daily average dietary energy and nutrient intakes
and requirement meeting percentages are shown in Table III. Female patients met 89.6% of
their daily energy requirement, whereas male patients met 79.0% of
their energy requirement. While the rate of meeting the protein
requirement was lower in female patients, no statistically
significant difference was identified between the genders. The
dietary saturated fatty acid intake was observed to be
significantly higher in female patients than in male patients
(P=0.05). The daily average dietary fibre intake was ~21.4±11.94 g.
No significant differences were identified between the groups with
regard to vitamins A, E, C and B complex intakes. The results
indicated that female patients met only 59.8% of their folic acid
requirement, while male patients met only 42.6% of their calcium
requirement. The calcium intake of female patients was found to be
significantly higher than the male patients (P=0.03).
| Table IIIDaily dietary energy, nutrient
intakes and requirement meeting percentages. |
Table III
Daily dietary energy, nutrient
intakes and requirement meeting percentages.
| Energy and
Nutrient | Female (n=9) | Male (n=31) | Total (n=40) |
|---|
|
|
|
|---|
| Mean ± SD | Median/IQR | RDA % | Mean ± SD | Median/IQR | RDA % | Mean ± SD | Median/IQR | RDA % | P-value |
|---|
| Energy (kcal) | 1696.9±469.78 | 1559.8±798.00 | 89.6 | 1716.9±735.89 | 1606.5±652.00 | 79 | 1712.5±679.64 | 1593.1±639.00 | 81.3 | 0.686 |
| Total protein
(g) | 59.1±20.43 | 53.1±34.00 | 57.8 | 60.9±26.92 | 55.9±37.00 | 62.9 | 60.5±25.37 | 55.6±36.00 | 61.7 | 0.859 |
| Total lipidb (g) | 83.1±30.68 | 67.8±50.00 | 131–157 | 69.2±33.11 | 60.1±39.00 | 97–116 | 72.4±32.72 | 65.0±36.00 | 104–125 | 0.159 |
| SFAb (g) | 31.2±12.94 | 28.9±20.00 | 185–212 | 22.2±10.35 | 21.2±17.00 | 115–132 | 24.3±11.45 | 21.9±16.00 | 131–150 | 0.05a |
| MUFAb (g) | 30.9±15.34 | 22.4±28.00 | 97–121 | 25.3±12.63 | 22.5±20.00 | 70–87 | 26.5±13.29 | 22.5±20.00 | 76–95 | 0.308 |
| PUFAb (g) | 15.8±7.53 | 13.5±15.00 | 94–107 | 16.8±13.79 | 14.4±9.00 | 87–99 | 16.6±12.58 | 14.0±10.00 | 88–101 | 0.974 |
| Ω3 (g) | 1.7±1.01 | 1.74±1.00 | 153.0 | 1.32±0.99 | 1.06±1.00 | 82.0 | 1.4±0.99 | 1.1±1.00 | 97.9 | 0.206 |
| Ω6 (g) | 13.7±6.72 | 11.7±12.00 | 124.7 | 15.5±13.24 | 13.3±9.00 | 110.6 | 15.1±12.02 | 12.9±9.00 | 113.8 | 0.734 |
| Cholesterolb (mg) | 204.4±89.39 | 188.4±170.00 | <300 | 259.0±373.47 | 148.2±210.00 | <300 | 246.7±330.86 | 170.4±199.00 | <300 | 0.466 |
| Fibre (g) | 20.5±7.38 | 20.6±15.00 | 95.2 | 21.6±13.06 | 19.1±12.00 | 71.7 | 21.4±11.94 | 19.8±13.00 | 77.0 | 0.783 |
| Soluble fibre
(g) | 6.3±2.13 | 5.9±4.00 | | 7.5±4.89 | 6.4±5.00 | | 7.2±4.42 | 6.36±5.00 | | 0.961 |
| Insoluble fibre
(g) | 14.0±5.37 | 14.6±11.00 | | 14.0±8.42 | 13.9±9.00 | | 14.0±7.77 | 6.4±9.00 | | 0.571 |
| Vitamin A (μg) | 1172.9±768.70 | 819.6±1487.00 | 167.6 | 1515.4±3858.05 | 645.4±1020.00 | 168.4 | 1438.4±3404.68 | 700.8±1041.00 | 168.2 | 0.190 |
| Vitamin E (mg) | 13.86±6.95 | 11.0±11.00 | 87.6 | 16.8±14.79 | 14.0±10.00 | 111.8 | 16.9±13.88 | 14.0±10.00 | 106.4 | 0.476 |
| Vitamin B1
(mg) | 0.8±0.29 | 0.6±0.60 | 69.5 | 0.9±0.57 | 0.8±0.49 | 75.1 | 0.8±0.52 | 0.8±0.51 | 73.9 | 0.686 |
| Vitamin B2
(mg) | 1.3±0.62 | 1.1±1.30 | 118.5 | 1.2±0.84 | 1.0±0.74 | 91.6 | 1.2±0.79 | 1.0±0.74 | 97.7 | 0.446 |
| Vitamin B6
(mg) | 1.4±0.62 | 1.2±0.88 | 93.3 | 1.3±0.69 | 1.2±0.63 | 78.7 | 1.3±0.67 | 1.2±0.70 | 81.9 | 0.859 |
| Vitamin B12
(mg) | 3.8±2.73 | 2.6±4.80 | 157.1 | 5.6±14.33 | 2.8±3.08 | 234.7 | 5.2±12.65 | 2.8±3.28 | 195.4 | 0.639 |
| Niacin (mg) | 13.3±7.98 | 12.5±14.00 | 94.8 | 11.5±7.23 | 10.4±11.00 | 72.0 | 11.9±7.33 | 10.4±11.00 | 91.2 | 0.560 |
| Folic acid
(μg) | 261.9±89.61 | 253.9±137.00 | 59.8 | 314.1±151.2 | 265.6±144.00 | 80.2 | 302.3±140.43 | 265.5±134.00 | 83.5 | 0.339 |
| Vitamin C (mg) | 164.9±130.74 | 107.8±237.00 | 219.9 | 144.6±184.72 | 83.1±148.00 | 160.6 | 149.1±172.71 | 85.9±191.00 | 173.9 | 0.447 |
| Calcium (mg) | 798.3±366.52 | 687.5±675.00 | 68.5 | 507.2±267.61 | 451.5±370.00 | 42.6 | 572.7±312.72 | 506.3±382.0 | 48.4 | 0.03a |
| Magnesium (mg) | 265.1±137.76 | 196.7±196.00 | 82.8 | 244.3±186.88 | 212.5±113.00 | 58.2 | 248.9±175.59 | 212.5±138.0 | 63.7 | 0.507 |
| Phosphorus
(mg) | 1125.5±459.63 | 869.3±795.0 | 160.8 | 977.3±473.69 | 938.4±543.0 | 139.6 | 1010.6±468.89 | 936.8±612.0 | 144 | 0.466 |
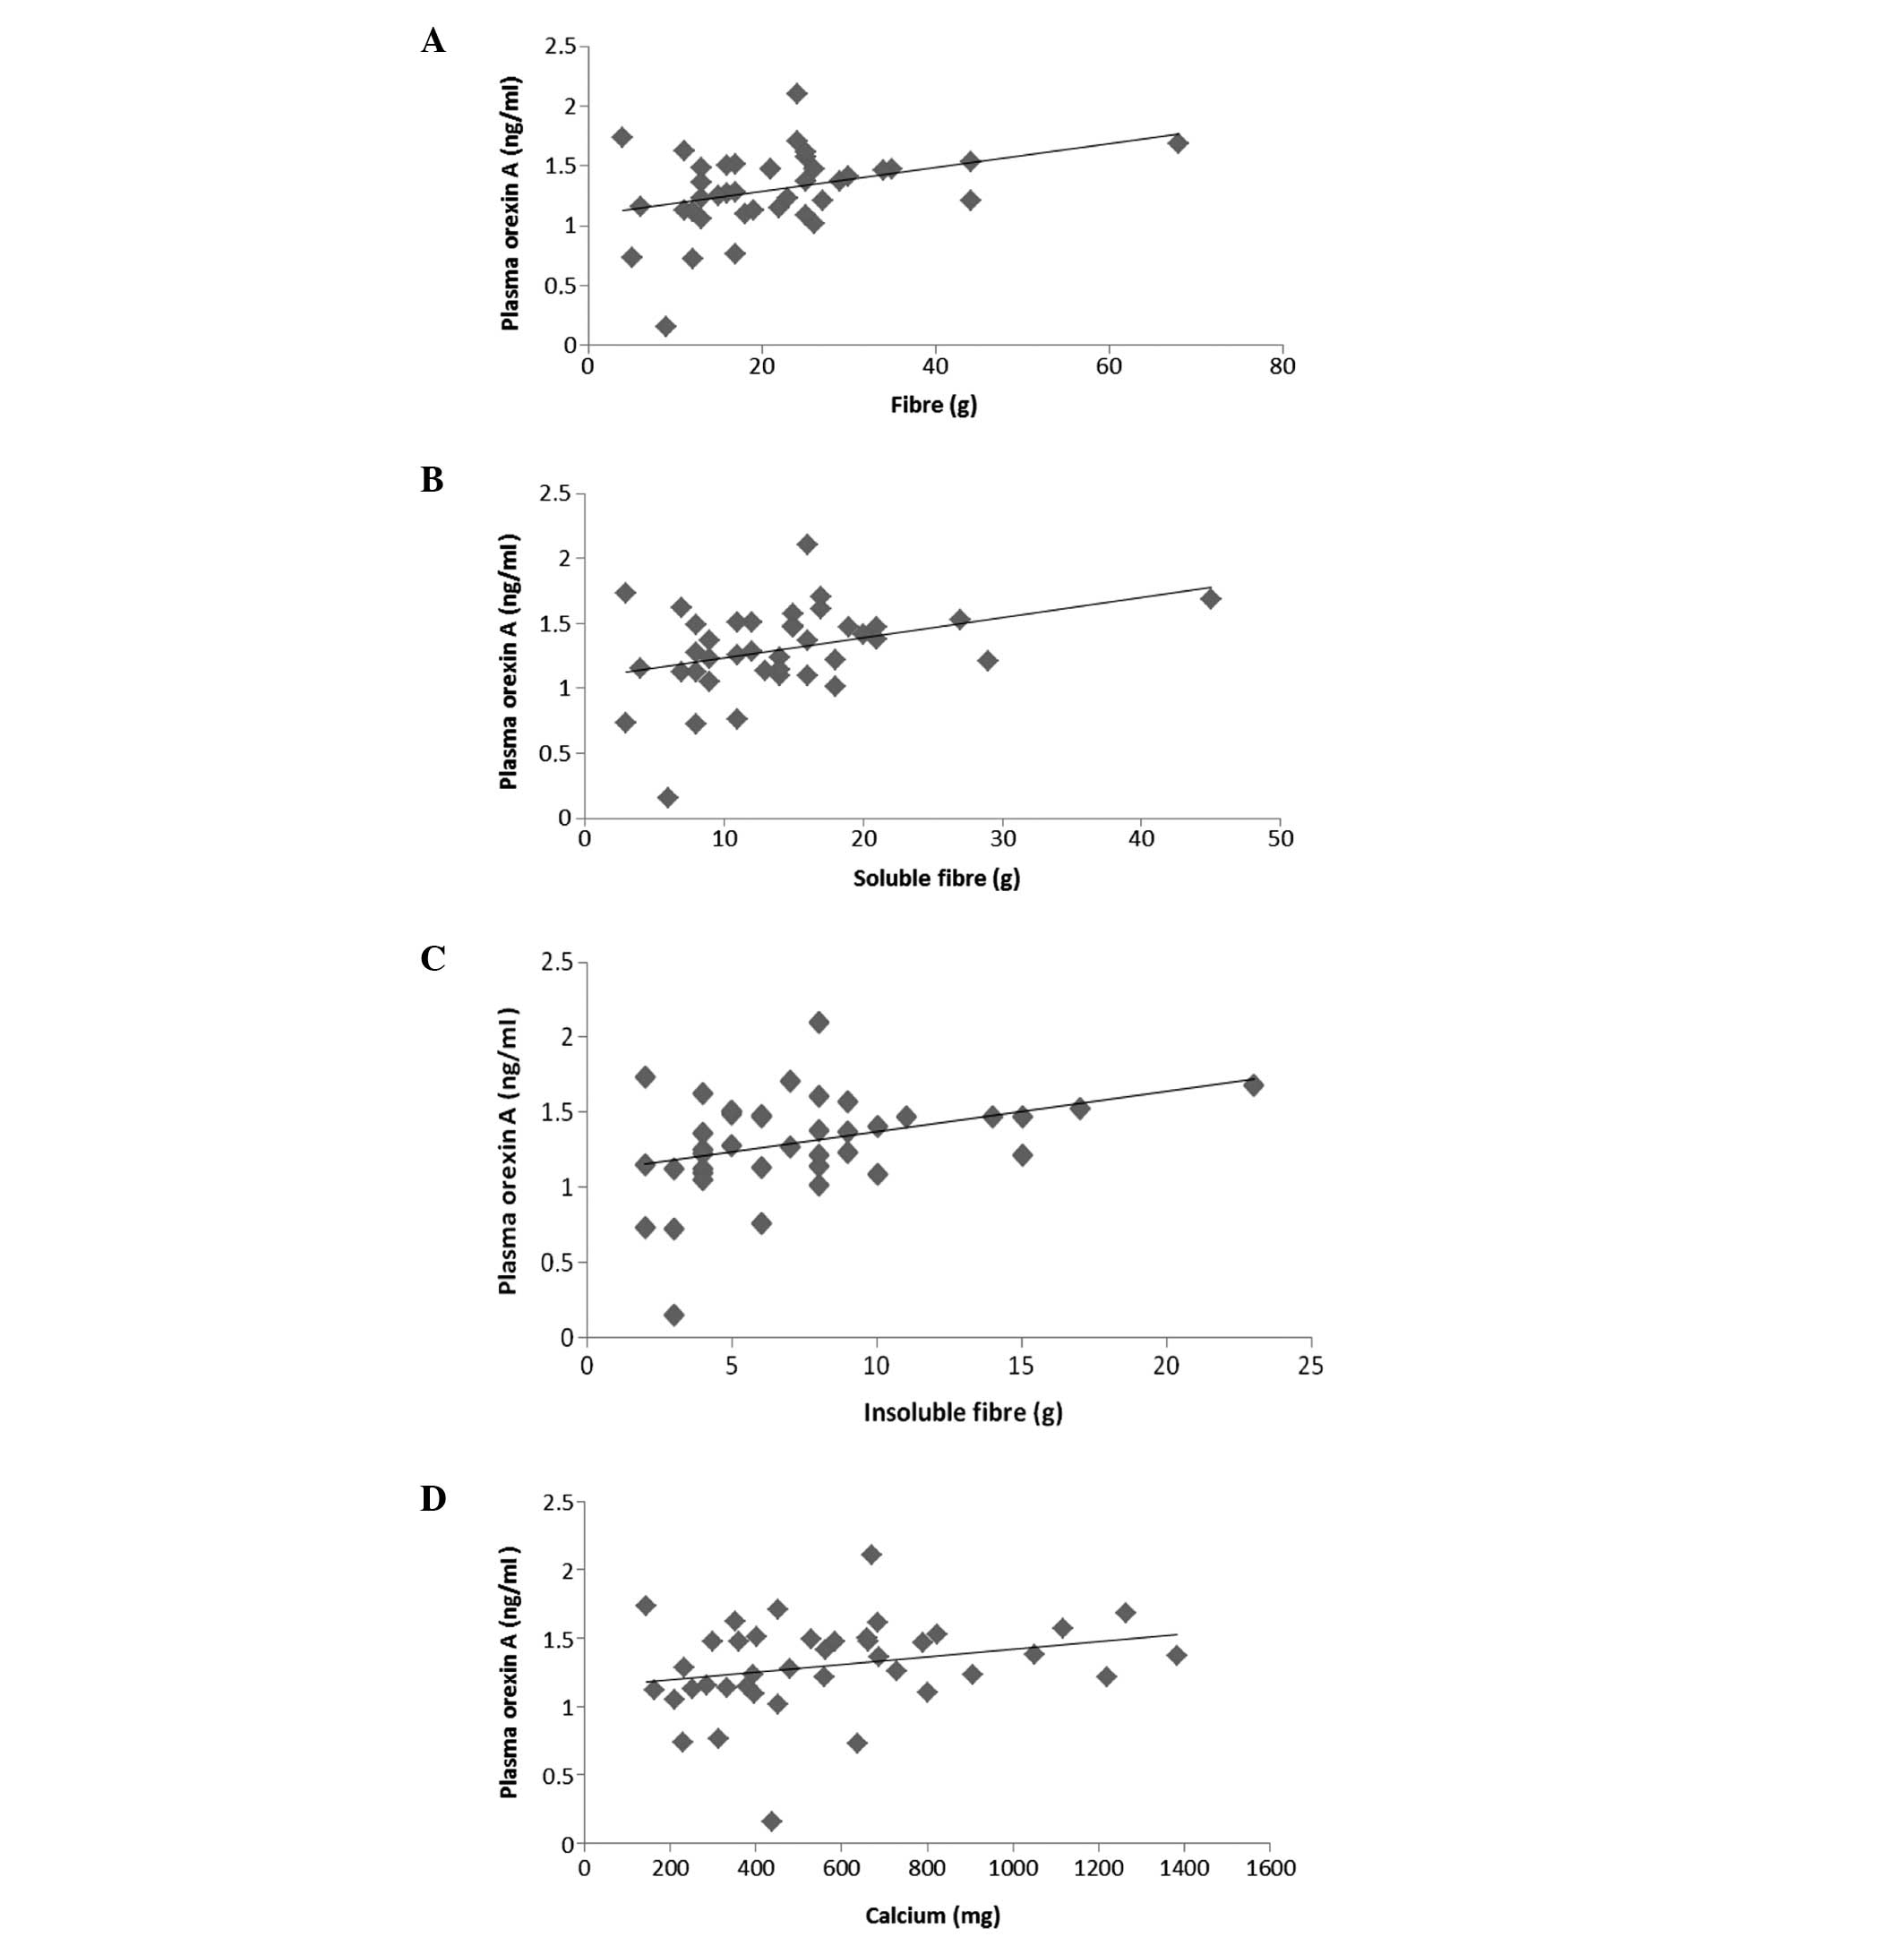
Statistically significant differences were not
observed between the plasma ghrelin levels and food intakes in the
patients with COPD (P>0.05; Table
IV). Correlations between plasma orexin-A levels and a number
of dietary nutrient intakes are shown in Fig. 3. Plasma orexin-A levels were
detected to be higher in patients with a higher dietary total fibre
intake (r=0.303, P=0.022; Fig.
3A). Similarly, a higher dietary intake of soluble (r=0.033,
P=0.029) and insoluble fibre (r=0.335, P=0.024) was found to be
accompanied with higher plasma orexin-A levels (Fig. 3B and C). A similar correlation was
observed between the daily calcium intake and plasma orexin-A
levels (r=0.065, P=0.046; Fig. 3D;
Table IV).
| Table IVRegression models between plasma
orexin-A levels and the daily dietary intake of nutrients. |
Table IV
Regression models between plasma
orexin-A levels and the daily dietary intake of nutrients.
| Plasma orexin-A
associated parameters | Constant | Regression
Coefficient | P-value |
|---|
| Fibre | 1.082 | 0.0100 | 0.022 |
| Soluble fibre | 1.081 | 0.0150 | 0.029 |
| Insoluble
fibre | 1.104 | 0.0268 | 0.024 |
| Calcium | 1.140 | 0.0003 | 0.046 |
Discussion
Malnutrition is a life-threatening health issue that
is commonly observed in patients with COPD (3–8).
Previous studies have demonstrated that the reason for these
individuals being underweight is an imbalance between their energy
expenditure and intake. Studies concerning the regulation of body
weight emphasise the involvement of energy expenditure and appetite
physiology, particularly neuropeptides that affect the nutritional
status (24–26). The present study is of particular
importance as, to the best of our knowledge, it is the first study
investigating the association between plasma orexin-A and ghrelin
levels, which are important polypeptides that stimulate food
intake, with food consumption and body composition in patients with
COPD in Turkey.
Previous studies on the association between plasma
ghrelin levels with BMI and body composition in patients with COPD
revealed contradictory results. Itoh et al (16) conducted a study to determine the
plasma levels of ghrelin in patients with COPD and reported that
plasma ghrelin levels of underweight patients with COPD were higher
than those of normal weight individuals. In addition, a study
conducted in China reported that total and active ghrelin levels in
underweight patients with COPD were significantly higher when
compared with normal weight COPD patients and the control group
(27). In the present study,
plasma ghrelin levels were highest in underweight female patients
and lowest in female patients who had a normal BMI (P>0.05;
Fig. 2). However, as the number of
underweight female patients was not sufficient, they were not
included in the statistical evaluation. In the study by Luo et
al (28), plasma ghrelin
levels were shown to positively correlate with the BMI and body fat
percentage in patients with COPD and negatively correlate in
control group patients. However, no significant correlation between
the BMI and plasma ghrelin levels was observed in the present study
(P>0.05; Fig. 2). Thus, further
studies are required to fully elucidate the association between the
plasma ghrelin levels and BMI in patients with COPD.
Matsuma et al (8) investigated plasma orexin-A levels in
20 patients with COPD and reported the plasma orexin-A levels of
normal weight patients as 17.5±0.9 pg/ml and underweight patients
as 14.1±0.5 pg/ml. Furthermore, the authors reported that plasma
orexin-A levels positively correlated with BMI and body fat tissue
(BMI, r=0.49, P=0.03; body fat tissue, r=0.53, P=0.02). These
results indicated that plasma orexin-A levels may have an effect on
the body composition of patients with COPD (8). However, in the present study, a
statistically significant difference in plasma orexin-A levels with
regard to BMI was not identified (P>0.05; Fig. 1). Although limited studies have
focused on the association between plasma orexin-A levels and BMI
in patients with COPD, studies on obese individuals have reported a
negative correlation between BMI and plasma orexin-A levels
(29,30).
The nutritional status of patients with COPD is an
important factor that affects the onset of symptoms and prognosis
of the disease. An increase in the oxygen demand in these patients
also increases their energy requirement (31). However, the medication administered
and short and frequent ventilation leads to insufficient food
consumption (32). In a study
conducted on 41 patients with COPD, individuals were found to have
an insufficient energy intake (33). In addition, a study on 251 patients
with COPD in Korea determined that the COPD patients met 66.76% of
their daily energy requirement (31). In the present study, it was
observed that patients with COPD met 81.3% of their daily energy
requirement (Table III).
Although malnutrition is commonly observed in COPD patients, it is
positive that they meet the majority of their energy requirements.
However, the protein, calcium and magnesium intakes, which may have
an effect on muscle strength and respiratory functions, were found
to be insufficient (Table III).
Therefore, planning and implementation of nutritional therapy is of
vital importance in COPD and requires dietician support.
Orexin contributes to respiratory control via
increasing ventilation (32).
Plasma orexin-A levels differ in COPD patients in the stable phase
and in the situation of hypercapnic respiratory failure. While
Matsumura et al (8)
reported that patients with COPD in stable phase had lower plasma
orexin-A levels compared with a control group, Zhu et al
(34) reported that COPD patients
with hypercapnic respiratory failure had higher plasma orexin
levels compared with normal individuals.
Dietary nutrient intakes have been shown to affect
the respiratory functions of patients with COPD (35,36).
In particular, dietary fibre intake in adults is considered to have
beneficial effects on chronic respiratory symptoms (37). However, sufficient information
concerning an association between fibre consumption with pulmonary
functions and COPD has not been demonstrated. In a previous study,
individuals with the highest fibre consumption were reported to
have higher forced expiratory volumes in one second compared with
other individuals. Furthermore, a positive correlation has been
demonstrated between the plasma levels of certain nutritional
elements, including vitamin C, vitamin D, calcium, vitamin E, and
respiratory coefficients (38). In
a study conducted on 278 adults, the daily dietary intake of
calcium and the risk of developing of COPD exhibited a negative
correlation (34).
In the present study, the daily dietary intake of
fibre and calcium, which positively affect pulmonary functions, and
plasma orexin-A levels were demonstrated to be positively
correlated. This correlation is hypothesised to have arisen from
the effects of orexin-A, as well as fibre and calcium, on
respiratory functions. As the number of studies on this subject is
limited, the results of the present may provide useful information
for future studies.
References
|
1
|
Gudmundsson G, Gislason T, Lindberg E, et
al: Mortality in COPD patients discharged from hospital: the role
of treatment and co-morbidity. Respir Res. 7:1092006. View Article : Google Scholar : PubMed/NCBI
|
|
2
|
Hurd S: The impact of COPD on lung health
worldwide: epidemiology and incidence. Chest. 117(2 Suppl): 1S–4S.
2000. View Article : Google Scholar : PubMed/NCBI
|
|
3
|
Engelen M, Schols AM, Baken WC, et al:
Nutritional depletion in relation to respiratory and peripheral
skeletal muscle function in out-patients with COPD. Eur Respir J.
7:1793–1797. 1994. View Article : Google Scholar : PubMed/NCBI
|
|
4
|
Mostert R, Goris A, Weling-Scheepers C, et
al: Tissue depletion and health related quality of life in patients
with chronic obstructive pulmonary disease. Respir Med. 94:859–867.
2000. View Article : Google Scholar : PubMed/NCBI
|
|
5
|
Wilson DO, Rogers RM, Wright EC and
Anthonisen NR: Body weight in chronic obstructive pulmonary
disease: The National Institutes of Health Intermittent
Positive-Pressure Breathing Trial. Am Rev Respir Dis.
139:1435–1438. 1989. View Article : Google Scholar
|
|
6
|
Gray-Donald K, Gibbons L, Shapiro SH,
Macklem PT and Martin JG: Nutritional status and mortality in
chronic obstructive pulmonary disease. Am J Respir Crit Care Med.
153:961–966. 1996. View Article : Google Scholar : PubMed/NCBI
|
|
7
|
Landbo C, Prescott E, Lange P, Vestbo J
and Almdal TP: Prognostic value of nutritional status in chronic
obstructive pulmonary disease. Am J Respir Crit Care Med.
160:1856–1861. 1999. View Article : Google Scholar : PubMed/NCBI
|
|
8
|
Matsumura T, Nakayama M, Satoh H, Naito A,
Kamahara K and Sekizawa K: Plasma orexin-A levels and body
composition in COPD. Chest. 123:1060–1065. 2003. View Article : Google Scholar : PubMed/NCBI
|
|
9
|
Vermeeren MA, Creutzberg EC, Schols AM,
Postma DS, Pieters WR, Roldaan AC and Wouters EF; COSMIC Study
Group. Prevalence of nutritional depletion in a large out-patient
population of patients with COPD. Respir Med. 100:1349–1355. 2006.
View Article : Google Scholar : PubMed/NCBI
|
|
10
|
Briski KP and Sylvester PW: Hypothalamic
orexin-A-immunopositive neurons express Fos in response to central
glucopenia. Neuroreport. 12:531–534. 2001. View Article : Google Scholar : PubMed/NCBI
|
|
11
|
Gezmen Karadağ M and Aksoy M: The effect
of omega-3 fatty acid supplementation on plasma orexin A, plasma
fatty acids, and anthropometric measurements in patients with
narcolepsy. Turk J Med Sci. 42:77–88. 2012.
|
|
12
|
Lazarczyk MA, Lazarczyk M and Grzela T:
Ghrelin: a recently discovered gut-brain peptide (review). Int J
Mol Med. 12:279–287. 2003.PubMed/NCBI
|
|
13
|
Cummings DE: Ghrelin and the short- and
long-term regulation of appetite and body weight. Physiol Behav.
89:71–84. 2006. View Article : Google Scholar : PubMed/NCBI
|
|
14
|
Liu ZB, Song NN, Geng WY, Jin WZ, Li L,
Cao YX, Qian Y, Zhu DN and Shen LL: Oreksin-A and respiration in a
rat model of smoke-induced chronic obstructive pulmonary disease.
Clin Exp Pharmacol Physiol. 37:963–968. 2010. View Article : Google Scholar : PubMed/NCBI
|
|
15
|
Ying BW, Song XB, Fan H, Wang LL, Li YS,
Cheng Z, Cheng H and Wen FQ: Plasma ghrelin levels and weight loss
in Chinese Uygur patients with chronic obstructive pulmonary
disease. J Int Med Res. 36:1371–1377. 2008. View Article : Google Scholar : PubMed/NCBI
|
|
16
|
Itoh T, Nagaya N, Yoshikawa M, Fukuoka A,
Takenaka H, Shimizu Y, Haruta Y, Oya H, Yamagishi M, Hosoda H,
Kangawa K and Kimura H: Elevated plasma ghrelin level in
underweight patients with chronic obstructive pulmonary disease. Am
J Respir Crit Care Med. 170:879–882. 2004. View Article : Google Scholar : PubMed/NCBI
|
|
17
|
Phoenix Pharmaceuticals. General protocol
for EK-031-50. http://www.phoenixpeptide.com/catalog/product_info.php?products_id=10814uri.
Accessed August 15, 2013
|
|
18
|
Phoenix Pharmaceuticals. General protocol
for EKE-003-30. http://www.phoenixpeptide.com/catalog/product_info.php?products_id=9380uri.
Accessed August 15, 2013
|
|
19
|
Rakıcıoğlu N, Acar Tek N, Ayaz A and
Pekcan G: Yemek ve Besin Fotoğraf Kataloğu. 3rd edition. Ata Ofset
Press; Ankara, Turkey: pp. 35–79. 2012
|
|
20
|
Dietary reference intakes for energy,
carbohydrate, fiber, fat, fatty acids, cholesterol, protein and
amino acid. Washington DC, USA: Institute of Medicine of the
National Academies; 2001, http://www.iom.edu/reports/2002/dietary-reference-intakes-for-energy-carbohydrate-fiber-fat-fatty-acids-cholesterol-protein-and-amino-acids.aspxuri.
Accessed July 20, 2013
|
|
21
|
The Ministry of Health of Turkey The
General Directorate of Primary Health Care and Hacettepe University
Department of Nutrition and Dietetics: Dietary guidelines for
Turkey. http://www.beslenme.gov.tr/content/files/yayinlar/ingilizce_yayinlar/books/dietary_guidelines.pdfuri.
Accessed August 15, 2013
|
|
22
|
World Health Organisation. BMI
classification. http://apps.who.int/bmi/index.jsp?introPage=intro_3.htmluri.
Accessed June 15, 2013
|
|
23
|
Özdamar K: 2004, Paket programlar ile
istatistiksel veri analizi (Cilt 1). Eskişehir: Kaan Kitapevi;
|
|
24
|
Schols AM, Soeters PB, Mostert R, et al:
Energy balance in chronic obstructive pulmonary disease. Am Rev
Respir Dis. 143:1248–1252. 1991. View Article : Google Scholar : PubMed/NCBI
|
|
25
|
Inui A: Cancer anorexia-cachexia syndrome:
are neuropeptides the key? Cancer Res. 59:4493–4501.
1999.PubMed/NCBI
|
|
26
|
Kalra SP, Dube MG, Pu S, et al:
Interacting appetite-regulating pathways in the hypothalamic
regulation of body weight. Endocr Rev. 20:68–100. 1999.PubMed/NCBI
|
|
27
|
Peng M, Cai BQ, Ma Y, Zhu HJ, Sun Q and
Song AL: Circulating leptin and ghrelin in patients with chronic
obstructive pulmonary disease. Zhonghua Jie He He Hu Xi Za Zhi.
30:182–185. 2007.(In Chinese).
|
|
28
|
Luo FM, Liu XJ, Li SQ, Wang ZL, Liu CT and
Yuan YM: Circulating ghrelin in patients with chronic obstructive
pulmonary disease. Nutrition. 21:793–798. 2005. View Article : Google Scholar : PubMed/NCBI
|
|
29
|
Baranowska B, Wolińska-Witort E, Martyńska
L, Chmielowska M and Baranowska-Bik A: Plasma orexin A, orexin B,
leptin, neuropeptide Y (NPY) and insulin in obese women. Neuro
Endocrinol Lett. 26:293–296. 2005.PubMed/NCBI
|
|
30
|
Adam JA, Manheere PP, van Dielen FM,
Soeters PB, Buurman WA and Greve JW: Decreased plasma orexin-A
levels in obese individuals. Int J Obes Relat Metab Disord.
26:274–276. 2002. View Article : Google Scholar : PubMed/NCBI
|
|
31
|
Lee H, Kim S, Lim Y, Gwon H, Kim Y, Ahn J
and Park H: Nutritional status and disease severity in patients
with chronic obstructive pulmonary disease (COPD). Arch Gerontol
Geriatr. 56:518–523. 2013. View Article : Google Scholar : PubMed/NCBI
|
|
32
|
Woo J, Mak YT and Swaminathan R:
Nutritional status of general medical patients - influence of age
and disease. J Nutr Biochem. 2:274–280. 1991. View Article : Google Scholar
|
|
33
|
Hallin R, Koivisto-Hursti U, Lindberg E
and Janson C: Nutritional status, dietary energy intake and the
risk of exacerbations in patients with chronic obstructive
pulmonary disease (COPD). Respir Med. 100:561–567. 2006. View Article : Google Scholar : PubMed/NCBI
|
|
34
|
Zhu LY, Summah H, Jiang HN and Qu JM:
Plasma orexin-a levels in COPD patients with hypercapnic
respiratory failure. Mediators Inflamm. 2011:7548472011.PubMed/NCBI
|
|
35
|
McKeever TM, Lewis SA, Smit HA, Burney P,
Cassano PA and Britton J: A multivariate analysis of serum nutrient
levels and lung function. Respir Res. 9:672008. View Article : Google Scholar : PubMed/NCBI
|
|
36
|
Hirayama F, Lee AH, Oura A, Mori M,
Hiramatsu N and Taniguchi H: Dietary intake of six minerals in
relation to the risk of chronic obstructive pulmonary disease. Asia
Pac J Clin Nutr. 19:572–577. 2010.PubMed/NCBI
|
|
37
|
Kan H, Stevens J, Heiss G, Rose KM and
London SJ: Dietary fiber, lung function and chronic obstructive
pulmonary disease in the atherosclerosis risk in communities study.
Am J Epidemiol. 167:570–578. 2008. View Article : Google Scholar : PubMed/NCBI
|
|
38
|
Young JK, Wu M, Manaye KF, Kc P, Allard
JS, Mack SO and Haxhiu MA: Orexin stimulates breathing via
medullary and spinal pathways. J Appl Physiol (1985). 98:1387–1395.
2005. View Article : Google Scholar : PubMed/NCBI
|