Introduction
Taste-masking, particularly bitterness
taste-masking, is an important issue that pharmaceutical scientists
encounter. Studies on methods of quantifying bitterness intensity
and the factors contributing to bitterness generation are likely to
aid pharmaceutical workers conducting taste-masking research.
The fundamental quantitative method for determining
bitterness intensity is the traditional human taste panel method
(THTPM) (1). In the present study,
the bitterness intensity obtained by the THTPM is designated the
human taste bitterness intensity (Ih). According
to the different determination approach, Ih is
divisible into rank bitterness intensity (I0) and
relative bitterness intensity (I1). The THTPM is
widely used in the fields of food (2), functional food (3) and drugs (4,5).
However, the subjectivity of the THTPM is marked and its operation
is complicated. It is possible to collect various types of chemical
information about drug solutions through sensors using an
electronic tongue analyzer (e-tongue) (6,7), and
then based on known information, such as the taste information
provided by the THTPM, the bitterness intensity,
sweetness-sugariness intensity and other taste information may be
identified through certain mathematical methods. The bitterness
intensity obtained by this method is known as the e-tongue
bitterness intensity (Ie) in the present study.
This method has numerous advantages, including quantified data,
stable output and no potential safety risk, which compensates for
the deficiency of the THTPM (8).
The e-tongue system has been developed for the taste measurement of
bitter drug substances in accurate taste comparisons for the
development of palatable oral formulations (9). The e-tongue is a useful tool in
pharmaceutical development for the qualitative and quantitative
evaluation of drug substance taste, as well as bitterness masking
efficiency, without performing laborious gustatory sensation tests
in humans (10).
In order to analyze the e-tongue data and predict
the gustatory sensation of a sample accurately and reliably, the
analysis should be based on instructional learning methods such as
partial least squares (PLSs) and support vector machines. In
addition, an accurate and reliable bitterness prediction model
(BPM) (10–12) should be set up between e-tongue
sensing information and Ih, to incorporate the
results of the THTPM. Only in this way is it possible to achieve
the precise prediction of the bitterness intensity of a drug.
Different machine learning methods have different characteristics.
For example, PLS is a linear method, although it has its advantages
(simple, accurate and stable), while back-propagation neural
networks (BPNNs) have fine non-linear mapping ability, but their
algorithms easily fall into the local extreme point (12). Genetic algorithms (GAs), which
imitate the inheritance and evolution of creatures in the physical
environment, are grading-up probabilistic searching algorithms that
adapt to the overall situation and overcome the disadvantages of
BPNNs. There are a variety of ways to combine a GA and a BPNN
(GA-BP), including the application of the GA to increase the
optimization of the initial weight and offset of the BP network
(13–15). To the best of our knowledge,
studies of a BPM built using this method have never been
reported.
Berberine hydrochloride is the essential component
of the traditional Chinese medicine Rhizoma Coptidis, and it is
also a popular antibacterial agent (16). Due to its high bitterness
intensity, it is usually used as a reference material in studies
concerning the taste-masking of bitter drugs. The present study
demonstrates a method of using various concentrations of berberine
hydrochloride solution as the investigative support in the analysis
of the results of an e-tongue and the THTPM. In addition, the
prediction of the I0 of berberine hydrochloride
was achieved using the GA-BP to establish its BPM.
Materials and methods
Volunteer screening
Strict screening including bitter taste sensitivity
was conducted to recruit volunteers and 20 healthy volunteers were
selected as the subjects (nine male and 11 female). This study was
conducted in accordance with the Declaration of Helsinki and with
approval from the Ethics Committee of the First Affiliated Hospital
of Henan University of Traditional Chinese Medicine (Zhengzhou,
China). Written informed consent was obtained from all
participants.
Concentration selection of the reference
samples and sample preparation
According to literature methods (1,17,18),
a scale of 1–5 was used to determine the bitterness intensity, and
each score on the scale was assigned a certain bitterness distance
which corresponded with a certain concentration. The concentration
was obtained by pre-testing of the berberine hydrochloride
reference solution (lot number, 101002; Sichuan Province Yuxin
Pharmaceutical Co., Ltd., Chengdu, China) with different
concentrations by the subjects (Table
I).
 | Table IBitterness rank and the concentration
of the corresponding reference samples. |
Table I
Bitterness rank and the concentration
of the corresponding reference samples.
| No. | Description of
intensity of bitterness | Rank assigned | Scale | Concentration of
reference samples mg/ml (mM) |
|---|
| 1 | Imperceptible | I | (0.5, 1.5) | 0 (0) |
| 2 | Slight | II | (1.5, 2.5) | 0.01 (0.027) |
| 3 | Moderate | III | (2.5, 3.5) | 0.05 (0.134) |
| 4 | Great (but
acceptable) | IV | (3.5, 4.5) | 0.1 (0.269) |
| 5 | Extreme (almost
unacceptable) | V | (4.5, 5.5) | 0.5 (1.344) |
Preparation of the test samples
The berberine hydrochloride was formulated to
various concentrations (0.001, 0.0025, 0.01, 0.025, 0.1, 0.25, 0.5,
1 and 2.5 mM) which were referred to as S1–S9, respectively.
Standardization between the taste
evaluation of the subjects and the bitterness values of the
reference sample groups
According to the method of Kawano et al
(18), the subjects took 20 ml
reference solution at various concentrations in a tasting cup, held
the aforementioned reference solutions in their mouth for 15 sec
and were informed of the bitterness scale and bitterness intensity.
Following tasting of the sample, the subjects gargled well and
waited for at least 15 min prior to tasting the subsequent
sample.
Gustatory sensation evaluation of test
samples
Following the previously described procedure, the
subjects evaluated and provided a numerical value for test samples
according to their taste sensation and the bitterness scale of the
reference solutions. The results were assigned on designed
evaluation forms. Subsequently the subjects gargled well and waited
for at least 15 min prior to tasting the subsequent sample.
Outlier handling
In this study, the subjects may have individual
differences and several outliers emerged among the experimental
data. The outliers were tested and removed using the Grubbs’
testing method. Only one outlier was removed in each cycle.
Oversized and undersized outliers may exist in taste experiments,
so the statistical tests used in this study were two-sided. The
significance and rejection levels were set as 0.1 and 0.05,
respectively.
Determination of e-tongue data
E-tongue and data acquisition experiments were
performed using an Astree II electronic tongue (Alpha M.O.S,
Toulouse, France). The e-Tongue was capable of discriminating
between substances with different tastes, and the sensors appeared
to be cross-selective for five basic tastes: Sourness, sweetness,
bitterness, saltiness and umami. A strong linear correlation
between berberine hydrochloride bitter and concentration has been
observed in the concentration range 0.93 18.63 mg/l. (19).
With regard to the nine concentrations of berberine
hydrochloride solution, the sensors were rinsed with deionized
water in six beakers of water for 10 sec following each pre-test.
The sensors were rinsed well prior to analyzing the samples. The
sample (80 ml) with each concentration was placed into a 120-ml
beaker used specifically for the e-tongue and the beaker was placed
on an automatic sampling plate. All samples were analyzed seven
times and each analysis cycle lasted 120 sec. For these
experiments, the samples were analyzed at room temperature, and
only the last 120 sec of data were used in the analysis. Samples
were replicated seven times, with only the last four replications
used in mathematical processing and analysis.
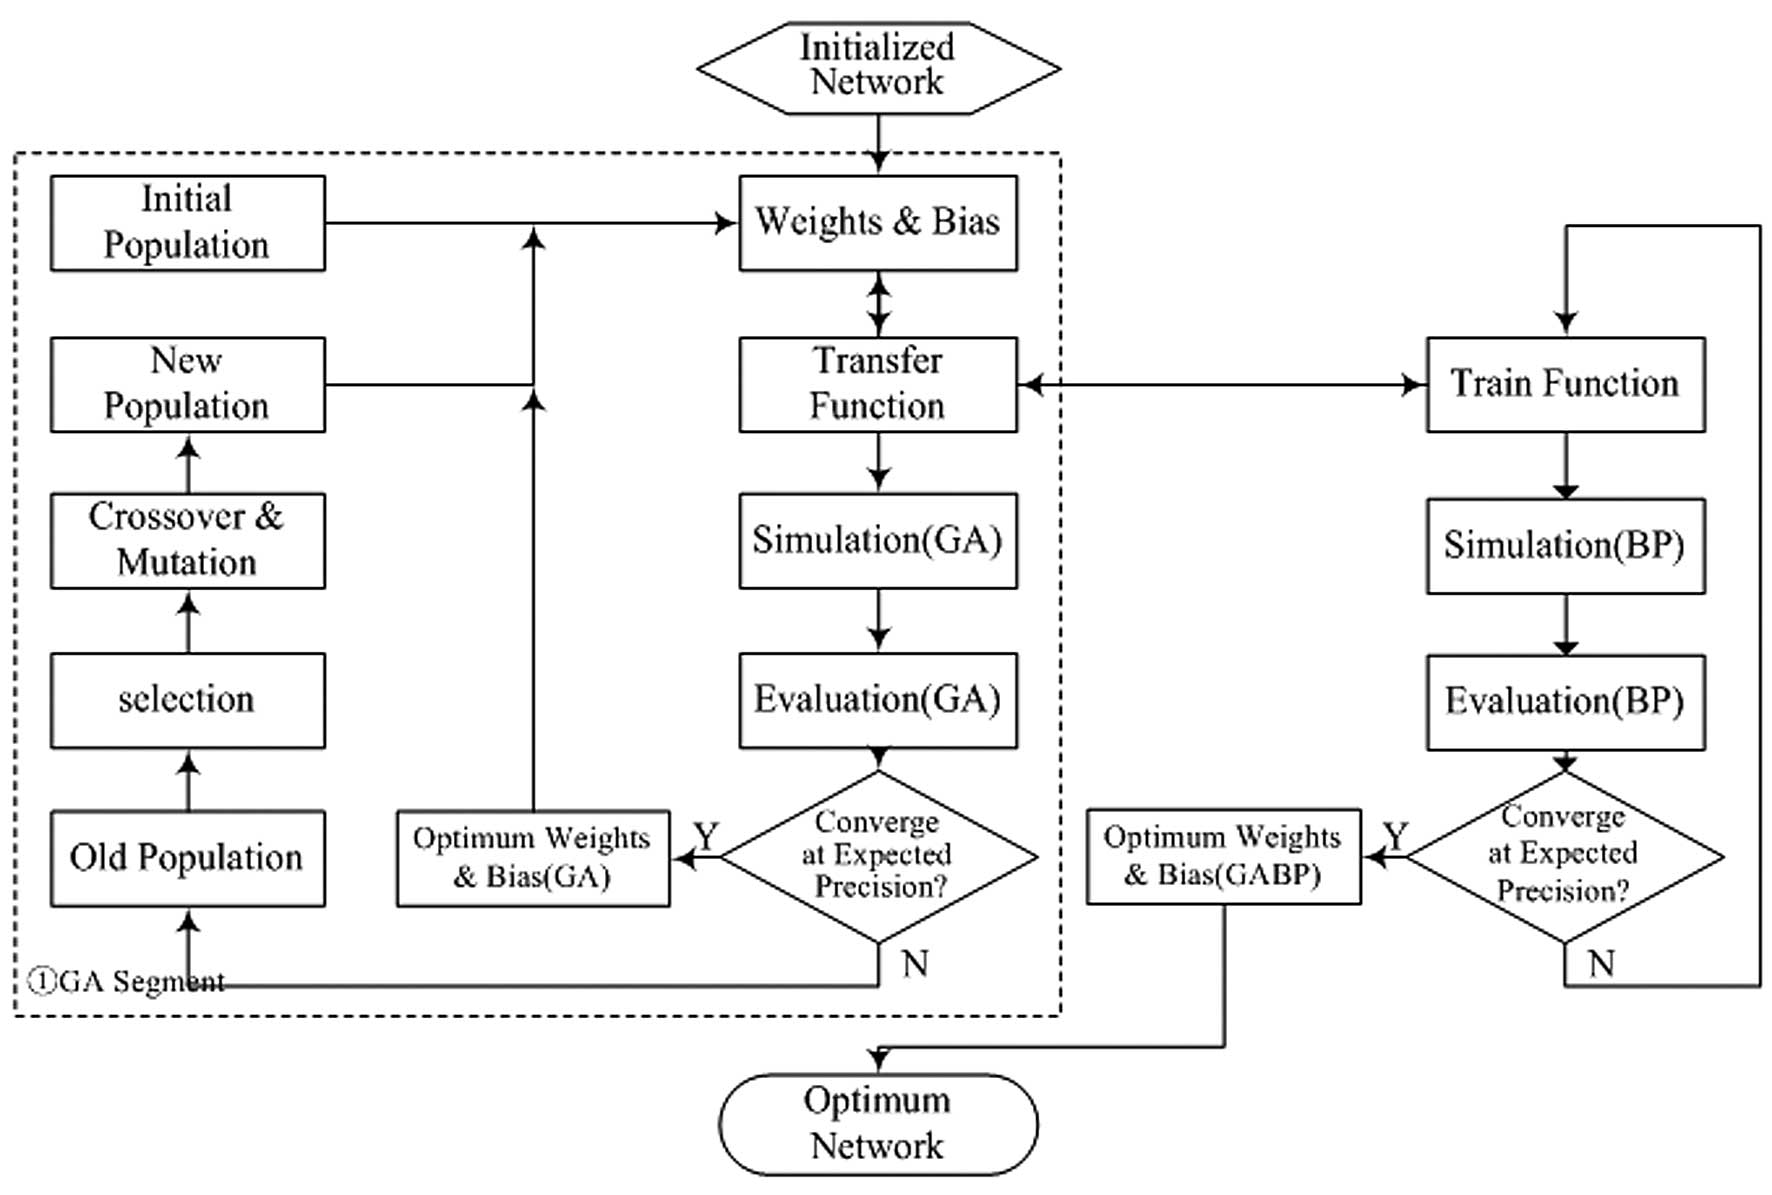
Processing of the GA-BP
This study utilized the application of a GA to
optimize the initial weight and offset of the BPNN. The main
process of the algorithm was divided into two stages: i) On the
basis of the initialization model, the connection value was encoded
and the BPNN offset to compose the chromosomes of the GA, the
chromosomes were optimized by the GA and the decoded chromosomes
were assigned to a neural network; and ii) the network weight was
further optimized and was offset by the local optimization ability
of the training function of the BP. The flowchart is shown in
Fig. 1 and the functions in the
dotted box constitute the first stage.
Model initialization and parameter
selection
The vectors of the BPNN, which used A, B,
Z1 and Z2 as input vectors and Y as the
output vector, were normalized in the range [−1,1] to eliminate the
effects of dimension. Three-layer structures which included a
hidden layer were selected through pre-testing and intra-checking.
The node point of the hidden structure was five; the transfer
functions were tansig and purelin; the training function was
traingd; the learning rate was 0.05; the target error was
10−4; and the maximum number of training cycles was
18,000.
The GA adopted a real coding pattern to arrange the
46 parameters of the BP network, the connection values of which
were included with definite order. The aim was to compose the
chromosomes of the GA. The population was 50 and the genetic
algebra was 500. The difference between the original output vector
normalization and the non-normalized prediction output vector was
defined as the residual; therefore, the fitness function was the
reciprocal of the sum of squared residuals. According to the
ranking selection method of normal geometric distribution, q was
0.08, which determined the probability selection table. Taking
arithmetic crossover, the frequency of evolutionary crossover in
every generation was two. Namely, crossover operation of individual
accounts for the largest proportion of population (50) 4%. By
adopting the non-uniform mutation operator, the shape parameter b
was calculated to be 3. The frequency of mutation operation with
each individual mutation probability being 0.053 was four times in
each generation of evolution.
Training and establishment of the
model
Certain GAs after 500 generations of evolution did
not meet the GA target precision of 10−3, and the best
individual was assigned to the BP network.
Optimization and evaluation of the
model
The jackknifing cross-validation method was used for
the optimization and evaluation of the model. In order to avoid the
result information of the parallel determination distributing in
the training set and validation set at the same time, thus causing
high fitting of the error model, each reserved verification set was
unified into four-fold parallel test results of each sample in the
design process.
The root mean square error of cross-validation
(RMSECV) and the correlation coefficient (R) between the true and
predicted values in cross-validation are regarded as the evaluation
indices. The formula for calculating R omitted slightly. The
formula for calculating RMSECV was as follows: RMSECV =
√[∑(I0i - Î0i
)2/n], where n is the total
number of observations; I0i is the
corresponding I0 of the ith observation;
and Î0i is the prediction value of
I0i obtained from the model which was established
using the rest of the n-4 observations by removing the ith
observation.
When conducting the cross-validation, owing to the
algorithm including standardization and reverse standardization
processing steps, the two ends of the data (eight groups of data
with the maximum and minimum bitterness) were in processing beyond
the scope of normal values, causing greater errors; and model
prediction was not sharply extended to the two ends when
forecasting the model. Therefore, the following data are the
results that were obtained following the removal of the data from
the two sides of the forecasting results. In addition, on account
of the randomness of the initial value, six groups of
cross-validation results were calculated. Modeling was carried out
with all the data as a training set.
Comparison with other modeling
methods
The same e-tongue data may be modeled using multiple
linear regression (MLR), PLS regression and artificial neural
networks for comparison with the results generated by the GA-BP
model. Processing of the data was conducted with cross-validation
and modeling with the GA-BP method. In PLS regression, the RMSECV
and R of cross-validation between the true and predicted values for
an index are utilized to optimize the number of latent variables.
The artificial neural network opted for the same parameters as the
GA-BP.
Results
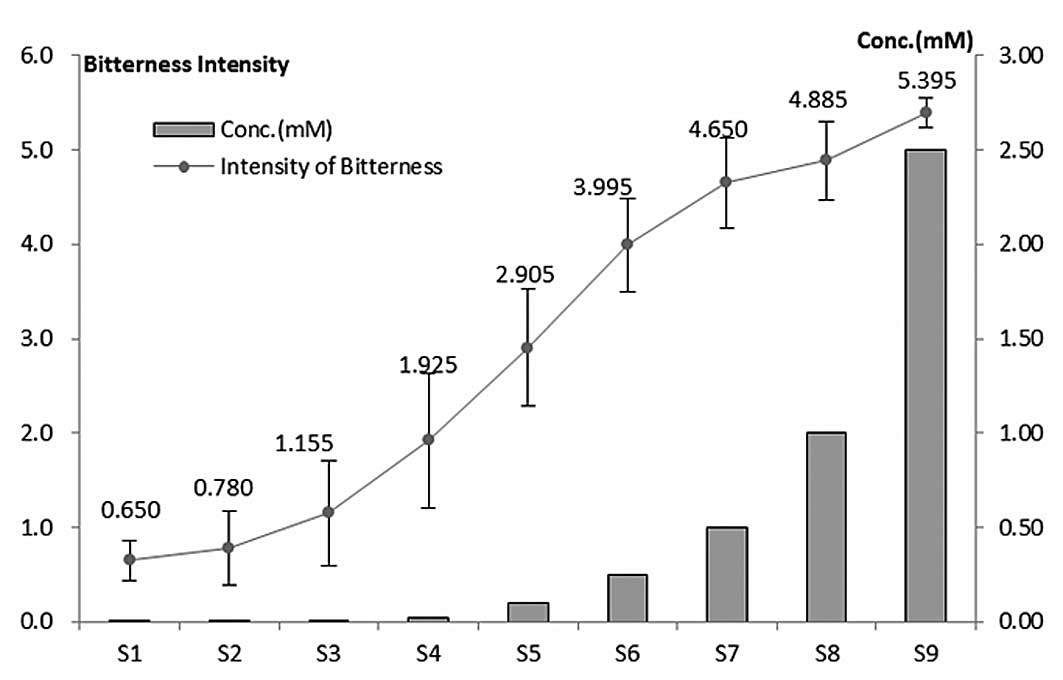
Bitterness intensity order of the
I0 taste results
Following processing of the experimental data, the
results showed that 1.2 in data group 1 and 2.6 in data group 3
were deviation value, scilicet it reached the detectable level
(α=0.05), but not to the eliminate level (α=0.01), so were
retained. No data were eliminated in this experiment. Samples of
nine concentrations and their corresponding bitterness intensity
order are shown in Fig. 2. There
are 36 groups of data for the BPM in total, and each group contains
seven root sensor responding values, so this model has a total of
36 × 7 (252) data.
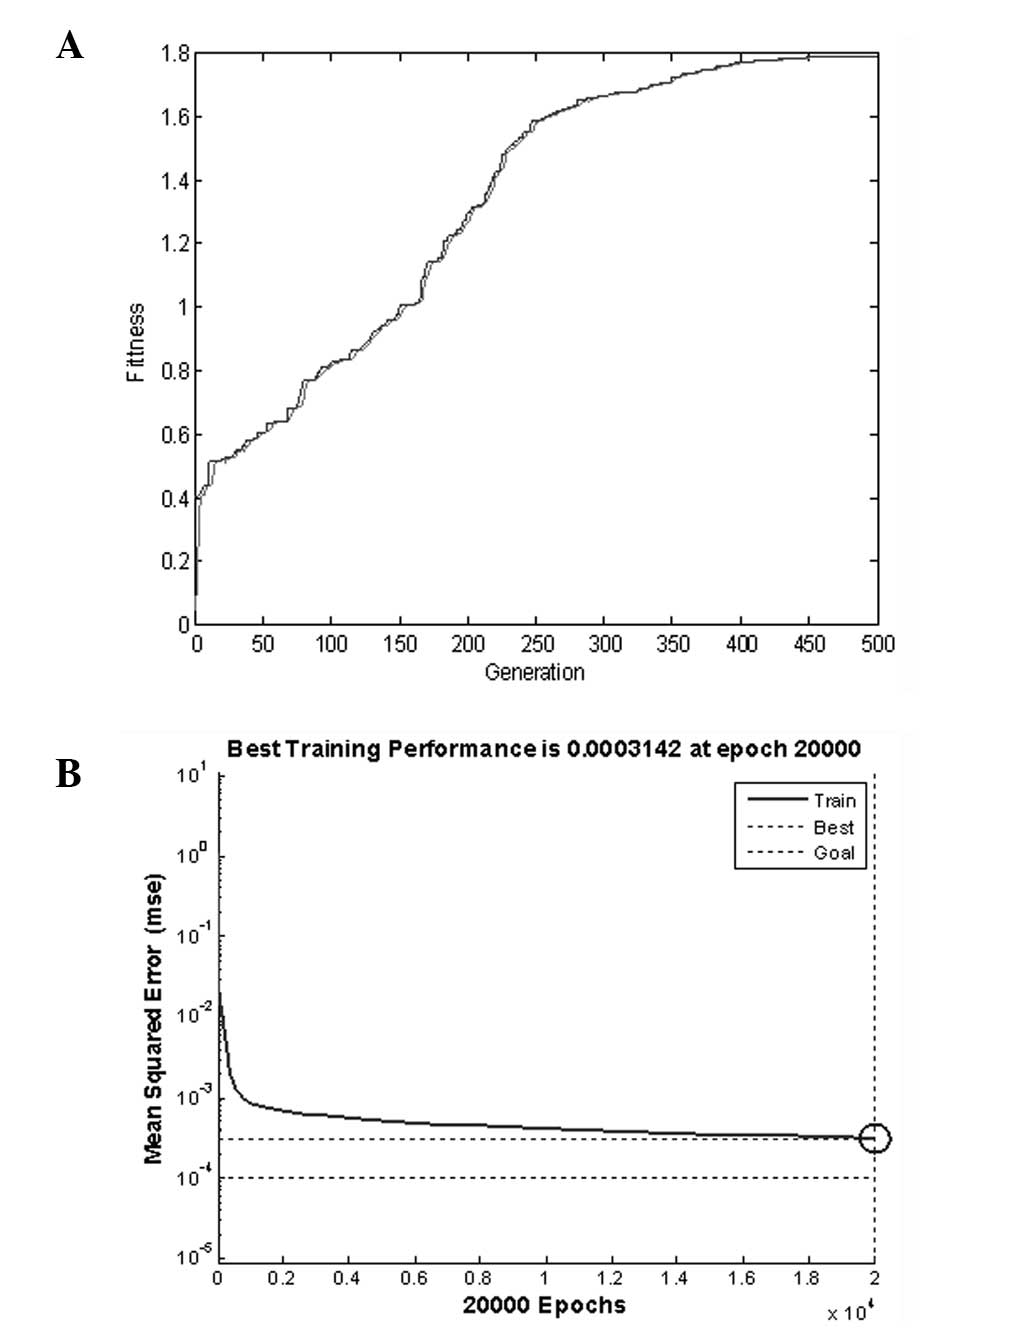
Training and establishment of the
model
Fig. 3 shows the
maximum fitness and the change of the average fitness of the groups
in the evolutionary process. By the further optimization of the BP,
the number of training cycles achieved the original maximum setting
of 20,000, and an accuracy of 10−3 but not the target of
10−4 was reached.
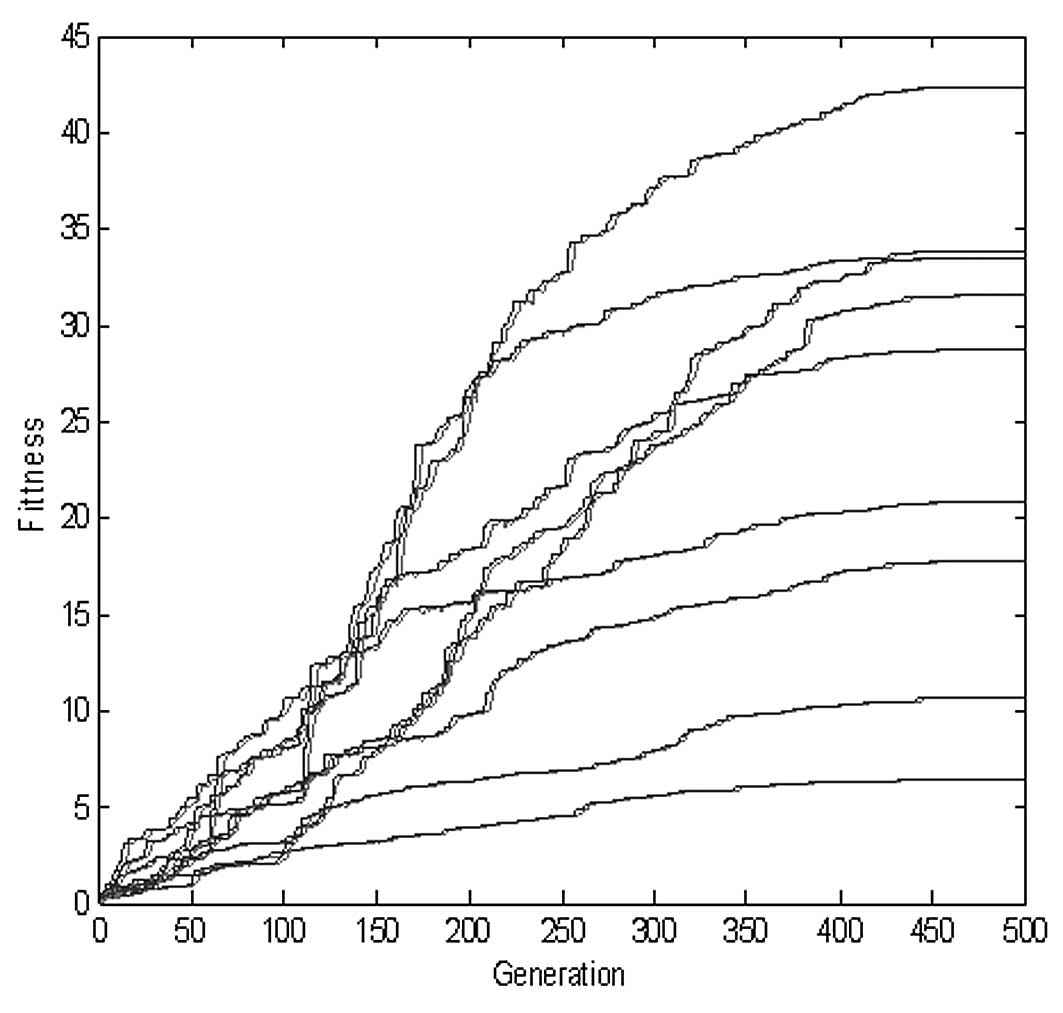
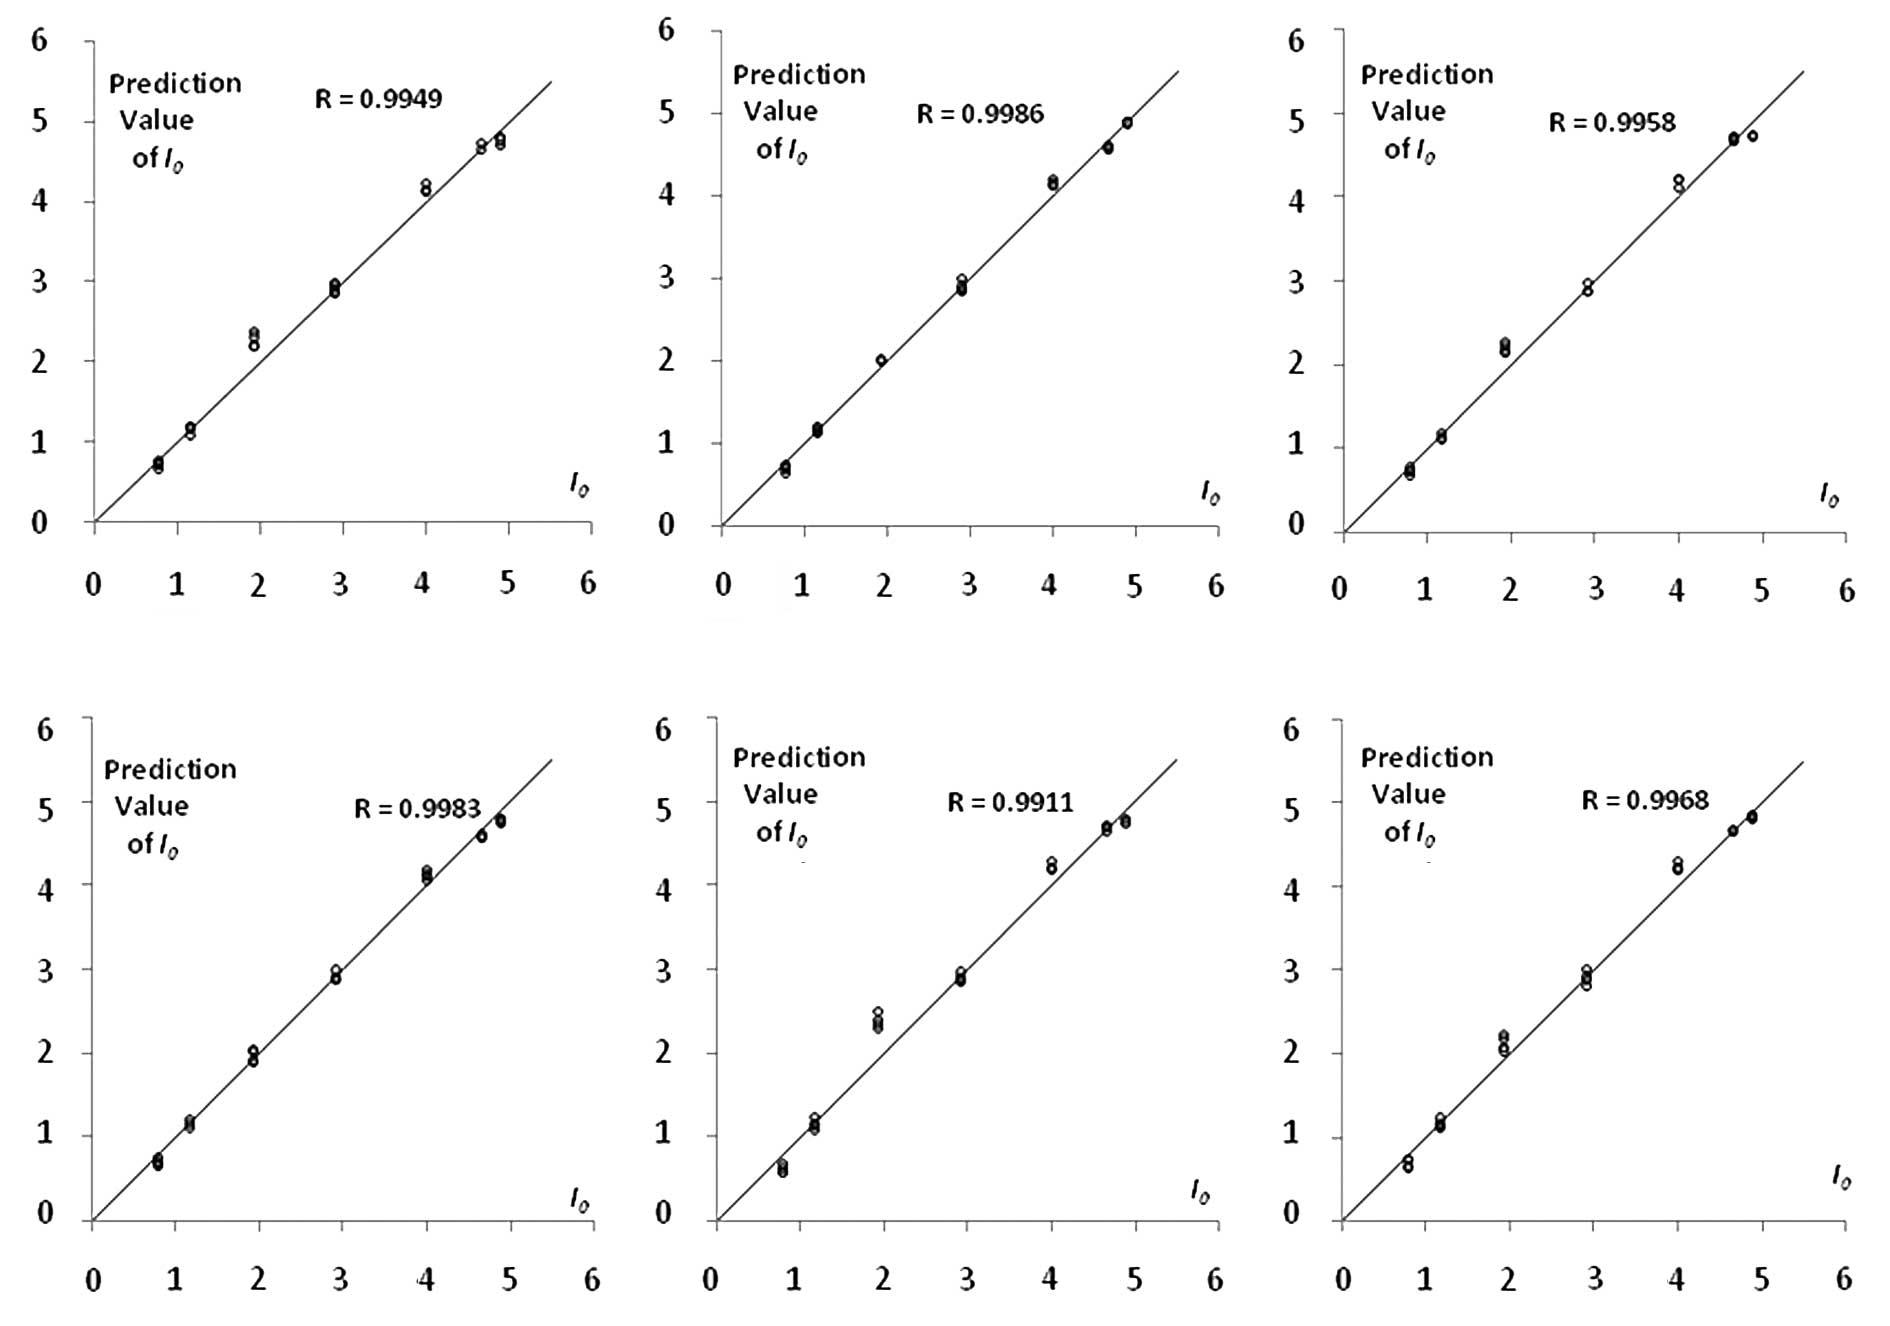
Model validation results
The changes of fitness in the cross-validation test
are shown in Fig. 4. The RMSECV
was 0.1398±0.0488 (n=6). The R of cross-validation between the true
and predicted values was 0.9959±0.0027 (n=6). The comparison of
true and predicted values of I0 is shown in Fig. 5. All the values of R are >0.99
and the prediction of the bitterness intensity is comparatively
accurate.
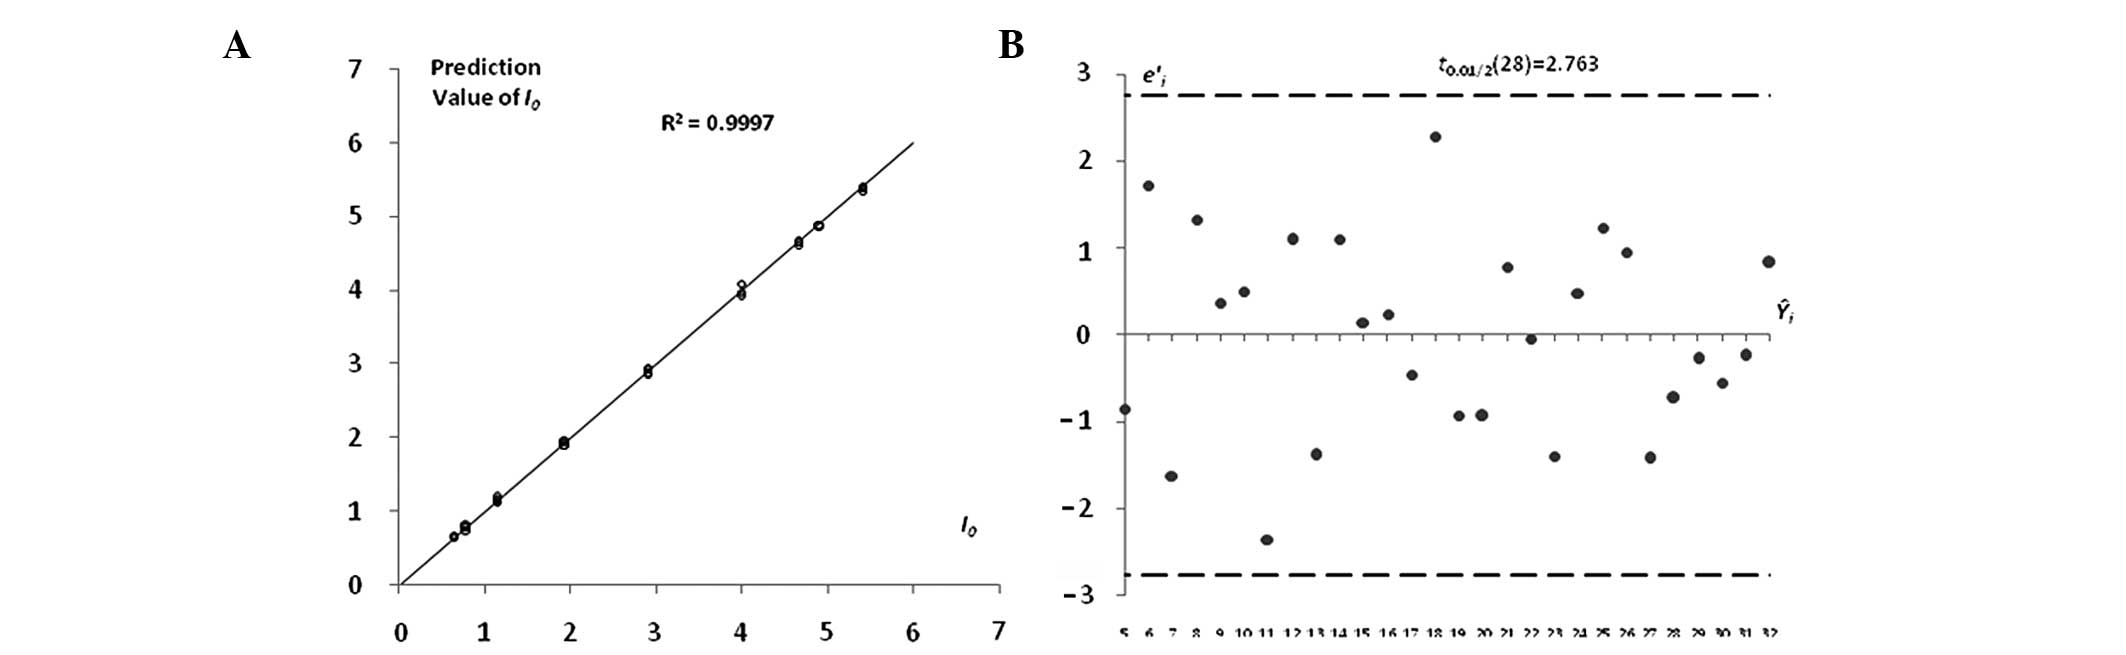
Final model
Regarding all data as a training set for modeling,
the determination coefficient (R2) was 0.99965±0.00004
(n=4). A comparison of the results between the true and predicted
values in the model and the standardized residuals is shown in
Fig. 6. The results show that the
model accurately predicted the bitterness intensity of unknown
samples.
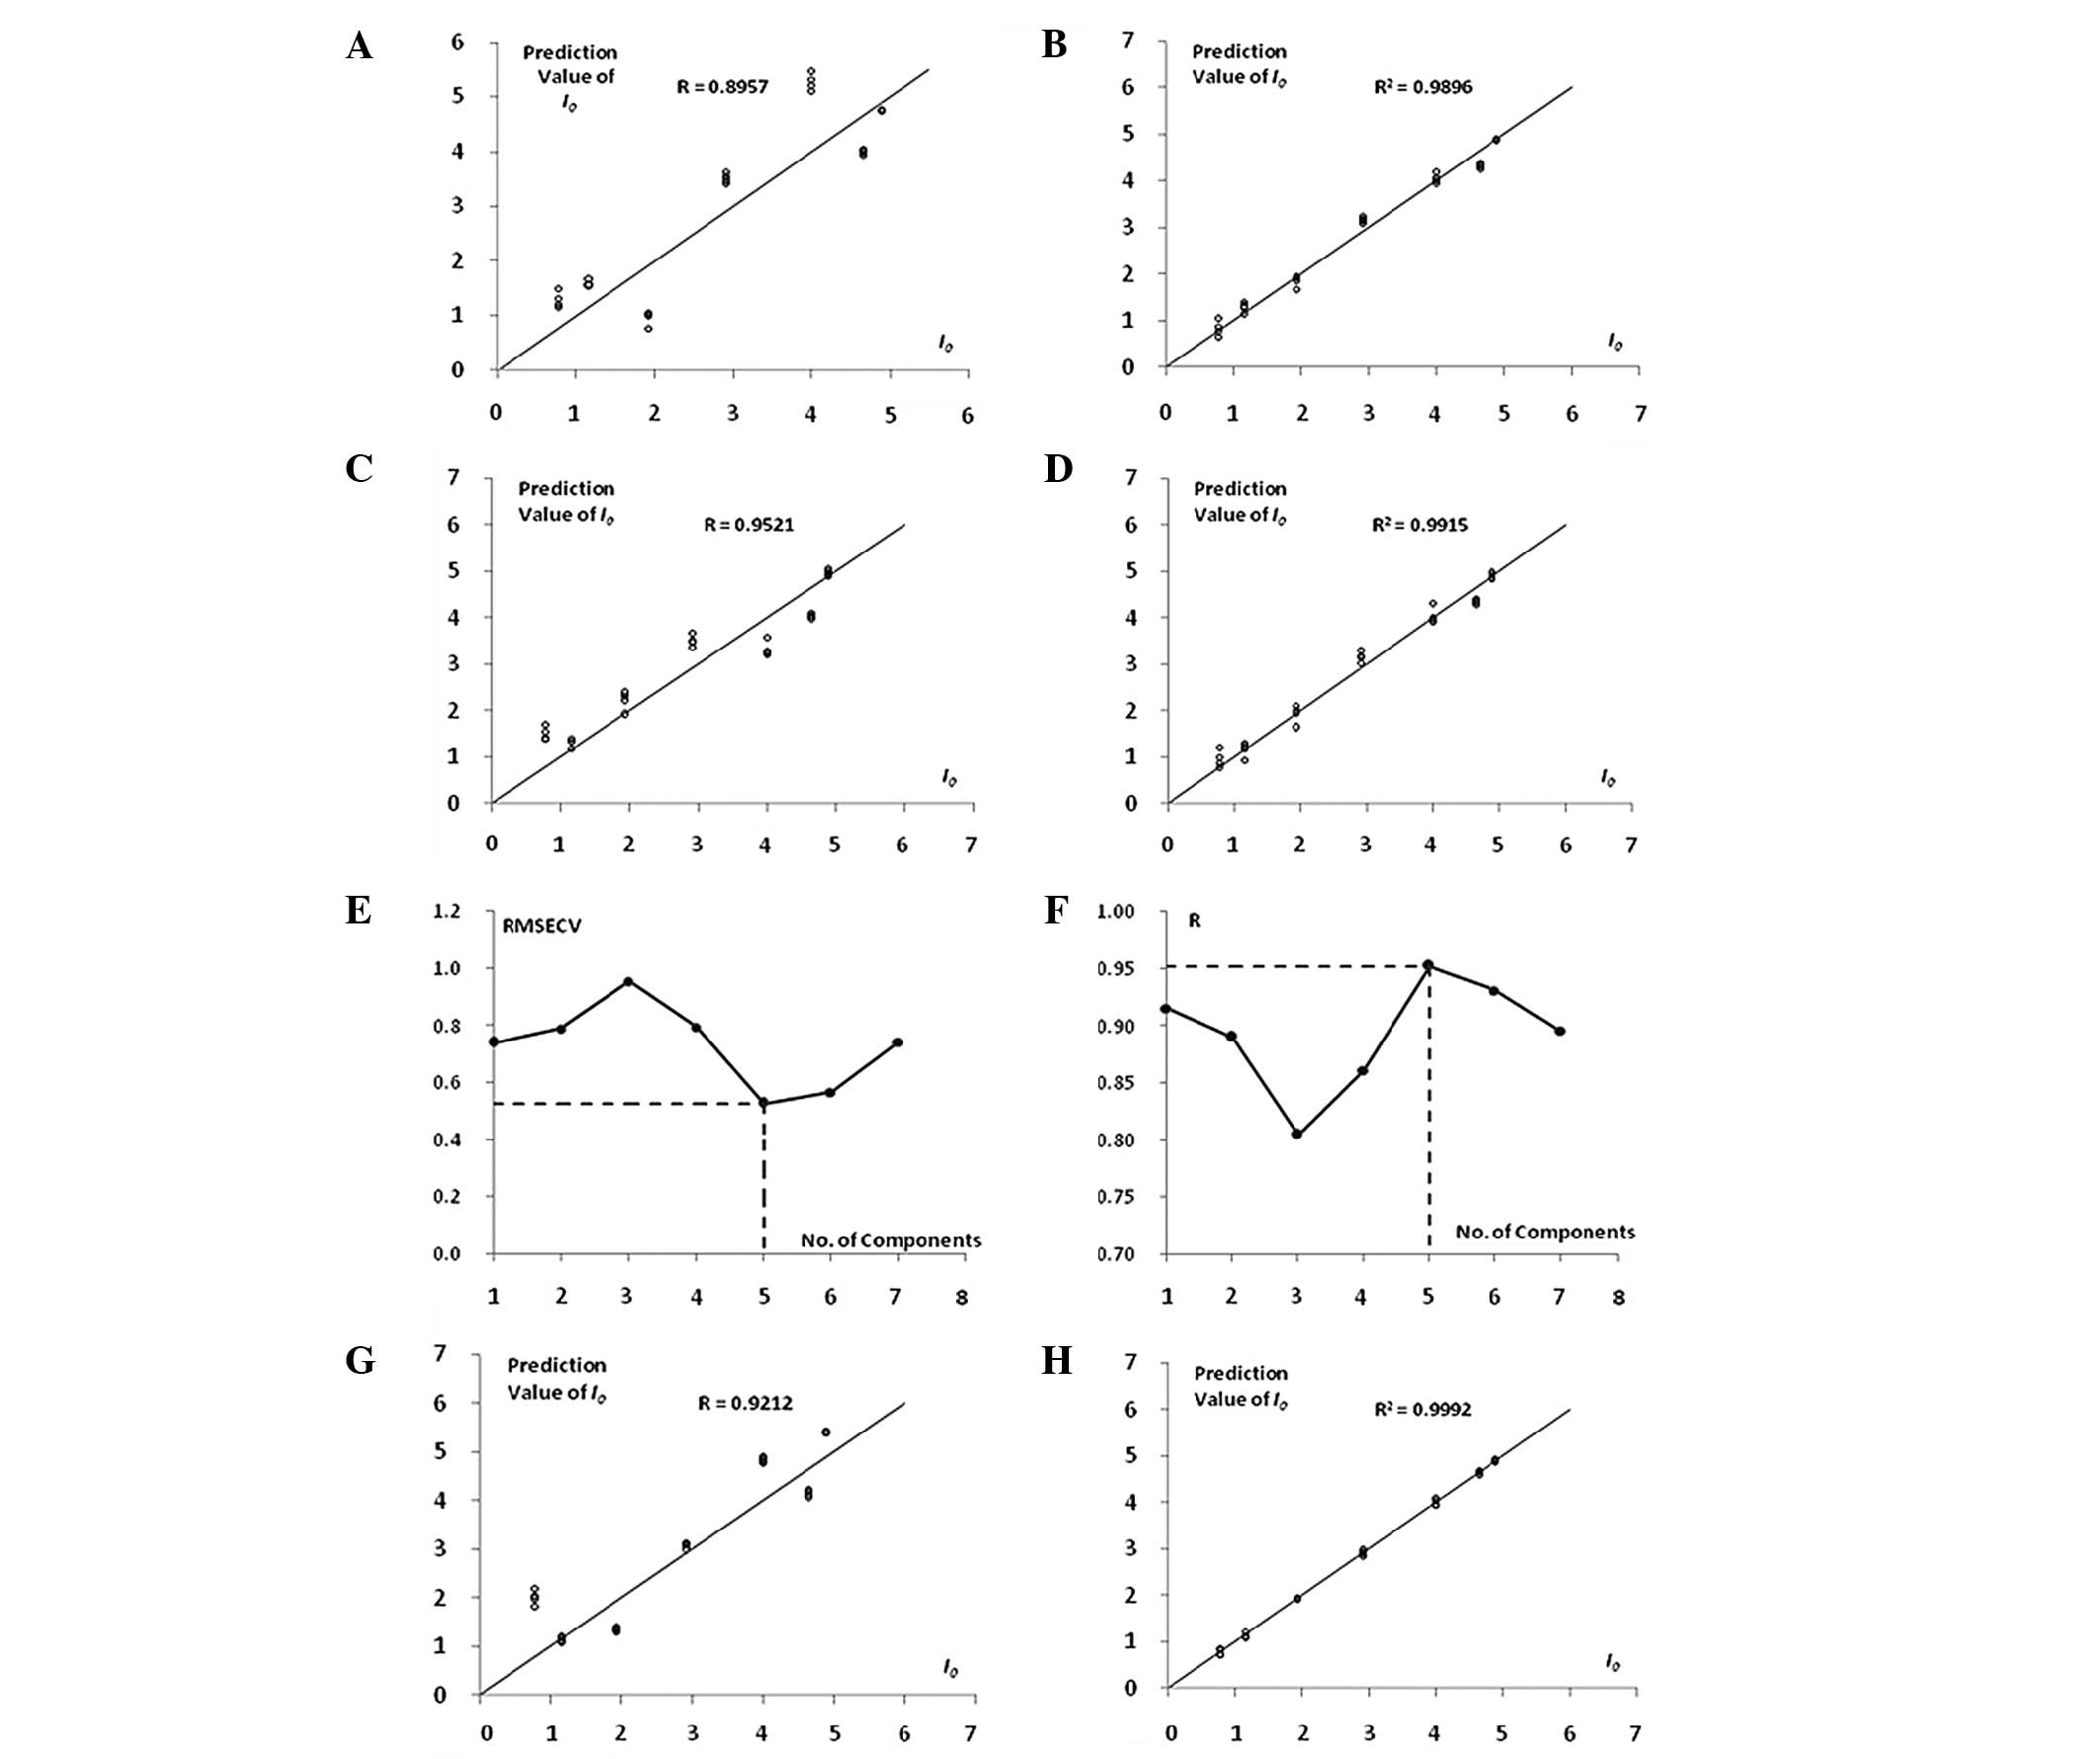
MLR
The RMSECV was 0.7440. The R of cross-validation
between the true and predicted values was 0.8957. Regarding all
data as a training set for modeling, the constant term and the
coefficients of ZZ, JE, BB, CA, GA, DA and AB in regression
equation were 15.5297, −0.0009, 0.0055, 0.0000, −0.0235, −0.0029,
0.0047 and 0.0050, respectively. The R2 was 0.9896. The
fitting charts are shown in Fig. 7A
and B.
PLS regression
The results showed that the modeling effect was the
most accurate when the number of latent variables equaled five. The
optimal RMSECV was 0.5273. The R of cross-validation between the
true and predicted values was 0.9521. Regarding all data as a
training set for modeling, the R2 was 0.9915. The
fitting charts are shown in Fig.
7C–F.
Artificial neural networks
In six parallel cross-validation tests, the RMSECV
was 0.7253±0.1656. The R of cross-validation between the true and
predicted values was 0.9011±0.0589. One of the comparisons is shown
in Fig. 7 (R=0.9212). Regarding
all data as a training set for modeling, the R2 was
0.9991±0.0002 (n=4) following four parallel trials. The fitting
charts are shown in Fig. 7G and
H.
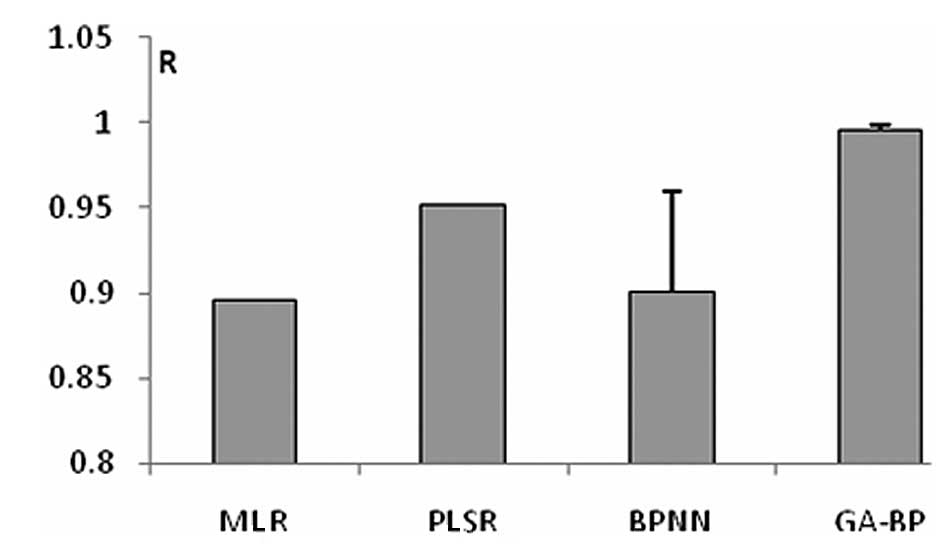
Comparison of several methods
The R values for the cross-validation between the
true and predicted values for the four methods are compared in
Fig. 8.
Discussion
The present study established a BPM of berberine
hydrochloride by combing a GA and a BPNN. Using the global
optimization ability of the GA the parameters of the BPNN, such as
initial weight, were optimized. The BPNN training function further
optimized the parameters so that they were able to play to their
advantages. The fitting degree of the model of the training set in
this study was high (R2=0.99965), the RMSEVC in the
cross-validation was 0.1398 and the R between the true and
predicted values was 0.9959, suggesting that the modeling method is
reliable and the model has satisfactory predictive ability. MLR and
PLS regression have less accuracy than GA-BP as they are linear
methods. BPNNs are non-linear, but easily fall into the local
extreme point and are not superior to the GA-BP method.
Due to the correlation between the bitterness and
concentration of drugs, it is possible to use the method used in
this study to predict the concentration of drugs with the same
system. The rational Weibull-logarithmic model has been established
and reported in a previous study (20). This model is in line with the
Weber-Fechner law (21), which is
a law explaining the logarithmic association between taste
intensity and taste stimulus in moderate stimulus conditions of the
following formula: S = KlgR (22),
where S is sensory intensity, R is stimulus intensity and K is the
constant. The model is as follows: I0 = 1.5994 ×
log10 (c), where the unit of c (concentration) is μM
(μmol/l) (R2 = 0.9665). A more accurately fitting model
was used in the present study, which is a Weibull model
(R2=0.9973, which is higher than that of the logarithmic
model).
In conclusion, the BPM created in the present study,
which is based on the e-tongue and GA-BP, may be used as a BPM for
berberine hydrochloride of different concentrations. It also
provides a reference for the generation of BPMs for other drugs.
Additionally, the algorithm used in this study provides a rapid and
accurate quantitative method for analyzing e-tongue data.
Acknowledgements
The authors thank the National Natural Science
Foundation of China for the financial support under the award no.
81001646. The authors also thank Dr Yang Yang, Professor Yuanying
Ni and the College of Food Science and Nutritional Engineering,
China Agricultural University (Beijing, China) for allowing the use
of their e-tongue systems.
References
|
1
|
Li L, Naini V and Ahmed SU: Utilization of
a modified special-cubic design and an electronic tongue for
bitterness masking formulation optimization. J Pharm Sci.
96:2723–2734. 2007. View Article : Google Scholar : PubMed/NCBI
|
|
2
|
Ross CF, Bohlscheid J and Weller K:
Influence of visual masking technique on the assessment of 2 red
wines by trained and consumer assessors. J Food Sci. 73:S279–S285.
2008. View Article : Google Scholar : PubMed/NCBI
|
|
3
|
Gaudette NJ and Pickering GJ: The efficacy
of bitter blockers on health-relevant bitterants. Journal of
Functional Foods. 4:177–184. 2012. View Article : Google Scholar
|
|
4
|
Xu J, Bovet LL and Zhao K: Taste masking
microspheres for orally disintegrating tablets. Int J Pharm.
359:63–69. 2008. View Article : Google Scholar : PubMed/NCBI
|
|
5
|
Lorenz JK, Reo JP, Hendl O, Worthington JH
and Petrossian VD: Evaluation of a taste sensor instrument
(electronic tongue) for use in formulation development. Int J
Pharm. 367:65–72. 2009. View Article : Google Scholar : PubMed/NCBI
|
|
6
|
Gupta H, Sharma A, Kumar S and Roy SK:
E-tongue: a tool for taste evaluation. Recent Pat Drug Deliv
Formul. 4:82–89. 2010. View Article : Google Scholar : PubMed/NCBI
|
|
7
|
Woertz K, Tissen C, Kleinebudde P and
Breitkreutz J: Taste sensing systems (electronic tongues) for
pharmaceutical applications. Int J Pharm. 417:256–271. 2011.
View Article : Google Scholar : PubMed/NCBI
|
|
8
|
Zheng JY and Keeney MP: Taste masking
analysis in pharmaceutical formulation development using an
electronic tongue. Int J Pharm. 310:118–124. 2006. View Article : Google Scholar : PubMed/NCBI
|
|
9
|
Choi DH, Kim NA, Nam TS, Lee S and Jeong
SH: Evaluation of taste-masking effects of pharmaceutical
sweeteners with an electronic tongue system. Drug Dev Ind Pharm.
40:308–317. 2014. View Article : Google Scholar : PubMed/NCBI
|
|
10
|
Ito M, Ikehama K, Yoshida K, Haraguchi T,
Yoshida M, Wada K and Uchida T: Bitterness prediction of
H1-antihistamines and prediction of masking effects of artificial
sweeteners using an electronic tongue. Int J Pharm. 441:121–127.
2013. View Article : Google Scholar : PubMed/NCBI
|
|
11
|
Kayumba PC, Huyghebaert N, Cordella C,
Ntawukuliryayo JD, Vervaet C and Remon JP: Quinine sulphate pellets
for flexible pediatric drug dosing: formulation development and
evaluation of taste-masking efficiency using the electronic tongue.
Eur J Pharm Biopharm. 66:460–465. 2007. View Article : Google Scholar
|
|
12
|
Arrieta ÁA, Rodríguez-Méndez ML, de Saja
JA, Blanco CA and Nimubona D: Prediction of bitterness and
alcoholic strength in beer using an electronic tongue. Food Chem.
123:642–646. 2010.
|
|
13
|
Liu R, Liu N, Shi X and Qiao Y:
Optimization of solubilizing process of Qingkailing injection based
on GA-BPNN modeling. Zhongguo Zhong Yao Za Zhi. 34:2469–2472.
2009.(In Chinese).
|
|
14
|
Xiao H and Tian Y: Prediction of mine coal
layer spontaneous combustion danger based on genetic algorithm and
BP neural networks. Procedia Engineering. 26:139–146. 2011.
View Article : Google Scholar
|
|
15
|
Ke L, Wenyan G, Xiaoliu S and Zhongfu T:
Research on the forecast model of electricity power industry loan
based on GA-BP neural network. Energy Procedia. 14:1918–1924. 2012.
View Article : Google Scholar
|
|
16
|
Karaosmanoglu K, Sayar NA, Kurnaz IA and
Akbulut BS: Assessment of Berberine as a multi-target
antimicrobial: a multi-omics study for drug discovery and
repositioning. OMICS. 18:42–53. 2014. View Article : Google Scholar : PubMed/NCBI
|
|
17
|
Apetrei C, Apetrei IM, Villanueva S, de
Saja JA, Gutierrez-Rosales F and Rodriguez-Mendez ML: Combination
of an e-nose, an e-tongue and an e-eye for the characterisation of
olive oils with different degree of bitterness. Anal Chim Acta.
663:91–97. 2010. View Article : Google Scholar : PubMed/NCBI
|
|
18
|
Kawano Y, Ito A, Sasatsu M and Machida Y:
Preparation of orally disintegrating tablets with taste-masking
function: masking effect in granules prepared with correctives
using the dry granulation method and evaluation of tablets prepared
using the taste-masked granules. Yakugaku Zasshi. 130:81–86. 2010.
View Article : Google Scholar
|
|
19
|
Wang Y, Feng Y, Wu Y, Liang S and Xu D:
Sensory evaluation of the taste of berberine hydrochloride using an
Electronic Tongue. Fitoterapia. 86:137–143. 2013. View Article : Google Scholar : PubMed/NCBI
|
|
20
|
LI XL, Zhang XF, Liu RX, Li hL, Qiu JX and
Wu ZD: Study on quantitation of bitterness intensity and
relationship between bitterness intensity. Concentration of bitter
drug. World Science and Technology-Modernization of Traditional
Chinese Medicine and Materia Medica. 15:667–671. 2013.
|
|
21
|
Fechner GT: Elements of Psychophysics.
Adler HE: 1. Holt, Rinehart and Winston, New York, NY:
1860/1966
|
|
22
|
Omür-Ozbek P and Dietrich AM: Developing
hexanal as an odor reference standard for sensory analysis of
drinking water. Water Res. 42:2598–2604. 2008.PubMed/NCBI
|