Introduction
Metabolic syndrome (MS) is composed of a group of
irregularly aggregated metabolic components with clinical
characteristics of hypertension, diabetes, abnormally regulated
glucose, metabolic disturbance of blood lipids and obesity. A
common pathological and physiological feature of MS is insulin
resistance (1). The various
components of MS are all important risk factors of cardiovascular
disease (CVD) and they play a critical role in the pathogenesis and
development of CVD. Once various abnormal metabolic components are
increased or aggravated, the prevalence of CVD increases
significantly (2,3).
Studies have revealed that the risk factors of CVD,
including disorders of lipid metabolism, hypertension, damaged
regulation of fasting blood glucose (BG) and obesity, are closely
associated with serum ferritin (SF) levels (4–7).
Compared with young individuals, older individuals are more prone
to a variety of metabolic disorders, particularly hypertension,
disorders of lipid metabolism, obesity, abnormal glucose metabolism
and hyperuricemia. However, the pathogenesis of this remains to be
investigated.
In the present study, the relationship between SF
levels and the aggregation of metabolic disorders in non-diabetic
elderly patients was investigated by analyzing data from the
physical examinations of the elderly patients.
Materials and methods
Patients
A total of 2,600 elderly individuals who visited the
Affiliated Union Hospital (Fuzhou, China) for physical examinations
from March to December 2012 were investigated in the present study.
All patients were more than 60 years old and the average age was
69.25±5.26 years. There were 1,500 males (57.69%) and 1,100 females
(42.31%). Of these, there were 1,610 individuals with normal
glucose tolerance, 890 individuals with abnormal glucose tolerance
and 100 individuals with impaired fasting glucose. According to the
exclusion criterion of the World Health Organization (WHO) in 1999,
diabetic patients were excluded (4). In addition, patients with acute
chronic inflammatory diseases, anemia, a recent blood transfusion
and use of iron, malignant tumors, autoimmune or hereditary
diseases, hyperthyroidism or alcoholism were excluded. For
experiments involving human patients, approval was obtained from
the institutional review committee of the Affiliated Union
Hospital. Informed consent was provided from each patient according
to the Declaration of Helsinki.
Parameter examinations
All patients were asked to sit relaxed for at least
5 min. Right (upper) arm brachial arterial blood pressure (BP) was
measured by a mercury column sphygmomanometer. BP was detected
three times and an average BP was recorded and analyzed.
Body weight and height were measured, to an accuracy
of 0.1 kg and 0.1 cm, respectively, using an adjusted weighing
machine and a height measuring instrument with the help of a
trained assistant. The body mass index (BMI) was calculated and the
body fat content (BFC) was evaluated using the following formulae:
Male BFC = 1.2 × BMI + 0.23 × age − 16.2; and Female BFC = 1.2 ×
BMI + 0.3 × age − 5.4.
All patients were forbidden to drink for one day
prior to the physical examination and were fasted for 10–12 h. At
7:00–8:00 a.m. on the day of physical examination, blood was drawn
from a vein in the upper arm and the blood serum was separated.
Glucose level was determined using the glucose oxidase method and
total cholesterol (TC), triglycerides (TG), uric acid and urinary
creatinine were examined using enzymatic methods. Levels of insulin
were measured by the electrochemical immunoassay method using an
electrochemical immunoassay kit (Roche Diagnostics, Basel,
Switzerland). Urinary albumin was measured by immunoturbidimetry
using a microalbumin test kit (Sigma, St. Louis, MO, USA). SF
protein levels in the serum were measured by a radioimmunoassay
method according to the manufacturer's instructions (Sigma). The
ferritin protein was detected by radioimmunoassay method and
ferritin mRNA was measured by the PCR method.
Calculation of insulin resistance and
pancreatic β-cell function indices
The homeostatic model assessment of insulin
resistance (HOMA-IR) and homeostatic model assessment of pancreatic
β-cell function (HOMA-β) indices were calculated using the
following formulae: HOMA-IR = fasting insulin (FINS; Ins0) ×
fasting blood glucose (FPG)/22.5; and HOMA-β = 20 × Ins0/(FPG -
3.5).
The following were also calculated: Quantitative
insulin sensitivity check index (QUICKI) = 1/(log fasting BG + log
FINS); insulin disposition index (DI) = HOMA-β/HOMA-IR.
Grouping of subjects
According to the diagnostic criteria for MS,
suggested by the diabetes branch of the Chinese Medical
Association, the patients were divided into the following groups:
no metabolic disorders (MS0 group, n=1,150), one metabolic disorder
(MS1 group, n=1,250), two metabolic disorders (MS2 group, n=150)
and at least three metabolic disorders (MS3 group, n=50).
Based on a normal HOMA-IR value of 1.85, when the
value was ≥2.15 this was defined as insulin resistance. Based on a
normal HOMA-β value of 50.91, when the value was >141.79 this
was defined as insulin secretion dysfunction. According to these
criteria, the patients in the present study with normal glucose
tolerance were divided into the following groups: Insulin
sensitivity + insulin secretion dysfunction (SF1 group, n=431),
insulin sensitivity + normal insulin secretion (SF2 group, n=751),
insulin resistance + insulin secretion dysfunction (SF3 group,
n=15), and insulin resistance + normal insulin secretion (SF4
group, n=436).
Statistical analysis
All measured parameters were calculated and
expressed as mean ± standard deviation. Any non-normally
distributed data were transformed by a natural logarithm. A
χ2 test was employed when comparing numerical data.
Variance was analyzed using a one-way analysis of variance (ANOVA)
and a Bonferroni correction with SPSS statistical software, version
15.0 (SPSS Inc., Chicago, IL, USA). Spearman correlation analysis
and stepwise multiple linear regression analysis were used to
analyze the correlation between SF and the metabolic indices.
P<0.05 was considered to indicate a significant difference. Data
from males and females were analyzed separately.
In the current study, the prevalence of diabetes in
patients was explored and the data stratified according to age,
gender, urban and rural living, and economic development level. The
sample size met the accuracy requirements needed to carry out the
complex survey. All calculations were weighted to represent the
total Chinese population with ages of 20 years or older according
to the nationwide census results of 2006. A χ2 test was
employed when comparing prevalence of diabetes between groups.
Continuous variables were compared using the general linear model
after adjustments for age and BMI. Abnormally distributed
continuous variables were compared after they were subjected to
logarithmic transformation. Effects of geographic zoning, lifestyle
and metabolic components on the prevalence of diabetes (odds ratio)
were analyzed by multivariate logistic regression analysis. A
backward selection method was used to select significant risk
factors for the final risk model (P<0.05). Data are presented as
a mean with 95% confidence interval or a median with the 25th to
75th percentile. SUDAAN 10.0 software (Research Triangle Institute,
Research Triangle Park, NC, USA) was used to analyze data.
Results
Comparison of clinical parameters in
different groups
As shown in Table
I, as the numbers of metabolic disorders increased, the SF
levels, BMI, systolic BP (SBP), diastolic BP (DBP), fasting BG, TC,
TG, serum uric acid (SUA), FINS, BFC, HOMA-IR, HOMA-β and urinary
albumin/creatinine ratio (UACR) increased gradually; whereas the
QUICKI and DI decreased gradually.
 | Table IComparison of the clinical indices of
each group. |
Table I
Comparison of the clinical indices of
each group.
| Patient
parameters | MS0 group | MS1 group | MS2 group | MS3 group | F-value | P-value |
|---|
| Cases
(male/female) | 1150 (650/500) | 1250 (750/500) | 150 (70/80) | 50 (30/20) | - | - |
| Ages (years) | 68.60±5.53 | 68.48±5.28 | 67.98±5.68 | 67.98±5.29 | 2.17 | >0.05 |
| BMI
(kg/m2) | 22.01±2.01 | 23.91±3.01a | 24.01±3.01a | 27.02±3.08a,b | 118.35 | <0.01 |
| SUA (μmol/l) | 315±45.23 | 333±47.03a | 353±50.63a,b | 372±49.23a–c | 17.38 | <0.01 |
| LnFINS (mU/l) | 1.60±0.5 | 1.92±0.6a | 1.94±0.7a | 2.24±0.7a,b | 92.80 | <0.01 |
| Body fat content
(%) | 31±5 | 35±6a | 36±5a | 38±6a,b,c | 156.80 | <0.01 |
| LnQUICKI | −0.95±0.11 | −1.04±0.08a | −1.03±0.10a | −1.01±0.09a–c | 91.79 | <0.01 |
| LnDI | 4.3±0.6 | 4.0±0.5a | 4.0±0.6 | 3.9±0.4 | 11.01 | <0.01 |
| LnHOMA-IR | 0.06±0.56 | 0.42±0.49a | 0.43±0.78a | 0.68±0.45a,b | 95.28 | <0.01 |
| LnHOMA-β | 4.1±0.8 | 4.4±0.7a | 4.5±0.6a | 4.6±0.7a | 35.31 | <0.01 |
| LnUACR | 2.6±1.3 | 3.1±1.1a | 3.0±1.1a,b | 3.4±1.7a,b | 13.79 | <0.01 |
| LnSF | 5.2±0.7 | 5.4±0.7a | 5.4±0.5a | 5.6±0.7a–c | 11.38 | <0.01 |
Comparison of concentrations of SF in
patients with different characteristics
SF levels in patients with high TG (≥1.7 mmol/l,
n=1,410) were higher than those in patients with normal TG
(n=1,190; 5.3±0.6 vs. 5.2±0.5 μg/l, F=1.02, P=0.001). The SF levels
in patients with high TC (≥5.7 mmol/l, n=1,235) were higher than
those in patients with normal TC (n=1,365; 5.4±0.6 vs. 5.3±0.5
μg/l, F=1.72, P=0.001). Levels of SF in patients with hyperuricemia
(SUA≥430 μmol/l, n=1,410) were higher than those in the group with
normal SUA (n=1,190; 5.4±0.6 vs. 5.3±0.5 μg/l, F=1.42, P=0.001).
Levels of SF in obese patients (BMI ≥25 kg/m2, n=810)
were higher than those in patients of a healthy weight (n=1,790;
5.5±0.6 vs. 5.4±0.5 μg/l, F=3.12, P=0.001). Levels of SF in
patients with hypertension (SBP ≥140 mm Hg or DBP ≥90 mm Hg,
n=1,760) were higher than those with normal blood pressure (n=840;
5.3±0.5 vs. 5.2±0.4 μg/l, F=1.32, P=0.001). Levels of SF in males
with normal glucose tolerance were higher than those in females
with the same glucose tolerance level (5.3±0.5 vs. 5.2±0.6 μg/l,
F=1.12, P=0.001). Levels of SF in males with metabolic
abnormalities were higher than those in the corresponding group of
females (5.5±0.5 vs. 5.4±0.6 μg/l, F=4.12, P=0.001). The levels of
SF in males were also higher than those in the corresponding group
of females for patients with high TC (5.6±0.6 vs. 5.5±0.5 μg/l,
F=6.12, P=0.001), hypertension (5.5±0.6 vs. 5.4±0.5 μg/l, F=4.72,
P=0.001), hyperuricemia (5.7±0.6 vs. 5.6±0.5 μg/l, F=3.82, P=0.001)
and obesity (5.5±0.6 vs. 5.4±0.5 μg/l, F=3.72, P=0.001). No
significant differences were identified between the groups SF1 and
SF2 (5.2±0.6 vs. 5.2±0.5 μg/l, P=1.02), and between the groups SF3
and SF4 (5.7±0.7 vs. 5.7±0.6 μg/l, P=0.71) with respect to levels
of SF. However, levels of SF in groups SF3 and SF4 were
significantly higher than in groups SF1 and SF2 (P<0.01).
SF mRNA and protein expression in
different groups
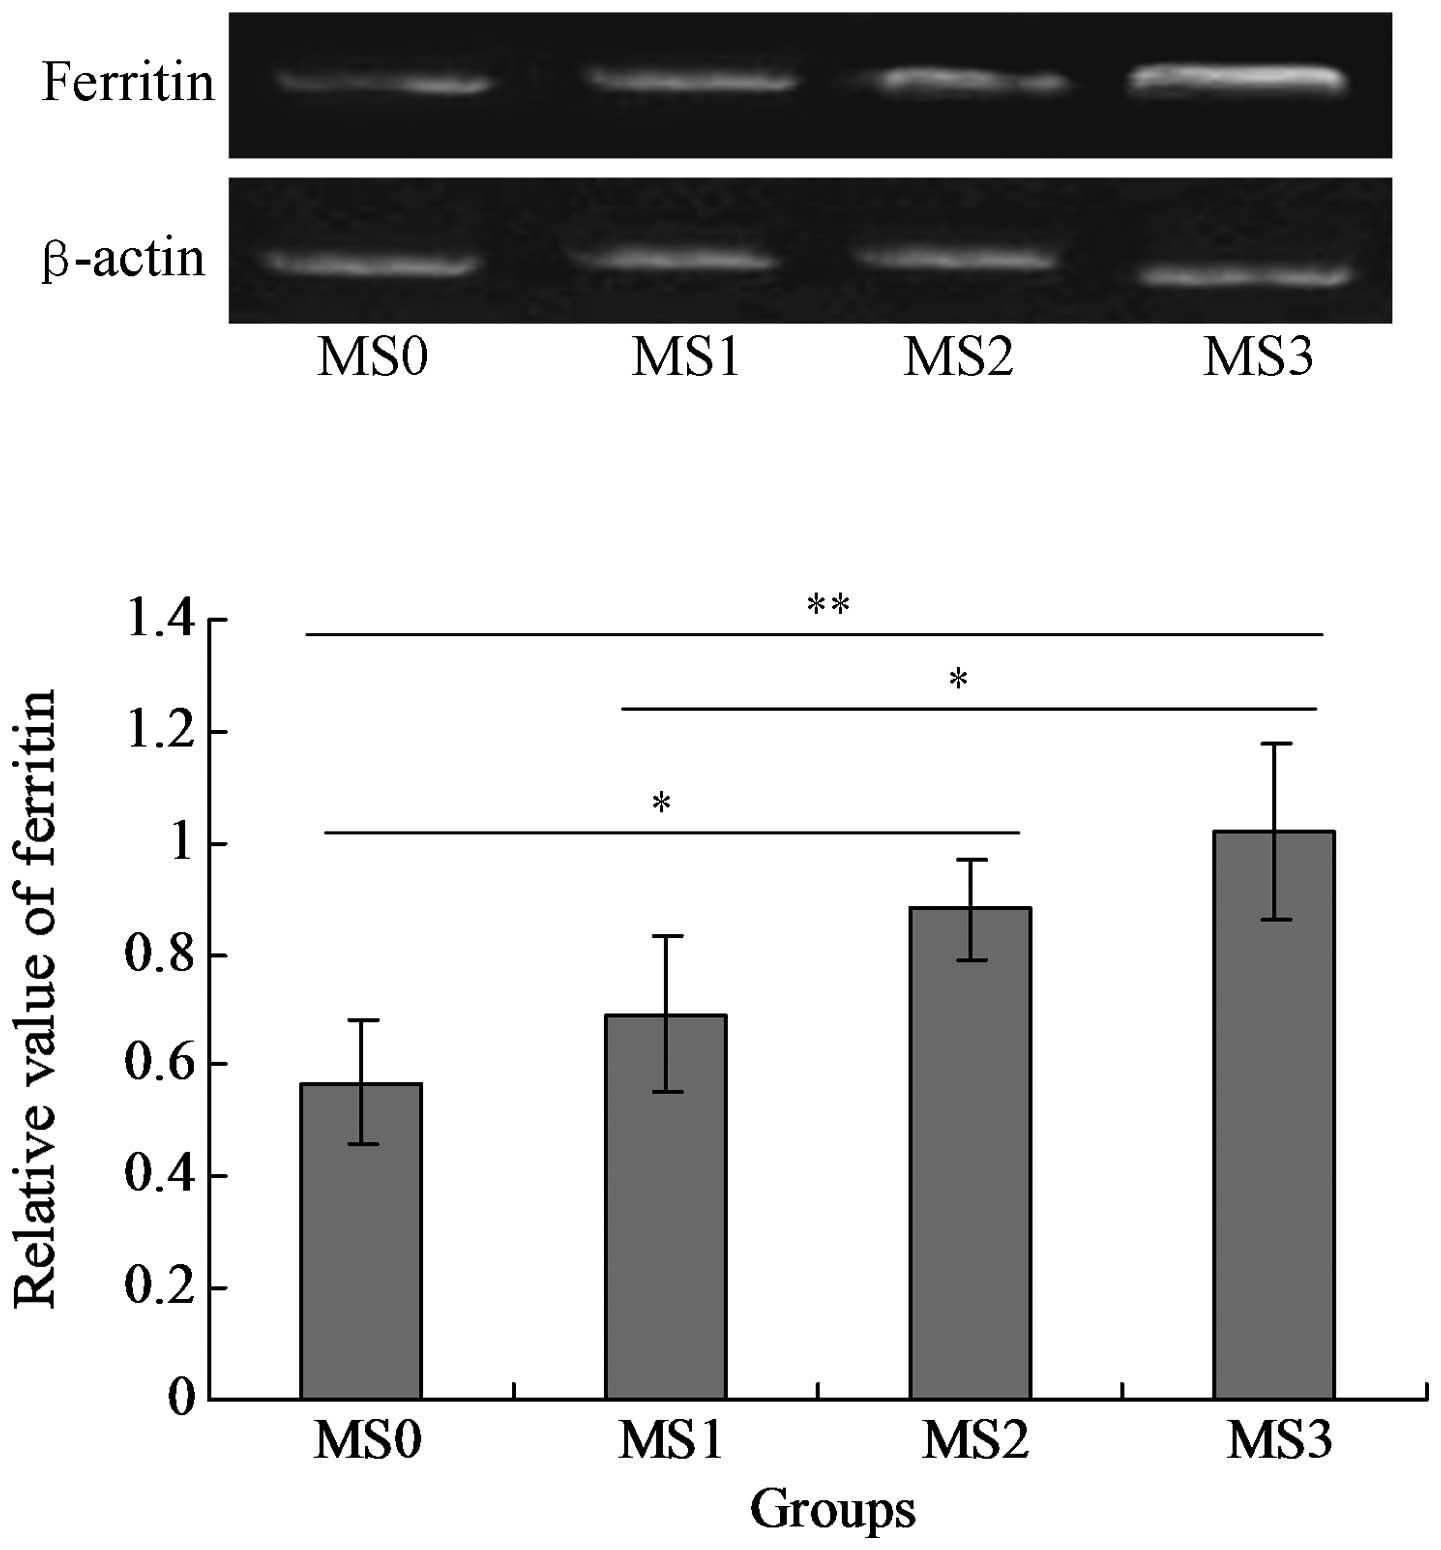
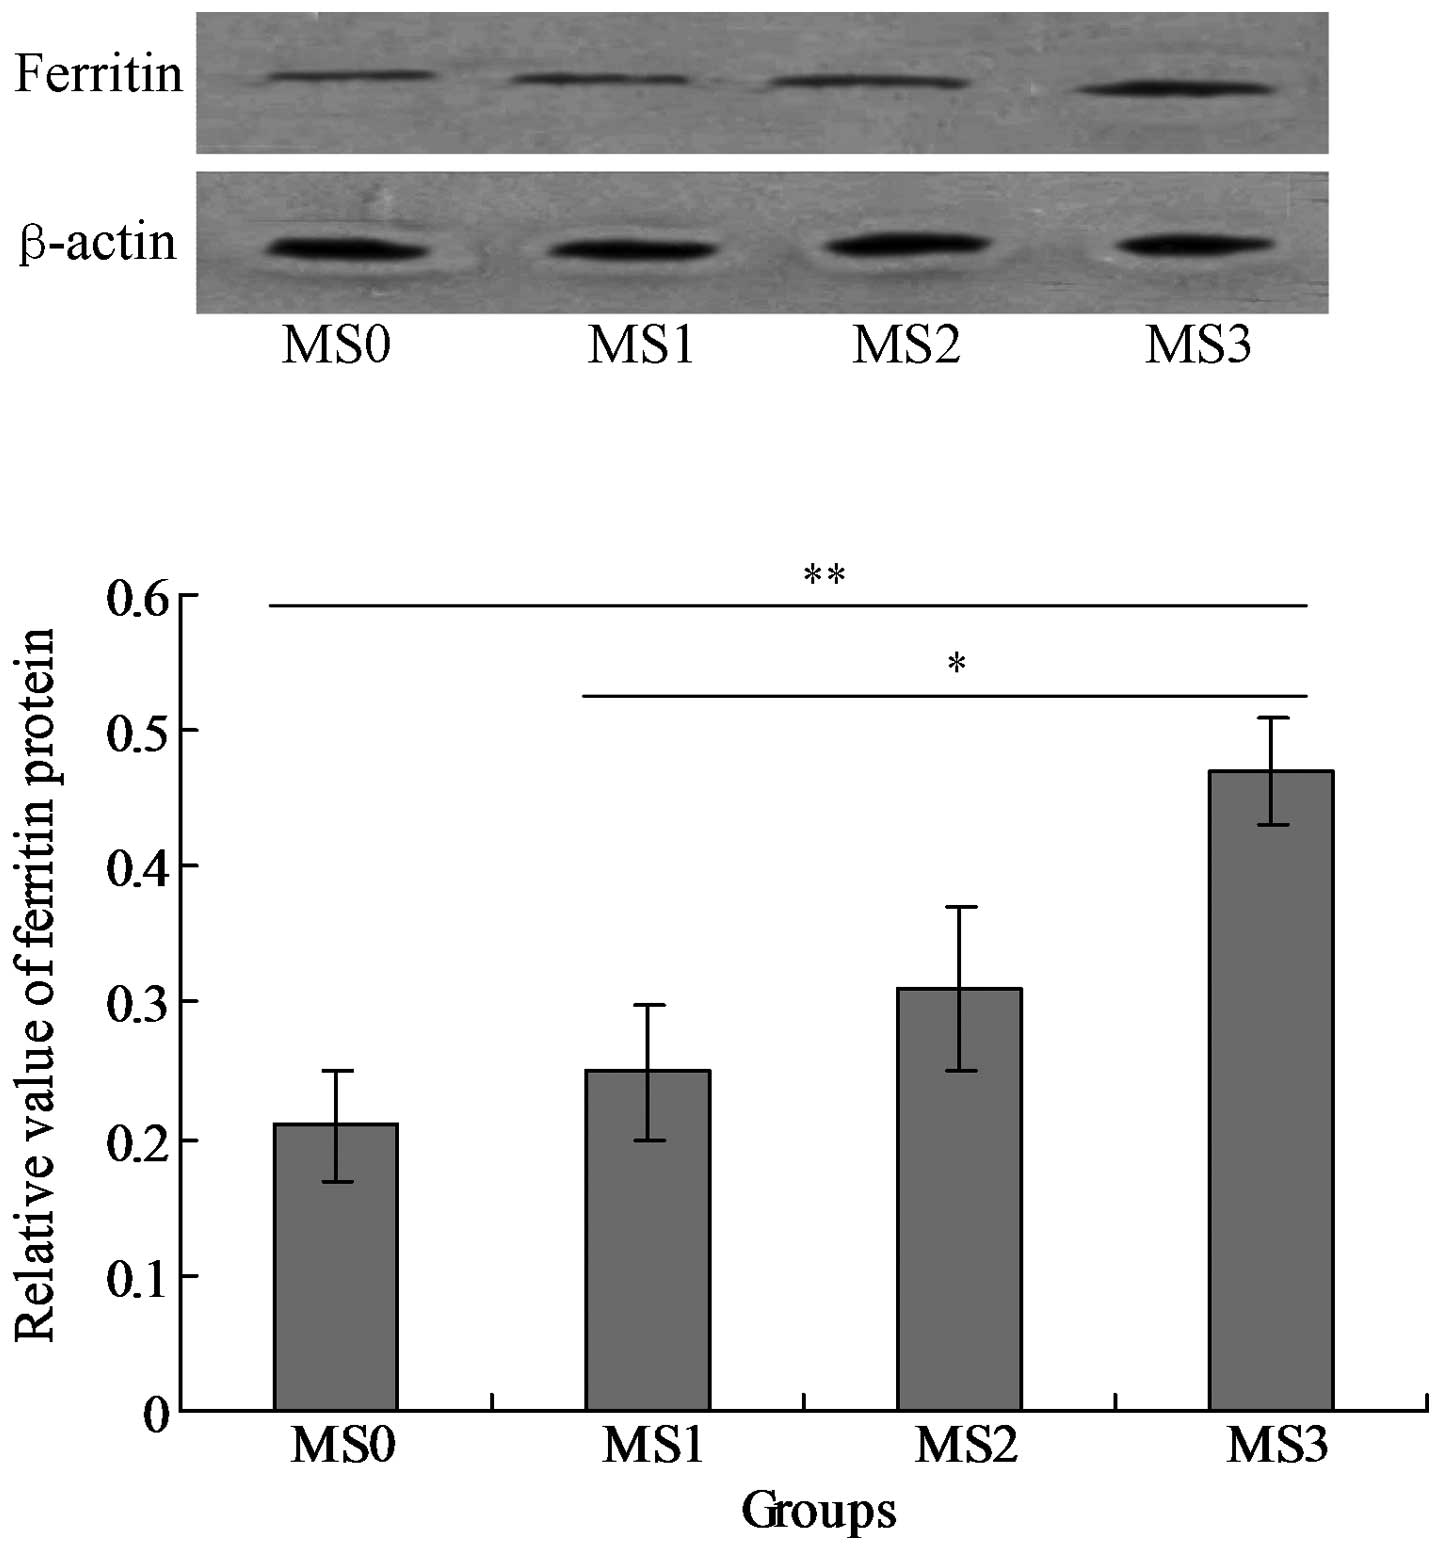
The mRNA and protein expression levels of SF were
detected in the blood serum samples. The results indicated that SF
was expressed in the four groups MS0-MS4, however the level of SF
(mRNA) expressed in group MS3 was significantly higher compared
with that in the other three groups (P<0.05; Fig. 1). The SF protein was also expressed
in all of the groups and the MS3 group expressed the highest level
of SF protein among all the groups (P<0.05; Fig. 2).
Results of Spearman correlation
analysis
Results demonstrated that there were positive
correlations between levels of SF and TG (r=0.10, P=0.001), TC
(r=0.08, P=0.001), SUA (r=0.13, P=0.001), BMI (r=0.12, P=0.001),
fasting BG (r=0.09, P=0.001), 2 h BG (r=0.11, P=0.001), FINS
(r=0.17, P=0.001), HOMA-IR (r=0.19, P=0.001) and HOMA-β (r=0.12,
P=0.001). However, SF levels were negatively correlated with QUICKI
(r=−0.19, P=0.001) and DI (r=−0.10, P=0.001).
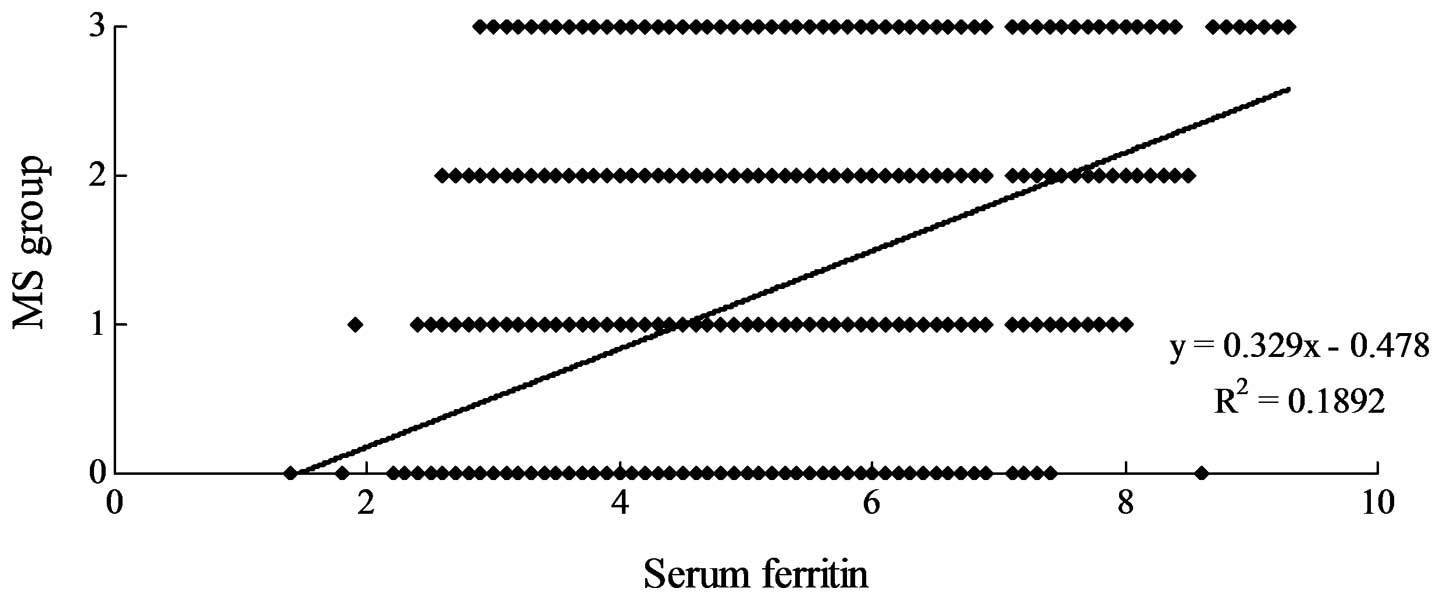
Most notably, however, the SF level was positively
correlated with the number of metabolic disorders (Fig. 3, r=0.3186, P<0.05).
Multiple regression analysis of SF and
the related metabolic indices
SF was used as a dependent variable and other
related metabolic indices including BMI, SBP, DBP, fasting BG, TC,
TG, SUA, BFC, FINS, HOMA-IR, UACR, FINS and DI were used as
independent variables. Multiple regression analysis was conducted.
The results in Table II
demonstrate that BMI, TG, TC, SUA and the HOMA-IR are independent
risk factors for increased levels of SF in non-diabetic elderly
patients with disturbed metabolism.
| Table IIResults of stepwise regression
analysis between serum ferritin and metabolism. |
Table II
Results of stepwise regression
analysis between serum ferritin and metabolism.
| Factor | B-value | SE | β | P-value |
|---|
| Constant | 112.01 | 90.61 | | >0.05 |
| Triglyceride | 0.69 | 0.018 | 0.141 | <0.0001 |
| HOMA-IR | 0.21 | 0.020 | 0.102 | <0.0001 |
| Body mass
index | 0.09 | 0.003 | 0.034 | <0.0001 |
| Total
cholesterol | 0.18 | 0.061 | 0.081 | <0.001 |
| Serum uric
acid | 0.20 | 0.072 | 0.068 | <0.001 |
Discussion
The correlation between SF level and the aggregation
of metabolic disorders in non-diabetic elderly patients was
investigated in the present study. A total of 2,600 individuals
were enrolled in the study. The blood pressure (BP), height,
weight, lipid profiles, blood glucose (BG), body mass index (BMI),
fasting insulin (FINS), serum uric acid (SUA), urinary
album/creatinine ratio (UACR) and SF levels were measured. A
homeostatic model was used to evaluate insulin resistance (HOMA-IR)
and β-cell function (HOMA-β). The insulin sensitivity check index
(QUICKI) and disposition index (DI) were calculated. Those with
normal glucose tolerance were assigned to four groups (SF1, SF2,
SF3 and SF4) according to the results of HOMA-IR and HOMA-β. The
χ2 test and Spearman analysis were used for data
comparison.
The level of SF, BMI, systolic blood pressure (SBP),
diastolic blood pressure (DBP), SUA, total cholesterol (TC),
triglyceride (TG), FINS, body fat content (BFC), HOMA-IR, and UACR
significantly increased, while QUICKI and DI decreased, when the
number of metabolic disorders increased. Patients with high TG,
high TC, high SUA and obesity showed higher SF levels than those
with normal TG, normal TC, normal SUA and normal weight,
respectively (P<0.01). Male patients with metabolic disorders
(high TG, high TC, high BP, high SUA and obesity) had higher SF
levels than female patients with the same disorders (P<0.01).
The 2 h BG, FINS, BMI, TC, TG, SUA, HOMA-IR and HOMA-β values were
positively correlated with SF, while DI and QUICKI were negatively
correlated with SF (P<0.01). Stepwise regression analysis showed
that HOMA-IR, BMI, TC, TG and SUA were risk factors of SF.
The level of SF in the metabolic disorders of
non-diabetic elderly individuals may be significantly related to
the clustering of the metabolic disorders. Dyslipidemia, obesity,
disorders of purine metabolism and insulin resistance may be
important risk factors for higher SF levels in the elderly.
SF is the major storage form, and an important
source of iron in the body. It exists in two states; appoferritin
(non-iron state) and the carrying state (containing Fe3+
ions). The ability of SF to bind and release iron allows it to
maintain stability of hemoglobin iron supply, meaning that levels
of iron remain regulated in vivo. Iron in vivo exists
in a variety of forms under a dynamic balance, and iron overload is
associated with many diseases. A number of studies have revealed
that cardiovascular risk factors, such as dyslipidemia,
hypertension, obesity, fasting BG, increased insulin and body iron
stores are correlated. These include a study by Williams et
al, which identified that TG levels, high density lipoprotein
levels, BMI anomalies and SF levels (8) were closely correlated. Piperno et
al revealed that the SF concentration in patients with
hypertension was significantly higher than that in the normal
population (9), which has been
confirmed by further study (10,11).
The Deng et al study identified a close relationship between
SF and blood uric acid (12).
Disorders of lipid metabolism, obesity, hypertension, hyperuricemia
and abnormal glucose metabolism are pathological states that are
often aggregated in the elderly and are major constituents of MS;
therefore, elderly individuals with more than one type of metabolic
disorder are most likely to exhibit abnormal SF levels. A number of
studies have suggested that SF is a risk factor for MS. A study by
Bozzini et al demonstrated that higher SF levels increased
the prevalence of MS (13). The
study revealed that with the increase in metabolic disorders in
elderly individuals, levels of SF, serum glucose and the insulin
resistance index gradually increased. Furthermore, the SF levels
were higher in insulin resistant patients than in insulin sensitive
patients, regardless of the loss of function of islet cells in the
insulin resistant groups. Following correction for confounding
variables, other MS-associated factors verified to be independently
correlated with SF levels were BMI, TC, TG, SUA and HOMA-IR.
A number of hypotheses for how elevated SF causes
metabolic disorders may be considered. i) Iron is able to catalyze
lipid peroxidation in vivo, producing numerous free radicals
that induce body tissue injury (3,4).
This results in the functioning of pancreatic islet cells becoming
impaired leading to insulin resistance. The oral glucose tolerance
test (OGTT) demonstrated that in patients with hemochromatosis,
iron overload may cause the liver to develop insulin uptake and
utilization disorders, thereby inducing hyperinsulinemia (4). One study indicated that excessive
iron deposition in pancreatic β-cells directly affects insulin
secretion (5). Another study
revealed that bleeding may reduce insulin resistance by reducing
iron load (14). Thus, the
overload of iron may be influenced by hepatic uptake and
utilization of insulin, which may cause insulin resistance
(5,9), further confirming that iron proteins
may cause or exacerbate insulin resistance. The central aspect of
MS is insulin resistance, while iron proteins are involved in the
pathogenesis of MS. ii) A high iron load may induce and aggravate
disorders of glucose metabolism. Conversely, high blood glucose may
have a long-term effect on iron metabolism and iron load. Thus, the
roles of iron and glucose metabolism may be bidirectional, acting
on each other. This may play a key role in oxidative stress
(15). ii) The close association
between iron protein and inflammation has been confirmed by many
studies and numerous scholars consider that ferritin may be an
inflammatory factor (5,9,14,15).
One such study has demonstrated this in the long-term process of
chronic low-grade inflammation of MS patients (16). Obesity is an important component of
MS and is one of its main risk factors due to the close
relationship between obesity and a variety of metabolic disorders.
A large number of epidemiological studies have revealed that
obesity and inflammation are two manifestations of MS (15–17).
Certain factors, such as C-reactive proteins, also have
inflammatory functions and are considered indicators of
inflammatory disease activity. These inflammatory factors are able
to prevent the release of free iron from tissues, decrease the
total iron binding capacity and decrease the protein levels of
serum iron and SF (17). Thus, it
may be inferred that in metabolic disorders, ferritin and
inflammatory reactions act reciprocally to form a vicious spiral
that further exacerbates tissue injury and dysfunction, increased
insulin resistance, and ultimately lead to the development of
metabolic syndrome. iv) A number of studies have demonstrated close
correlations of blood uric acid with cardiovascular disease,
dyslipidemia and diabetes, and indicated that hyperuricemia is one
of the most important risk factors of cardiovascular disease and is
a factor and marker of metabolic disease. Numerous scholars
consider that hyperuricemia is a predictor of the risk of early
type 2 diabetes and is a manifestation of lipid metabolism disorder
(9,15,17).
Since hyperuricemia is also a characteristic of MS, it is likely to
play an important role in tracking the progress of the occurrence
of MS. The Deng Xiaowei study also revealed that blood uric acid
and SF are closely correlated (12). In addition, SUA is considered to be
an inflammatory factor and is involved in the occurrence of MS
through the development of a chronic low-grade inflammatory
state.
The present study demonstrated that
hypertriglyceridemia and hypercholesterolemia caused a significant
increase in SF level, even after adjustment for confounding
factors. This is consistent with the findings from the study by
El-Gebali et al (18) and
suggests that iron overload has an important effect on triglyceride
and cholesterol metabolism. A number of studies have confirmed the
close association between SF and lipid metabolism. Iron ions may
cause endothelial cell injury by promoting the low density
lipoprotein oxidative modification of arterial smooth muscle cells.
Modified low density lipoproteins easily adhere to the artery wall,
resulting in high cholesterol and other lipid disorders. The cause
of elevated SF levels in obese patients may be due to obesity
itself, as it is often accompanied by abnormal blood lipid and
glucose metabolism. It may also relate to an increase in the
synthesis and release of lipids in the blood. However, the exact
mechanism is not entirely clear. A study by Zhang et al
revealed that TC, TG and low density lipoprotein cholesterol levels
in children with obesity were significantly higher than those in
children of a normal weigh and identified that SF and TG were
significantly associated (19). A
study by Piperno et al suggested that SF levels were higher
in males with hypertension than in those without the condition
(20). The current study also
demonstrated that hypertension is closely associated with the SF
level.
In summary, SF and multiple metabolic disorders in
the elderly are closely correlated. Obesity, dyslipidemia,
hyperuricemia and insulin resistance are independent risk factors
for elevated SF levels in elderly patients. SF increases the risk
of MS factors; the higher the SF concentration, the higher the
metabolic disorder severity and the more frequent the MS incidence
rate. The ability to identify SF levels, as well as their timely
monitoring, may be helpful in screening elderly patients for early
signs of metabolic disorders and play an important role in the
early prevention and treatment of MS. Active weight control and the
correction of blood lipid and purine metabolic disorders to improve
insulin resistance contributes to preventing cardiovascular and
cerebrovascular disease, prolonging life expectancy and improving
quality of life for the elderly. Whether reducing iron protein is
able to improve metabolic disorders and allow the early prevention
of cardiovascular and cerebrovascular diseases has not yet been
fully demonstrated and pends further study.
References
|
1
|
Leiva E, Mujica V, Palomo I, Orrego R,
Guzmán L, Núñez S, Moore-Carrasco R, Icaza G and Díaz N:
High-sensitivity C-reactive protein and liver enzymes in
individuals with metabolic syndrome in Talca, Chile. Exp Ther Med.
1:175–179. 2010.PubMed/NCBI
|
|
2
|
Jennings JR, Heim AF, Kuan DC, Gianaros
PJ, Muldoon MF and Manuck SB: Use of total cerebral blood flow as
an imaging biomarker of known cardiovascular risks. Stroke.
44:2480–2485. 2013. View Article : Google Scholar : PubMed/NCBI
|
|
3
|
Ginsberg H: Statins in cardiometabolic
disease: what makes pitavastatin different? Cardiovasc Diabetol.
12(Suppl 1): S12013. View Article : Google Scholar : PubMed/NCBI
|
|
4
|
Haraguchi K, Uto H, Ohnou N, Tokunaga M,
Tokunaga M, Utsunomiya A, Hanada S and Tsubouchi H: Serum
prohepcidin levels are potential prognostic markers in patients
with multiple myeloma. Exp Ther Med. 4:581–588. 2012.PubMed/NCBI
|
|
5
|
Wilson JG, Lindquist JH, Grambow SC, Crook
ED and Maher JF: Potential role of increased iron stores in
diabetes. Am J Med Sci. 325:332–339. 2003. View Article : Google Scholar : PubMed/NCBI
|
|
6
|
Wolff SP: Diabetes mellitus and free
radicals. Free radicals, transition metals and oxidative stress in
the aetiology of diabetes mellitus and complications. Br Med Bull.
49:642–652. 1993.PubMed/NCBI
|
|
7
|
George DK, Goldwurm S, MacDonald GA,
Cowley LL, Walker NI, Ward PJ, Jazwinska EC and Powell LW:
Increased hepatic iron concentration in nonalcoholic
steatohepatitis is associated with increased fibrosis.
Gastroenterology. 114:311–318. 1998. View Article : Google Scholar : PubMed/NCBI
|
|
8
|
Williams MJ, Poulton R and Williams S:
Relationship of serum ferritin with cardiovascular risk factors and
inflammation in young men and women. Atherosclerosis. 165:179–184.
2002. View Article : Google Scholar : PubMed/NCBI
|
|
9
|
Piperno A, Trombini P, Gelosa M, Mauri V,
Pecci V, Vergani A, Salvioni A, Mariani R and Mancia G: Increased
serum ferritin is common in men with essential hypertension. J
Hypertens. 20:1513–1518. 2002. View Article : Google Scholar : PubMed/NCBI
|
|
10
|
Sharifi F, Nasab NM and Zadeh HJ: Elevated
serum ferritin concentrations in prediabetic subjects. Diab Vasc
Dis Res. 5:15–18. 2008. View Article : Google Scholar : PubMed/NCBI
|
|
11
|
Mainous AG, Weinberg ED, Diaz VA, Johnson
SP, Hulihan MM and Grant AM: Calcium channel blocker use and serum
ferritin in adults with hypertension. Biometals. 25:563–568. 2012.
View Article : Google Scholar : PubMed/NCBI
|
|
12
|
Deng X, Ma C-M and Liu B: The metabolism
of healthy crowd in syndrome study on the correlation between
diabetes and serum ferritin. Chin J Heal Manag. 6:271–272.
2012.
|
|
13
|
Bozzini C, Girelli D, Olivieri O,
Martinelli N, Bassi A, De Matteis G, Tenuti I, Lotto V, Friso S,
Pizzolo F and Corrocher R: Prevalance of body iron excess in the
metabolic syndrome. Diabetes Care. 28:2061–2063. 2005. View Article : Google Scholar : PubMed/NCBI
|
|
14
|
Fernández-Real JM1, Peñarroja G, Castro A,
García-Bragado F, Hernández-Aguado I and Ricart W: Blood letting in
high-ferritin type 2 diabetes: effects on insulin sensitivity and
beta-cell function. Diabetes. 51:1000–1004. 2002.PubMed/NCBI
|
|
15
|
Vari IS, Balkau B, Kettaneh A, Andre P,
Tichet J, Fumeron F, Caces E, Marre M and Grandchamp B: Ferritin
and transferrin are associated with metabolic syndrome
abnormalities and their change over time in a general population.
Diabetes Care. 30:1795–1801. 2007. View Article : Google Scholar : PubMed/NCBI
|
|
16
|
Wärnberg J and Marcos A: Low grade
inflammation and the metabolic syndrome in children and
adolescents. Curr Opin Lipidol. 19:11–15. 2008.PubMed/NCBI
|
|
17
|
Lu Y, Shen ZH and Li HW: Effect of
lifestyle intervention on metabolic syndrome artery in patients
with early lesion detection index. Chinese Journal of Health
Management. 6:45–49. 2012.(In Chinese).
|
|
18
|
El-Gebali HH, Tahir SA, Haider SS and
El-Fakhri MM: Lipid peroxidative damage in the erythrocytes and
elevation of serum LDL-cholesterol, apolipoprotein-B, ferritin and
uric with age and in coronary heart disease patients. Saudi Med J.
21:184–189. 2000.PubMed/NCBI
|
|
19
|
Zhang J, Liu ZJ and Sun LP: Obesity
children blood lipid, serum ferritin and fatty liver in simple.
Chinese Journal of Child Health Care. 14:231–232. 2006.(In
Chinese).
|
|
20
|
Piperno A, Trombini P, Gelosa M, Mauri V,
Pecci V, Vergani A, Salvioni A, Mariani R and Mancia G: Increased
serum ferritin is common in men with essential hypertension. J
Hypertens. 20:1513–1518. 2002. View Article : Google Scholar : PubMed/NCBI
|