Introduction
Type 2 diabetes mellitus (T2DM) and impaired glucose
tolerance (IGT) results from an interaction between genetic and
environmental factors (1). Current
evidence favors a two-step development of T2DM (2–5).
During step one, individuals with normal glucose tolerance (NGT)
progress to IGT with insulin resistance as the primary determinant.
In step two, IGT advances to T2DM as a result of a progressive
decline in β-cell function (1–3,6). The
genetic background causes insulin resistance and β-cell failure.
Polymorphisms in genes that are involved in insulin secretion have
been identified, and responses may modify individual disease
susceptibility; however, in large population-based studies only a
few polymorphisms in these genes have been shown to influence the
incidence of diabetes (7–9).
microRNAs (miRNAs) have been implicated in the
pathogenesis of numerous human diseases (10). There is increasing evidence that
miRNAs are also involved in the pathogenesis of metabolic diseases,
including diabetes mellitus. However, few miRNAs have been
investigated in pancreatic β cells (11–15).
miRNAs are important for β-cell development, as deletion of the
enzyme Dicer results in a severe loss of these cells (16). miR-375 is one of the most
abundant miRNAs in β cells (11)
and is necessary for their proper development and maintenance.
However, overexpression of miR-375 suppresses
glucose-induced insulin secretion, and conversely, inhibition of
endogenous miR-375 function enhances insulin secretion,
suggesting that miR-375 is a negative regulator of β-cell
exocytosis (11). Despite the
apparent importance of this miRNA, the regulation of miR-375
remains poorly understood.
A study demonstrated that there is an important link
between methylation, gene dosage effects, and diabetes (17). Methylation has an important role in
regulating gene expression, including the expression of genes
essential for the strict maintenance of normal blood glucose
levels. miR-375 is located in an intergenic region and has
an independent promoter containing CpG islands. Since CpG islands
are the structural basis for regulation by methylation, it was
hypothesized in the present study that differential expression and
CpG methylation of miR-375 may have a role in the
development of IGT and T2DM.
In this study, changes in miR-375 expression
were investigated and the quantitative methylation status of CpG
islands within the miR-375 promoter was measured to
determine whether aberrant promoter methylation of miR-375
occurred in NGT, IGT and T2DM, and whether the patterns of
methylation affect miR-375 expression.
Materials and methods
Patients
From 2010 to 2012, data were collected from the
Departments of Endocrinology and Metabolism at Shihezi University
School of Medicine (Shihezi, China). Patients with T2DM (n=54), IGT
(n=44) and NGT (n=53, as controls) were recruited in this study.
Patients with T2DM (28 men and 26 women, mean age 52.9±9.7 years)
had been hospitalized for treatment of poor glucose control.
Patients with IGT (23 men and 21 women, mean age 54.3±8.6 years)
and control patients (23 men and 30 women, mean age 52.9±9.4 years)
were recruited from the patients who underwent health examinations
at the First Affiliated Hospital, Shihezi University School of
Medicine. All patients underwent a standard oral glucose tolerance
test, as recommended by the American Diabetes Association.
Diagnosis of T2DM and IGT were based on the World Health
Organization criteria (1999) (18). Any patient suspected of having any
infectious disease shortly prior to or during the study was
excluded from study, as were patients with autoimmune diseases. All
patients gave informed written consent prior to the start of the
study. This study was conducted in accordance with the principles
of the Declaration of Helsinki. The present study was approved by
the ethics committee of the Shihezi university.
Nucleic acid isolation
RNA was isolated from plasma samples using the
miRNeasy Mini kit (Cat. no. 217004; Qiagen, Valencia, CA, USA) and
was quantified using absorption measurements at 260 nm (Toption
Instrument Co., Ltd, Xi’an, China). Genomic DNA was isolated using
the DNeasy Blood and Tissue kit (Qiagen) and was quantified
spectrophotometrically at 260 nm (Toption Instrument Co., Ltd).
Quantitative polymerase chain reaction
(qPCR)
qPCR was performed using an ABI Prism 7500 Fast
Real-time PCR system (Applied Biosystems, Foster City, CA, USA),
Taqman Universal PCR Master mix (Applied Biosystems), a Taqman
Reverse Transcription kit (Applied Biosystems), Taqman MicroRNA
assays (Applied Biosystems), and Human Panel Early Access kit
(Applied Biosystems) in accordance with the manufacturer’s
instructions. Expression levels of miRNAs were based on the amount
of the target message relative to that of the microRNA-16
transcript as a control to normalize the initial input of total
RNA. PCR was performed under the following conditions: 50°C for 2
min then 95°C for 10 min, followed by 40 cycles at 95°C for 15 sec
and 60°C for 1 min.
Sequenom methylation analysis
To quantify the methylation levels of the
miR-375 CpG islands in clinical samples, the high-throughput
MassARRAY platform (Sequenom, Inc., San Diego, CA, USA) was used.
Briefly, bisulfite-treated DNA was amplified with primers for the
miR-375 CpG islands. The primers were designed using
EpiDesigner (Sequenom Inc.) and were as follows: Forward
5′-aggaagagagGGGTGGAGTATTTTTGTTTGTTG-3′ and reverse
5′-cagtaatacgactcactatagggagaaggctAAAAACATAATCCAAAACATCCTAAT-3′.
The PCR products were spotted on a 384-pad SpectroCHIP (Sequenom,
Inc.), followed by spectral acquisition on a MassARRAY Analyzer
(Sequenom, Inc.). Methylation data of individual units (1–3 CpG
sites per unit) were generated using EpiTyper v1.0.5 software
(Sequenom, Inc.).
Statistical analysis
Data are presented as the mean ± standard deviation.
To compare the mean of more than two groups, analysis of variance
was used. The χ2 test was used for comparisons of
numeration data. The expression of miR-375 was calculated
using the 2−ΔΔCt method (19). Since the data for miR-375
expression and DNA methylation were not normally distributed and
exhibited heterogeneous variance, the Kruskal Wallis test was used.
P<0.05 was considered to indicate a statistically significant
difference.
Results
Patient characteristics
Table I presents
the anthropometric and metabolic characteristics of the study
groups. Patients with IGT were slightly more obese than patients
with NGT. For patients with T2DM, abdominal obesity was greater
compared with that of patients with IGT and NGT, and patients with
T2DM had higher triglyceride concentrations. Additionally, patients
with T2DM and IGT had lower high-density lipoprotein cholesterol
(HDL-C) levels compared with those in patients with NGT.
 | Table IAnthropometric and metabolic
characteristics of the study groups. |
Table I
Anthropometric and metabolic
characteristics of the study groups.
| Parameter | T2DM | IGT | NGT | F-value | P-value |
|---|
| n | 5444 | 53- | - | | |
| Gender
(male/female) | 28/2623/21 | 23/30- | - | | |
| Age (years) | 52.9±9.7 | 54.3±8.6 | 52.9±9.4 | 0.360 | 0.699 |
| SBP (mmHg) | 135±15 | 135±15 | 133±16 | 0.493 | 0.612 |
| DBP (mmHg) | 77±9 | 78±9 | 79±10 | 0.550 | 0.578 |
| BMI
(kg/m2) | 25.28±2.79 | 25.71±1.14 | 24.21±3.89a | 3.519 | 0.032 |
| WHR | 0.92±0.06a,b | 0.96±0.06b | 0.88±0.05 | 23.110 | <0.001 |
| FBG (mmol/l) | 8.52±2.90a,b | 6.29±0.52b | 5.11±0.67 | 47.348 | <0.001 |
| Fins (mU/l) | 40.65±27.02 | 39.65±22.23 | 50.75±40.51 | 2.532 | 0.083 |
| FCP (mmol/l) | 0.79±0.36ab | 1.19±0.53b | 1.51±0.59a | 28.262 | <0.001 |
| HbA1c (%) | 8.56±1.75ab | 5.60±0.65b | 4.91±0.50 | 150.147 | <0.001 |
| TG (mmol/l) | 2.16±2.10b | 1.84±1.09 | 1.56±1.02 | 2.150 | 0.120 |
| TC (mmol/l) | 4.75±0.90 | 4.84±1.01 | 4.54±0.77 | 1.463 | 0.235 |
| LDL (mmol/l) | 2.83±0.74 | 3.06±0.97 | 2.62±0.69 | 3.632 | 0.029 |
| HDL (mmol/l) | 1.10±0.28b | 1.10±0.29b | 1.29±0.34 | 6.464 | 0.002 |
miR-375 expression in T2DM, IGT and NGT
samples
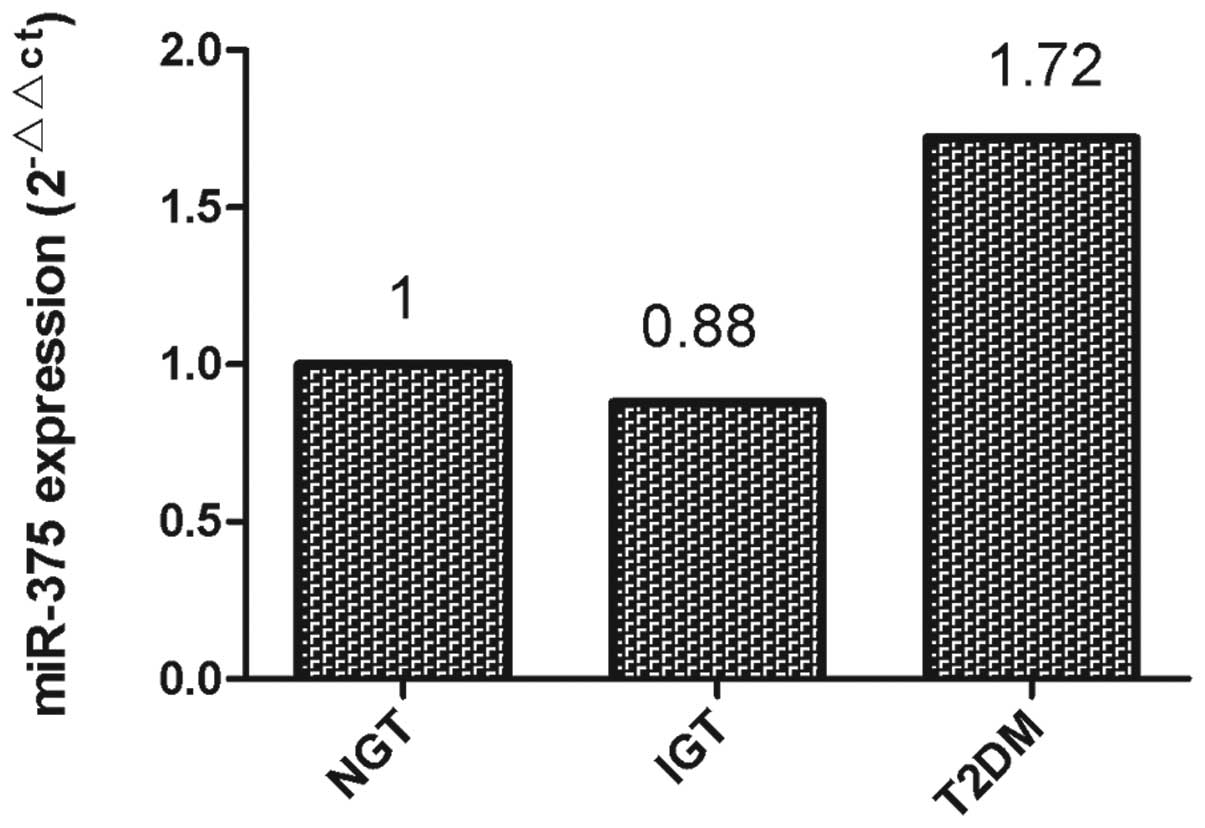
qPCR was performed to investigate the expression of
miR-375 in plasma samples from patients with T2DM, IGT and
NGT, respectively. As shown in Fig.
1, downregulation of plasma miR-375 levels was detected
in the samples from the patients with IGT (0.88 fold of NGT),
whilst upregulation of plasma miR-375 was detected in the
samples from the patients with T2DM (1.72 fold of NGT).
DNA methylation of miR-375
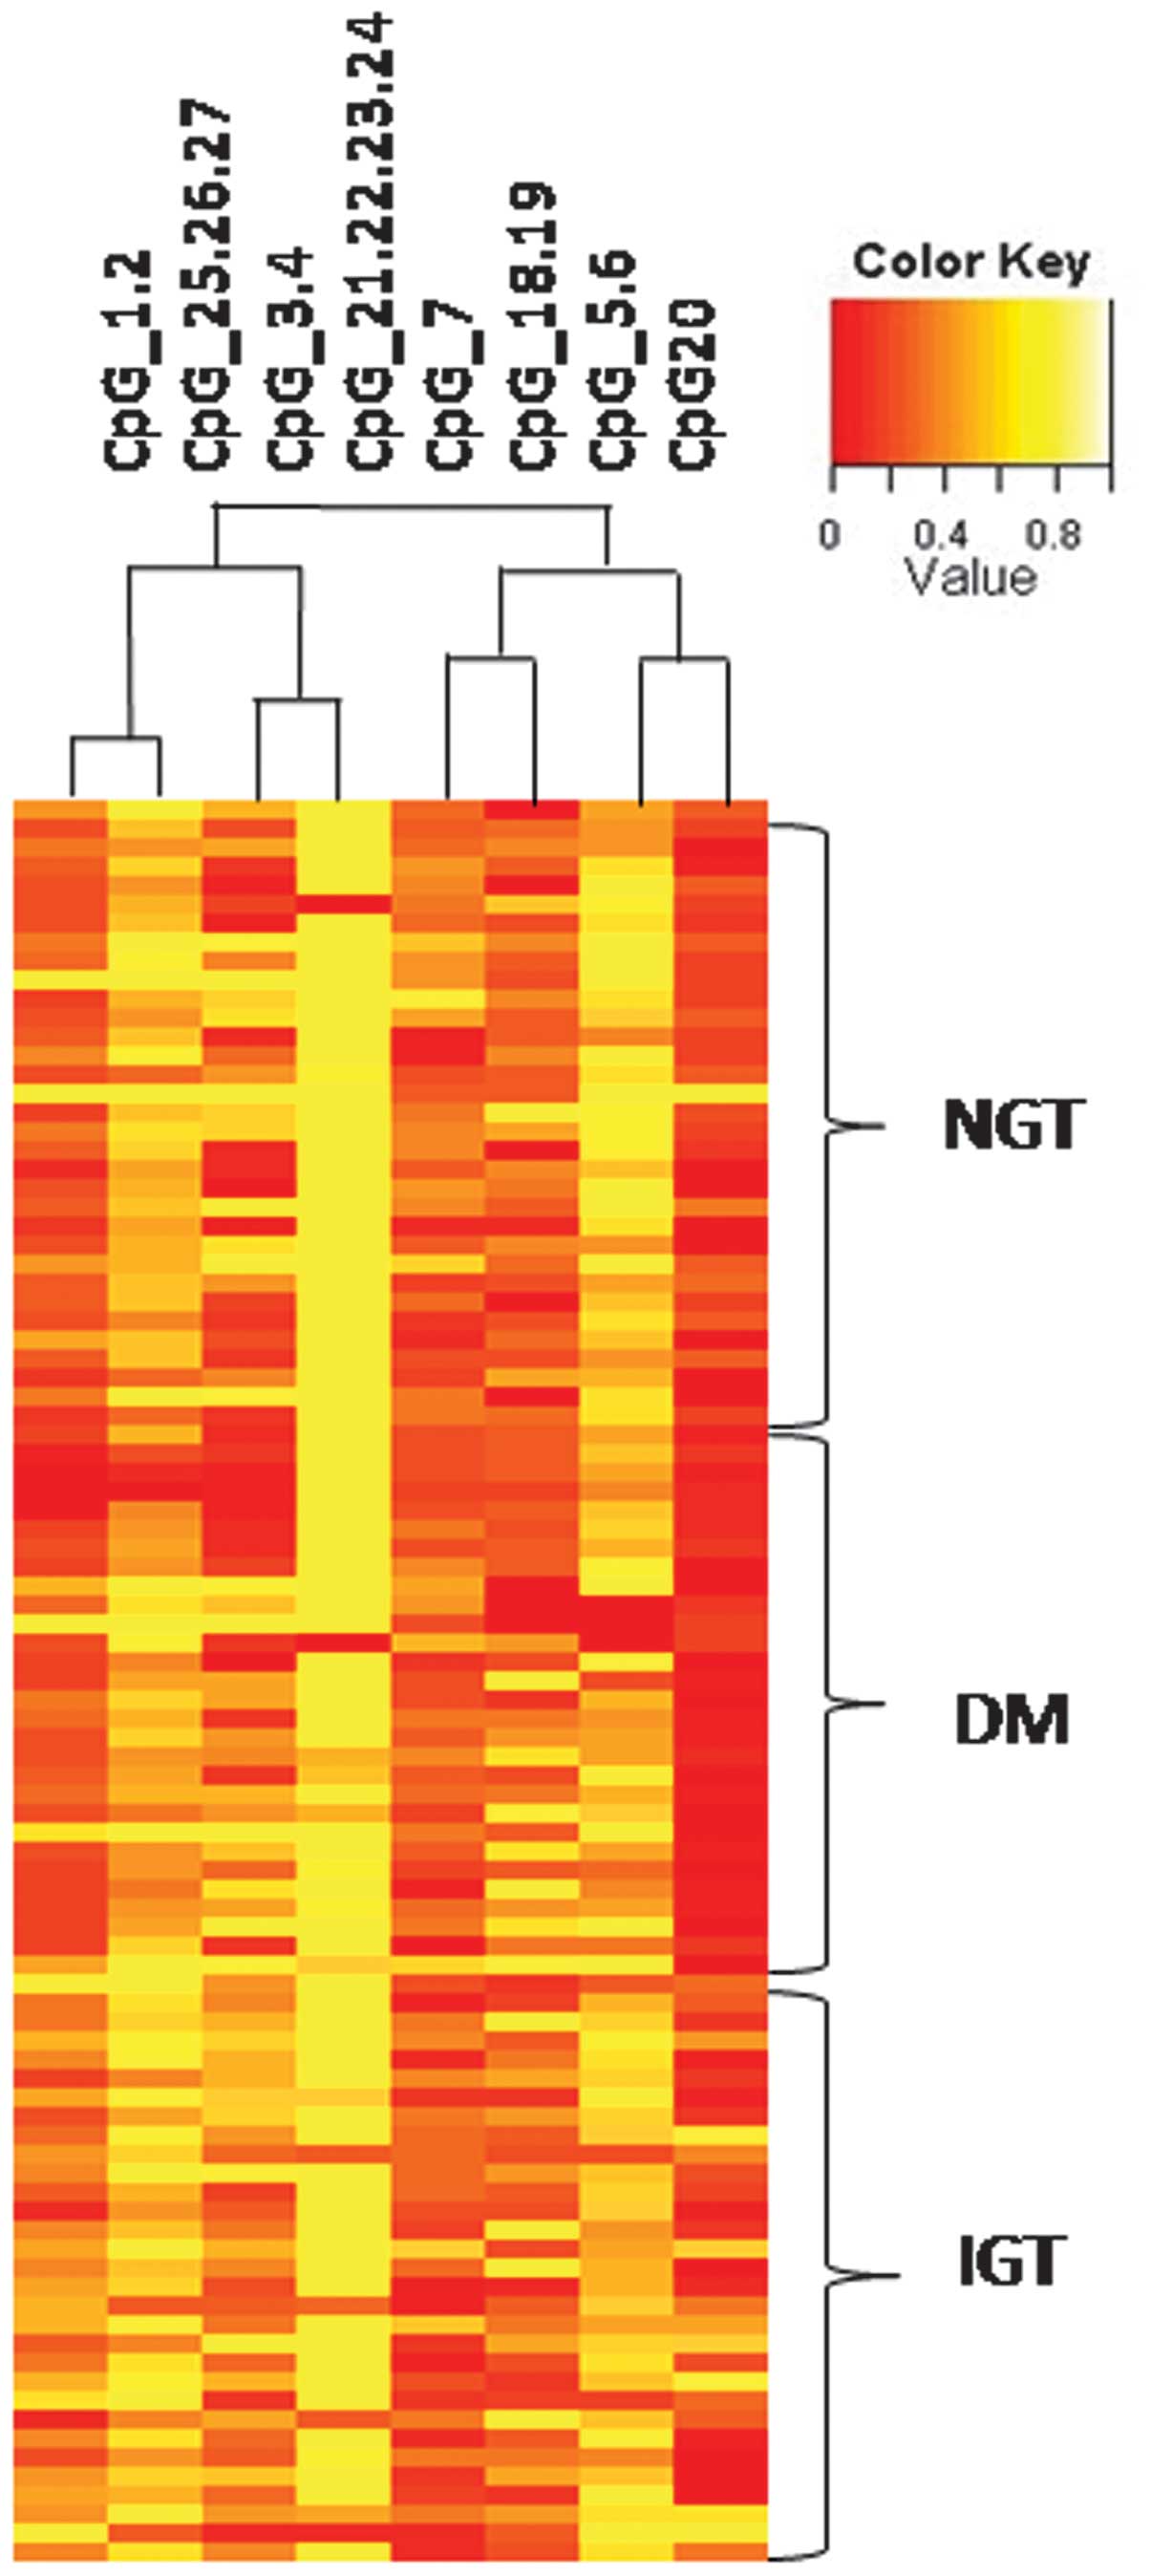
In order to understand the mechanism of
miR-375 upregulation, the methylation status in the promoter
region of miR-375 was investigated. In total, 44 IGT, 54
T2DM and 53 NGT samples were analyzed using MassARRAY. Hierarchical
clustering identified differences in the quantitative methylation
profiling of IGT cases compared with T2DM and controls (Fig. 2).
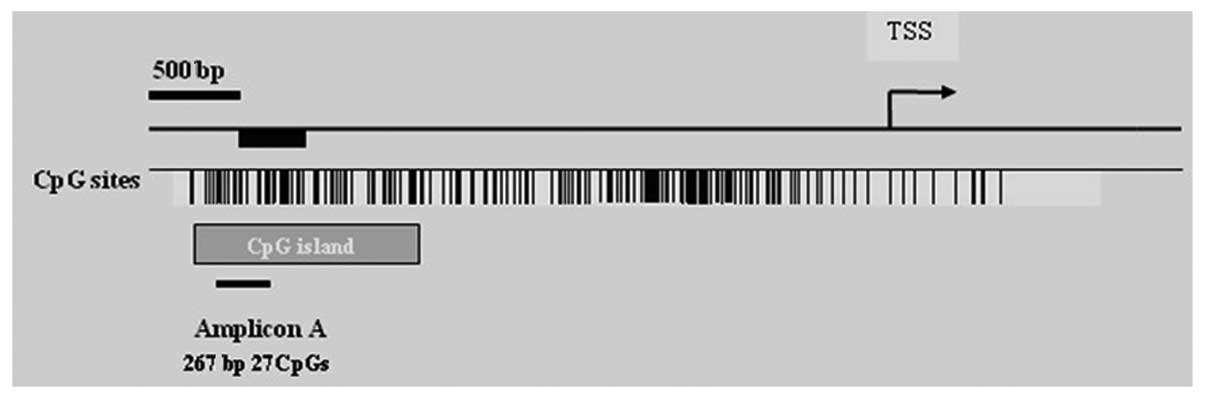
miR-375 methylation was assessed from bp −990
to bp −1258 relative to the transcription start site (Fig. 3). Eight CpG units, incorporating 17
CpG residues spanning 267 bp on the specified promoter region of
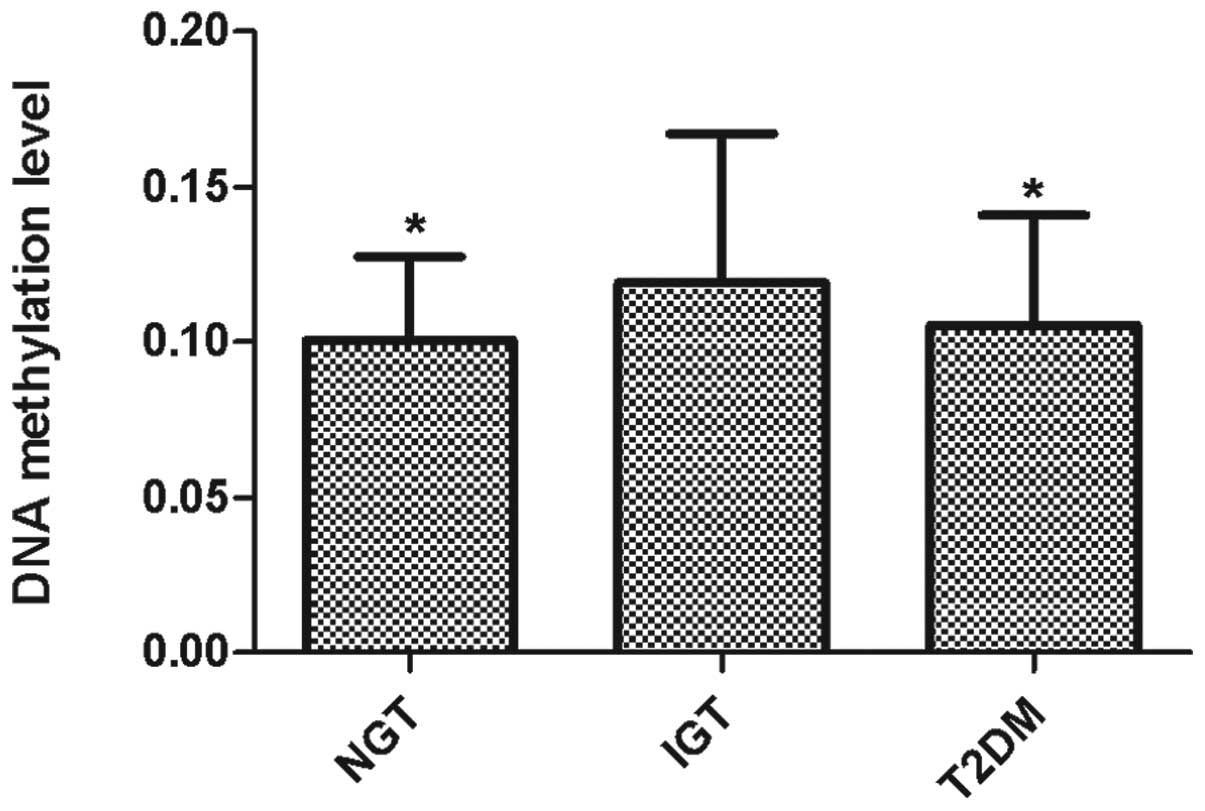
miR-375 were analyzed. The mean level of miR-375
methylation in the plasma samples, calculated from the methylation
levels of the 17 CpG residues, was 10.56% for the patients with
T2DM, 11.92% for the IGT group and 10.05% for the NGT group. The
DNA methylation level in the IGT group was higher than those in the
T2DM and NGT groups (P=0.042; Fig.
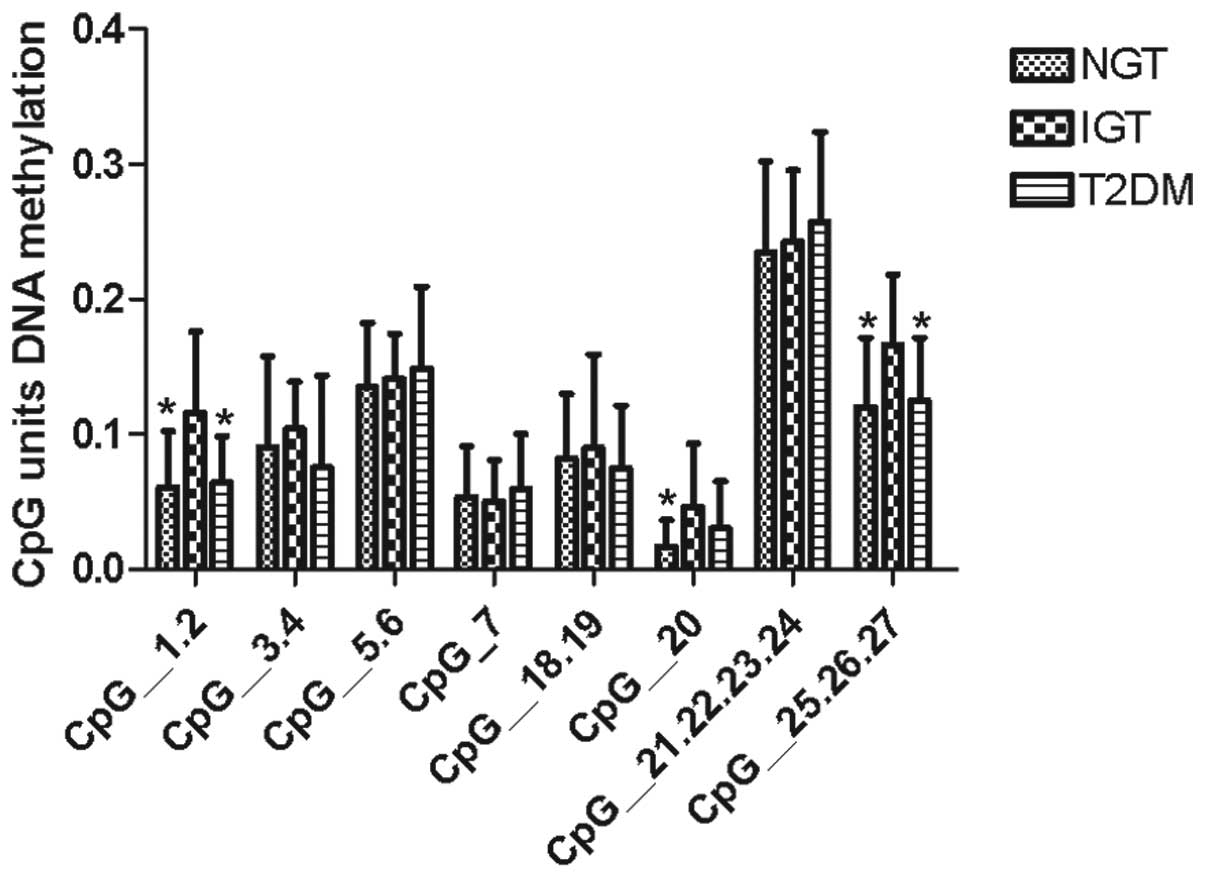
4). Furthermore, the individual CpG units in T2DM, IGT and NGT
cases were analyzed and three specific CpG units (CpG1.2, CpG20,
and CpG25.26.27) were found to be hypermethylated in IGT samples
compared with the methylation levels in T2DM and NGT samples
(Fig. 5).
Correlation between methylation of CpG
units and clinical features
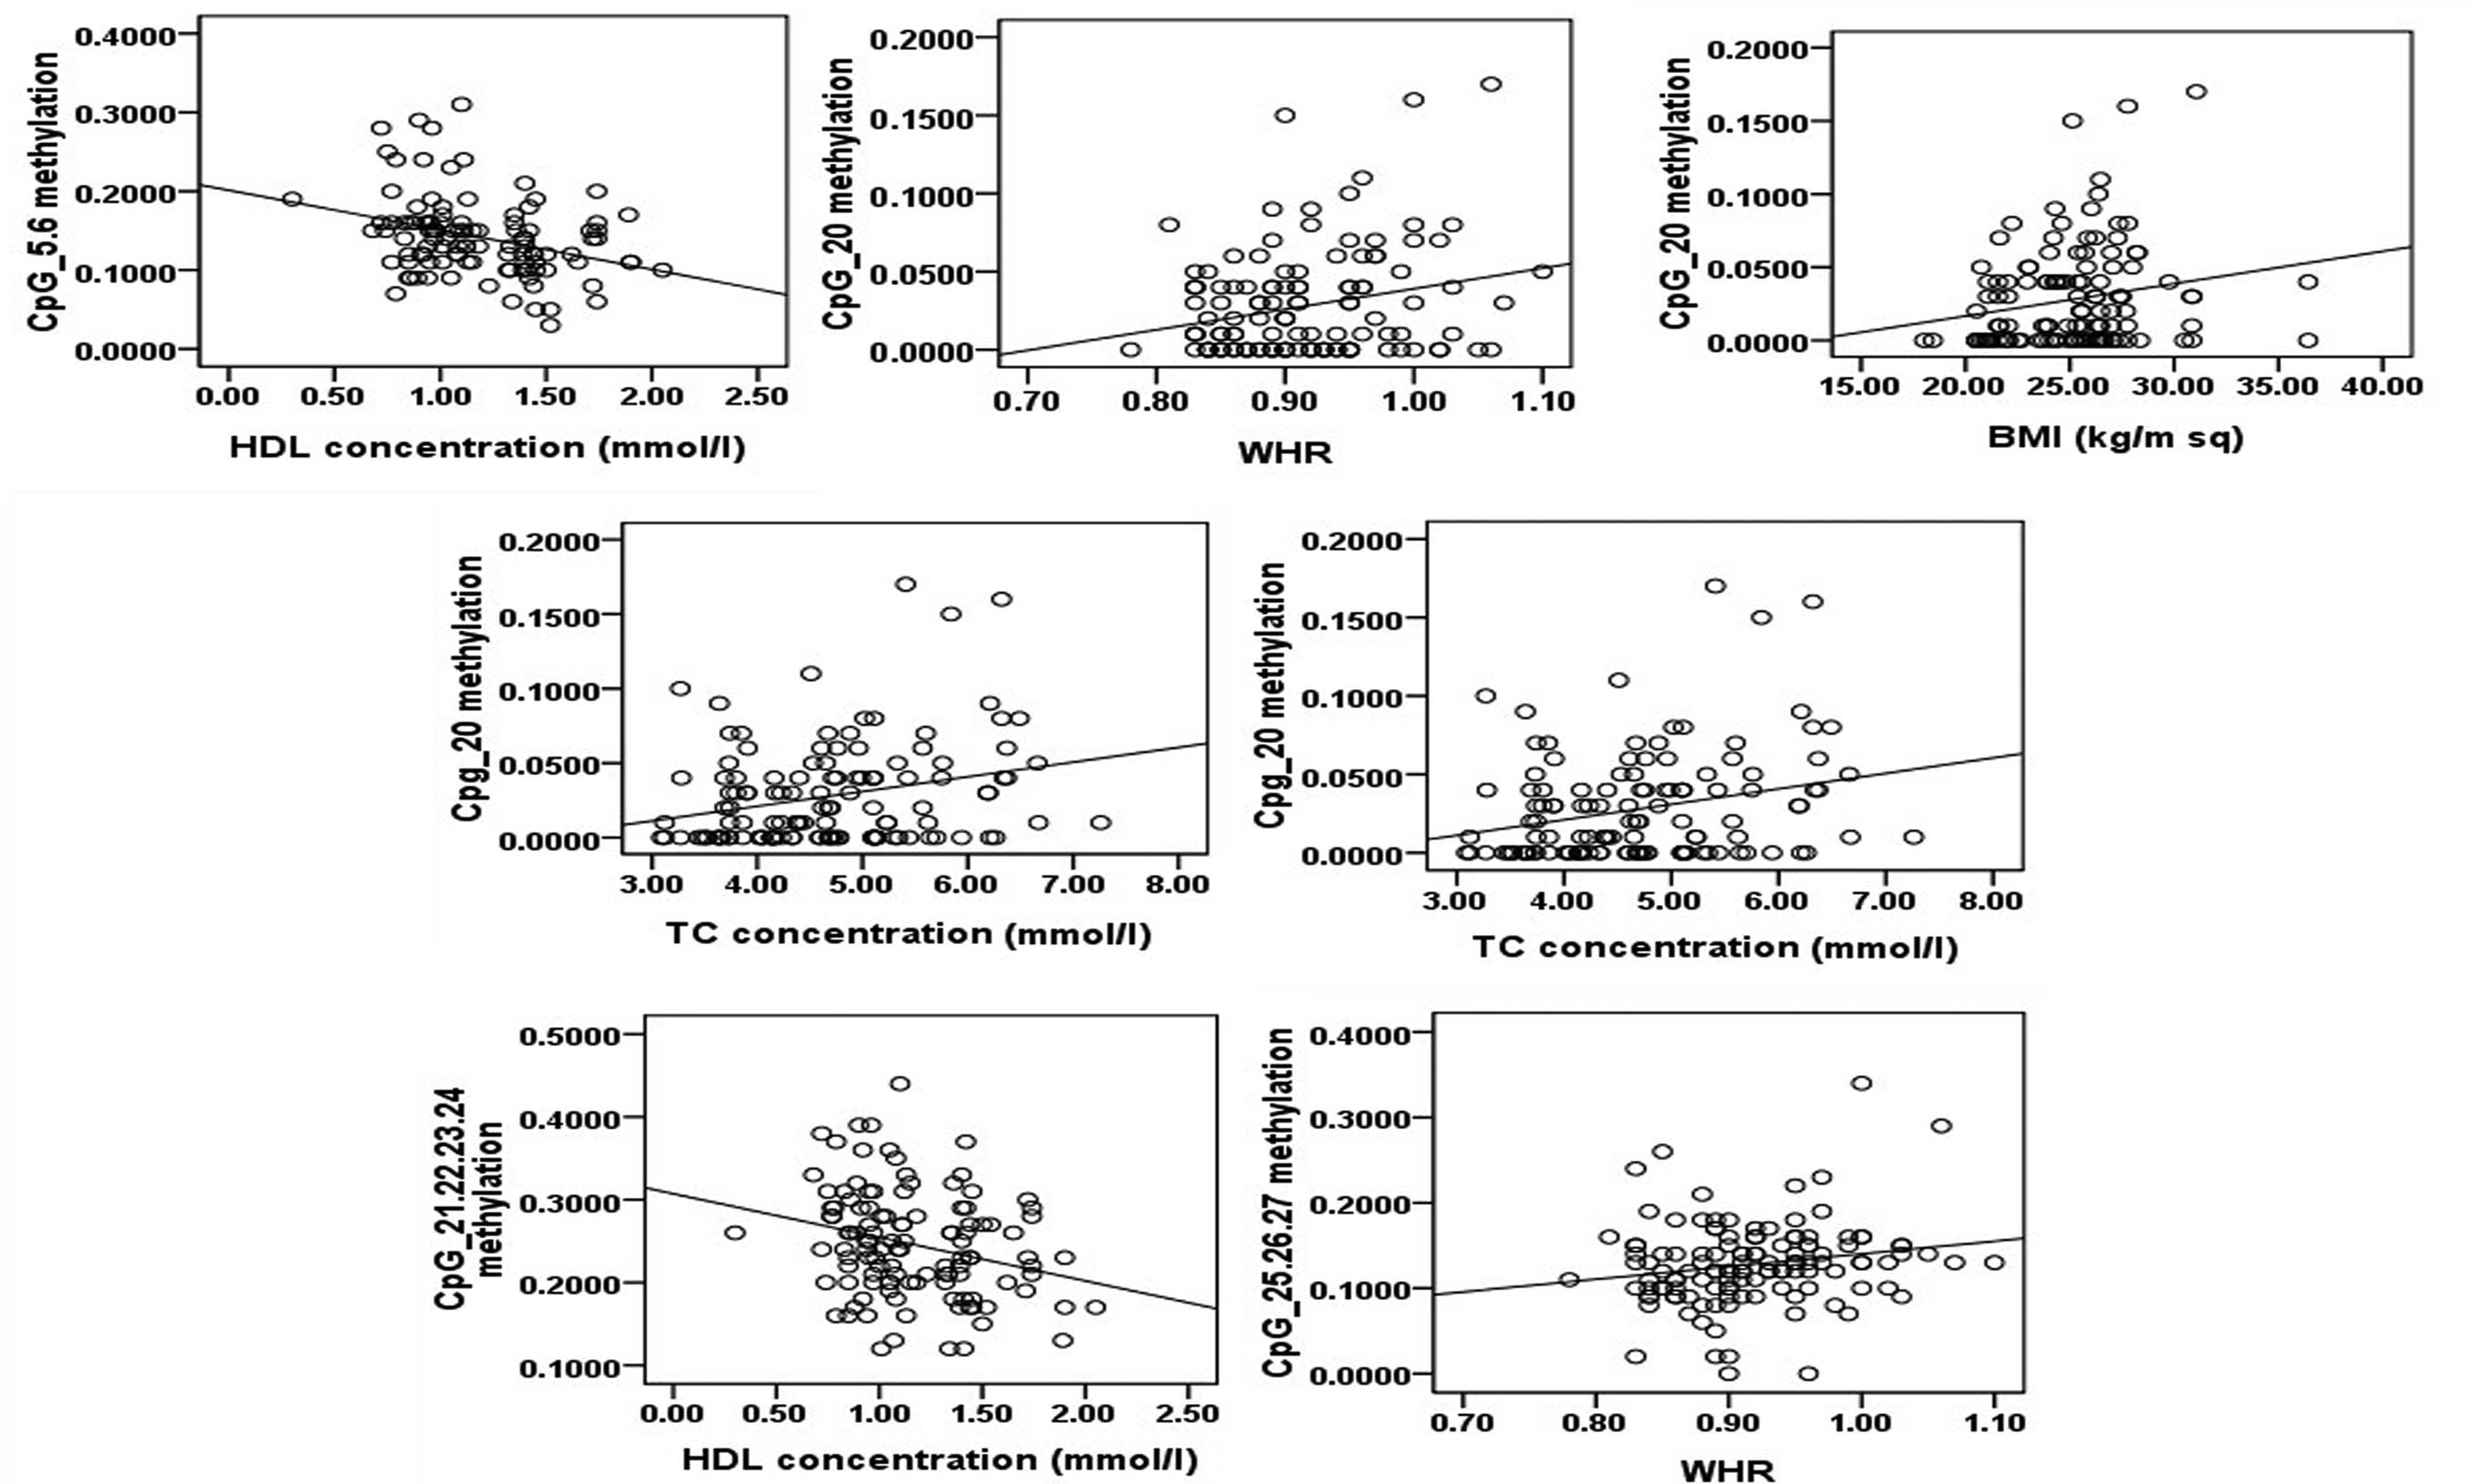
Methylation patterns were then used to investigate
the potential correlation with clinical features (Table II). The results showed that none
of the clinical parameters were significantly different according
to the methylation status of the miR-375 promoter. However,
analysis of eight CpG units demonstrated that methylation of CpG5.6
and CpG21.22.23.24 were negatively correlated with HDL, methylation
of CpG20 was positively correlated with body mass index (BMI),
waist-hip ratio (WHR), total cholesterol (TC) and low-density
lipoprotein (LDL), and methylation of CpG25.26.27 was positively
correlated with WHR (Fig. 6).
| Table IICorrelation between methylation of
CpG units and clinical features (R values) |
Table II
Correlation between methylation of
CpG units and clinical features (R values)
| CpG unit | Age | BMI | WHR | SBP | DBP | HbA1C | Fins | FCP | TG | TC | LDL | HDL | FBG |
|---|
| CpG5.6 | 0.082 | 0.126 | 0.120 | 0.162 | 0.114 | 0.065 | 0.077 | 0.007 | 0.185 | 0.084 | 0.106 | −0.328a | 0.143 |
| CpG20 | −0.080 | 0.199a | 0.244b | 0.065 | 0.101 | 0.132 | −0.073 | −0.163 | 0.015 | 0.263b | 0.299b | −0.022 | 0.154 |
| CpG21.22.24.24 | −0.030 | 0.016 | 0.016 | 0.113 | 0.119 | 0.107 | −0.045 | −0.055 | 0.153 | 0.001 | 0.056 | −0.264b | 0.122 |
| CpG25.26.27 | 0.026 | 0.095 | 0.186a | 0.089 | 0.118 | −0.044 | 0.112 | 0.086 | 0.056 | −0.055 | −0.048 | −0.060 | 0.068 |
Discussion
Recent advances in the understanding of the genetics
of T2DM susceptibility have focused on the regulation of
transcriptional activity within pancreatic β cells. miRNAs have
been demonstrated to have an important role in the control of
glucose homeostasis; miR-375-null mice are hyperglycemic and
exhibit reduced β-cell mass, and the knockdown of miR-375 in
obese ob/ob mice results in a significant effect on glycemia,
leading to a severe diabetic phenotype (20). In the present study, the plasma
levels of miR-375 were found to be significantly upregulated
in samples from patients with T2DM, but slightly downregulated in
samples from patients with IGT compared with those in patients with
NGT. A study has shown that the overexpression of miR-375
suppresses glucose-induced insulin secretion whereas inhibition of
endogenous miR-375 function enhances insulin secretion
(11). In β-cell line cultures,
miR-375 inhibits insulin secretion in part by inhibiting the
translation of the mRNA for myotrophin (11,21)
and phosphoinositide 3-kinase-dependent-kinase (22). This suggests that miR-375
may be involved in the pathogenesis of IGT and T2DM. During the
initial stages of IGT, β-cell function may be enhanced by
downregulation of miR-375 as a compensatory mechanism for
insulin resistance. The upregulation of miR-375, which
suppresses insulin secretion, may be attributed to the progression
of IGT followed by T2DM.
Epigenetic modification of DNA, including
methylation and/or histone modification, is considered to have an
important role in the regulation of DNA expression. Studies have
revealed that epigenetics regulates miR-375 in a number of
different types of cancer, including hepatocellular, gastric and
breast cancer (23,24). Our previous study has demonstrated
that miR-375 promoter was hypomethylated in patients with T2DM
compared with the NGT sample (25). In the present study, MALDI-TOF MS
(via the MassARRAY analysis) was used to analyze the methylation
patterns at multiple CpG sites within the promoter regions of
miR-375. The results demonstrated hypermethylation patterns
in IGT compared with T2DM and NGT. The aberrant methylation status
of the CpG units was then investigated. The results showed
significant differences in the frequency of methylation at
individual CpG units in IGT, T2DM and NGT samples. Three CpG units
(CpG1.2, CpG20 and CpG25.26.27) showed higher methylation
frequencies in IGT samples than in NGT samples. The methylation of
two CpG units (CpG1.2 and CpG25.26.27) was higher in IGT samples
than in T2DM samples. The results suggest that miR-375 CpG
island methylation was negatively correlated with miR-375
expression. Hypermethylation of the miR-375 promoter may
have a key role in the downregulation of its expression in patients
with IGT. Compared with the samples from patients with IGT, those
from patients with T2DM presented relative hypomethylation of the
miR-375 promoter and upregulation of miR-375
expression. This suggests there may be demethylation during the
course of IGT progression to T2DM.
DNA methylation was originally considered stable and
irreversible. However, studies have shown that environmental
factors influence the regulation of DNA methylation in mammals
(26–28). In the present study, the potential
correlation of methylation patterns with clinical features was
investigated. The results demonstrated that BMI, WHR, LDL and TC
were positively correlated with DNA methylation. Increased body
weight has been reported to be an important factor for DNA
methylation patterns (29). Acute
exposure to the free fatty acids palmitate and oleate has been
demonstrated to increase the promoter methylation of genes involved
in mitochondrial functioning in human primary muscle cells
(30). However, no direct evidence
has shown that hyperlipidemia influences DNA methylation;
therefore, further studies are required to fully elucidate the
mechanisms involved in this phenomenon.
In conclusion, in the present study, the
hypermethylation status of the miR-375 promoter and the
downregulation of plasma levels of miR-375 in patients with
IGT were described. The results suggest that DNA hypomethylation
may have a role in the regulation of miR-375 expression and
may contribute to the pathogenesis of T2DM.
References
|
1
|
DeFronzo RA: Banting Lecture. From the
triumvirate to the ominous octet: a new paradigm for the treatment
of type 2 diabetes mellitus. Diabetes. 58:773–795. 2009. View Article : Google Scholar : PubMed/NCBI
|
|
2
|
Ferrannini E, Gastaldelli A, Miyazaki Y,
Matsuda M, Mari A and DeFronzo RA: β-Cell function in subjects
spanning the range from normal glucose tolerance to overt diabetes
mellitus: a new analysis. J Clin Endocrinol Metab. 90:493–500.
2005.
|
|
3
|
Abdul-Ghani MA, Tripathy D and DeFronzo
RA: Contribution of β-cell dysfunction and insulin resistance to
the pathogenesis of impaired glucose tolerance and impaired fasting
glucose. Diabetes Care. 29:1130–1139. 2006.
|
|
4
|
Abdul-Ghani MA, Jenkinson CP, Richardson
DK, Tripathy D and DeFronzo RA: Insulin secretion and insulin
action in subjects with impaired fasting glucose and impaired
glucose tolerance: results from the Veterans Administration Genetic
Epidemiology Study. Diabetes. 55:1430–1435. 2006. View Article : Google Scholar
|
|
5
|
Weyer C, Tataranni PA, Bogardus C and
Pratley RE: Insulin resistance and insulin secretory dysfunction
are independent predictors of worsening of glucose tolerance during
each stage of type 2 diabetes development. Diabetes Care. 24:89–94.
2001. View Article : Google Scholar
|
|
6
|
Jallut D, Golay A, Munger R, Frascarolo P,
Schutz Y, Jéquier E and Felber JP: Impaired glucose tolerance and
diabetes in obesity: a 6-year follow-up study of glucose
metabolism. Metabolism. 39:1068–1075. 1990.PubMed/NCBI
|
|
7
|
Altshuler D, Hirschhorn JN, Klannemark M,
et al: The common PPARgamma Pro12Ala polymorphism is associated
with decreased risk of type 2 diabetes. Nat Genet. 26:76–80. 2000.
View Article : Google Scholar : PubMed/NCBI
|
|
8
|
Rissanen J, Markkanen A, Kärkkäinen P, et
al: Sulfonylurea receptor 1 gene variants are associated with
gestational diabetes and type 2 diabetes but not with altered
secretion of insulin. Diabetes Care. 23:70–73. 2000. View Article : Google Scholar : PubMed/NCBI
|
|
9
|
Hara K, Okada T, Tobe K, et al: The
Pro12Ala polymorphism in PPARγ2 may confer resistance to type 2
diabetes. Biochem Biophys Res Commu. 271:212–216. 2000.
|
|
10
|
Chang TC and Mendell JT: microRNAs in
vertebrate physiology and human disease. Annu Rev Genomics Hum
Genet. 8:215–239. 2007. View Article : Google Scholar : PubMed/NCBI
|
|
11
|
Poy MN, Eliasson L, Krutzfeldt J, et al: A
pancreatic islet-specific microRNA regulates insulin secretion.
Nature. 432:226–230. 2004. View Article : Google Scholar : PubMed/NCBI
|
|
12
|
Baroukh N, Ravier MA, Loder MK, et al:
MicroRNA-124a regulates Foxa2 expression and intracellular
signaling in pancreatic β-cell lines. J Biol Chem. 282:19575–19588.
2007.PubMed/NCBI
|
|
13
|
Joglekar MV, Parekh VS, Mehta S, Bhonde RR
and Hardikar AA: MicroRNA profiling of developing and regenerating
pancreas reveal post-transcriptional regulation of neurogenin3. Dev
Biol. 311:603–612. 2007. View Article : Google Scholar : PubMed/NCBI
|
|
14
|
Plaisance V, Abderrahmani A, Perret-Menoud
V, Jacquemin P, Lemaigre F and Regazzi R: MicroRNA-9 controls the
expression of Granuphilin/Slp4 and the secretory response of
insulin-producing cells. J Biol Chem. 281:26932–26942. 2006.
View Article : Google Scholar : PubMed/NCBI
|
|
15
|
Tang X, Muniappan L, Tang G and Ozcan S:
Identification of glucose-regulated miRNAs from pancreatic β cells
reveals a role for miR-30d in insulin transcription. RNA.
15:287–293. 2009.PubMed/NCBI
|
|
16
|
Lynn FC, Skewes-Cox P, Kosaka Y, McManus
MT, Harfe BD and German MS: MicroRNA expression is required for
pancreatic islet cell genesis in the mouse. Diabetes. 56:2938–2945.
2007. View Article : Google Scholar : PubMed/NCBI
|
|
17
|
Temple IK, Gardner RJ, Mackay DJ, Barber
JC, Robinson DO and Shield JP: Transient neonatal diabetes:
widening the understanding of the etiopathogenesis of diabetes.
Diabetes. 49:1359–1366. 2000. View Article : Google Scholar : PubMed/NCBI
|
|
18
|
Report of a WHO Consultation: Definition,
Diagnosis and Classification of Diabetes Mellitus and its
complications: Report of a WHO Consultation 1999. Part 1: Diagnosis
and classification of diabetes mellitus. 1–65. 1999.
|
|
19
|
Livak KJ and Schmittgen TD: Analysis of
relative gene expression data using real-time quantitative PCR and
the 2(−Delta Delta C(T)) Method. Methods. 25:402–408. 2001.
|
|
20
|
Poy MN, Hausser J, Trajkovski M, et al:
miR-375 maintains normal pancreatic alpha- and beta-cell mass. Proc
Natl Acad Sci USA. 106:5813–5818. 2009. View Article : Google Scholar : PubMed/NCBI
|
|
21
|
Xia HQ, Pan Y, Peng J and Lu GX:
Over-expression of miR375 reduces glucose-induced insulin secretion
in Nit-1 cells. Mol Bio Rep. 38:3061–3065. 2011. View Article : Google Scholar : PubMed/NCBI
|
|
22
|
El Ouaamari A, Baroukh N, Martens GA,
Lebrun P, Pipeleers D and van Obberghen E: miR-375 targets
3′-phosphoinositide-dependent protein kinase-1 and regulates
glucose-induced biological responses in pancreatic β-cells.
Diabetes. 57:2708–2717. 2008.
|
|
23
|
de Souza Rocha Simonini P, Breiling A,
Gupta N, et al: Epigenetically deregulated microRNA-375 is involved
in a positive feedback loop with estrogen receptor alpha in breast
cancer cells. Cancer Res. 70:9175–9184. 2010.PubMed/NCBI
|
|
24
|
Ding L, Xu Y, Zhang W, et al: MiR-375
frequently downregulated in gastric cancer inhibits cell
proliferation by targeting JAK2. Cell Res. 20:784–793. 2010.
View Article : Google Scholar : PubMed/NCBI
|
|
25
|
Sun K, Chang XY, Yin L, et al: Expression
and DNA methylation status of microRNA-375 in patients with type 2
diabetes mellitus. Mol Med Rep. 9:967–972. 2014.PubMed/NCBI
|
|
26
|
Reid G, Métivier R, Lin CY, et al:
Multiple mechanisms induce transcriptional silencing of a subset of
genes, including oestrogen receptor alpha, in response to
deacetylase inhibition by valproic acid and trichostatin A.
Oncogene. 24:4894–4907. 2005. View Article : Google Scholar
|
|
27
|
Kangaspeska S, Stride B, Métivier R, et
al: Transient cyclical methylation of promoter DNA. Nature.
452:112–115. 2008. View Article : Google Scholar : PubMed/NCBI
|
|
28
|
Métivier R, Gallais R, Tiffoche C, et al:
Cyclical DNA methylation of a transcriptionally active promoter.
Nature. 452:45–50. 2008.PubMed/NCBI
|
|
29
|
Maier S and Olek A: Diabetes: a candidate
disease for efficient DNA methylation profiling. J Nutr. 132(Suppl
8): 2440S–2443S. 2002.PubMed/NCBI
|
|
30
|
Barrès R, Osler ME, Yan J, et al: Non-CpG
methylation of the PGC-1alpha promoter through DNMT3B controls
mitochondrial density. Cell Metab. 10:189–198. 2009.PubMed/NCBI
|