Introduction
Breast cancer is one of the most common malignant
diseases endangering women’s health. The prevalence of breast
cancer has continued to rise in recent years, and the individuals
affected have been getting progressively younger. Breast magnetic
resonance imaging (MRI) has high sensitivity and specificity
(1,2). In the 1970s, Folkman (3), a professor from Harvard University,
proposed that tumor growth and metastasis depended on angiogenesis,
and since then, numerous in-depth studies of the blood supply to
tumors have been conducted using MRI (4–13).
Studies using dynamic contrast-enhanced magnetic resonance imaging
(DCE-MRI) to investigate breast lesions have been carried out
mostly on the qualitative or semi-quantitative analysis level, and
those providing a quantitative analysis are relatively few.
Quantitative analysis has been performed to evaluate the vascular
endothelial permeability and increase in blood flow of tumor
tissues for diagnosis, for differential diagnosis and for the
evaluation of neoadjuvant chemotherapy for malignant tumors
(14,15). This involves analyzing the volume
transfer constant (Ktrans), rate constant (Kep), extravascular
extracellular volume fraction (Ve), integrated area under the curve
(iAUC) and other vascular function parameters, which are of
particular interest in the quantitative analysis of DCE-MRI.
In the present study, 3-Tesla (3T) DCE-MRI was used
to scan benign and malignant breast lesions, and the differences in
vascular function parameters between benign and malignant breast
lesions and among various pathological grades of invasive ductal
carcinoma quantitatively analyze were quantitatively analyzed.
Materials and methods
Clinical data
A total of 44 cases admitted to Qianfoshan Hospital
of Shandong University between September 2012 and April 2013 were
selected. The breast lesions of the cases were diagnosed by
physical examination, ultrasound or mammography X-ray detection as
well as by breast DCE-MRI examination. All patients were female,
aged from 23 to 68 years old with mean age of 41 years. The
patients included in the study had no contraindications to MRI,
such as implanted magnetic devices. Patients who had received any
neoadjuvant chemotherapy or who had renal failure were excluded.
All patients who underwent MR examination were asked to provide
signed informed consent prior to the inspection. Finally, 44
patients (total of 44 lesions) were pathologically confirmed by
surgery or biopsy, including 30 cases of malignant tumors (68.2%)
comprising 26 cases of invasive ductal carcinoma (5 cases of grade
I, 14 cases of grade II and 7 cases of grade III), 2 cases of
inflammatory breast cancer, 1 case of invasive lipid-rich carcinoma
and 1 case of high level ductal carcinoma. The remaining 14
patients had benign tumors (31.8%), including 5 cases of
fibroadenoma, 3 cases of breast hyperplasia with a fibroadenoma
formation tendency, 2 cases of breast hyperplasia, 1 case of
intraductal papilloma, 1 case of mammary hyperplasia with severe
inflammation in certain areas, 1 case of borderline phyllodes tumor
and 1 case of lipoma. This study was conducted in accordance with
the Declaration of Helsinki. This study was conducted with approval
from the Ethics Committee of Shandong University (Jinan, China).
Written informed consent was obtained from all participants.
Equipment and parameters
All patients underwent breast MR scanning and T1
dynamic contrast-enhanced MRI. A Siemens Magnetom Skyra 3T MR
scanner (Siemens, Erlangen, Germany) and a dedicated eight-channel
phased bilateral breast coil were used. The patients were prone,
and their bilateral breasts were naturally draped within the
coil.
Conventional scanning
Following conventional horizontal, sagittal and
coronal positioning and scanning, horizontal position T1
fat-suppression sequences [repetition time (TR)/echo time (TE), 6.0
msec/2.62 msec; field of view (FOV), 360 mm; matrix, 448×448; slice
thickness, 1.2 mm; layer space, 0.24 mm; stimulation number, 1;
flip angle, 20°], horizontal position T2-Dixon sequences (TR/TE
7,210 msec/102 msec; FOV, 340 mm; matrix, 320×320; slice thickness,
4 mm; layer space, 0.8 mm; stimulation number, 1; flip angle, 120°)
and horizontal diffusion bit sequences (TR/TE, 4,300 msec/63 msec;
FOV, 340 mm; matrix, 220×220; slice thickness, 5 mm; layer space, 1
mm; stimulation number, 4 times) were performed.
T1 dynamic contrast-enhanced
scanning
Original T1 scanning (T1 mapping) was initially
performed, followed by an enhanced T1 line sequential scan. T1 map
scanning was performed by multi-flip angle technology with the
following parameters: TR/TE, 7.84 msec/3.37 msec; FOV, 340 mm;
matrix, 224×224; slice thickness, 1.5 mm; layer space, 0.3 mm;
stimulation number, 1; flip angle, 3°/16°. The continuous
T1-enhanced sequence scanning parameters were as follows: TR/TE,
5.61 msec/1.74 msec; FOV, 340 mm; matrix, 224×224; slice thickness,
1.5 mm; layer space, 0.3 mm; stimulation number, 1; flip angle,
10°; total scan time, 22 times; single phase scan time, 30.1 sec
with total time of 11.15 min. Following the second phase data
collection, 20 ml gadolinium diethylenetriaminepentacetate (DTPA;
Haibo Lecco Xinyi Pharmaceutical Co., Ltd., Shanghai, China)
contrast agent was intravenously injected at high pressure,
followed by a 20-ml injection of saline at a flow rate of 5 ml/sec.
Then, 20 phases were continuously collected.
Data processing and analysis
The scanned images were transmitted to Siemens
workstation SYGNO VE40A; post-processing work was performed using
TISSUE 4D software. The most evident breast artery or internal
thoracic artery was selected to obtain the arterial input function
(AIF). The vascular function parameters of the lesions were
measured by selecting a region of interest (ROI), as shown on the
pseudo-color images.
ROI selection
The substantive component of a mass was selected as
the region of interest, and three levels were selected for each
lesion (the level of the maximum cross-sectional area, and one at
each of the upper and lower levels), avoiding necrotic tissue,
voids, vascular calcification and other features. For each vascular
permeability parameter, the average of the parameter at the three
levels was taken as the vascular permeability parameter of the
lesion.
Statistical analysis
SPSS software version 7.0 (SPSS, Inc., Chicago, IL,
USA) was used to conduct the statistical analysis. Data are
expressed as mean ± standard deviation. The vascular function
parameters between benign and malignant tumors were compared using
Student’s t-test or adjusted t-test. The vascular function
parameters among different pathological grades of invasive ductal
breast cancers were compared using repeated measures analysis of
variance. P<0.05 was considered to indicate a statistically
significant difference.
Results
Differences in Ktrans, Kep and iAUC
between benign and malignant breast lesions
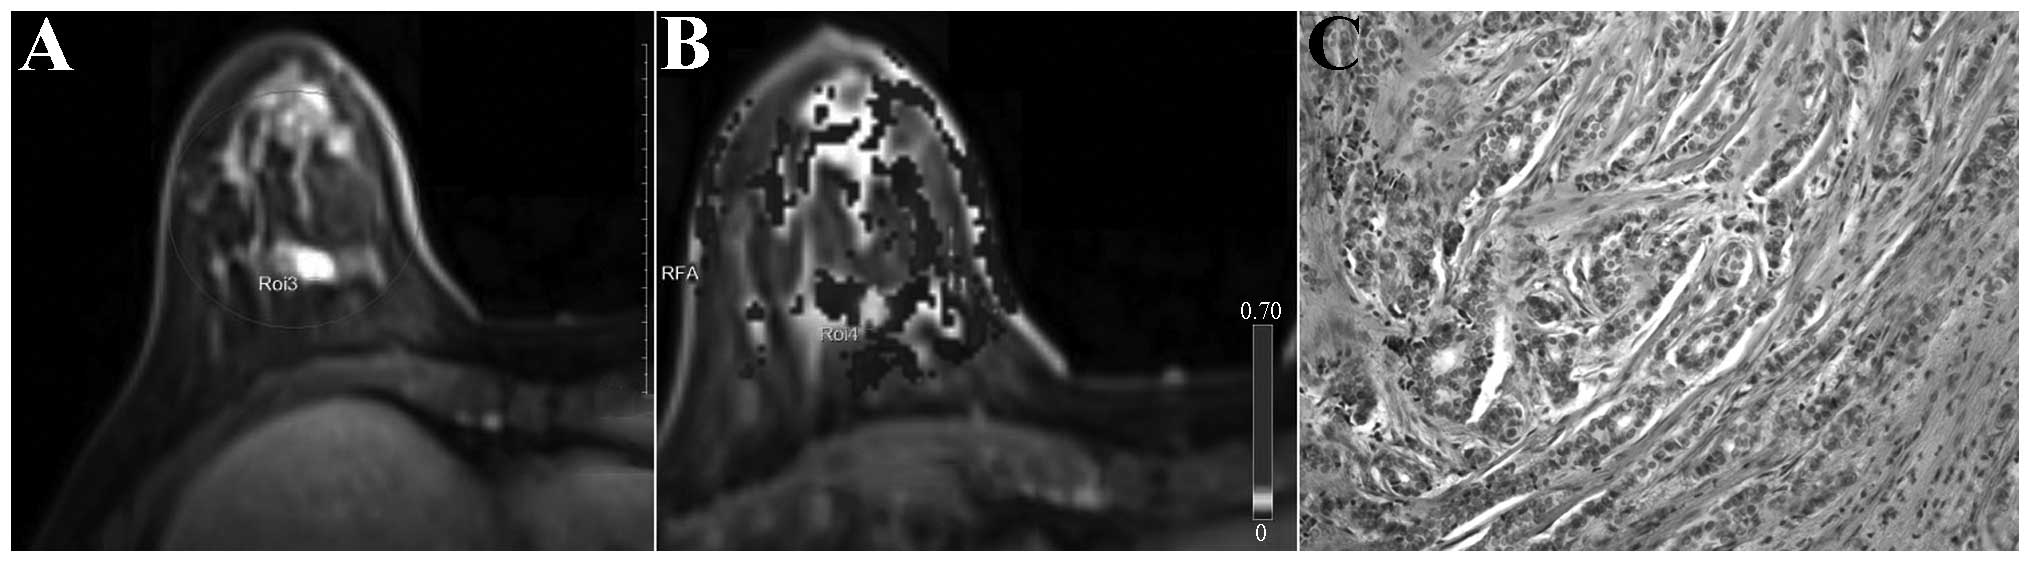
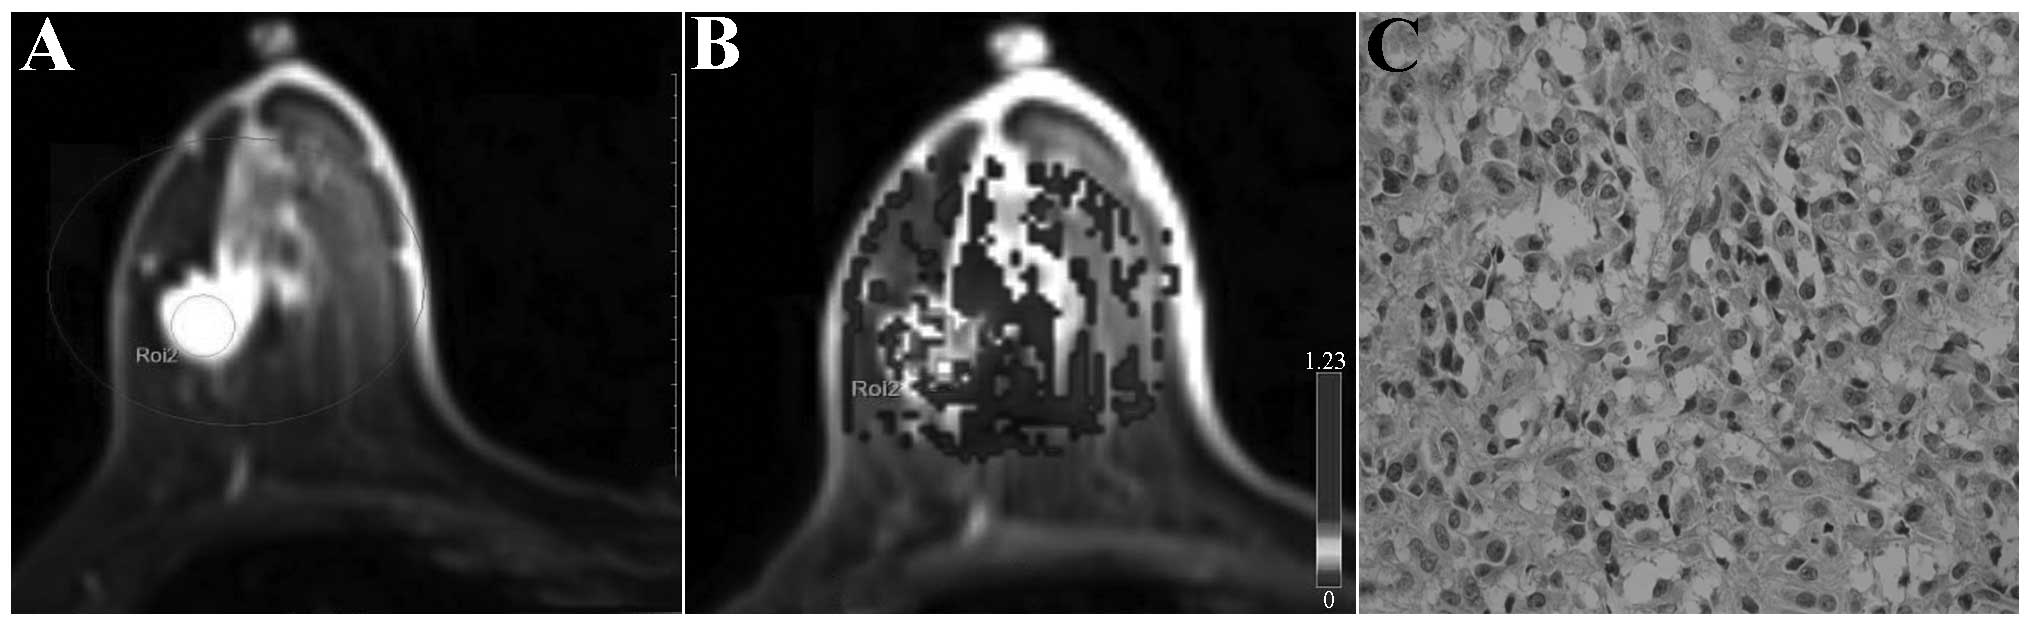
The Ktrans, Kep and iAUC values of the malignant
breast lesions were significantly higher than those of the benign
lesions, and had slight differences between the different levels of
invasive ductal carcinoma. Malignant breast lesions generally were
significantly enhanced in the early enhancement stage, and red
(representing higher perfusion) was observed in lesion regions of
the dynamic contrast-enhanced pseudo-color maps; the higher the
value of perfusion parameters, the larger the relative scope of the
red zone and the deeper the color. In addition, the higher the
relative value of the high perfusion parameters, the deeper the
invasive ductal carcinoma malignancy degree (represented in black
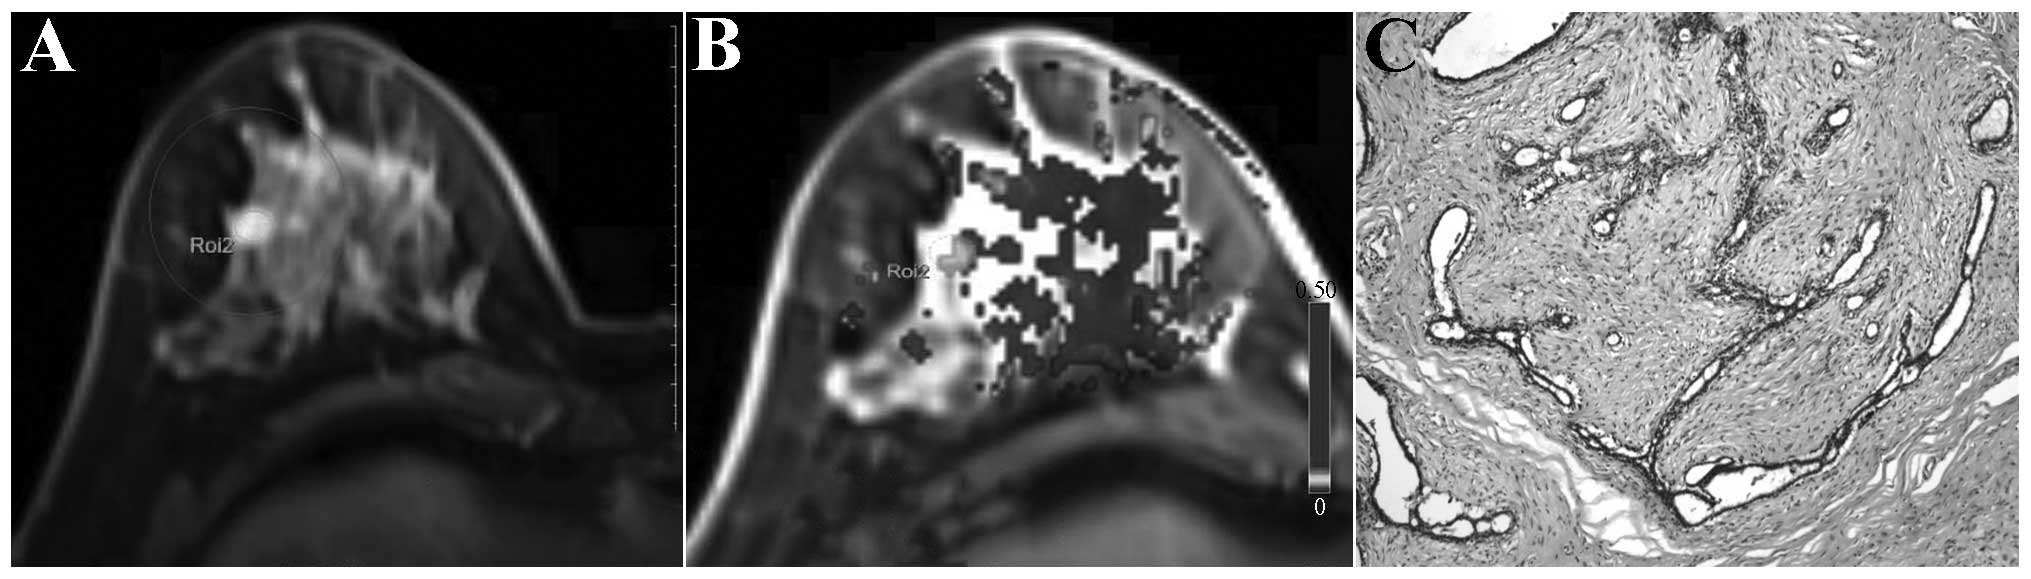
and white in Figs. 1–3). The benign breast lesions generally
exhibited delayed enhancement, and yellow (representing lower
perfusion) was observed in lesion regions of the dynamic
contrast-enhanced pseudo-color maps (represented in black and white
in Fig. 4).
Significance of vascular function
parameters in the differential diagnosis of benign and malignant
breast lesions
The differences in Ktrans, Kep and iAUC between
benign and malignant tumors were statistically significant
(P<0.05). The difference in Ve between benign and malignant
tumors was not statistically significant (P>0.05, Table I).
 | Table IComparison of vascular function
parameters between benign and malignant groups. |
Table I
Comparison of vascular function
parameters between benign and malignant groups.
| Group | n | Ktrans
(min−1) | Kep
(min−1) | Ve | iAUC |
|---|
| Benign | 14 | 0.136±0.088 | 0.291±0.185 | 0.565±0.196 | 4.633±3.687 |
| Malignant | 30 | 0.967±0.361a | 1.742±0.552a | 0.581±0.137 | 14.614±5.692a |
Significance of vascular function
parameters in the grading of breast invasive ductal carcinoma
The differences in Ktrans, Kep and iAUC between
grade I and grade II, and between grade I and grade III of ductal
carcinoma were statistically significant (P<0.05). The
differences in Ktrans and Kep between grade II and grade III of
invasive ductal carcinoma were not statistically significant
(P>0.05). No statistically significant differences in Ve were
observed among grades I, II and III of invasive ductal carcinoma
(P>0.05, Table II).
| Table IIComparison of vascular function
parameters among different histological grades of invasive ductal
carcinoma. |
Table II
Comparison of vascular function
parameters among different histological grades of invasive ductal
carcinoma.
| Grading | n | Ktrans
(min−1) | Kep
(min−1) | Ve | iAUC |
|---|
| Grade I | 5 | 0.579±0.030 | 1.199±0.050 | 0.480±0.016 | 7.737±0.170 |
| Grade II | 14 | 1.196±0.268a | 2.000±0.503a | 0.628±0.118 | 14.558±4.054a |
| Grade III | 7 | 1.011±0.242a | 2.001±0.312a | 0.556±0.199 | 20.465±1.936a |
Diagnostic value of vascular function
parameters at 95% confidence
The lower bounds at 95% confidence of the Ktrans,
Kep and iAUC values in malignant cancers were defined as the
boundary values for the respective differential diagnosis of benign
and malignant lesions. Ktrans, Kep and iAUC had high sensitivity
and specificity in the differential diagnosis of benign and
malignant lesions, of which Ktrans had the superior diagnostic
performance with the highest sensitivity and specificity (Table III).
| Table IIIEfficacy of Ktrans, Kep and iAUC in
the diagnosis of benign and malignant lesions. |
Table III
Efficacy of Ktrans, Kep and iAUC in
the diagnosis of benign and malignant lesions.
| Parameters (%) | Boundary value | Sensitivity (%) | Specificity (%) |
|---|
| Ktrans
(min−1) | 0.832 | 80.0 | 92.9 |
| Kep
(min−1) | 1.536 | 66.7 | 86.7 |
| iAUC | 12.488 | 73.3 | 85.7 |
Discussion
Perfusion-weighted imaging (PWI) is an imaging
technique that reflects tissue or microvascular lesion distribution
and blood flow perfusion, which is able to evaluate angiogenesis in
tumor tissues in vivo in a non-destructive manner and is
extremely valuable for studying tumor blood supply (16). DCE-MRI is a PWI technology that can
indirectly reflect the functional status of tumor blood vessels,
thereby providing a reliable basis for further diagnosis and
treatment by revealing the microvascular perfusion status and the
degree of tissue vascularization. The pathological basis of the
perfusion effect includes changes in the number of tumor vascular
vessels, and changes in blood vessel function. Malignant tumors can
release vascular endothelial cell growth factor to induce capillary
growth. For such tumors, it has been observed that neovessel
density is high, an early tumor perfusion effect is evident,
neovascular walls are incomplete, and contrast agent rapidly bleeds
into the extracellular space to result in rapid filling of the
tumor with contrast agent and a fast outflow rate (17). However, for benign tumors, vascular
provision is relatively less, and the contrast agent infusion
effect is not evident (18).
DCE-MRI can dynamically display the pharmacokinetic
changes of contrast agent in the vessels as a continuously obtained
series of images. Currently, the blood dual-chamber kinetic model
(dual-chamber representation of the microvascular and extravascular
interstitium) proposed by Tofts et al (19) is widely used to perform DCE-MRI.
The results are analyzed to obtain the following vascular function
parameters: Ktrans, Kep, Ve and iAUC. iAUC is actually a
semi-quantitative parameter that is associated with blood flow into
the tumor, tumor perfusion and tumor tissue spaces (20,21),
and can effectively reflect changes in Ktrans, Kep and Ve.
Ocak et al (22) demonstrated that the Ktrans and Kep
values of prostate malignancy were significantly higher than those
of benign lesions. Yao et al (23) identified that Ktrans and Kep
differed significantly between normal bowel walls and rectal
cancer. In addition, the authors observed statistically significant
differences in Ktrans between colorectal cancer with lymph node
metastasis and that without lymph node metastasis, and among
different Dukes stage of colorectal cancer, while Kep and Dukes’
stage had a moderate correlation. Li et al (24) found that Kep was able to predict
the efficacy of the first cycle of neoadjuvant chemotherapy in
breast cancer patients. Nilsen et al (25) observed that Ktrans and Kep had a
statistically significant difference between breast cancer lesions
associated with bone metastasis and that without bone metastases;
the perfusion and vascular permeability of breast cancer lesions
with metastasis were significantly lower than those of
non-metastatic breast cancer lesions. The present study
demonstrated that the Ktrans, Kep and iAUC values of malignant
breast lesions were significantly higher than those of benign
lesions; this may be associated with the biological characteristics
of the lesions. The malignant lesions were vigorously growing with
increased tumor angiogenesis, increased microvessel density and
structural disorder, partially incomplete neovascular endothelium
and abnormal vascular endothelial cell morphology. They also
exhibited enlarged spaces between the endothelium and basement
membrane, basement membrane and vascular pericytes. Thus, the
angiogenesis of malignant lesions was associated with a high
permeability (26). For benign
lesions, the neovascularization was less than that of malignant
lesions, and vascular endothelium growth was relatively complete.
Therefore, for malignant lesions, the diffusion rate of contrast
agent from intravascular to extravascular tissues and the diffusion
rate of contrast agent from extravascular tissues back to vessels
were significantly greater than those of benign lesions, which was
reflected as higher Ktrans and Kep values for malignant lesions
than for benign lesions.
Tofts (27) found
that the Ve value was less consistent than the other vascular
function parameters; this was considered to be due with the fact
that Ve is often affected by edema around the lesion. Certain
scholars also consider that this may be associated with the slow
rate of change in the relative proportions of extravascular
extracellular volume within the organization in the process of
disease development, resulting in the Ve value range between benign
and malignant lesions having a degree of overlap (28,29).
The present study demonstrated that Ve values did not significantly
differ between benign and malignant lesions, which is associated
the characteristics of Ve, as it represents the percentage of
contrast agent retained in tissue spaces. Ktrans, Kep and Ve
satisfy the following relationship: Ve = Ktrans/Kep. The
neovascular permeability of malignant lesions is high, resulting in
increased Ktrans and Kep values; however, the increase in the
proportions of the two values is uncertain. Therefore, the Ve
values of benign and malignant lesions did not exhibit a
significant difference.
The study further analyzed the vascular function
parameters among different pathological grades in invasive ductal
carcinoma. It was found that the differences in Ktrans and Kep
among grades I, II and III of invasive ductal carcinoma were
statistically significant, while no statistically significant
differences of Ktrans and Kep were observed between grades II and
III of invasive ductal carcinoma. The Ve values demonstrated no
statistically significant differences among grades I, II and III of
invasive ductal carcinoma. Tumor formation and development can be
divided into two stages, namely the clonal proliferation stage of
tumor cells and the tumor angiogenesis-promoting sustainable growth
phase (30). Breast cancer is
pathologically graded through duct/gland formation, nuclear
pleomorphism and mitotic count. Grade I invasive ductal carcinoma
comprises mostly duct/gland formation and early mitotic stage. At
this grade, the endothelial integrity is relatively good. The
vascular endothelial differentiation of grade II and III invasive
ductal carcinoma is poor with high permeability and increased
perfusion resistance; however, as grades II and III are
characterized by high permeability, there may be some overlap in
the monitoring parameters of tumor blood vessel growth of the two
grades. Furthermore, the number of cases was few, which may lead to
the generation of errors.
Baek et al (31) found that Ktrans had relatively
greater significance among the vascular function parameters for the
differential diagnosis of benign and malignant lesions. The present
study found that the diagnostic sensitivity was 80.0% when Ktrans
was 0.832 min–1, and the specificity was 92.9%, both of
which were higher than the values for Kep and iAUC. Therefore,
Ktrans was more meaningful in differentiating benign and malignant
lesions, and can provide a quantitative indicator for clinical
diagnosis.
In conclusion, this study compared vascular function
parameters between benign and malignant breast lesions and among
different levels of invasive ductal carcinoma and found that
vascular function parameters (Ktrans, Kep and iAUC) were meaningful
in the differential diagnosis of benign and malignant breast
lesions. The sensitivity and specificity of Ktrans were the
highest, and had a certain degree of significance in the grading of
invasive ductal carcinoma. However, this study included a
relatively small number of patients; a larger sample should be
investigated in future studies. The optimal imaging parameters of
dynamic contrast-enhanced MR imaging of the breast were collected
and analyzed to obtain optimal vascular function parameters. Thus,
the diagnosis and differential diagnosis of benign and malignant
breast lesions was investigated.
References
|
1
|
Berg WA, Gutierrez L, NessAiver MS, Carter
WB, Bhargavan M, Lewis RS and Ioffe OB: Diagnostic accuracy of
mammography, clinical examination, US, and MR imaging in
preoperative assessment of breast cancer. Radiology. 233:830–849.
2004. View Article : Google Scholar : PubMed/NCBI
|
|
2
|
Liberman L: Breast cancer screening with
MRI - what are the data for patients at high risk? N Engl J Med.
351:497–500. 2004. View Article : Google Scholar : PubMed/NCBI
|
|
3
|
Folkman J: Tumor angiogenesis: therapeutic
implications. N Engl J Med. 285:1182–1186. 1971. View Article : Google Scholar : PubMed/NCBI
|
|
4
|
Weidner N, Folkman J, Pozza F, et al:
Tumor angiogenesis: a new significant and independent prognostic
indicator in early-stage breast carcinoma. J Natl Cancer Inst.
84:1875–1887. 1992. View Article : Google Scholar : PubMed/NCBI
|
|
5
|
DeVries A, Griebel J, et al:
Perfusion-index values evaluated by dynamic magnetic resonance
imaging in advanced rectal carcinoma. A new predictor of response
to preoperative radiochemotherapy? Strahlenther Onkol. 176:567–572.
2000.(In German).
|
|
6
|
Kremer S, Grand S, Rémy C, et al:
Contribution of dynamic contrast MR imaging to the differentiation
between dural metastasis and meningioma. Neuroradiology.
46:642–648. 2004. View Article : Google Scholar : PubMed/NCBI
|
|
7
|
Haris M, Gupta RK, Singh A, et al:
Differentiation of infective from neoplastic brain lesions by
dynamic contrast-enhanced MRI. Neuroradiology. 50:531–540. 2008.
View Article : Google Scholar : PubMed/NCBI
|
|
8
|
Zhang H, Rödiger LA, et al: Perfusion MR
imaging for differentiation of benign and malignant meningiomas.
Neuroradiology. 50:525–530. 2008. View Article : Google Scholar : PubMed/NCBI
|
|
9
|
Pickles MD, Manton DJ, Lowry M and
Turnbull LW: Prognostic value of pre-treatment DCE-MRI parameters
in predicting disease free and overall survival for breast cancer
patients undergoing neoadjuvant chemotherapy. Eur J Radiol.
71:498–505. 2009. View Article : Google Scholar
|
|
10
|
Kang TW, Kim ST, Byun HS, et al:
Morphological and functional MRI, MRS, perfusion and diffusion
changes after radiosurgery of brain metastasis. Eur J Radiol.
72:370–380. 2009. View Article : Google Scholar
|
|
11
|
Hauser T, Essig M, Jensen A, et al:
Characterization and therapy monitoring of head and neck carcinomas
using diffusion-imaging-based intravoxel incoherent motion
parameters-preliminary results. Neuroradiology. 55:527–536. 2013.
View Article : Google Scholar : PubMed/NCBI
|
|
12
|
Larsen VA, Simonsen HJ, Law I, Larsson HB
and Hansen AE: Evaluation of dynamic contrast-enhanced T1-weighted
perfusion MRI in the differentiation of tumor recurrence from
radiation necrosis. Neuroradiology. 55:361–369. 2013. View Article : Google Scholar
|
|
13
|
Bäuerle T, Seyler L, Münter M, et al:
Diffusion-weighted imaging in rectal carcinoma patients without and
after chemoradiotherapy: a comparative study with histology. Eur J
Radiol. 82:444–452. 2013. View Article : Google Scholar
|
|
14
|
Jones EF, Sinha SP, Newitt DC, Klifa C,
Kornak J, Park CC and Hylton NM: Mri enhancement in stromal tissue
surrounding breast tumors: association with recurrence free
survival following neoadjuvant chemotherapy. PLoS One.
8:e619692013. View Article : Google Scholar : PubMed/NCBI
|
|
15
|
Li X, Arlinghaus LR, Ayers GD, et al:
Dce-mri analysis methods for predicting the response of breast
cancer to neoadjuvant chemotherapy: pilot study findings. Magn
Reson Med. 71:1592–1602. 2014. View Article : Google Scholar
|
|
16
|
Schnall MD, Blume J, Bluemke DA, DeAngelis
GA, et al: Diagnostic architectural and dynamic features at breast
MR imaging: multicenter study. Radiology. 238:42–53. 2006.
View Article : Google Scholar
|
|
17
|
Rykala J, Przybylowska K, Majsterek I, et
al: Angiogenesis markers quantification in breast cancer and their
correlation with clinicopathological prognostic variables. Pathol
Oncol Res. 17:809–817. 2011. View Article : Google Scholar : PubMed/NCBI
|
|
18
|
Medeiros LR, Duarte CS, Rosa DD, Edelweiss
MI, et al: Accuracy of magnetic resonance in suspicious breast
lesions: a systematic quantitative review and meta-analysis. Breast
Cancer Res Treat. 126:273–285. 2011. View Article : Google Scholar : PubMed/NCBI
|
|
19
|
Tofts PS, Brix G, Buckley DL, et al:
Estimating kinetic parameters from dynamic contrast-enhanced
t1-weighted mri of a diffusable tracer: standardized quantities and
symbols. J Magn Reson Imaging. 10:223–232. 1999. View Article : Google Scholar : PubMed/NCBI
|
|
20
|
Padhani AR and Husband JE: Dynamic
contrast-enhanced mri studies in oncology with an emphasis on
quantification, validation and human studies. Clin Radiol.
56:607–620. 2001. View Article : Google Scholar : PubMed/NCBI
|
|
21
|
Preda A, van Vliet M, Krestin GP, Brasch
RC and van Dijke CF: Magnetic resonance macromolecular agents for
monitoring tumor microvessels and angiogenesis inhibition. Invest
Radiol. 41:325–331. 2006. View Article : Google Scholar : PubMed/NCBI
|
|
22
|
Ocak I, Bernardo M, Metzger G, Barrett T,
Pinto P, Albert PS and Choyke PL: Dynamic contrast-enhanced mri of
prostate cancer at 3 t: a study of pharmacokinetic parameters. AJR
Am J Roentgenol. 189:849–858. 2007. View Article : Google Scholar : PubMed/NCBI
|
|
23
|
Yao WW, Zhang H, Ding B, et al: Rectal
cancer: 3d dynamic contrast-enhanced mri; correlation with
microvascular density and clinicopathological features. Radiol med.
116:366–374. 2011. View Article : Google Scholar : PubMed/NCBI
|
|
24
|
Li X, Arlinghaus LR, Ayers GD, et al:
dce-mri analysis methods for predicting the response of breast
cancer to neoadjuvant chemotherapy: pilot study findings. Magn
Reson Med. 71:1592–1602. 2014. View Article : Google Scholar
|
|
25
|
Nilsen LB, Fangberget A, Geier OM,
Engebraaten O, Borgen E, Olsen DR and Seierstad T: Associations
between tumor vascularization assessed by in vivo dce-mri and the
presence of disseminated tumor cells in bone marrow in breast
cancer patients at the time of diagnosis. J Magn Reson Imaging. Jan
27–2014.(Epub ahead of print). View Article : Google Scholar : PubMed/NCBI
|
|
26
|
Jain RK: Normalization of tumor
vasculature: an emerging concept in antiangiogenic therapy.
Science. 307:58–62. 2005. View Article : Google Scholar : PubMed/NCBI
|
|
27
|
Tofts PS: Modeling tracer kinetics in
dynamic gd-dtpa mr imaging. J Magn Reson Imaging. 7:91–101. 1997.
View Article : Google Scholar : PubMed/NCBI
|
|
28
|
Wang Y1, Huang W, Panicek DM, et al:
Feasibility of using limited-population-based arterial input
function for pharmacokinetic modeling of osteosarcoma dynamic
contrast-enhanced MRI data. Magn Reson Med. 59:1183–1189. 2008.
View Article : Google Scholar : PubMed/NCBI
|
|
29
|
Koo HR, Cho N, Song IC, et al: Correlation
of perfusion parameters on dynamic contrast-enhanced MRI with
prognostic factors and subtypes of breast cancers. J Magn Reson
Imaging. 36:145–151. 2012. View Article : Google Scholar : PubMed/NCBI
|
|
30
|
Siegmann KC, Müller-Schimpfle M, Schick F,
et al: Mr imaging-detected breast lesions: histopathologic
correlation of lesion characteristics and signal intensity data. Am
J Roentgenol. 178:1403–1409. 2002. View Article : Google Scholar
|
|
31
|
Baek HM, Chen JH, Nie K, et al: Predicting
pathologic response to neoadjuvant chemotherapy in breast cancer by
using mr imaging and quantitative 1h mr spectroscopy. Radiology.
251:653–662. 2009. View Article : Google Scholar : PubMed/NCBI
|