Introduction
Hepatic fibrosis is a condition in which scar
formation occurs in the liver. The process occurs normally during
the formation of the excessive accumulation of collagenous
extracellular matrix (ECM) (1,2), or
during scar tissue formation to replace normal tissue that has been
lost through injury, infection or chronic liver insults (1,3–7).
Specifically, hepatic fibrosis is the result of derangements in the
synthesis and degradation of the matrix due to insults occurring in
the mesenchymal cells that synthesize various components of the
ECM, including collagen types I-VII (4,8).
During our previous study on the effect of green tea extract (GTE)
on the liver, kidney and stomach, the beneficial role of GTE in
controlling the deleterious effects of reserpine was observed just
30 days after its administration (9). This encouraged us to study the
effectiveness of GTE in ameliorating the hepatic fibrosis induced
by two hepatic carcinogens, carbon tetrachloride (CCl4)
and ethanol. Hepatic fibrosis brings about a histological change
due to inflammation that causes hepatic stellate cells (HSCs) to be
overactive. This activity triggers ECM synthesis and the deposition
of collagen fibers in the extracellular spaces of the liver cells.
In this process, blood infusion is lost and the tissue hardens,
leading to liver fibrosis (10,11).
Currently, there is no effective treatment for
hepatic fibrosis, and a number of patients develop a progressive
form of hepatic cirrhosis. In a preliminary study, a rat model with
GTE was used to control the hepatic fibrosis induced after four
weeks of CCl4 administration (12). The rate of destruction of collagen
fibers was increased. Ethanol has also been used as a hepatotoxin
with a significant effect on the liver in causing hepatic fibrosis
(13–15). The present study attempted to
further expand on the therapeutic effects of GTE on hepatic
fibrosis in rats using a model in which rats were exposed to
CCl4 and ethanol together. The therapeutic effects of
GTE on hepatic fibrosis, induced in rat liver through dual exposure
to CCl4 plus ethanol, were investigated histologically
and with three-dimensional (3D) observation using scanning electron
microscopy.
Materials and methods
Preparation of GTE
Dried tea leaves (100 g) were powdered in a Waring
blender (Waring Laboratory Supplies, Torrington, CT, USA), and
extracted with double distilled water (1 l), at 85°C for 1 h. The
extract was filtered through a nylon filter, and the filtrate was
centrifuged at 3,000 × g for 15 min. The clear supernatant was
removed and the residual pellet was agitated with distilled water,
warmed at 35°C and centrifuged again. The supernatant was pooled,
lyophilized and the resulting material was stored at −20°C in a
screw-capped bottle.
Schedule and groups of animals under
investigation
Male albino rats (n=70), weighing 200–250 g, were
obtained from the Animal Center in the Faculty of Science at Kuwait
University (Kuwait City, Kuwait). The rats were maintained in an
environmentally controlled room (temperature, 23±2°C; humidity,
55±10%) with a 12-h light/dark cycle and access to food and water
ad libitum. Rats were weighed weekly using a digital
balance; all the readings were recorded for statistical analysis
and were used as an indication of chemical toxicity. The animals
were sacrificed at the end of the treatment duration, following
anesthetization with an intraperitoneal injection of 50 mg/kg
pentobarbital.
Experimental design
An experimental model of hepatic fibrosis was
established chemically using ethanol and CCl4 separately
and simultaneously. The rats were divided into seven groups as
follows. GI rats (normal control) were administered a subcutaneous
injection of 1 ml/100 g olive oil three times a week for three
weeks. In GII and GIII, hepatic fibrosis was established using
ethanol and CCl4. Since ethanol increases the activation
of cytochrome c, which accentuates the metabolic activation
of CCl4, the rats were orally administered 1 ml/100 g
ethanol (25%) twice a week for one week, and subsequently 1 ml/100
g CCl4 (40%) by subcutaneous injection three times a
week with an oral dose of 1 ml/100 g ethanol (25%) twice a week (on
different days) for three weeks. The rats in GIII were subsequently
treated with 1 ml/100 g GTE orally for three weeks. A hepatic
fibrosis model was established in GIV and GV using ethanol alone.
The rats were administered an oral dose of 1 ml/100 g ethanol (25%)
twice a week for four weeks in GIV and three weeks in GV. GV rats
were then administered 1 ml/100 g GTE for four weeks. In GVI and
GVII, CCl4 was used to establish a model of hepatic
fibrosis. The rats were administered a subcutaneous injection of 1
ml/100 g CCl4 (40%) three times a week for three weeks.
GVII rats also received 1 ml/100 g GTE orally for three weeks.
Blood sampling
Blood samples were collected by cardiac puncture
following dissection. The blood was collected into dry, clean
centrifuge tubes. All samples were centrifuged at 3,000 rpm for 15
min to separate the serum for the determination of aspartate
aminotransferase (AST) and alanine aminotransferase (ALT).
Histology
Liver tissues were fixed by immersion in 10%
buffered neutral formalin for 18 h, processed by dehydration in an
ascending series of alcohol (50, 70 and 100%) and cleared with
xylene and paraffin wax. The samples were subsequently embedded in
paraffin, cut into 5–7 μm sections using a rotary microtome and
stained with hematoxylin and eosin (H&E).
Tissue preparation for semi-thin
sections
Liver samples from the groups of rats were fixed in
2.5% glutaraldehyde/sodium cacodylate fixative, pH 7.2 at 0–4°C for
two hours, then changed to a fresh fixative and left overnight. The
tissues were then transferred to sodium cacodylate/sucrose buffer,
three times for 20 mins each, then to 1%
OsO4/PO4 buffer for 2 h and were then blocked
in Epon. Semi-thin sections (1 μm) were cut using a Leica
ultra-microtome and stained with toluidine blue for observation by
light microscopy and photography.
Masson’s trichrome stain
Liver sections (7 μm) fixed in 10% buffered neutral
formalin were processed for collagen fiber staining using Masson’s
trichrome stain.
3D architecture
Sample blocks from all the groups were prepared and
processed for scanning electron microscopy for a 3D-architectural
observation. The blocks (~7.0 mm3) were fixed in 3%
glutaraldehyde/cacodylate buffer (pH 7.2) using a tissue processor,
then dehydrated in ethanol and freeze-dried in CO2. Each
tissue block was then split into two, and each half of the block
was fixed on a stub with the newly exposed surface facing upwards.
The stubs were coated with platinum/gold using a spotter coater. A
Jeol JCM 5700 Carryscope mobile scanning electron microscope (SEM;
Jeol USA, Inc., Peabody, MA, USA), with a resolution of 5.0 nm, was
used for attaining the SEM images.
Biochemical analysis
AST and ALT values in all seven groups of rats were
measured in serum samples using kits from Randox Laboratories Ltd.
(Crumlin, Northern Ireland). The results are expressed in U/l.
Statistical analysis
Statistical analysis was performed by one-way
analysis of variance at the same time interval of weighing
(P<0.05), followed by comparisons between time intervals using
the least significant difference test (P<0.05), and comparing
the mean ± standard deviation from each experimental group with
that of the respective control group. The Pearson correlation
coefficient (r) test between weight (g) and period of study (weeks)
was performed. P<0.05 was considered to indicate a statistically
significant difference.
Results
AST and ALT levels
Rats treated with GTE showed results similar to
those of the control groups with normal AST and ALT levels
(Fig. 1; Table I). Serum AST and ALT levels were
significantly elevated in rats treated with CCl4 (GVI),
ethanol (GIV), and CCl4 plus ethanol only (GII),
indicating severe hepatic damage. The CCl4 plus GTE
(GVII), ethanol plus GTE (GV), and CCl4 plus ethanol
plus GTE (GIII) groups showed significant reductions in the levels
of these two enzymes compared with those in their respective model
control groups.
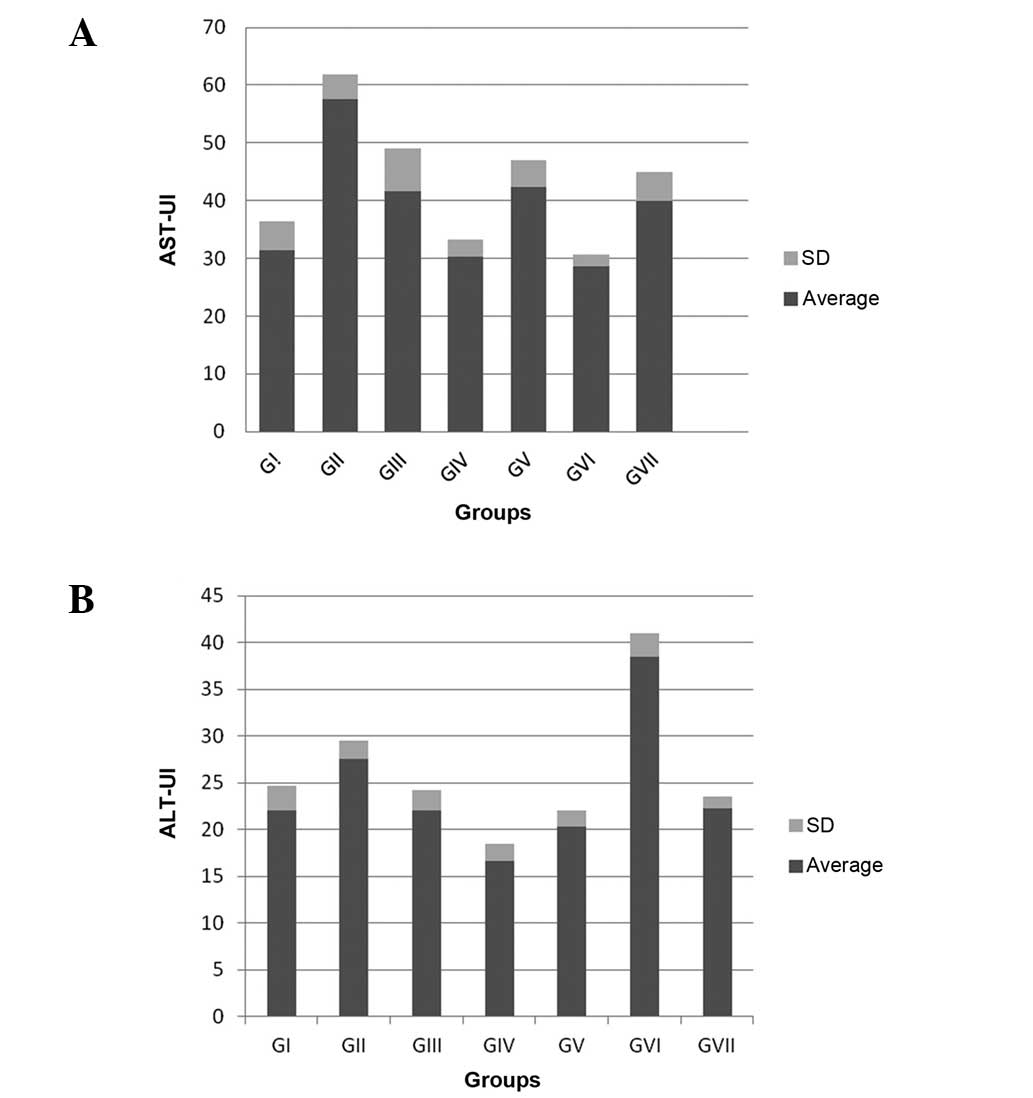 | Figure 1AST and ALT levels. (A) AST levels and
(B) ALT levels in rats treated with CCl4, ethanol, and
CCl4 plus ethanol in the presence and absence of GTE.
Groups: GI, normal control; GII, CCl4 plus ethanol;
GIII, CCl4 plus ethanol plus GTE; GIV, ethanol; GV,
ethanol plus GTE; GVI, CCl4; GVII, CCl4 plus
GTE. AST, aspartate aminotransferase; ALT, alanine
aminotransferase; SD, standard deviation; CCl4, carbon
tetrachloride; GTE, green tea extract. |
 | Table IALT and AST activity levels in the
studied groups. |
Table I
ALT and AST activity levels in the
studied groups.
| Activity levels
(U/I) | GI | GII | GIII | GIV | GV | GVI | GVII |
|---|
| ALT | 22.0±2.6 | 27.5±2.0b | 22.0±2.2a | 26.5±1.9b | 20.3±1.6a | 38.5±2.5b | 22.0±2.1a |
| AST | 31.4±4.9 | 41.6±7.5b | 30.3±2.9a | 40.0±4.9b | 28.6±2.0a | 57.5±4.4b | 40.0±4.9a |
Hepatic fibrosis
Hepatic fibrosis was evaluated by several criteria,
including the external features, weight and gross anatomy of the
rats. In the control rats, the fur color was bright white with a
healthy-looking tail. For the CCl4-treated animals
(GVI), the mean weight of the animals at the end of week 3 was
247.5±46.4 g, while following GTE administration (GVII) the mean
weight reached 302.7±37.8 g (P<0.05; Table II). The weights of the animals at
the end of week 4 for ethanol treatment (GIV) were 320.4±42.0 g,
while following GTE administration (GV) they reached 271.6±55.0 g
(P<0.05; Table III). However,
at the end of week 4, the mean weight of the animals in the ethanol
plus CCl4-treated group (GII) was 251.2±58.1 g, while
following GTE administration (GIII) they reached 271.6±55.0 g
(P<0.05; Table IV).
Furthermore, to evaluate whether normal growth was observed within
the study period, a two-tailed Pearson correlation coefficient test
was used and the results are shown in Table V. There was significant increase in
weight within the study period (normal growth; r=0.68, P<0.001)
in the control group, but the increase in weight in the
CCl4 group was not significant within the period of
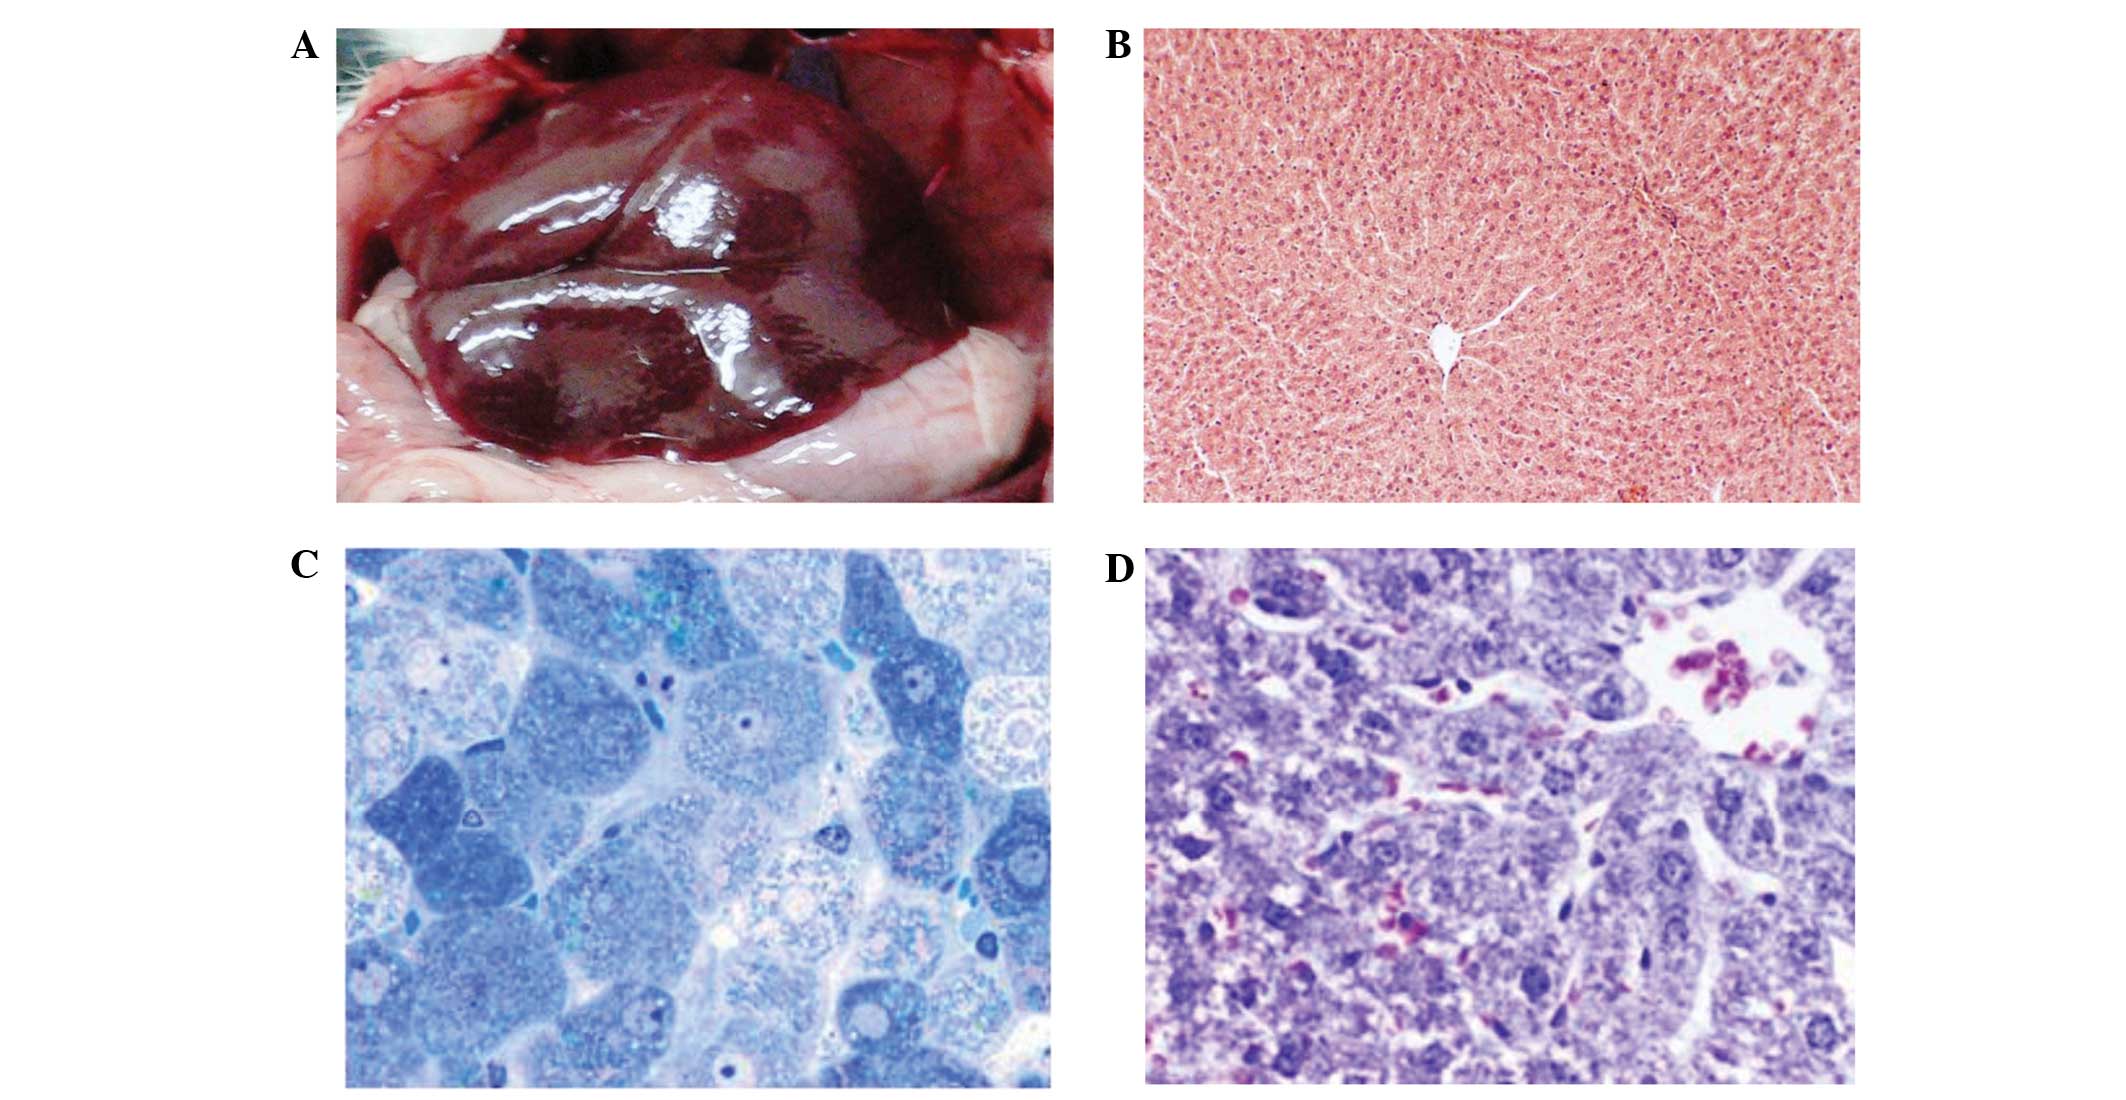
study, indicating that CCl4 suppresses growth. Gross
anatomy at the onset of postmortem and prior to organ excision
showed the liver of a rat from GI to exhibit a normal brownish-red
color with minimal loci of fat (Fig.
2A). In the H&E-stained paraffin and toluidine blue-stained
Epon sections, the control group showed normal tissue and cell
architecture (Fig. 2B and C). This
was also observed in the sections with Masson’s trichrome staining,
which is specifically for collagen fibers (Fig. 2D).
| Table IIRat weights in the control,
CCl4 and CCl4 plus GTE groups over three
weeks. |
Table II
Rat weights in the control,
CCl4 and CCl4 plus GTE groups over three
weeks.
| Week | Control group | CCl4
group | CCl4
plus GTE group | P-valuea |
|---|
| 1 | 213.0±22.8 | 246.0±38.4 | 246.6±45.0 | 0.0816 |
| 2 | 248.1±26.3 | 256.5±41.4 | 273.2±43.4 | 0.3355 |
| 3 | 262.5±26.2 | 247.5±46.4 | 302.7±37.8b | 0.0086 |
| Table IIIRat weights in the control, ethanol
and ethanol plus GTE groups over four weeks. |
Table III
Rat weights in the control, ethanol
and ethanol plus GTE groups over four weeks.
| Week | Control group | Ethanol group | Ethanol plus GTE
group | P-valuea |
|---|
| 1 | 213.0±22.8 | 276.6±28.9b | 246.9±25.8b | <0.0001 |
| 2 | 248.1±26.3 | 300.4±37.4b | 277.9±41.3 | 0.0105 |
| 3 | 262.5±26.2 | 311.4±39.4c | 272.5±47.8 | 0.0220 |
| 4 | 281.9±33.3 | 320.4±42.0c | 271.6±55.0 | 0.0499 |
| Table IVRat weights in the control,
CCl4 plus ethanol and CCl4 plus ethanol plus
GTE groups over four weeks. |
Table IV
Rat weights in the control,
CCl4 plus ethanol and CCl4 plus ethanol plus
GTE groups over four weeks.
| Week | Control group | CCl4
plus ethanol group | CCl4
plus ethanol plus GTE group | P-valuea |
|---|
| 1 | 213.0±22.8 | 275.6±45.1b | 271.8±36.4b | 0.0007 |
| 2 | 248.1±26.3 | 274.7±46.2 | 277.9±41.3 | 0.1900 |
| 3 | 262.5±26.2 | 256.2±57.3 | 272.5±47.5 | 0.7459 |
| 4 | 281.9±33.3 | 251.2±58.1 | 271.6±55.0 | 0.4563 |
| Table VTwo-tailed Pearson correlation
coefficient test between rat weight (g) and period of study
(weeks). |
Table V
Two-tailed Pearson correlation
coefficient test between rat weight (g) and period of study
(weeks).
| Group | r | P-value |
|---|
| Control (n=40) | 0.68 | <0.001 |
| CCl4
(n=30) | 0.02 | 0.94 |
| CCl4
plus GTE (n=30) | 0.50 | 0.009 |
| Ethanol (n=40) | 0.41 | 0.01 |
| Ethanol plus GTE
(n=40) | 0.18 | 0.27 |
| CCl4
plus ethanol (n=34) | −0.20 | 0.25 |
| CCl4
plus ethanol plus GTE (n=40) | −0.02 | 0.92 |
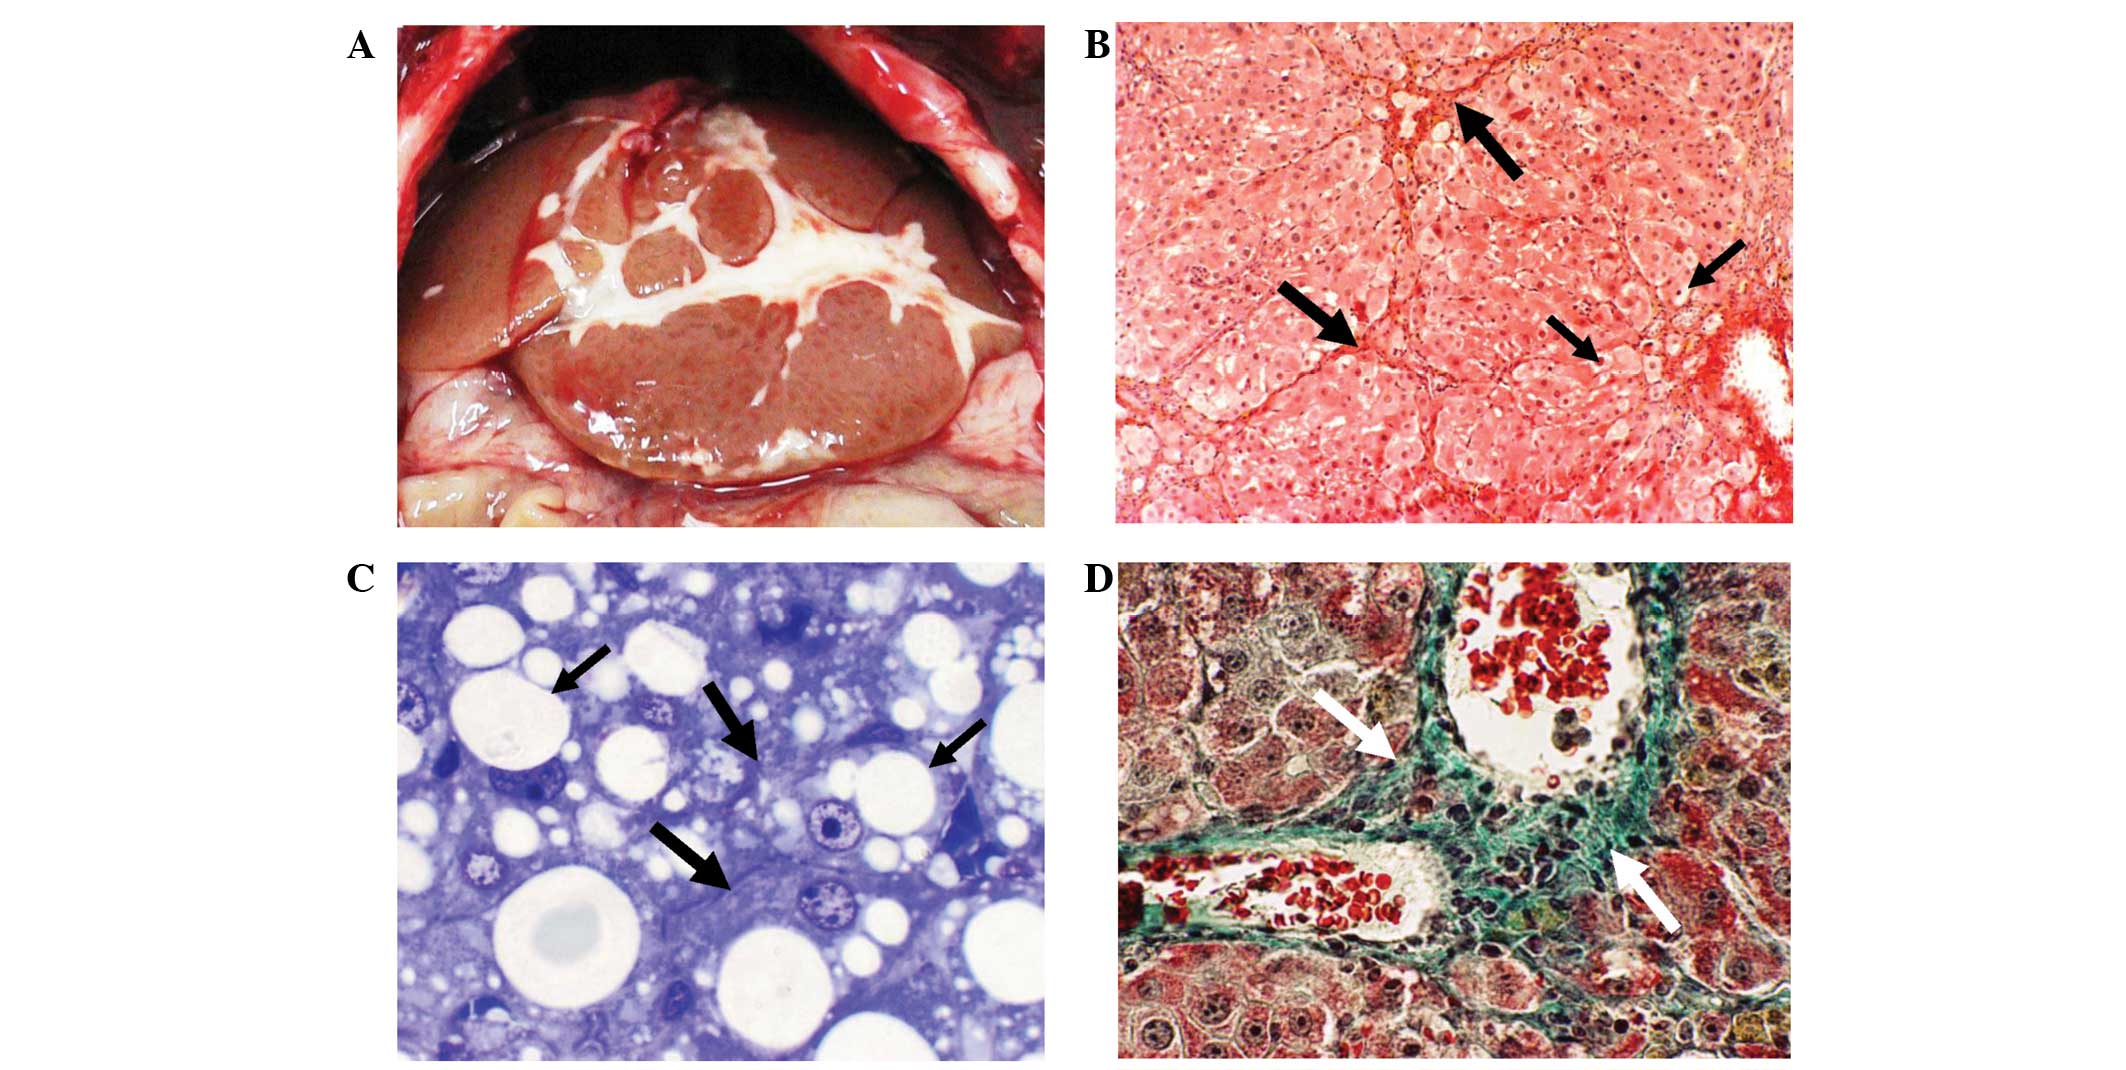
In the CCl4 plus ethanol group (GII) the
external features of the rat showed fur with yellowish to brown
coloration with an abnormally dark-colored tail. At the onset of
postmortem and prior to organ excision, the liver appeared fibrotic
and orange in color and was topped with thick fat (Fig. 3A). The H&E-stained paraffin and
toluidine blue-stained Epon sections exhibited pathological
features, notably including the formation of an extensive amount of
extracellular fibrous materials in the parenchyma of the liver
(Fig. 3B and C). Fibrous materials
(collagen fibers) were clearly observed in the Masson’s
trichrome-stained sections as shades of blue-green-stained
structures (Fig. 3D). Profuse
collagen fiber deposits filled a number of areas in the
extracellular spaces of the liver parenchyma of GII rats. The
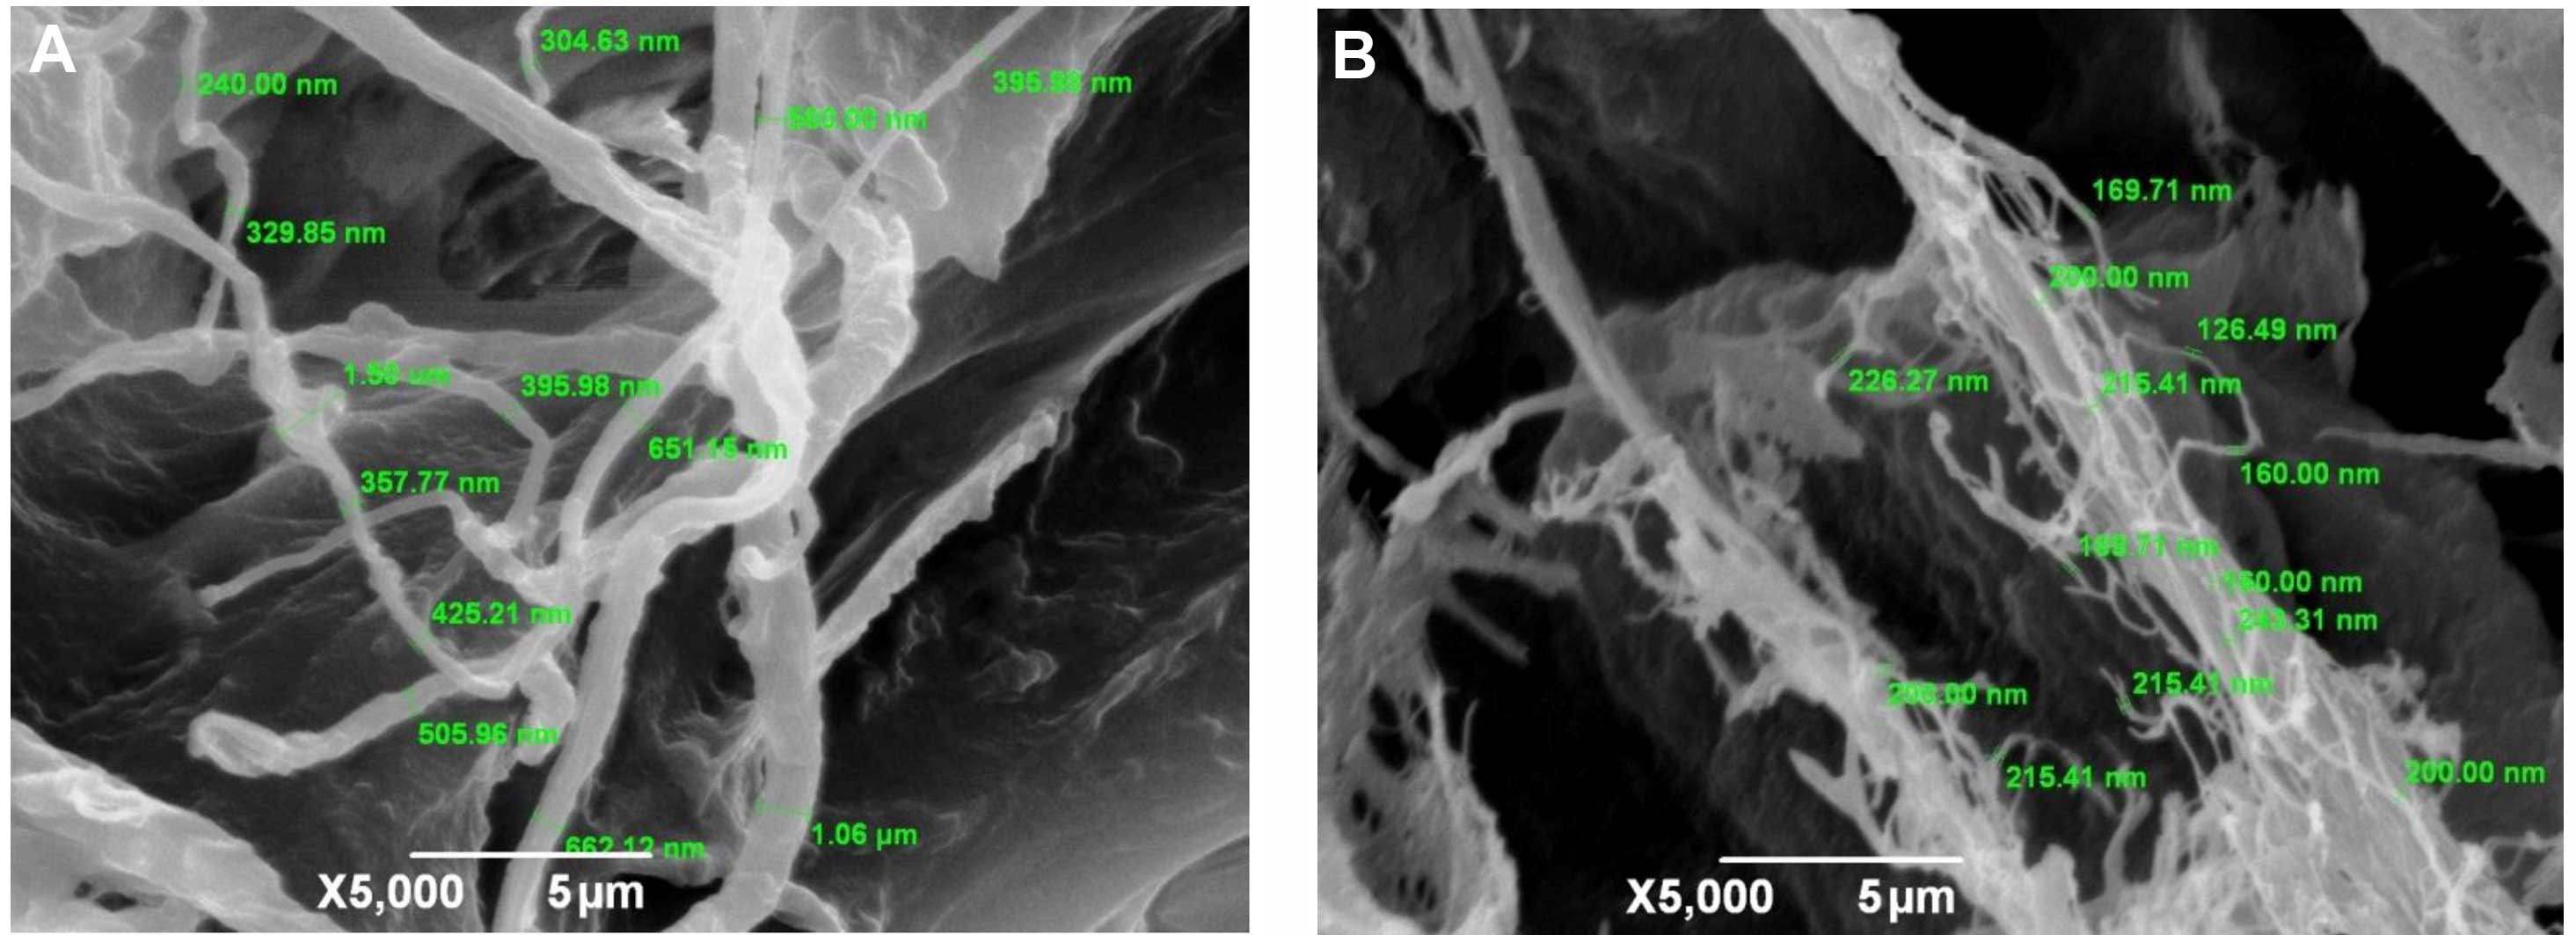
fibers varied in thickness from 250 to 1,000 nm (Fig. 4). Other pathological features
observed were the destruction of the lobular architecture,
inflammation, foamy vacuolated cytoplasm, necrosis, fatty cells,
steatosis, nuclear shrinkage, abnormal tri- and tetra-polar
divisions, nuclear karyorrhesis, nuclear karyolysis, nuclear
hyperchromatism, dead cells, thickening of the portal vein and
triad, hypertension of arterioles, nuclear hyperchromatism, nuclear
fragmentation, condensed eosinophilic protein, hyperactive Kupffer
cells and proliferation of HSCs (data not shown). The Carryscope
SEM facilitated the observation of two types of fibrous materials
in the ECM: Thick fibers (average 312.41 nm) always appeared in the
CCl4-treated liver (GII) and thin, fluffy fibers
(average 169.71 nm) always appeared in the ethanol-treated liver
(GIV; Fig. 4).
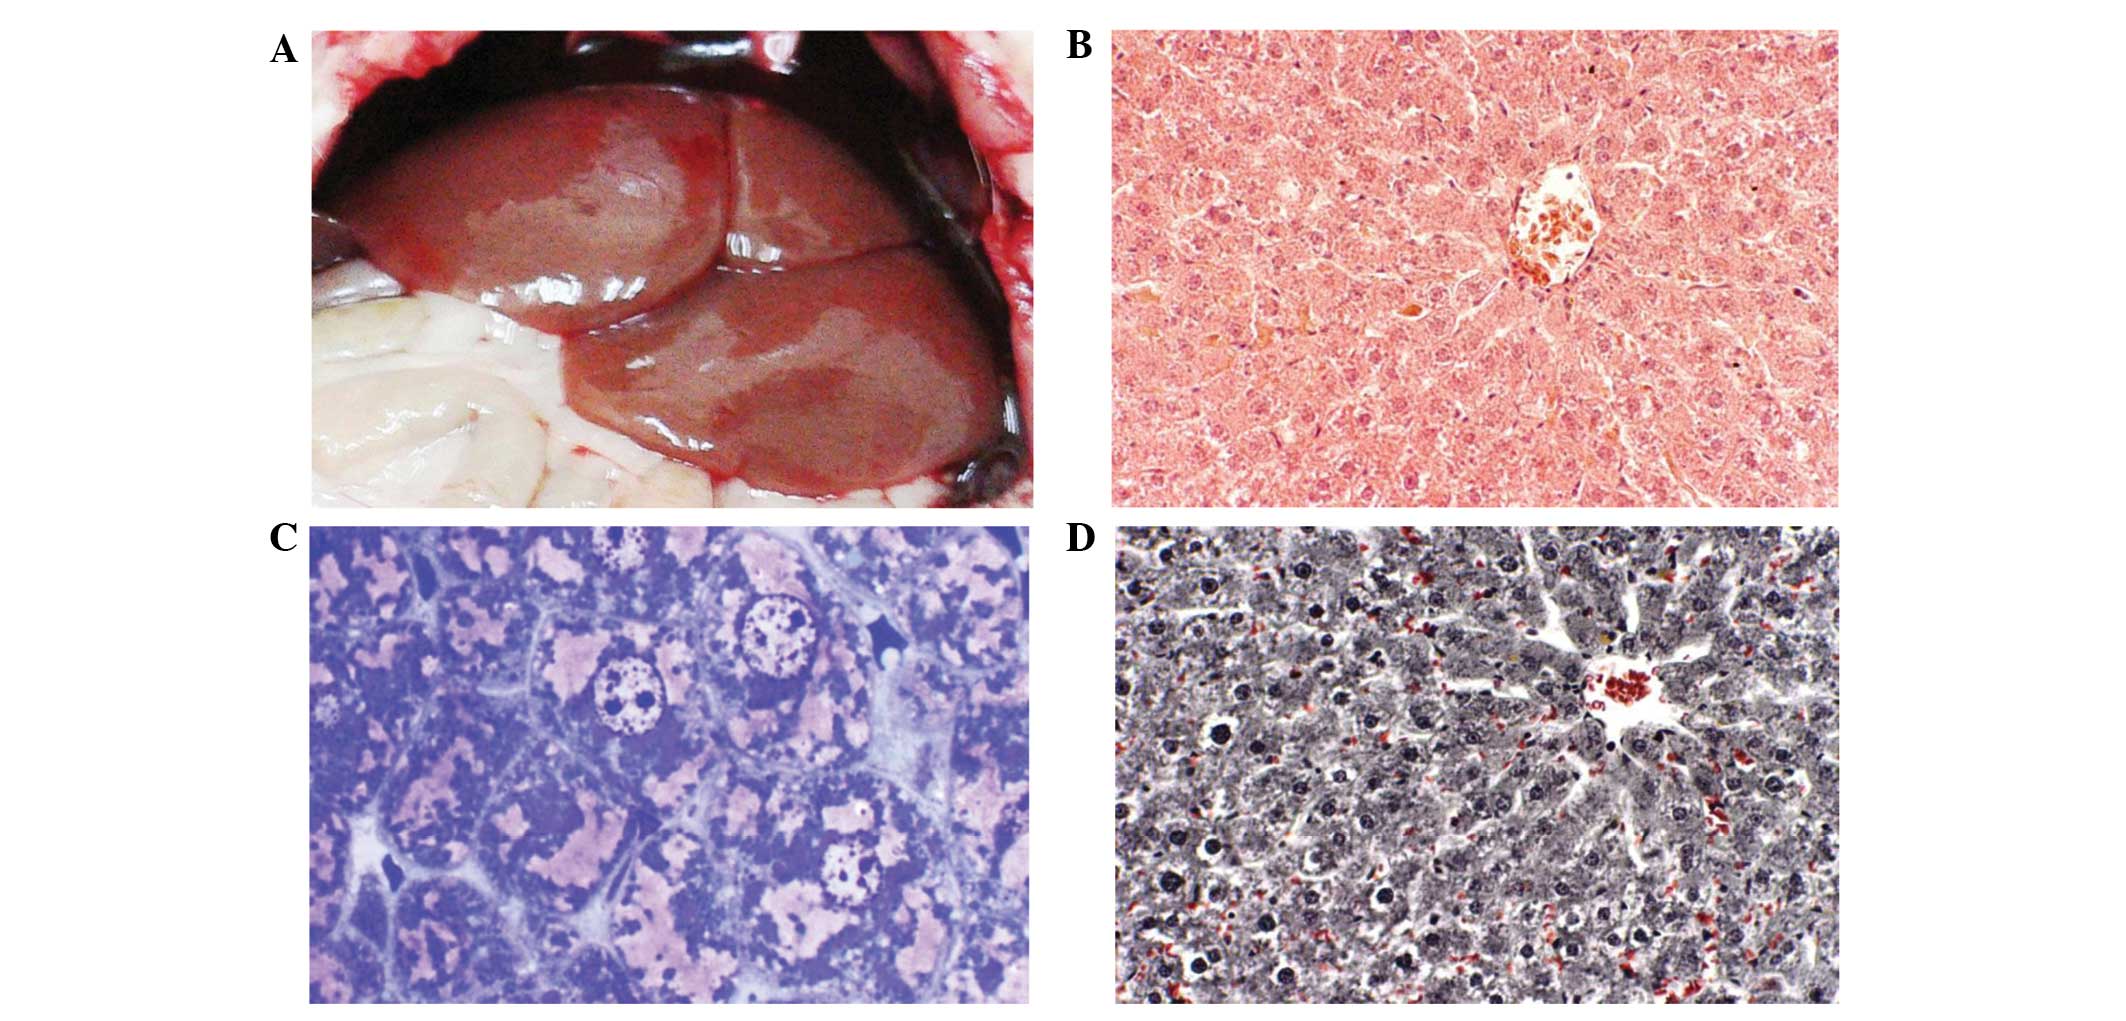
Effects of GTE treatment
Rats in the CCl4 plus ethanol plus GTE
group (GIII) exhibited almost complete restoration of liver
function. Externally, the normal, healthy, bright color of the rat,
including the tail, was restored. In the gross morphology, the
liver looked fairly normal, exhibiting a bright red color and the
absence of fat (Fig. 5A). Fibrous
materials and lipid droplets were not present as demonstrated in
the H&E-stained paraffin or toluidine blue-stained Epon
sections (Fig. 5B and C). Masson’s
trichrome-stained sections of liver tissue exhibited prominent
restoration of liver morphology. The fibrous materials completely
disappeared from the ECM and there were no signs of lipid droplets
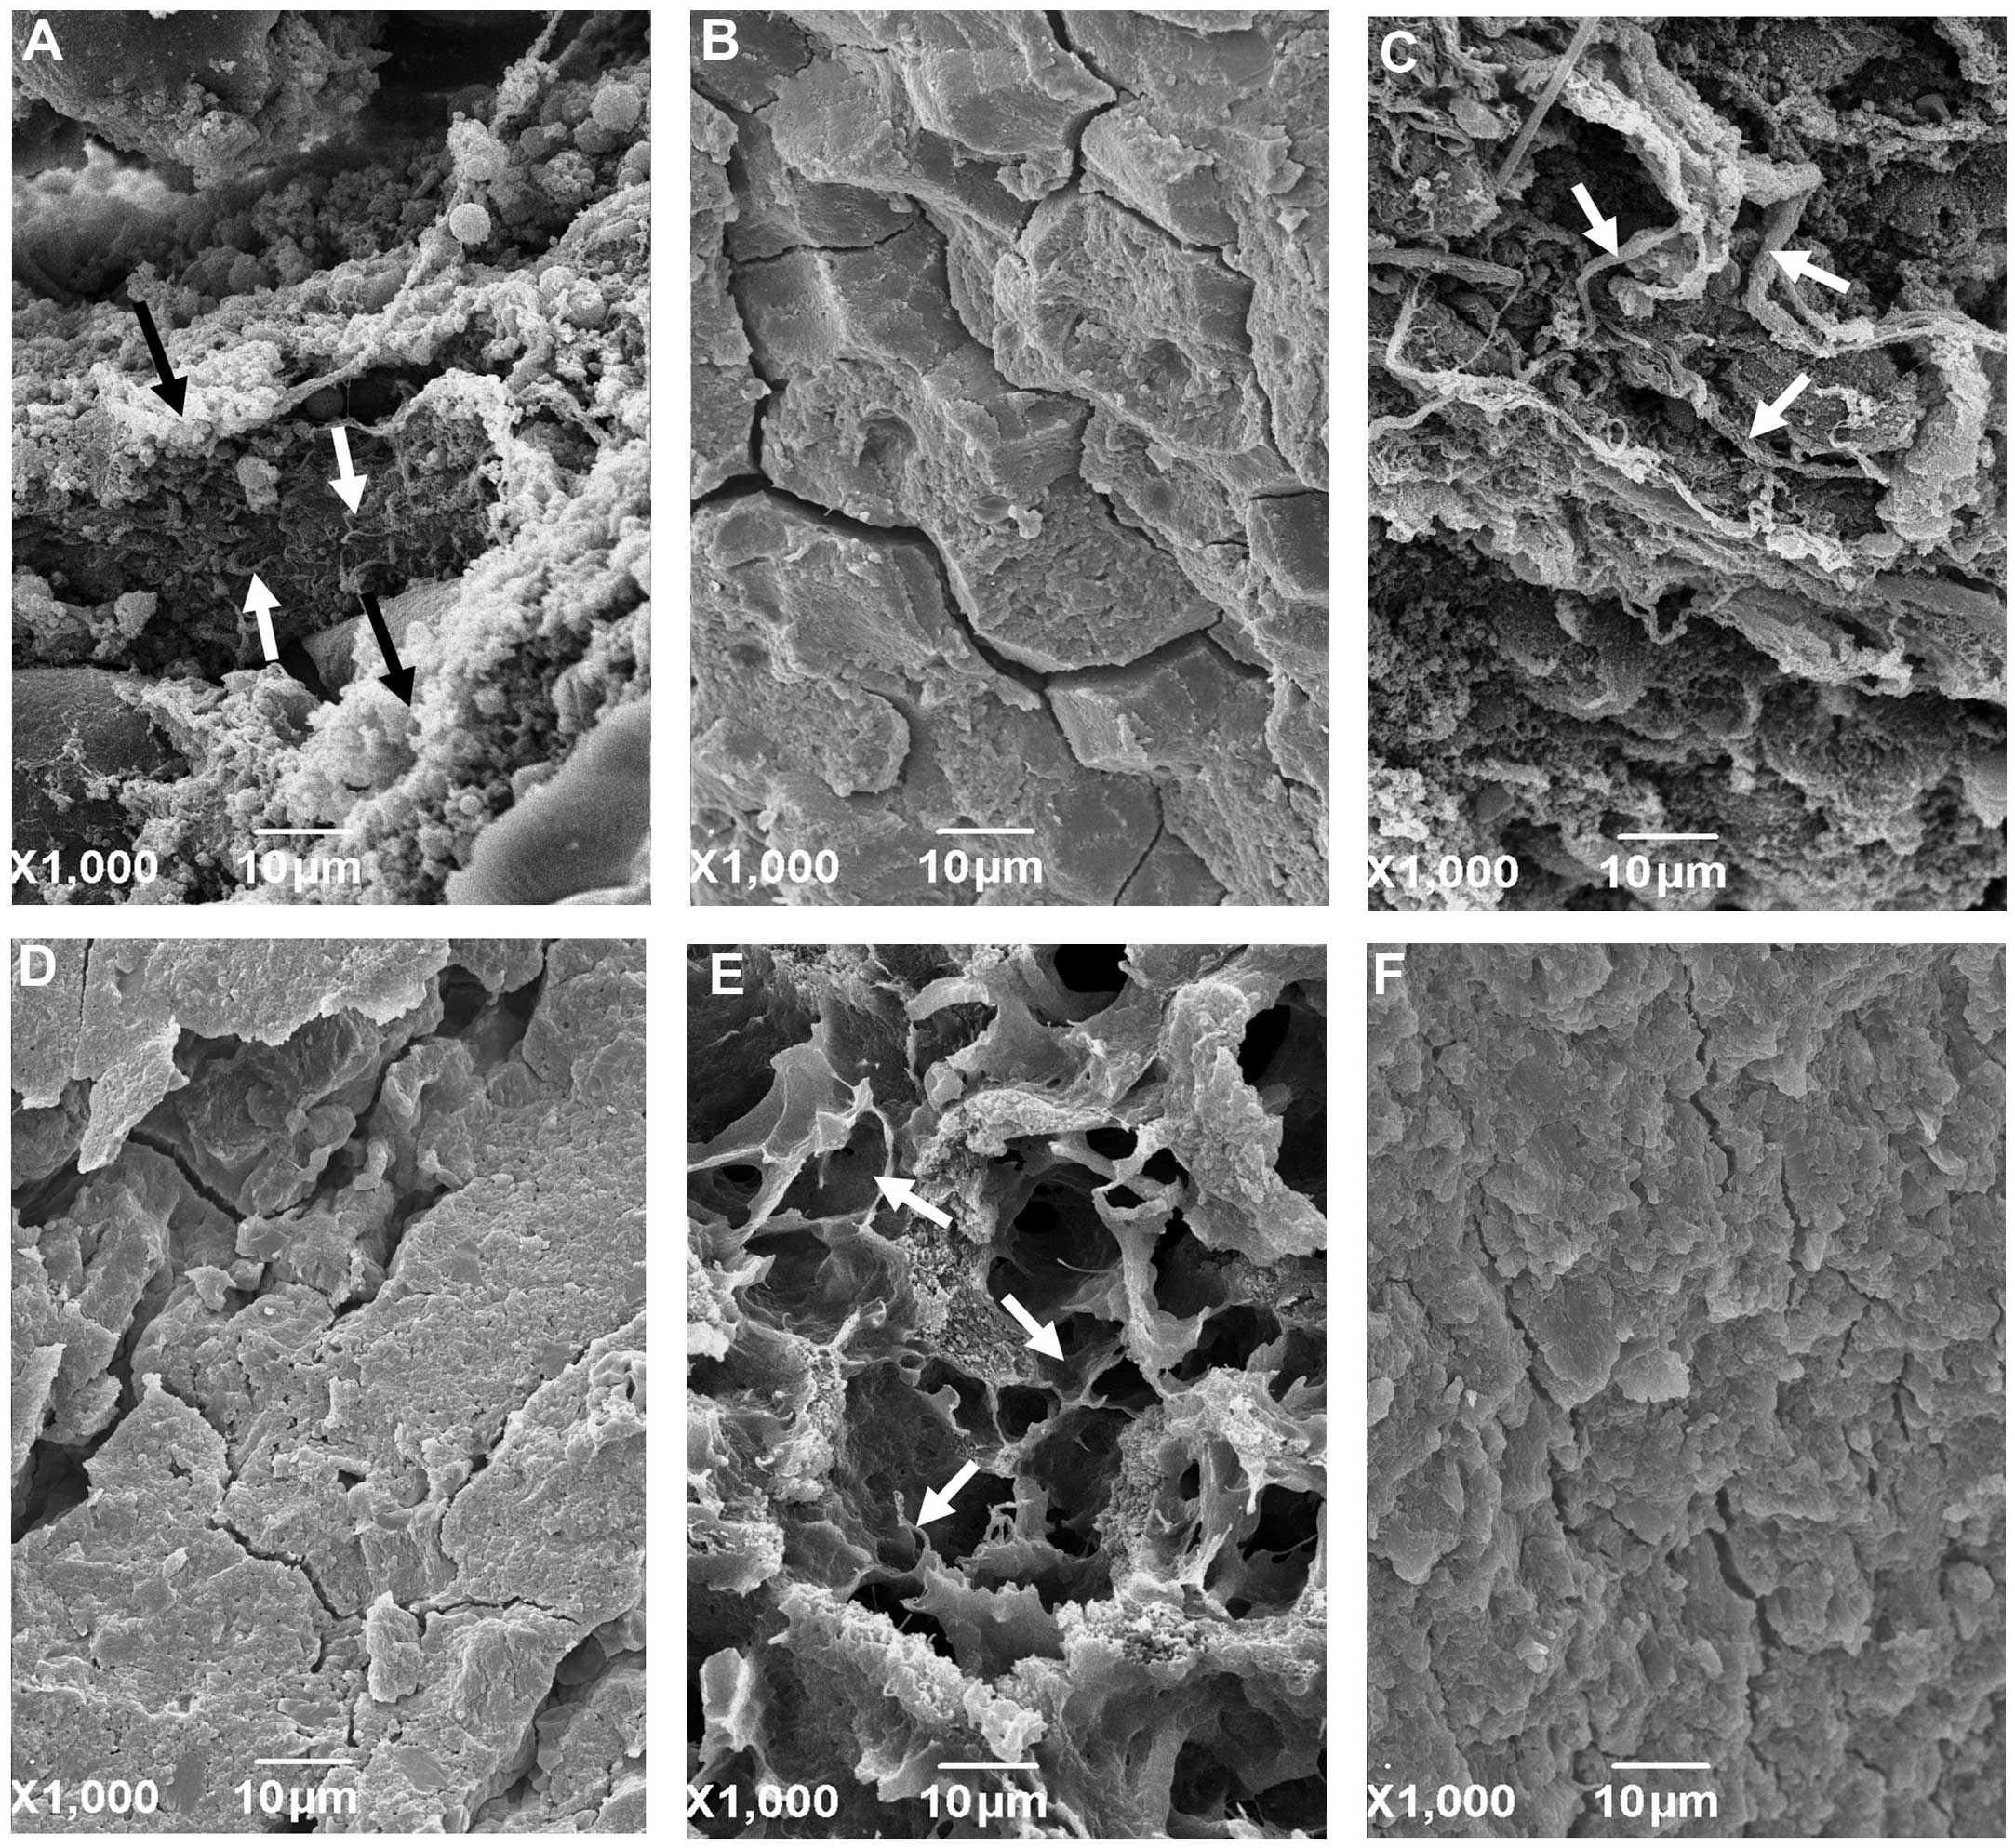
(Fig. 5D). A 3-D architectural
observation was performed with the Carryscope SEM of the fractured
surfaces of the CCl4 plus ethanol-treated (GII) liver
tissue. The images showed morphologically two types of collagen
fiber strands: Thick and dark, and thin yet puffy (Fig. 6A). However, in the CCl4
plus ethanol plus GTE-treated group (GIII) the image was completely
devoid of fibers (Fig. 6B). In the
CCl4-treated group (GVI) collagen fibers type were
present due to CCl4 (Fig.
6C, white arrows). In the CCl4 plus GTE-treated
group (GVII) the collagen fibers disappeared (Fig. 6D). In the ethanol-treated group
(GIV) collagen fibers type formed due to the ethanol that was
present (Fig. 6E). In the ethanol
plus GTE-treated group (GV) no collagen fibers type formed
(Fig. 6F).
Discussion
Hepatic fibrosis is a global challenge. In our
previous study, it was observed that GTE attenuated the hepatic
fibrosis mediated by CCl4 in rats (12). In the present study, liver fibrosis
was induced in a group of rats with a dual exposure to
CCl4 plus ethanol. Administration of alcohol with
repetitive CCl4 ingestion enhances the toxicity of
CCl4 in rats (16).
Other groups of rats were also treated with CCl4 alone
and ethanol alone as described in Materials and methods. After 25
days, immediately prior to dissection, the animals appeared fragile
and thin with pale yellow hairs, particularly those with the dual
exposure. This was in contrast to the control animals and those
that subsequently received GTE treatment. During autopsy, the
CCl4 plus ethanol-treated liver showed a typical
fibrotic orange color instead of the normal reddish-brown color.
Fat deposition and color intensity were increased compared with
those in the animals that were treated with CCl4 or
ethanol alone. The weights of the animals steeply declined with the
onset of the CCl4 treatments, and gradually increased
with GTE administration between the first and third weeks. Towards
the end of the assigned experiment on week four, almost all the
GTE-treated animals returned to the normal body weight, similar to
that of the control group (P<0.05). By contrast, the weights of
the animals increased with the onset of ethanol and gradually
decreased with GTE to become in line with those of the control
group (P<0.05). The CCl4 group treated with GTE
showed normal growth (r=0.5, P=0.009). In the group treated with
ethanol, the weight of the rats increased rapidly within the period
of the study (r=0.41, P=0.01) and an increase in weight was also
observed in the ethanol plus GTE group (r=0.18, P=0.27). Rats
treated with ethanol plus CCl4 showed a reduction in
weight with time as the result of the effect of the
CCl4, but this effect was slightly reversed by the
ethanol and therefore gave a non-significant reduction in weight
(r=−0.20, P=0.25). The effect of GTE on the ethanol plus
CCl4 group showed a shift in weight toward the normal
weight (r=−0.02, P=0.92).
Histological observations of liver tissues using
H&E and toluidine blue staining of sections all coincided with
the external status of the animals and the aforementioned autopsy
features. Histopathological changes were clear in the H&E and
toluidine blue liver sections including the destruction of lobular
architecture, inflammation, large foamy vacuolated cytoplasm,
necrosis, large fatty cells, steatosis, nuclear shrinkage, abnormal
tri- and tetra-polar divisions, nuclear karyorrhesis, nuclear
karyolysis, nuclear hyperchromatism, dead cells, thickening of the
portal vein and triad, hypertension of arterioles, nuclear
hyperchromatism, nuclear fragmentation, condensed eosinophilic
protein, hyperactive Kupffer cells and proliferation of HSCs
(11). However, the majority of
these pathological features were markedly reduced following GTE
administration. Notably, the cytoplasmic vacuolation and large
fatty cells disappeared, a finding that was not only observed in
the gross morphology but also in the H&E- and toluidine
blue-stained sections. It has been shown in studies using mice that
dietary GTE and regular exercise, if combined, stimulate fat
catabolism not only in the liver but also in skeletal muscle, and
attenuate high-fat diet-induced obesity more effectively than each
alone (10), as well as altering
plasma lipids, glucose and liver lipids (17). The Masson’s trichrome-stained liver
tissues clearly showed the intermingled fibrous materials in the
CCl4 plus ethanol-treated liver as blue-green fibrous
structures among the cells and surrounding the blood vessels. These
fibers were not present in the GTE-treated groups, which appeared
similar to the control group. The surface topography of the
fractured surface of the liver blocks when observed under the SEM
also showed how the types of fibers of varied thickness and
direction intermingled in the liver parenchyma around the
hepatocytes (13).
A number of studies have shown that during hepatic
fibrosis, proteins including collagen types I and III proliferate
(9). Administration of GTE either
simultaneously or following CCl4, ethanol or
CCl4 plus ethanol administration prevented hepatic
fibrosis. This may indicate that GTE inhibits the proliferation of
HSCs (4,15). All GTE-treated groups showed a
great effect of GTE in removing almost all the fibers observed in
an area when compared with the CCl4 plus ethanol group.
Notably, two types of fibrous material have been recognized. Thick
fibers (average 312.41 nm) were always shown in the
CCl4-treated liver and thin, fluffy fibers (average
169.71 nm) always appeared in the ethanol-treated liver, in
reference to the normal range of 800–2,400 nm (14), which indicated hepatic injury
(4,15). These alterations were clearly
reduced following treatment with GTE.
The innovation from the present study is that GTE
inhibits the damaging effects caused by the oxidative stress of
CCl4, ethanol, or even combined CCl4 plus
ethanol on the liver cells, and the ECM components are comparable
to those of the liver and kidney cells of previous studies in which
reserpine was used (7,9). Thus GTE significantly reduced
cellular leakage of hepatocyte ALT and AST and apparently improved
cell viability. Severe hepatic lesions induced by the dual action
of CCl4 plus ethanol were markedly improved by the
administration of GTE. GTE also reduces inflammation and
destruction of the liver architecture and the downregulation of the
platelet-derived growth factor-β receptor (6); therefore, it prevents the development
of CCl4 plus ethanol-induced hepatic fibrosis in rats.
This suggests that the polyhydroxy phenols (catechins) of green tea
exhibit strong antioxidant activity against reactive oxygen
species, and have beneficial health effects by repairing the
structure and function of the ECM to a significant degree,
presumably through (-)-epigallocatechin gallate, the active
ingredient in green tea that inhibits the activation of receptor
tyrosine kinases associated with HSCs (11). Green tea may lead to improved
health by reducing oxidative stress; however, this varies according
to toxin and organs (4,9,18–26).
The present study demonstrates that GTE exhibits anti-fibrotic and
anti-oxidative effects in rats in which fibrosis is induced by dual
exposure to CCl4 plus ethanol, and thus may be used as a
therapeutic option and defensive measure in the prevention of
hepatic fibrosis.
References
|
1
|
Bataller R and Brenner DA: Liver fibrosis.
J Clin Invest. 115:209–218. 2005. View
Article : Google Scholar : PubMed/NCBI
|
|
2
|
Lotersztajn S, Julien B, Teixeira-Clerc F,
Grenard P and Mallat A: Hepatic fibrosis: molecular mechanisms and
drug targets. Annu Rev Pharmacol Toxicol. 45:605–628. 2005.
View Article : Google Scholar
|
|
3
|
Bissell DM: Hepatic fibrosis as wound
repair: a progress report. J Gastroenterol. 33:295–302. 1998.
View Article : Google Scholar : PubMed/NCBI
|
|
4
|
Kim HK, Yang TH and Cho HY: Antifibrotic
effects of green tea on in vitro and in vivo models of liver
fibrosis. World J Gastroenterol. 15:5200–5205. 2009. View Article : Google Scholar : PubMed/NCBI
|
|
5
|
Li CH, Piao DM, Xu WX, et al:
Morphological and serum hyaluronic acid, laminin and type IV
collagen changes in dimethylnitrosamine-induced hepatic fibrosis of
rats. World J Gastroenterol. 11:7620–7624. 2005.
|
|
6
|
Paz Z and Shoenfeld Y: Antifibrosis: to
reverse the irreversible. Clin Rev Allergy Immunol. 38:276–286.
2010. View Article : Google Scholar
|
|
7
|
Abdel-Majeed S, Mohammad A, Shaima AB,
Mohammad R and Mousa SA: Inhibition property of green tea extract
in relation to reserpine-induced ribosomal strips of rough
endoplasmic reticulum (rER) of the rat kidney proximal tubule
cells. J Toxicol Sci. 34:637–645. 2009. View Article : Google Scholar : PubMed/NCBI
|
|
8
|
Wang XH, Zhao J, Zhang WG, et al: Scanning
electron microscopic observation: three-dimensional architecture of
the collagen in hepatic fibrosis rats. Chin Med J (Engl).
120:308–312. 2007.
|
|
9
|
Al-Bloushi S, Safer AM, Afzal M and Mousa
SA: Green tea modulates reserpine toxicity in animal models. J
Toxicol Sci. 34:77–87. 2009. View Article : Google Scholar : PubMed/NCBI
|
|
10
|
Shimotoyodome A, Haramizu S, Inaba M,
Murase T and Tokimitsu I: Exercise and green tea extract stimulate
fat oxidation and prevent obesity in mice. Med Sci Sports Exerc.
37:1884–1892. 2005. View Article : Google Scholar : PubMed/NCBI
|
|
11
|
Yasuda Y, Shimizu M, Sakai H, et al:
(-)-Epigallocatechin gallate prevents carbon tetrachloride-induced
rat hepatic fibrosis by inhibiting the expression of the PDGFRbeta
and IGF-1R. Chem Biol Interact. 182:159–164. 2009. View Article : Google Scholar : PubMed/NCBI
|
|
12
|
Safer AM, Afzal M, Nomani A, Sosamma O and
Mousa SA: Curative propensity of green tea extract towards hepatic
fibrosis induced by CCl(4): A histopathological study. Exp Ther
Med. 3:781–786. 2012.PubMed/NCBI
|
|
13
|
Gressner AM: The cell biology of liver
fibrogenesis - an imbalance of proliferation, growth arrest and
apoptosis of myofibroblasts. Cell Tissue Res. 292:447–452. 1998.
View Article : Google Scholar : PubMed/NCBI
|
|
14
|
Mescher AL: Junquera’s Basic Histology:
Text and Atlas. 12th edition. McGraw Hill Medical; New York:
2010
|
|
15
|
Oh SW, Kim DH, Ha JR and Kim DY:
Anti-fibrotic effects of a methylenedioxybenzene compound, CW209292
on dimethylnitrosamine-induced hepatic fibrosis in rats. Biol Pharm
Bull. 32:1364–1370. 2009. View Article : Google Scholar : PubMed/NCBI
|
|
16
|
Sun H, Che QM, Zhao X and Pu XP:
Antifibrotic effects of chronic baicalein administration in a
CCl4 liver fibrosis model in rats. Eur J Pharmacol.
631:53–60. 2010. View Article : Google Scholar : PubMed/NCBI
|
|
17
|
Shirai N and Suzuki H: Effects of Western,
vegetarian, and Japanese dietary fat model diets with or without
green tea extract on the plasma lipids and glucose, and liver
lipids in mice. A long-term feeding experiment. Ann Nutr Metab.
48:95–102. 2004. View Article : Google Scholar : PubMed/NCBI
|
|
18
|
Augustyniak A, Waszkiewicz E and
Skrzydlewska E: Preventive action of green tea from changes in the
liver antioxidant abilities of different aged rats intoxicated with
ethanol. Nutrition. 21:925–932. 2005. View Article : Google Scholar : PubMed/NCBI
|
|
19
|
Chen JH, Tipoe GL, Liong EC, et al: Green
tea polyphenols prevent toxin-induced hepatotoxicity in mice by
down-regulating inducible nitric oxide-derived prooxidants. Am J
Clin Nutr. 80:742–751. 2004.PubMed/NCBI
|
|
20
|
Dobrzyńska I, Sniecińska A, Skrzydlewska E
and Figaszewski Z: Green tea modulation of the biochemical and
electric properties of rat liver cells that were affected by
ethanol and aging. Cell Mol Biol Lett. 9:709–721. 2004.
|
|
21
|
El-Beshbishy HA: Hepatoprotective effect
of green tea (Camellia sinensis) extract against tamoxifen-induced
liver injury in rats. J Biochem Mol Biol. 38:563–570. 2005.
View Article : Google Scholar : PubMed/NCBI
|
|
22
|
Erba D, Riso P, Bordoni A, et al:
Effectiveness of moderate green tea consumption on antioxidative
status and plasma lipid profile in humans. J Nutr Biochem.
16:144–149. 2005. View Article : Google Scholar : PubMed/NCBI
|
|
23
|
Mohamadin AM, El-Beshbishy HA and El-Mahdy
MA: Green tea extract attenuates cyclosporine A-induced oxidative
stress in rats. Pharmacol Res. 51:51–57. 2005. View Article : Google Scholar
|
|
24
|
Sadzuka Y, Inoue C, Hirooka S, et al:
Effects of theanine on alcohol metabolism and hepatic toxicity.
Biol Pharm Bull. 28:1702–1706. 2005. View Article : Google Scholar : PubMed/NCBI
|
|
25
|
Skrzydlewska E, Augustyniak A, Michalak K
and Farbiszewski R: Green tea supplementation in rats of different
ages mitigates ethanol-induced changes in brain antioxidant
abilities. Alcohol. 37:89–98. 2005. View Article : Google Scholar
|
|
26
|
Yamamoto M, Miyamoto S, Moon JH, et al:
Effect of dietary green tea catechin preparation on oxidative
stress parameters in large intestinal mucosa of rats. Biosci
Biotechnol Biochem. 70:286–289. 2006. View Article : Google Scholar : PubMed/NCBI
|