Introduction
The incidence of thyroid cancer has gradually
increased in recent years, and it is currently the most common
endocrine tumor (1). Thyroid
microcarcinoma is defined as a thyroid tumor ≤10 mm in diameter,
and 65–99% of these tumors are papillary thyroid microcarcinomas
(PTMCs) (2). In recent years, the
incidence of papillary thyroid carcinoma has increased
significantly, specifically for PTMC (by 24% in patients aged
>45 years) (3). The diagnosis of
PTMC relies on imaging techniques, since the lesions are difficult
to assess and easily misdiagnosed due to their small size (4). In particular, ultrasound examination is
preferred for small thyroid lesions, and quantitative
contrast-enhanced ultrasound (CEUS) can clearly define the
microvascularity of small carcinoma nodules (5). The diagnosis rate using palpation is
low and the diagnostic specificity of computed tomography/magnetic
resonance imaging (CT/MRI) is poor when PTMC nodules are <10 mm
in diameter (2). Therefore, the aim
of the present study was to investigate the value of CEUS in the
diagnosis of PTMC.
Materials and methods
Patient samples
Between July 2013 and April 2014, 106 patients (14
male, 92 female) with a total of 130 thyroid nodules treated at the
Minhang Central Hospital (Shanghai, China) were included in this
study. All patients underwent CEUS prior to surgery and
pathological diagnosis. The mean age of the patients was 41 years
(age range, 23–66 years), and the mean diameter of the thyroid
nodules was 6.1 mm (range, 1.9–10 mm; 54 nodules measured 2–5 mm
and 76 nodules measured 5–10 mm in diameter). In total, 12 patients
had two nodules and 5 patients had multiple nodules. Following
two-dimensional and color Doppler ultrasound examination, a nodule
diameter of ≥10 mm with calcification, or a longitudinal/transverse
length >1 was characteristic of malignant nodules. All PTMC
nodules were confirmed by surgery and pathological analysis.
Following the surgical procedure the tissue samples were fixed with
10% neutral formaldehyde (Shanghai Xi Hua Trade Co., Ltd.,
Shanghai, China) prior to being embedded with paraffin (Long Tu Was
Industry Co., Ltd., Shanghai, China), sectioned using a
Leica-RM2235 microtome (Leica Microsystems GmbH, Wetzlar, Germany)
and stained with hematoxylin and eosin (Hongqiao Shanghai Lexiang
Medical Reagent Co., Ltd., Shanghai, China). The sections were then
observed and images were captured using a microscope (Olympus-BX51;
Olympus Corporation, Tokyo, Japan). Pathological diagnosis was
conducted based on the presence of the following: Papillary tumor
cell growth, ground-glass opacity nuclei and nuclear grooves.
Imaging
High resolution B-mode and color Doppler ultrasound
imaging of the thyroid gland was performed by an experienced
examiner using a linear ultrasound transducer (5–12 MHz; Aplio XG
SSA 790A; Toshiba Corp., Tokyo, Japan). Three ultrasound nodule
characteristics were associated with a risk of thyroid cancer:
Micro calcifications, size >2 cm and solid composition (6). Following B-mode and Doppler evaluation,
CEUS examination was performed. Instrument parameters were kept
consistent and were as follows: 0.19 mechanical index, 3.5 cm depth
and overall gain between 72 and 80%. Prior to CEUS examination,
patients were administered an intravenous bolus of 2.4 ml SonoVue
(Bracco S.p.A., Milan, Italy) followed by a bolus injection of 5 ml
0.9% NaCl. Digital cine loops were recorded and stored for 3 min
starting immediately after SonoVue administration, which allowed a
retrospective independent evaluation to be conducted by two
physicians with >10 years of experience in ultrasonic diagnosis.
The parameters recorded and reviewed included the arrival time,
enhancement intensity, internal enhancement, edge enhancement and
wash-out time of SonoVue in PTMC nodules.
Arrival time
The perfusion time between the SonoVue injection and
its appearance in the nodules was recorded as the arrival time. The
patients were divided into three groups based on the relative
arrival time: Earlier, same or later arrival time compared with
that surrounding the normal thyroid parenchyma.
Enhancement intensity
The peak enhancement intensity of the PTMC nodules
and the surrounding normal thyroid parenchyma were analyzed and
compared. Peak enhancement intensity refers to the patterns and
features of PTMC at peak time. In total, there were three PTMC
nodule enhancement groups as follows: Hypo-enhancement,
iso-enhancement and hyper-enhancement. In hypo-enhancement the peak
value and the area under the curve of the nodules were lower than
the normal surroundings tissues. In iso-enhancement the peak value
and the area under the curve of the nodules were the same as the
normal surroundings tissues. In hyper-enhancement the peak value
and the area under the curve of the nodules were higher than the
normal surroundings tissues
Internal enhancement
The internal enhancement of PTMC nodules was
determined in relation to the homogeneity of internal enhancement
when peak enhancement was reached. The ultrasound images were
divided into three groups as follows: Homogeneous enhancement (the
nodule exhibited a homogeneous uptake of the contrast medium),
inhomogeneous enhancement (the nodule exhibited inhomogeneous
uptake of the contrast medium) and local non-enhancement (the
nodule did not take up the contrast medium).
Edge enhancement
According to the region intensity and uniformity of
the PTMC nodule edge enhancement, the ultrasound images were
divided into three groups as follows: Edge regular enhancement,
irregular enhancement and non-enhancement. If the nodule and the
surrounding normal tissue enhancement were similar, with no clear
boundaries, no edge enhancement was present.
Wash-out time
The fading time of the SonoVue agent in the PTMC
nodules was compared with the corresponding fading time of the
agent in normal thyroid parenchyma. The ultrasound images obtained
were divided into three groups as follows: Earlier, same and later
wash-out time compared with that in the normal thyroid
parenchyma.
Statistical analysis
Statistical analysis was performed using SPSS
version 13.0 statistical software (SPSS, Inc., Chicago, IL, USA).
Comparisons of diagnostic accuracy were performed using the
χ2 test. P<0.05 was considered to indicate a
statistically significant difference.
Results
Imaging
Conventional B-mode ultrasound displayed
hypoechogenicity in 77 PTMC nodules, 53 of which were
inhomogeneous. A total of 69 nodules were round (5 nodules ranging
between 2 and 5 mm; 64 nodules ranging between 5 and 10 mm), the
aspect ratio (longitudinal diameter/transverse diameter) of 61
nodules was >1.5 (49 nodules between 2 and 5 mm; 12 nodules
ranging between 5 and 1 mm) and 39 nodules showed
microcalcifications (2 nodules ranging between 2 and 5 mm; 37
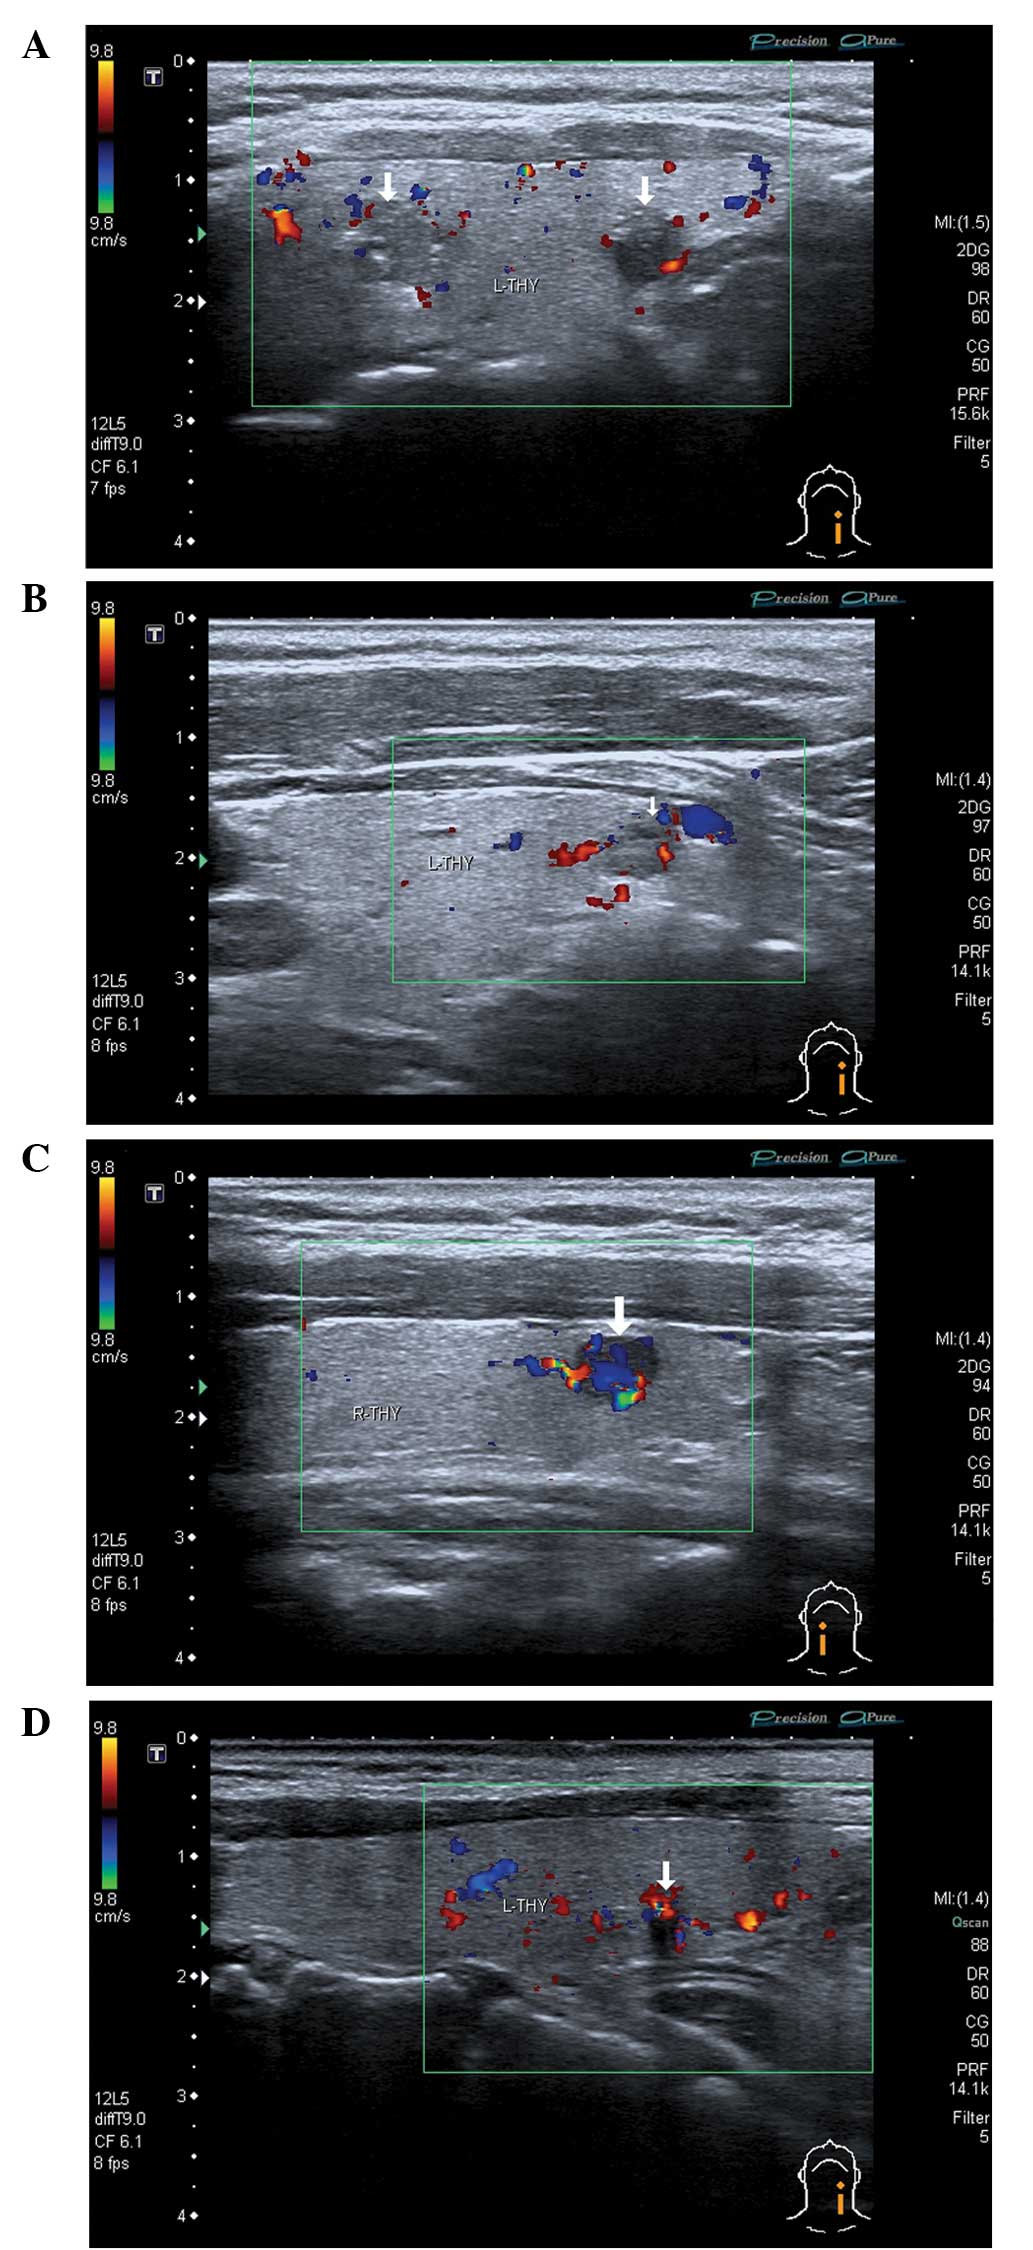
nodules ranging between 5 and 10 mm). Color Doppler demonstrated
that the blood flow was undetectable in 31 nodules (Fig. 1A) and limited in 82 nodules (Fig. 1B), while a rich blood flow signal was
observed in 17 nodules (Fig. 1C). A
narrow strip-like or short-rod type blood flow was observed in 76
PTMC nodules (Fig. 1D). Table I presents the sonographic
characteristics of PTMC.
 | Table I.Sonographic characteristics of
papillary thyroid microcarcinoma. |
Table I.
Sonographic characteristics of
papillary thyroid microcarcinoma.
|
| Nodule diameter |
|
|
|---|
|
|
|
|
|
|---|
| Parameter | 2–5 mm | 5–10 mm |
χ2-test | P-value |
|---|
| Echo |
|
|
|
|
|
Homogeneous hypoechoic | 54 | 23 | 63.578 | 0.001 |
|
Inhomogeneous hypoechoic | 0 | 53 | 63.578 | 0.001 |
| Round or not |
|
|
|
|
| Yes | 5 | 64 | 71.208 | 0.001 |
| No | 49 | 12 | 71.208 | 0.001 |
|
Longitude/transverse |
|
|
|
|
|
>1.5 | 49 | 12 | 71.208 | 0.001 |
|
<1.5 | 5 | 64 | 71.208 | 0.001 |
|
Microcalcifacation |
|
|
|
|
| Yes | 2 | 37 | 30.415 | 0.001 |
| No | 52 | 39 | 30.415 | 0.001 |
Arrival time, time-to-peak and
wash-out time
The arrival time, time-to-peak (time taken for the
contrast agent to reach its highest intensity in the nodules) and
wash-out time of PTMC nodules ranged between 10.1–16.5 sec (mean
time, 13.3±3.2 sec), 16.2–25.4 sec (mean time, 20.8±4.6 sec) and
21.4–32.2 sec (mean time, 26.8±5.4 sec), respectively (Table II). The arrival time, time-to-peak
and wash-out time of normal thyroid tissue ranged between 10.5–16.9
sec (mean time, 13.7±3.2 sec), 17.1–26.3 sec (mean time, 21.7±4.6
sec) and 23.7–34.5 sec (mean time, 29.1±5.4 sec), respectively
(Table II). The difference in the
arrival, time-to-peak and wash-out times between PTMC nodules and
normal thyroid tissues was statistically significant (P=0.0001).
Therefore, arrival time, time to peak and wash-out time in the PTMC
nodules were earlier compared with the surrounding normal
tissues.
| Table II.Contrast-enhanced ultrasonic arrival
time, time-to-peak and wash-out time of papillary thyroid
microcarcinoma. |
Table II.
Contrast-enhanced ultrasonic arrival
time, time-to-peak and wash-out time of papillary thyroid
microcarcinoma.
| Parameters | Papillary thyroid
carcinoma | Normal thyroid
tissue | t-value | P-value |
|---|
| Arrival time | 13.3±3.2 | 13.7±3.2 | 5.6928 | 0.0001 |
| Time-to-peak | 20.8±4.6 | 21.7±4.6 | 10.8288 | 0.0001 |
| Wash-out time | 26.8±5.4 | 29.1±5.4 | 17.8237 | 0.0001 |
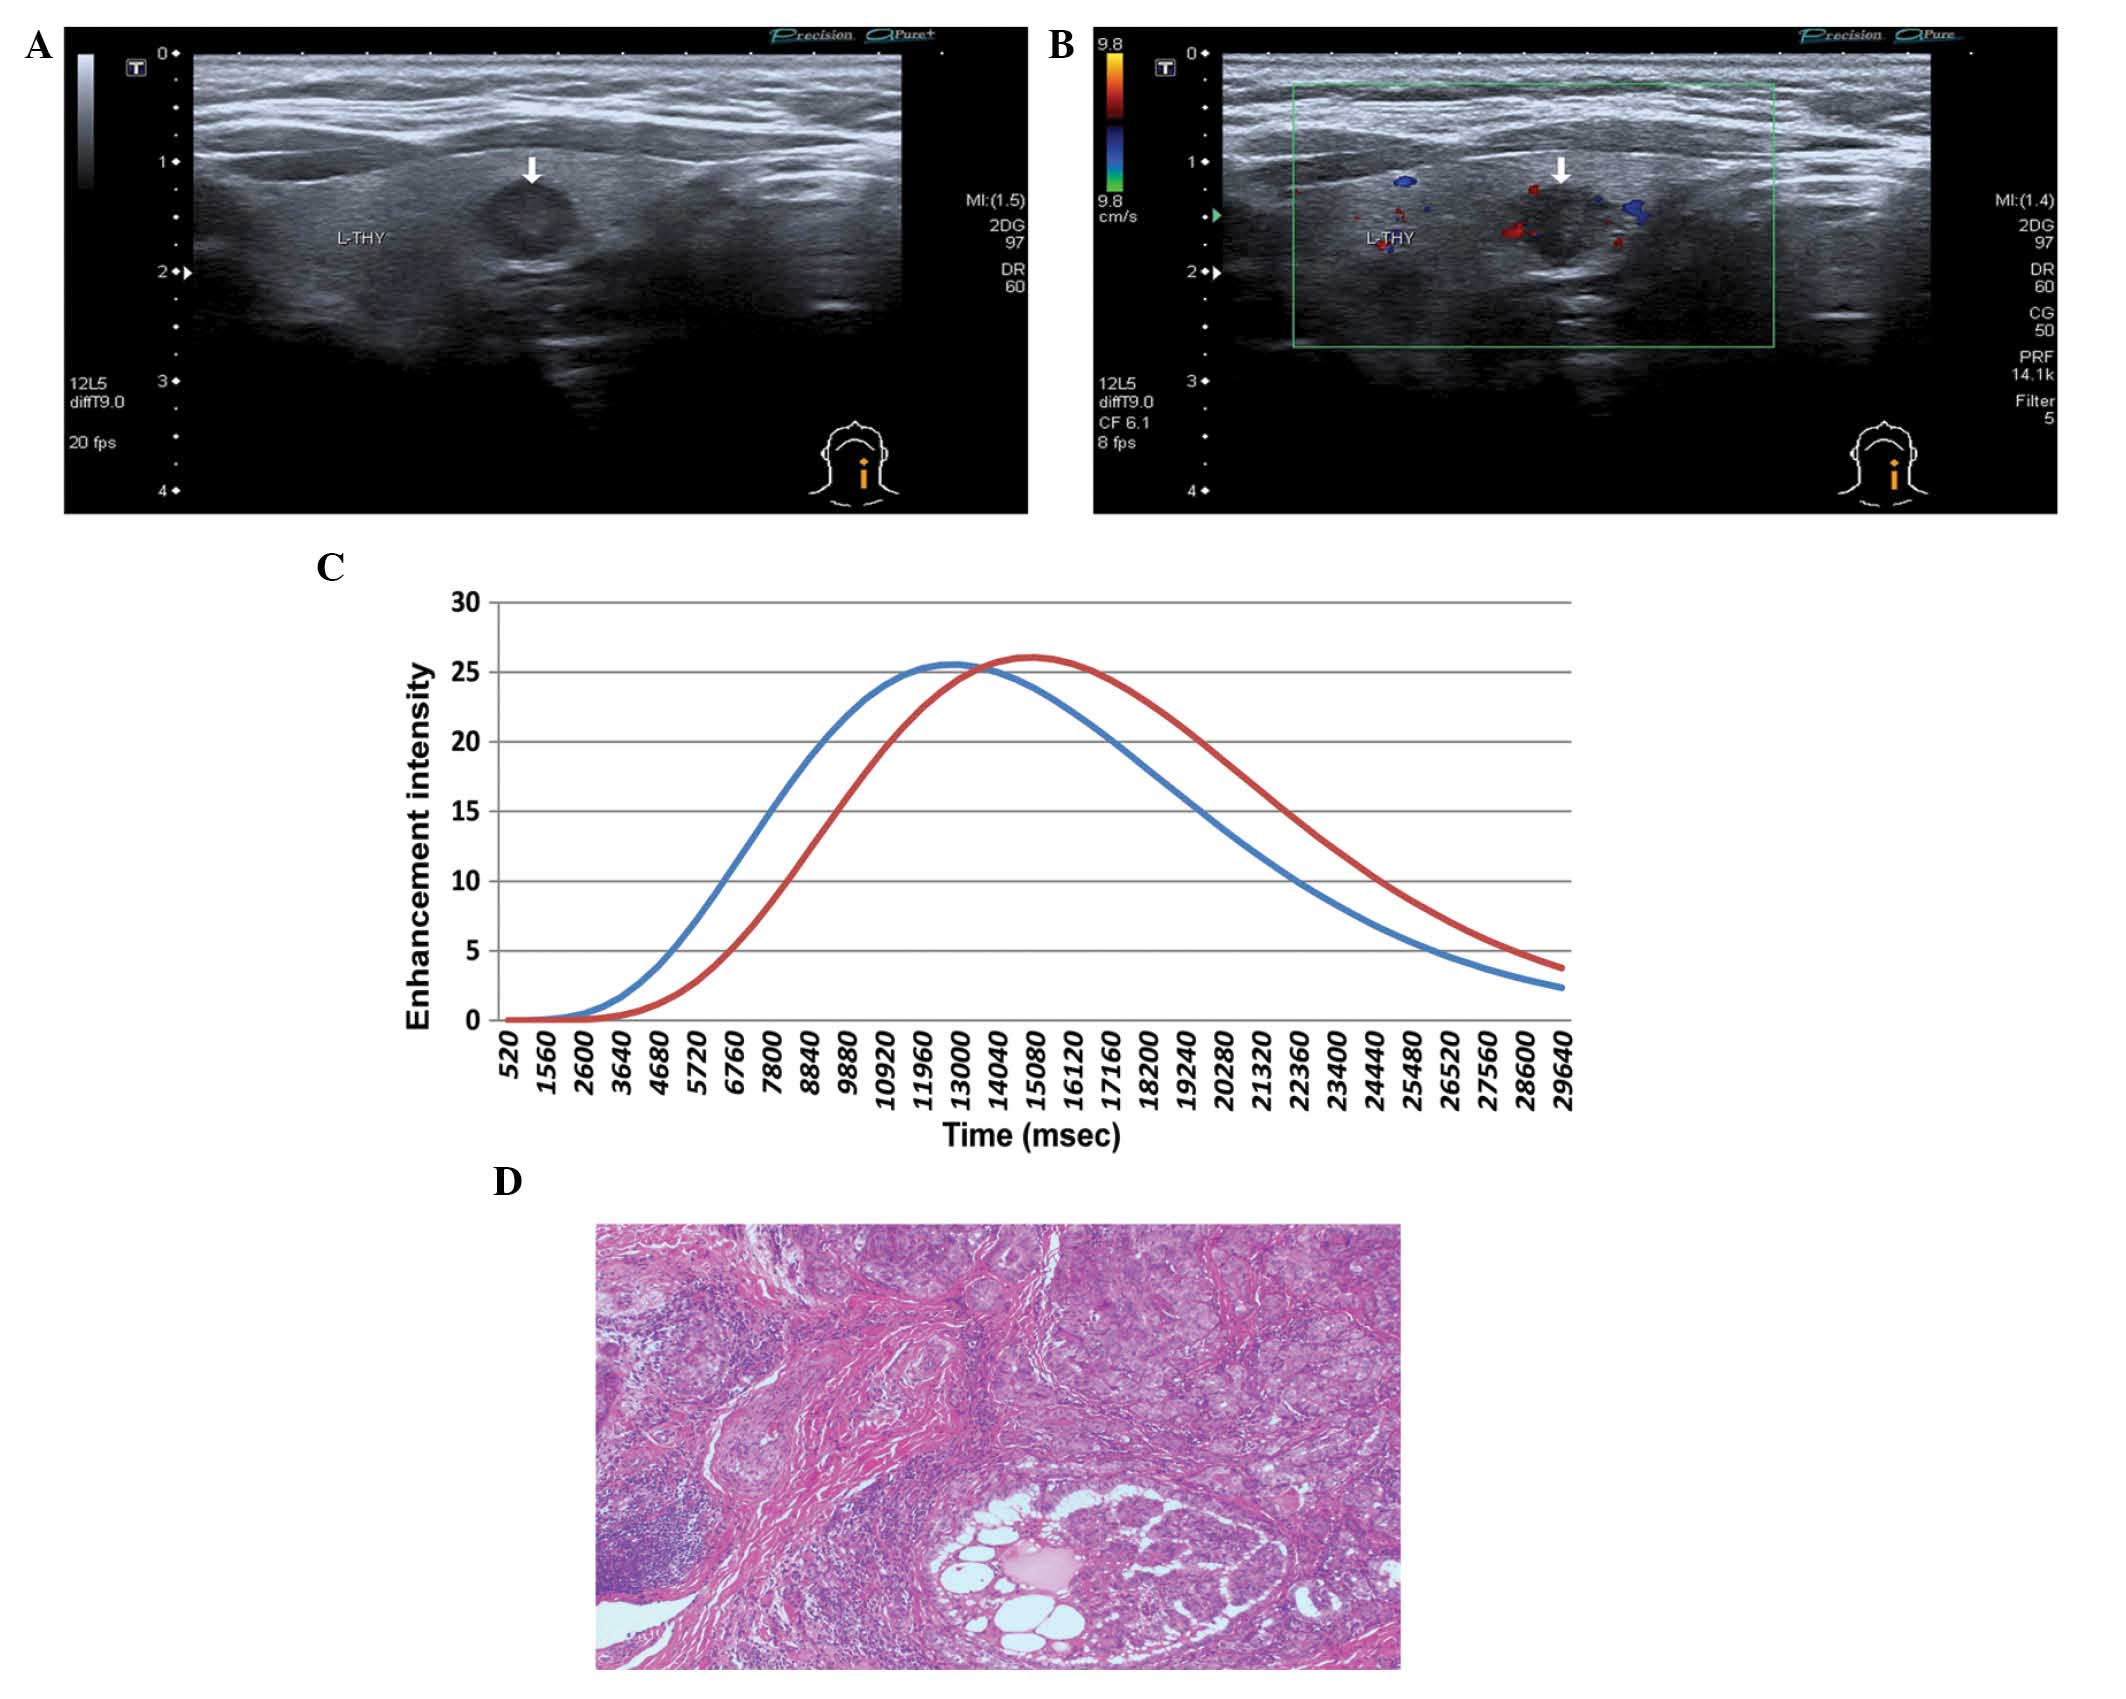
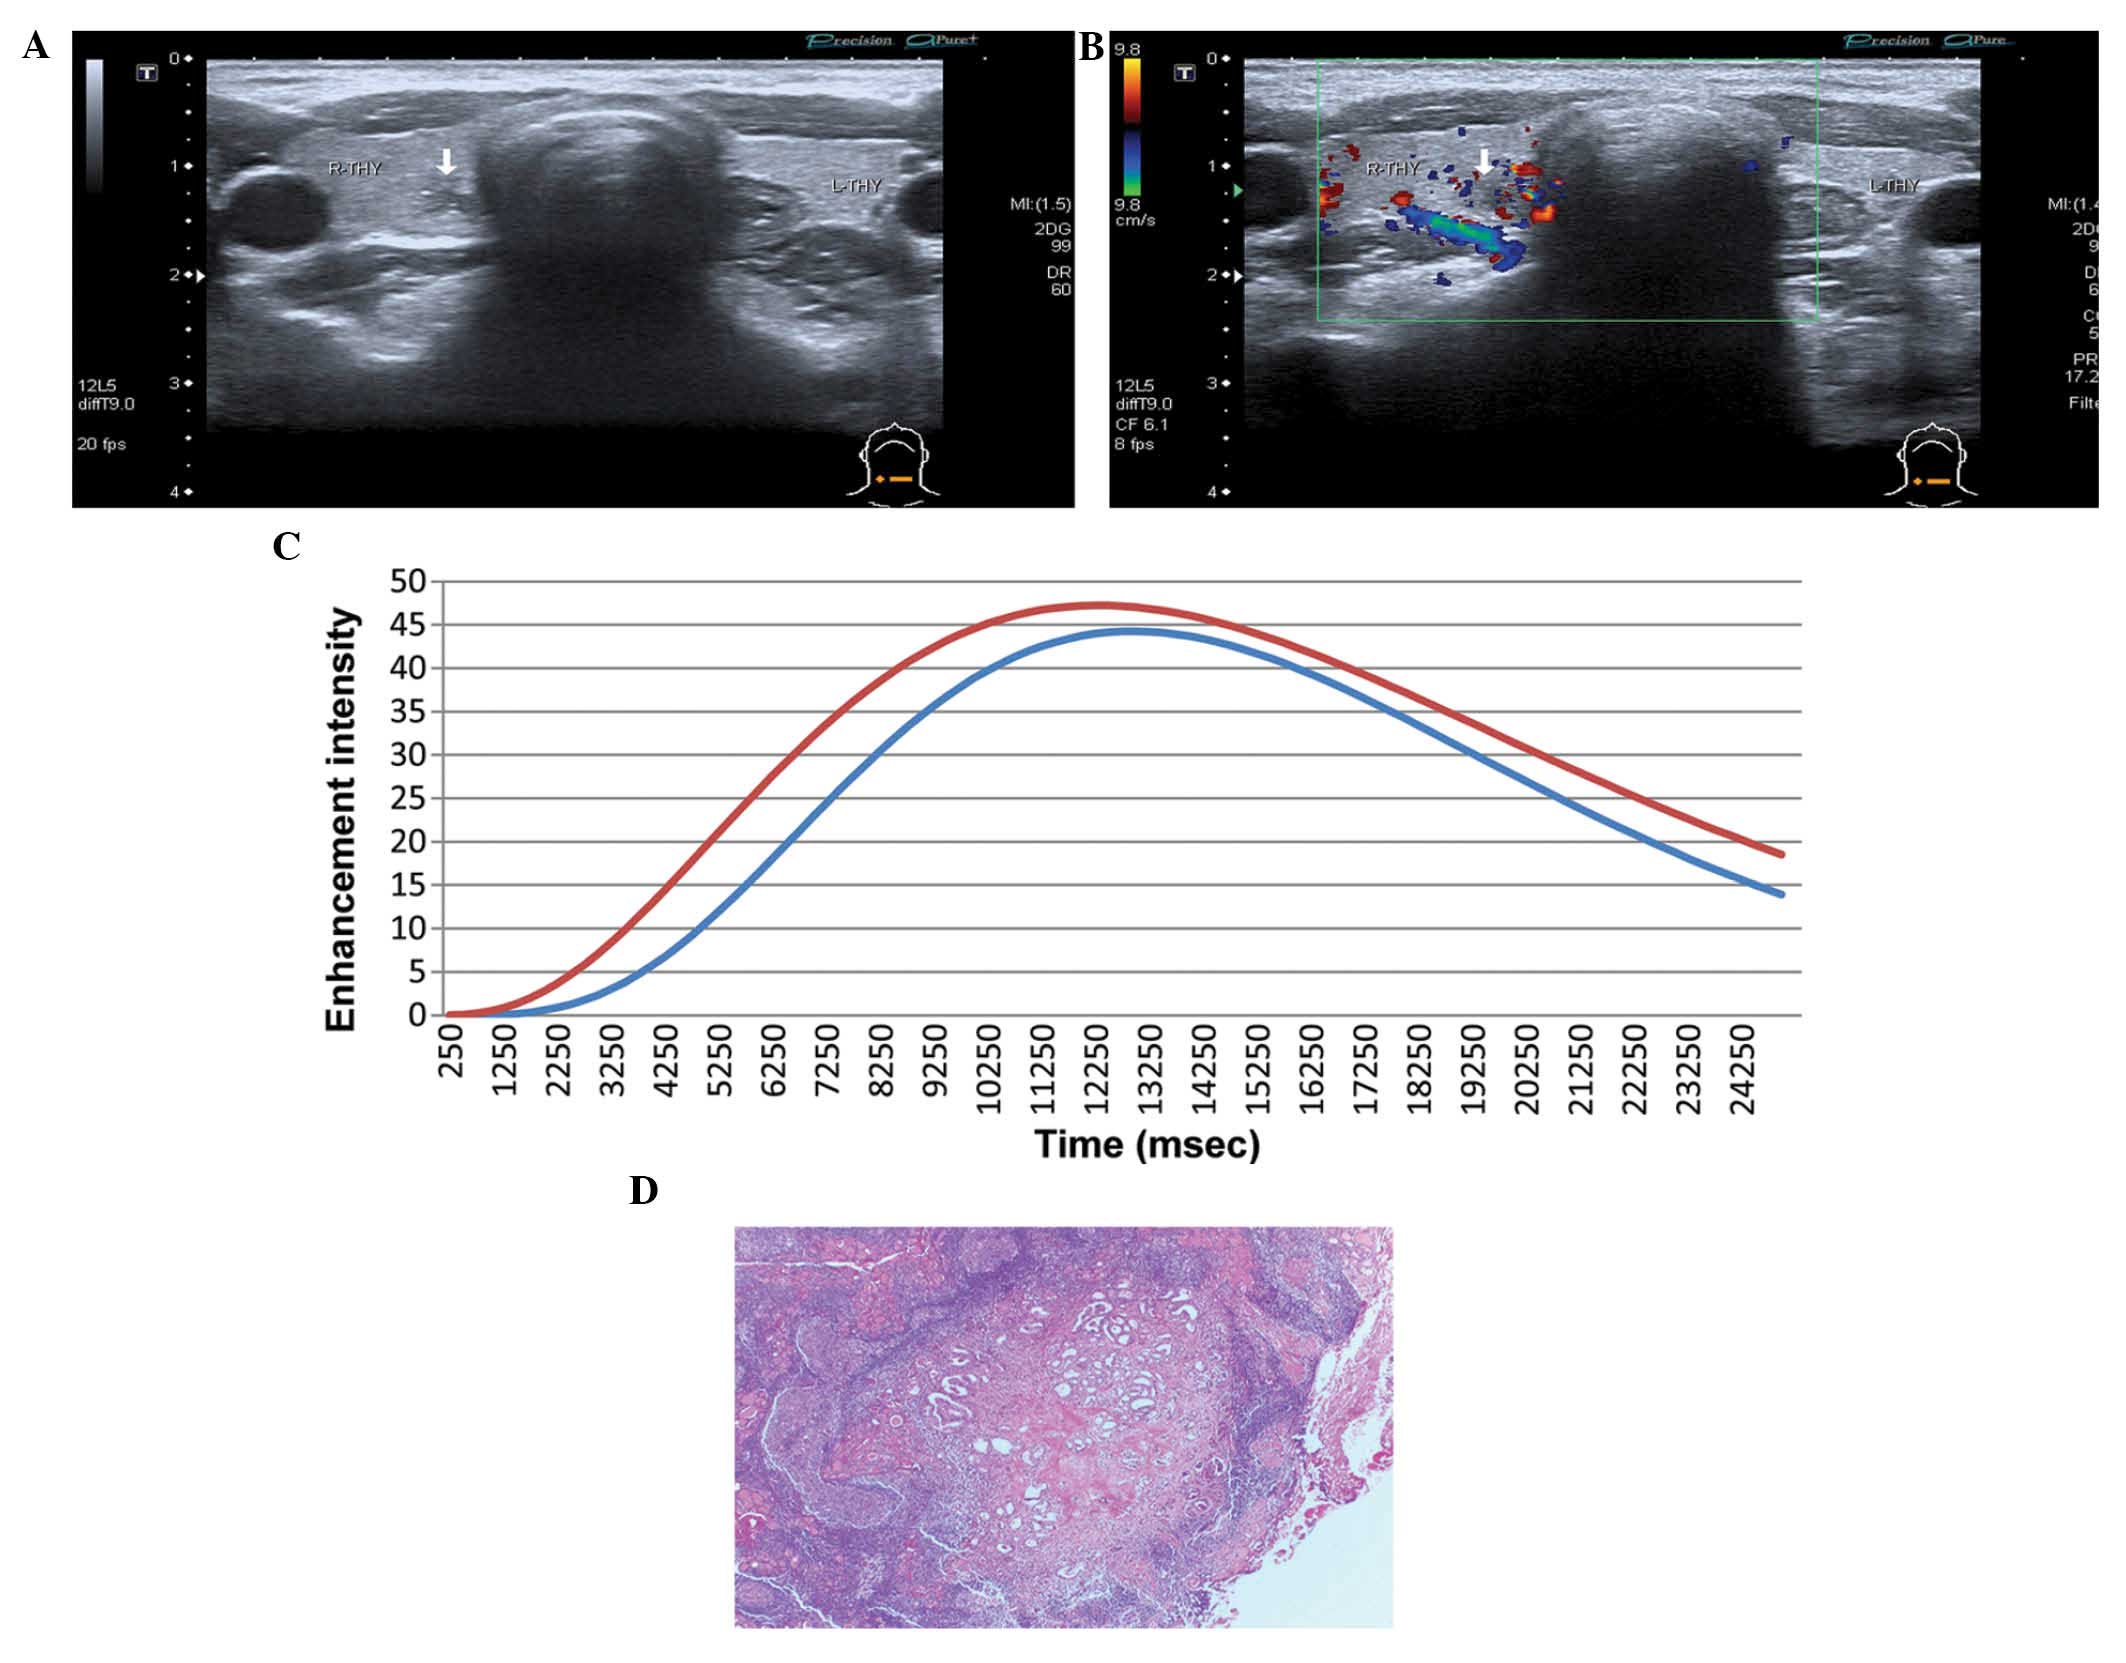
Contrast-enhancement patterns
Based on the enhancement and wash-out times, the
contrast-enhanced patterns of 130 PTMC nodules were divided into
three groups as follows: 32 nodules (24.62%) were enhanced earlier
than normal thyroid tissues (Fig.
2), 95 nodules (73.08%) were enhanced at the same time as
normal thyroid tissues (Fig. 3) and
3 nodules (2.30%) were enhanced later than normal thyroid tissues
(Fig. 4). All PTMC nodules washed
out earlier than normal thyroid tissues.
Imaging features
The imaging features of 130 PTMC nodules from 106
patients were as follows: 125 nodules displayed low internal
enhancement with fuzzy edge enhancement or irregular edge
enhancement, which washed out faster than in normal thyroid
tissues. A further 4 nodules displayed iso-enhancement, and 1
hyper-enhancement. The perfusion pattern mainly displayed dot or
short rod inhomogeneity enhancement. This may be attributed to the
small size of the nodules (diameter, ≤5 mm), which failed to form
the tumor vascular beds and arteriovenous fistulas that are
required to provide sufficient blood supply to PTMCs. The CEUS
enhancement and fading patterns of PTMCs are presented in Table III.
| Table III.Contrast-enhanced ultrasonic
enhancement and fading patterns of papillary thyroid
microcarcinoma. |
Table III.
Contrast-enhanced ultrasonic
enhancement and fading patterns of papillary thyroid
microcarcinoma.
|
| Diameter |
|---|
|
|
|
|---|
| Parameter | 2–5 mm (n=54) | 5–10 mm (n=76) |
|---|
| Enhancement
patterns |
|
|
|
Early | 12 | 20 |
|
Simultaneous | 41 | 54 |
| Late | 1 | 2 |
| Enhancement
intensities |
|
|
|
Hypo-enhancement | 52 | 73 |
|
Iso-enhancement | 2 | 2 |
|
Hyper-enhancement | 0 | 1 |
| Internal
enhancement |
|
|
|
Homogenous | 2 | 0 |
|
Inhomogenous | 52 | 76 |
|
Non-enhanced | 0 | 0 |
| Fading
patterns |
|
|
| Early
wash-out time | 54 | 76 |
|
Synchronized | 0 | 0 |
| Slow
wash-out time | 0 | 0 |
Ultrasound comparisons
Table IV presents
the diagnosing values of B-mode ultrasound, color Doppler and CEUS.
No statistically significant differences were identified between 2D
ultrasound alone or combined with color Doppler in their ability to
differentiate between 2–5 mm (χ2=1.069, P=0.586) and
5–10 mm PTMCs (χ2=5.674, P=0.059). However, CEUS was
more accurate than 2D ultrasound in differentiating between 2–5 mm
(χ2=23.380, P=0.001) and 5–10 mm (χ2=32.734,
P=0.001) PTMCs. Furthermore, there were significant differences
between CEUS and 2D ultrasound used in conjunction with colour
Doppler in differentiating between 2–5 mm (χ2=23.380,
P=0.001) and 5–10 mm (χ2=32.734, P=0.001) PTMCs.
Finally, CEUS, 2D ultrasound and color Doppler showed no
significant difference in their ability to diagnose PTMC. 2D
ultrasound used in conjunction with CEUS exhibited the best
diagnosis effect. Therefore, CEUS was able to elevate the
diagnostic accuracy rate.
| Table IV.Difference among two-dimensional
ultrasound, color Doppler and contrast-enhanced ultrasound for
diagnosing papillary thyroid microcarcinoma. |
Table IV.
Difference among two-dimensional
ultrasound, color Doppler and contrast-enhanced ultrasound for
diagnosing papillary thyroid microcarcinoma.
| Imaging type and
nodule diameter | Malignant | Unclear | Benign |
χ2-test | P-value |
|---|
| Two-dimensional
ultrasound |
|
|
|
|
|
| 2–5
mm | 31 | 13 | 10 | 1.259 | 0.533 |
| 5–10
mm | 45 | 22 | 9 | 1.259 | 0.533 |
| Two-dimensional
ultrasound + color Doppler |
|
|
|
|
|
| 2–5
mm | 36 | 11 | 7 | 5.307 | 0.070 |
| 5–10
mm | 55 | 19 | 2 | 5.307 | 0.070 |
| Contrast-enhanced
ultrasound |
|
|
|
|
|
| 2–5
mm | 52 | 2 | 0 | 0.122 | 0.727 |
| 5–10
mm | 72 | 2 | 0 | 0.122 | 0.727 |
Discussion
In certain patients with PTMC the disease develops
slowly, resulting in longer survival rates (7). PTMC with eosinophilic and high cell
variants tend to have a higher degree of malignancy and can easily
invade tissue outside of the thyroid; for example, the rate of
cervical lymph node metastasis is >80%, resulting in a poor
prognosis (8). In the majority of
cases, there are no symptoms, however certain lymph node and
distant metastases can lead to mortality (7). The early clinical diagnosis of PTMC has
therefore become a topic of interest.
The diagnosis rate using palpation is low and the
diagnostic specificity of computed tomography/magnetic resonance
imaging (CT/MRI) is poor when PTMC nodules are <10 mm in
diameter (9). Despite this, it has
been observed that with an improvement in resolution and examiner's
experience, ultrasound can detect micronodules and improve the
accuracy of the differential diagnosis of benign and malignant
nodules (10). Ultrasound has,
therefore, become the preferred imaging diagnostic method for PTMC
since it is noninvasive, easy to perform and can have an improved
ability in diagnosing PTMC compared with CT/MRI.
Conventional high-frequency ultrasound may be used
to diagnose malignant thyroid lesions according to the
microcalcification in PTMC (sensitivity, 31.5%; specificity, 99.1%)
(11). Compared with larger thyroid
carcinomas, there is an evident reduction of microcalcification in
PTMCs, while color Doppler flow imaging is unable to detect blood
flow in the nodules due to their small size (12). Quantitative CEUS is a new technology
whose application in the diagnosis of abdominal diseases is
developed gradually (13). For
example, the use of CEUS in superficial organs is currently being
explored; however, its ability to identify PTMC nodules has not yet
been widely investigated (14).
Tumor angiogenesis imaging has become increasingly
popular. Power Doppler ultrasound (more sensitive than color
Doppler) can detect blood flow in arterioles and venules (diameter,
~1mm; flow velocity, >10 mm/s); however, it can not detect new
blood vessels at the microvessel level. Quantitative CEUS, however,
overcomes this limitation and can detect microvessel blood flow
velocity at 0.1–10 mm/s and observe microvessel perfusion in
real-time at high frequency ultrasound, entering CEUS into the
speciality of microvessel perfusion imaging (15).
In PTMC, the connective tissue between the
epithelium of new blood vessels is not secure, and as a result
cancerous vascular thyroid walls are thinner than the walls of a
normal thyroid. This results in an incomplete basement membrane and
a number of irregular blood vessels with varied thicknesses. This
may be why the enhancement of PTCM following contrast medium
administration was clearly different from that of normal thyroid
parenchyma (16).
The present study observed that 127 nodules
demonstrated early or simultaneous echo enhancement compared with
the normal thyroid parenchyma, 125 presented inhomogeneous
enhancement in dots or strips with an enhanced intensity lower than
that of normal thyroid parenchymas, and 128 were inhomogeneously
enhanced. In 17 nodules with a rich blood supply, the peak
intensity was the same or slightly higher compared with that in the
surrounding normal thyroid parenchyma. In addition, 3 nodules
exhibited the same edge and periphery enhancement as in thyroid
parenchyma, however the center of the nodules showed lower
enhancement, and earlier time-to-peak and wash-out time. The
pathology of these 3 nodules was concluded to be nodular goiter
with papillary thyroid microcarcinoma, as the cancer tissue lay in
the centre not in the periphery of the nodules. One nodule
demonstrated the same enhancement intensity and arrival time as the
surrounding normal thyroid parenchymas; however, this patient was
diagnosed with PTMC and Hashimoto's thyroiditis. All cases
presented in the current study demonstrate that contrast agents
fade earlier in PTMC nodules than in normal thyroid tissue.
Therefore, it is hypothesized that the enhancement characteristics
of PTCM in CEUS include earlier or simultaneous enhancement,
inhomogeneous and low-intensity internal enhancement and earlier
wash-out time in comparison to the surrounding normal thyroid
parenchyma.
The peak enhanced intensity inside the nodules of
certain PTMC were found to be equal to or higher than that of the
peripheral parenchyma. In several PTMC nodules, a lack of blood
supply was observed as only dot-like or sporadic-like enhancement
after SonoVue was administered; however, the evidence of
enhancement and rapid wash-out time during the CEUS process was not
easily apparent. This may be attributed to the small size of the
nodules (diameter, ≤5 mm), which fail to form the tumor vascular
beds and arteriovenous fistulas required to provide sufficient
blood supply to the papillary thyroid carcinoma (17). However, the recording of enhancement
may be influenced by the condition of the apparatus and the
experience of the operator, as evidence of enhancement can be
missed and be recorded as having no change in the nodule
enhancement and wash-out times. Under a repeated and careful
observation and analysis, an earlier wash-out time may be observed
in PTMC nodules in comparison to normal thyroid parenchyma
(18).
Color Doppler and 2D ultrasound may potentially form
the foundation of PTMC diagnosis (19,20).
However, as the majority of PTCM nodules have a reduced blood
supply, CEUS is helpful in detecting and displaying microvessels,
detecting low-speed blood flow and improving the sensitivity of
diagnosis (21,22). Therefore, CEUS may be a novel and
valuable diagnostic tool for the identification and diagnosis of
PTCM.
In conclusion, PTMC enhancement washed out faster
than in normal thyroid parenchyma. The PTMC characteristics of CEUS
may improve the accuracy of diagnosis and provide valuable
information for the treatment of the disease.
Acknowledgements
The present study was financially supported by
grants from the SJTU Medicine Engineering Interdisciplinary
Research Fund (no. YG2013MS53), the Shanghai Municipal Natural
Science Foundation (no. 12ZR1422600), the National Nature Science
Foundation of China (no. 81371574) and the Research Fund for the
Doctoral Program of Higher Education of Chinam (no.
20120073120100).
References
|
1
|
Colonna M, Uhry Z, Guizard AV, Delafosse
P, Schvartz C, Belot A and Grosclaude P: FRANCIM network: Recent
trends in incidence, geographical distribution, and survival of
papillary thyroid cancer in France. Cancer Epidemiol. 39:511–518.
2015. View Article : Google Scholar : PubMed/NCBI
|
|
2
|
Roti E, de Gli Uberti EC, Bondanelli M and
Braverman LE: Thyroid papillary microcarcinoma: A descriptive and
meta-analysis study. Eur J Endocrinol. 159:659–673. 2008.
View Article : Google Scholar : PubMed/NCBI
|
|
3
|
Hughes DT, Haymart MR, Miller BS, Gauger
PG and Doherty GM: The most commonly occurring papillary thyroid
cancer in the United States is now a microcarcinoma in a patient
older than 45 years. Thyroid. 21:231–236. 2011. View Article : Google Scholar : PubMed/NCBI
|
|
4
|
Ito Y, Tomoda C, Uruno T, Takamura Y, Miya
A, Kobayashi K, Matsuzuka F, Kuma K and Miyauchi A: Papillary
microcarcinoma of the thyroid: How should it be treated? World J
Surg. 28:1115–1121. 2004. View Article : Google Scholar : PubMed/NCBI
|
|
5
|
Pelizzo MR, Boschin IM, Toniato A, Piotto
A, Bernante P, Pagetta C, Rampin L and Rubello D: Papillary thyroid
microcarcinoma (PTMC): Prognostic factors, management and outcome
in 403 patients. Eur J Surg Oncol. 32:1144–1148. 2006. View Article : Google Scholar : PubMed/NCBI
|
|
6
|
Smith-Bindman R, Lebda P, Feldstein VA,
Sellami D, Goldstein RB, Brasic N, Jin C and Kornak J: Risk of
thyroid cancer based on thyroid ultrasound imaging
characteristicscs: Results of a population-based study. JAMA Intern
Med. 173:1788–1796. 2013. View Article : Google Scholar : PubMed/NCBI
|
|
7
|
Pelizzo MR, Boschin IM, Toniato A, Pagetta
C, Piotto A, Bernante P, Casara D, Pennelli G and Rubello D:
Natural history, diagnosis, treatment and outcome of papillary
thyroid microcarcinoma (PTMC): A mono-institutional 12-year
experience. Nucl Med Commun. 25:547–552. 2004. View Article : Google Scholar : PubMed/NCBI
|
|
8
|
Pelizzo MR, Boschin IM, Toniato A, Pagetta
C, Piotto A, Bernante P, Casara D, Pennelli G and Rubello D:
Natural history, diagnosis, treatment and outcome of papillary
thyroid microcarcinoma (PTMC): A mono-institutional 12-year
experience. Nucl Med Commun. 25:547–552. 2004. View Article : Google Scholar : PubMed/NCBI
|
|
9
|
Cosgrove D: Microbubble enhancement of
tumour neovascularity. Eur Radiol. 9(Suppl 3): S413–S414. 1999.
View Article : Google Scholar : PubMed/NCBI
|
|
10
|
Mitchell JC and Parangi S: Angiogenesis in
benign and malignant thyroid disease. Thyroid. 15:494–510. 2005.
View Article : Google Scholar : PubMed/NCBI
|
|
11
|
Nemec U, Nemec SF, Novotny C, Weber M,
Czerny C and Krestan CR: Quantitative evaluation of
contrast-enhanced ultrasound after intravenous administration of a
microbubble contrast agent for differentiation of benign and
malignant thyroid nodules: Assessment of diagnostic accuracy. Eur
Radiol. 22:1357–1365. 2012. View Article : Google Scholar : PubMed/NCBI
|
|
12
|
Agha A, Jung EM, Janke M, Hornung M,
Georgieva M, Schlitt HJ, Schreyer AG, Strosczcynski C and Schleder
S: Preoperative diagnosis of thyroid adenomas using high resolution
contrast-enhanced ultrasound (CEUS). Clin Hemorheol Microcirc.
55:403–409. 2013.PubMed/NCBI
|
|
13
|
Seo YL, Yoon DY, Baek S, Ku YJ, Rho YS,
Chung EJ and Koh SH: Detection of neck recurrence in patients with
differentiated thyroid cancer: comparison of ultrasound,
contrast-enhanced CT and (18)F-FDG PET/CT using surgical pathology
as a reference standard: (ultrasound vs. CT vs. (18)F-FDG PET/CT in
recurrent thyroid cancer). Eur Radiol. 22:2246–2254. 2012.
View Article : Google Scholar : PubMed/NCBI
|
|
14
|
Molinari F, Mantovani A, Deandrea M,
Limone P, Garberoglio R and Suri JS: Characterization of single
thyroid nodules by contrast-enhanced 3-D ultrasound. Ultrasound Med
Biol. 36:1616–1625. 2010. View Article : Google Scholar : PubMed/NCBI
|
|
15
|
Deng J, Zhou P, Tian SM, Zhang L, Li JL
and Qian Y: Comparison of diagnostic efficacy of contrast-enhanced
ultrasound, acoustic radiation force impulse imaging, and their
combined use in differentiating focal solid thyroid nodules. PLoS
One. 9:e906742014. View Article : Google Scholar : PubMed/NCBI
|
|
16
|
Acharya UR, Sree Vinitha S, Krishnan MM,
Molinari F, Garberoglio R and Suri JS: Non-invasive automated 3D
thyroid lesion classification in ultrasound: A class of ThyroScan™
systems. Ultrasonics. 52:508–520. 2012. View Article : Google Scholar : PubMed/NCBI
|
|
17
|
Hornung M, Jung EM, Georgieva M, Schlitt
HJ, Stroszczynski C and Agha A: Detection of microvascularization
of thyroid carcinomas using linear high resolution
contrast-enhanced ultrasonography (CEUS). Clin Hemorheol Microcirc.
52:197–203. 2012.PubMed/NCBI
|
|
18
|
Cantisani V, Consorti F, Guerrisi A,
Guerrisi I, Ricci P, Di Segni M, Mancuso E, Scardella L, Milazzo F,
D'Ambrosio F and Antonaci A: Prospective comparative evaluation of
quantitative-elastosonography (Q-elastography) and
contrast-enhanced ultrasound for the evaluation of thyroid nodules:
Preliminary experience. Eur J Radio. 182:1892–1898. 2013.
View Article : Google Scholar
|
|
19
|
Giusti M, Orlandi D, Melle G, Massa B,
Silvestri E, Minuto F and Turtulici G: Is there a real diagnostic
impact of elastosonography and contrast-enhanced ultrasonography in
the management of thyroid nodules? J Zhejiang Univ Sci B.
14:195–206. 2013. View Article : Google Scholar : PubMed/NCBI
|
|
20
|
Agha A, Hornung M, Rennert J, Uller W,
Lighvani H, Schlitt HJ and Jung EM: Contrast-enhanced
ultrasonography for localization of pathologic glands in patients
with primary hyperparathyroidism. Surgery. 151:580–586. 2012.
View Article : Google Scholar : PubMed/NCBI
|
|
21
|
Dietrich CF, Ignee A, Hocke M,
Schreiber-Dietrich D and Greis C: Pitfalls and artefacts using
contrast enhanced ultrasound. Z Gastroenterol. 49:350–356. 2011.
View Article : Google Scholar : PubMed/NCBI
|
|
22
|
Friedrich-Rust M, Sperber A, Holzer K,
Diener J, Grünwald F, Badenhoop K, Weber S, Kriener S, Herrmann E,
Bechstein WO, Zeuzem S and Bojunga J: Real-time elastography and
contrast-enhanced ultrasound for the assessment of thyroid nodules.
Exp Clin Endocrinol Diabetes. 118:602–609. 2010. View Article : Google Scholar : PubMed/NCBI
|