Introduction
Cardiac hypertrophy is associated with the
thickening of the heart muscle (1)
and the risk factors of cardiac hypertrophy include hypertension,
obesity, muscular dystrophy, cardiomyopathy or heart failure
(2). Furthermore, it has been
demonstrated that genetic factors and signaling pathways may
participate in the pathogenesis of cardiac hypertrophy, which may
be associated with an enhanced risk of sudden cardiac death and
cardiovascular mortality (3,4). As the early symptoms of this disease
are difficult to detect, it is crucial that novel molecular markers
for the early therapy of cardiac hypertrophy are identified.
Molecular markers of cardiac hypertrophy have been
identified (5). In particular,
Kontaraki et al (6)
identified GATA4, myocardin and β-myosin heavy
chain as early cardiac marker genes. Furthermore, smooth muscle
α-actin has been demonstrated to be a molecular marker for
pressure-overload hypertrophy (7).
Using mouse models, Qing et al (8) have previously reported that
miR-22 serves a crucial function in the regulation of
cardiac hypertrophy and cardiac remodeling. Fibroblast growth
factor 21, which is an endocrine factor, has a protective role
in cardiac cells (9). As an
increasing number of molecular markers are identified, mathematical
models can be constructed to predict the risk of cancer (10).
Various types of mathematical models have
contributed to the prediction of diseases. Flux balance models of
cellular metabolism have been used to analyze and predict
transcriptional regulation under certain conditions, including
catabolite repression and amino acid biosynthesis pathway
repression (11). Furthermore,
various genes and pathways associated with differentiation,
including MAOA and ADH1B metabolic genes in human pulmonary type II
cells (12) and nuclear
factor-kappaB pathway in a mouse model of genitourinary
inflammation (13), have been
identified via mathematical cluster analysis using GENECLUSTER,
which is a publicly available computer package that contributed to
the establishment of an effective treatment for acute promyelocytic
leukemia (14). According to a
previous study conducted by Kondo and Miura (15), the reaction-diffusion model is
effective in biological pattern formation. Thus, these previous
studies suggest the mathematical modeling is a useful tool for the
prediction of disease.
Using microarray data downloaded from the Gene
Expression Omnibus (GEO) database (accession, GSE21600), which
included 35 heart samples harvested from a Wistar rat on
postoperative days 1, 6 and 42 following aorta ligation and
sham-operated Wistar rats, respectively. Hellman et al
(16) demonstrated a correlation
between hyaluronan concentration and specific gene expression
levels using SPSS software. Analysis of the correlation matrix was
performed according to the Principal components method (17), and orthogonal partial least
squares-discrimination analysis was used to analyze the datasets of
GSE21600, in which the previous clustering, including extracellular
matrix and adhesion molecules were confirmed, and fatty acid
metabolism, glucose metabolism, mitochondria and atherosclerosis
were detected as the new clustering (18). However, these previous two studies
failed to predict the changing trends of genes in this disease.
Hence, the present study aimed to reanalyze the expression profiles
of GSE21600 in order to construct a predictive model of cardiac
hypertrophy using linear discriminant analysis (LDA) method.
GSE21600 microarray data was used to identify differentially
expressed genes (DEGs) using a Limma package in R (version.
3.26.5), which calculates linear models of microarray data. Common
DEGs were used to construct a mathematical model in order to
predict the expression levels of genes in the cardiac hypertrophy
samples. The mathematical model was verified receiver operating
characteristic (ROC) curve and the consistency of predictive and
measurement data. The present study may be useful for the early
prediction of changing trends in cardiac hypertrophy disease at the
gene level.
Materials and methods
Data preprocessing and DEGs
screening
GSE21600 microarray data were downloaded from the
GEO database (http://www.ncbi.nlm.nih.gov/geo/) (16). GSE21600 included data from 35 heart
samples harvested from 36 Wistar rats which were excised on
postoperative days 1, 6 and 42 following aorta ligation and
sham-operated groups, respectively. Each group contained six
samples at each time point, with the exception of the samples
harvested from the aorta ligated group at 6 days, where n=5. The
microarray platform of GSE21600 was Illumina GPL6101 RatRef-12
expression bead chip (version 1.0; Illumina, Inc., San Diego, CA,
USA).
Samples were divided into three groups: Day 1 (D1),
day 6 (D6) and day 42 (D42). DEGs between the postoperative and
sham-operated samples were identified in these three groups,
respectively. Firstly, normalization of the microarray data was
performed in the R language (19,20), and
DEGs were subsequently identified using a Limma package in R
(21). False discovery rate (FDR)
was used to adjust the P-value, according to the method outlined by
Benjamin and Hochberg (22).
FDR<0.05 and >1 log2fold change (FC) were chosen
as the cut-off criteria.
Specific gene screening
In order to screen the specific expression levels of
genes at each time point, DEGs were compared between the two
groups. Subsequently, hierarchical clustering analysis (23) was performed on the common DEGs in the
three groups.
Sorting algorithm and construction of
the mathematical model
Linear discriminant analysis (LDA) is a method that
is commonly widely used in microarray classification to obtain
discrimination function. LDA analysis can be performed when there
are ≥2 groups and each group contains >2 variables (24,25). In
this method, a linear equation based on the variations in the two
groups is established: Y=a + b11 + b22 +…+ bnXn, where ‘a’
represents a constant and ‘b1,b2 … and bn’ represents the
regression coefficient. In the present study, the cardiac
hypertrophy samples were defined as ‘1’ and the control samples
were defined as ‘-1’. Based on the dynamic expression changes of
the common DEGs detected in the D1 group, the expression pattern in
the D42 group was predicted via the calculated mathematical model
constructed using the LDA method (26).
Verification of the mathematical
model
Disease classification models are typically
determined using multivariate regression analysis (27,28), ROC
curve (29–32) or prospective validation (33). ROC curve was used in the present
study in order to evaluate the discriminant effect of the
mathematical model and directly observe the accuracy of the present
analysis method. Indices, including specificity and sensitivity,
were calculated in order to estimate the predictive ability of LDA,
in addition to area under the curve (AUC) of the ROC curve, which
was also calculated to estimate accuracy. In the present study, AUC
was used to distinguish non-accuracy (AUC≤0.5), low accuracy
(0.5<AUC≤0.7), moderate accuracy (0.7<AUC≤0.9) and high
accuracy (0.9<AUC<1). Furthermore, by comparing the
prediction data with the measurement data in the D42 samples, the
consistency of two sets of data was evaluated.
Results
Identification, comparison and feature
selection of DEGs
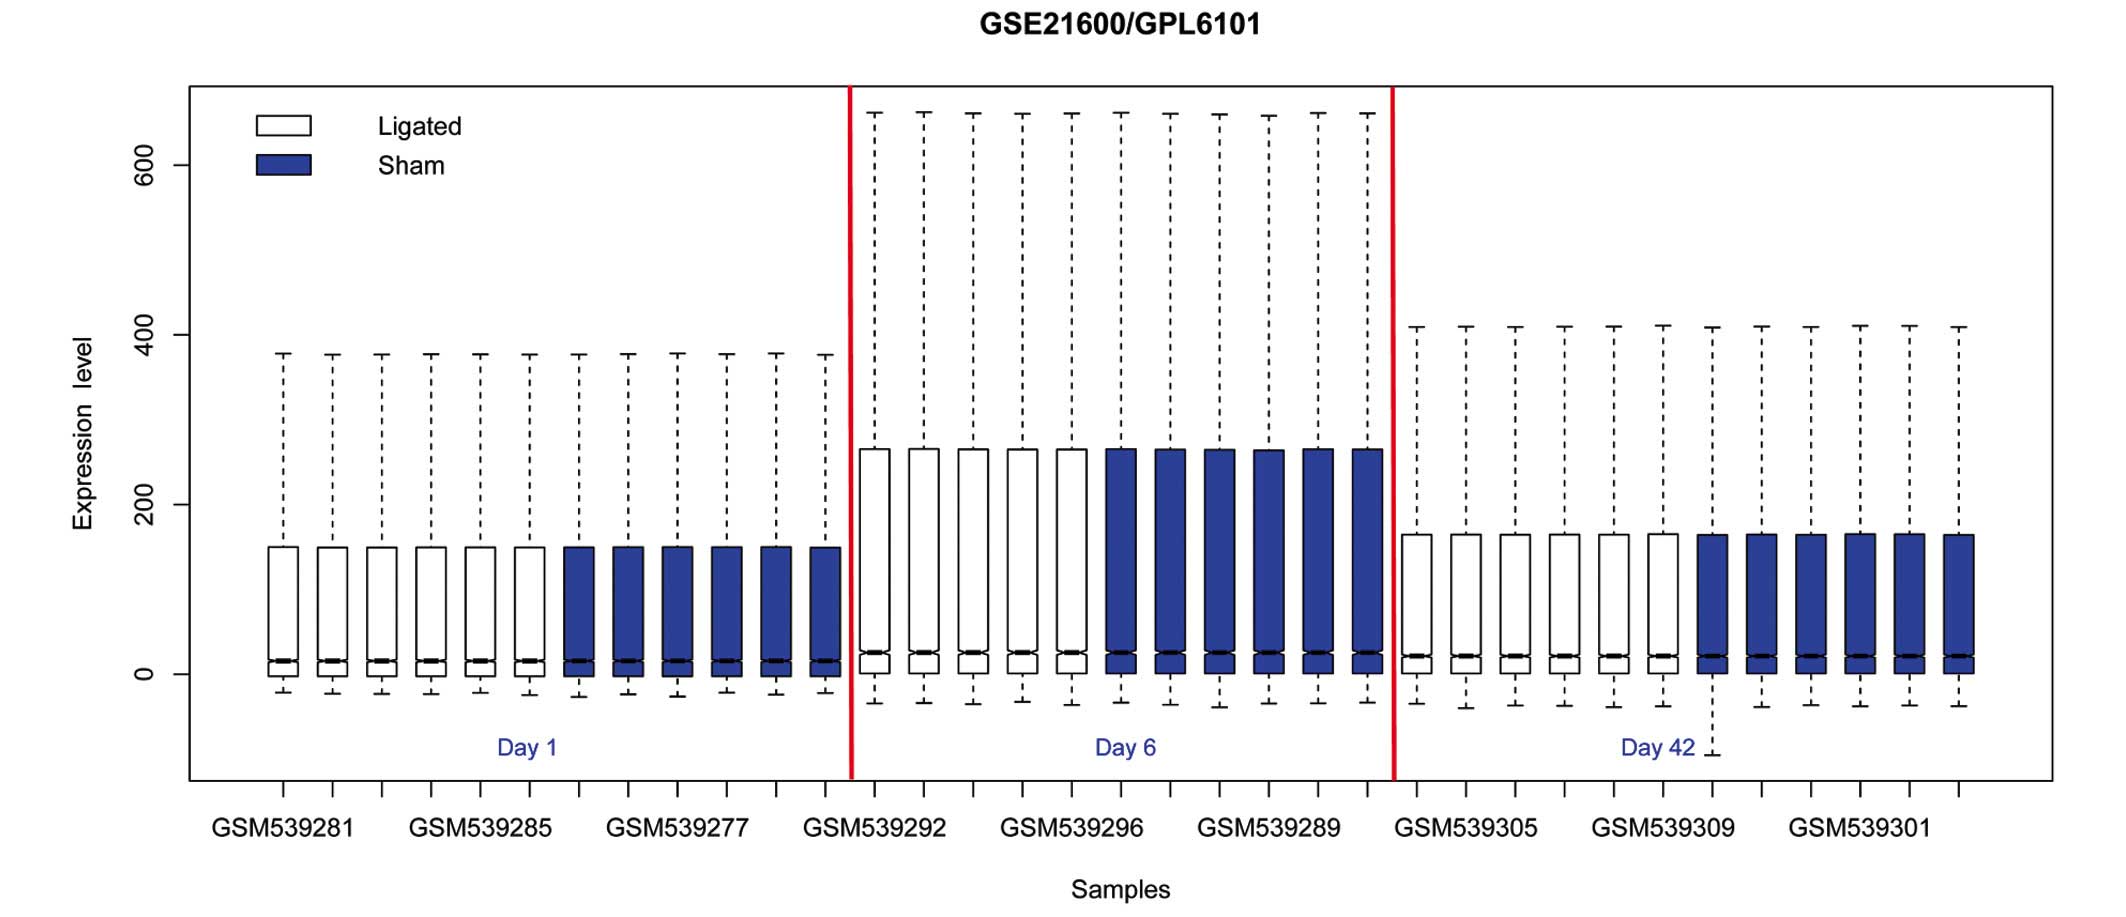
Normalization of the microarray data is presented in
Fig. 1. DEGs were identified, and
the genes with FDR<0.05 and >1 log2FC were considered as
differentially expressed between the ligated samples and
sham-operated samples. A total of 319, 44 and 57 DEGs were
identified in the D1, D6 and D42 groups respectively.
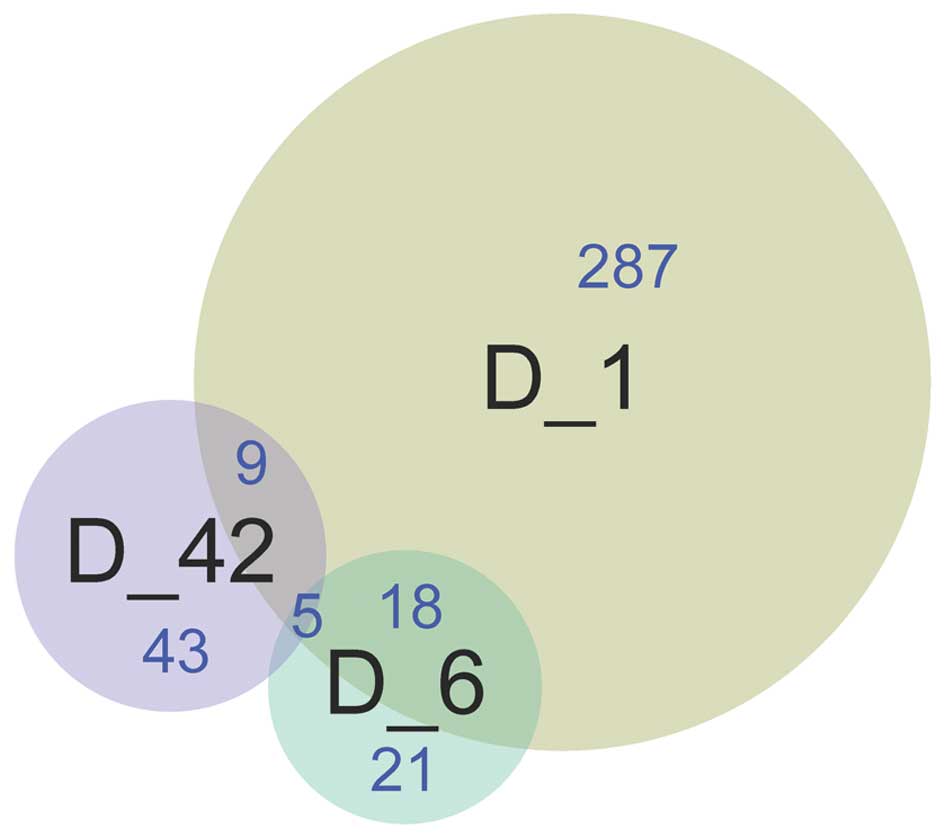
A total of 23 DEGs were detected between the D1 and
D6 groups, 14 DEGs were detected between the D1 and D42 groups, and
five DEGs were identified between the D6 and D42 groups. Five
common DEGs, including A kinase interacting protein 1
(AKIP1), ankyrin repeat domain 23 (ANKRD23), latent
transforming growth factor beta binding protein (LTBP2),
transforming growth factor (TGF)-β2 and tumor necrosis
factor receptor superfamily member 12a (TNFRSF12A), were
identified among the three groups (Fig.
2).
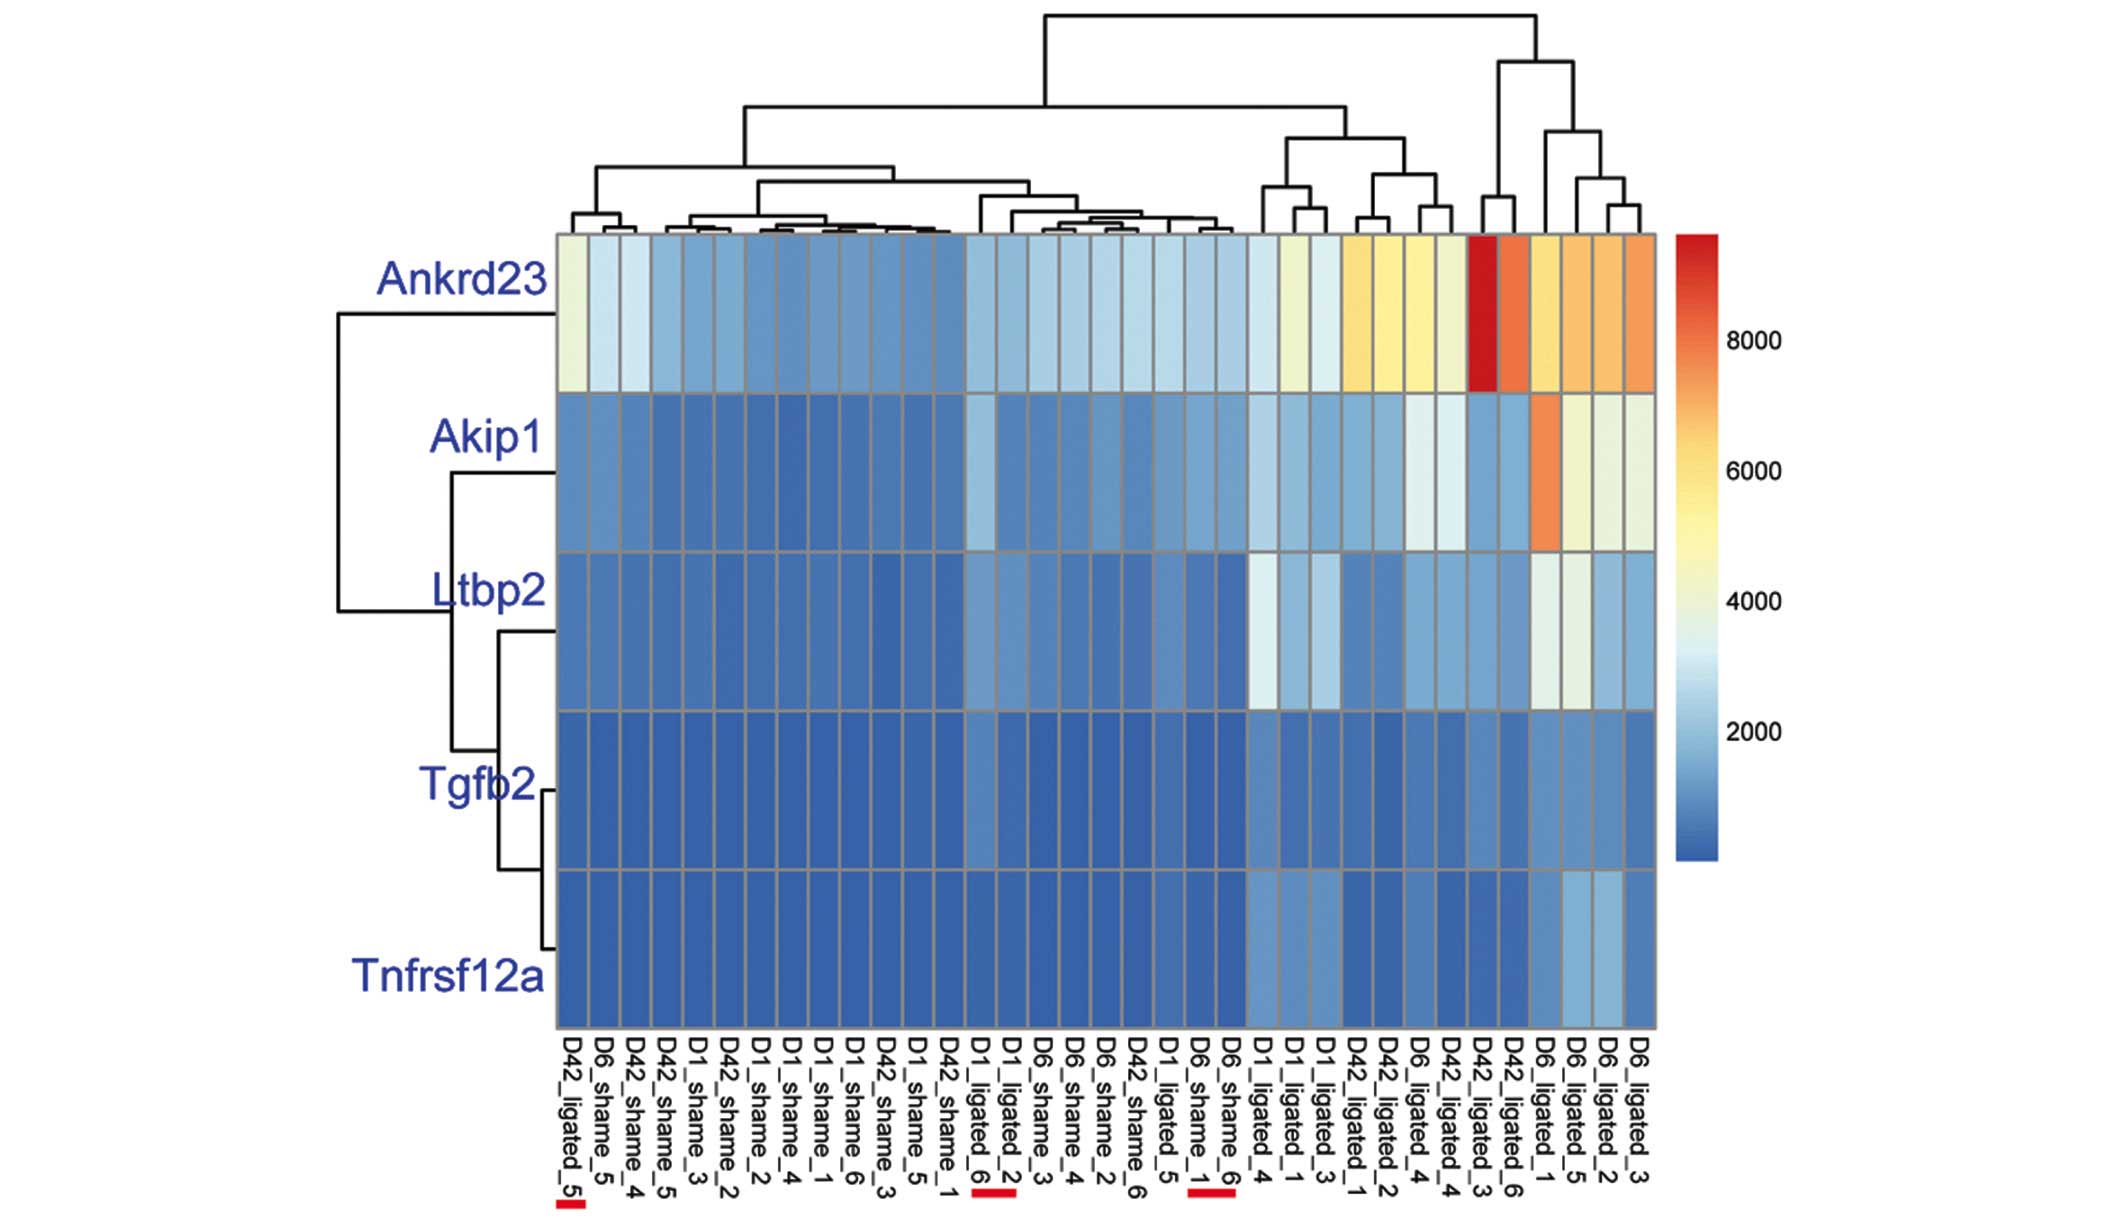
Clustering analysis of the five common DEGs
demonstrated that the sham operated and ligated samples were
respectively clustered together; however, three ligated samples
(16.67%; 3/18) were mixed into the operated group and two
sham-operated samples (11.76%; 2/17) were mixed into the ligated
group (Fig. 3). These five common
DEGs were identified as downregulated genes (Table I).
 | Table I.Expression levels of five common
differentially expressed genes the in aorta ligated operation group
were calculated, as compared with the sham operated group. |
Table I.
Expression levels of five common
differentially expressed genes the in aorta ligated operation group
were calculated, as compared with the sham operated group.
| Gene | Day 1 | Day 6 | Day 42 |
|---|
| AKIP1 | −1.24914 | −1.36699 | −1.80092 |
| ANKRD23 | −2.90253 | −3.69624 | −2.85077 |
| LTBP2 | −3.68846 | −4.20566 | −2.02513 |
| TGFB2 | −2.15313 | −2.11814 | −1.75841 |
|
TNFRSF12A | −1.99987 | −2.08827 | −1.54923 |
Construction and verification of the
mathematical model
Based on the expression levels and dynamic changes
detected in the five common DEGs, a linear equation between the D1
and D42 groups was calculated as follows: y=1.526×-186.671; where
‘y’ and ‘x’ represent the expression levels in the D42 and D1
groups, respectively.
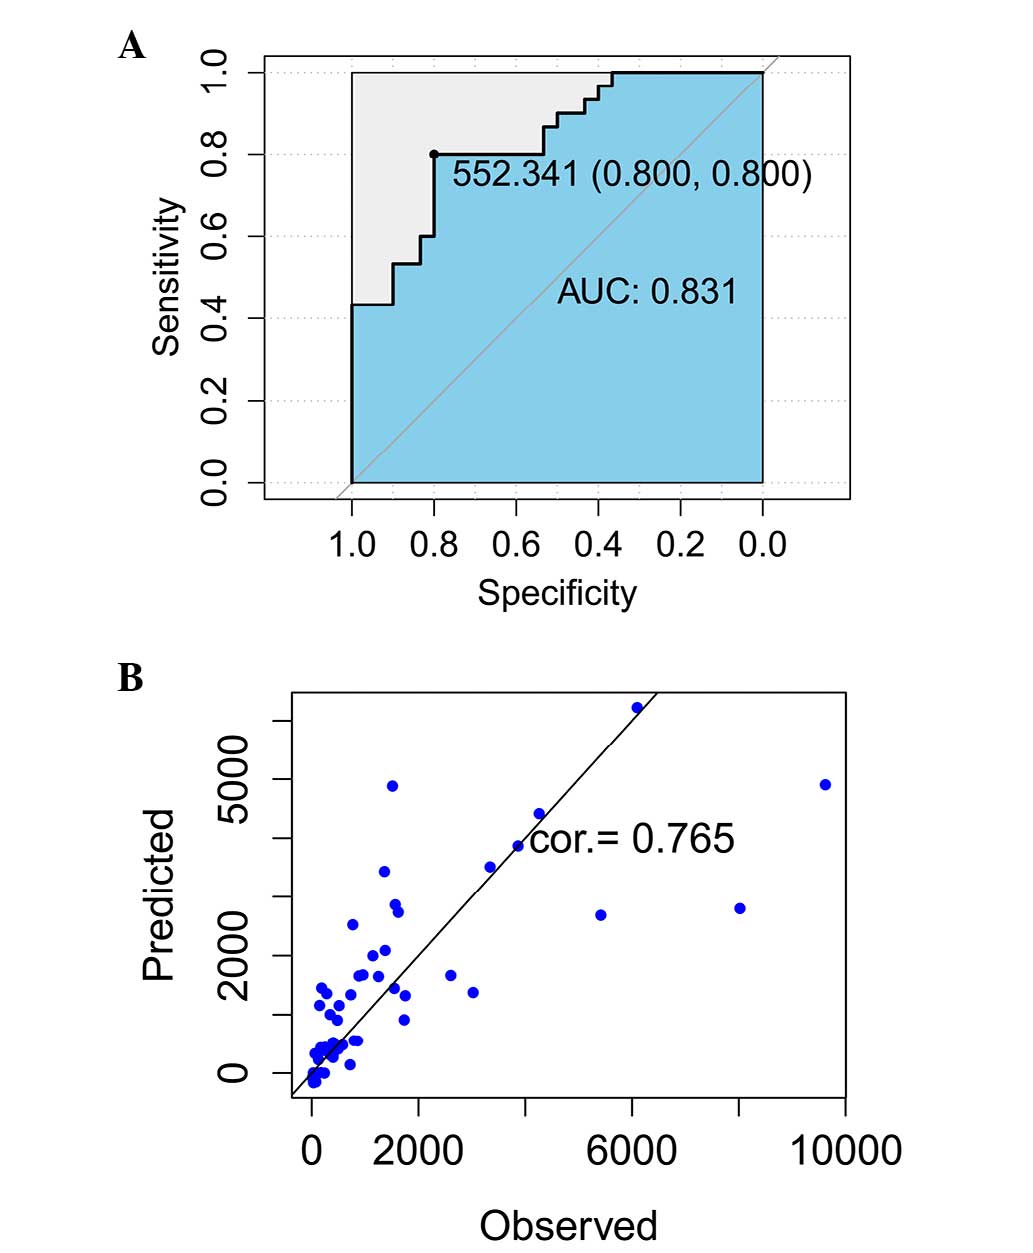
Assessment of the ROC curve demonstrated that AUC
was 0.831, which indicated that the predictive accuracy was 83.1%
and the specificity and sensitivity were 0.8, respectively
(Fig. 4A). By comparing the
predictive and measurement data at 42 days (Table II), the consistency of these two
datasets was calculated to be 76.5% (Fig. 4B).
| Table II.Predicted data at day 42 using a
linear equation of the gene expression levels of cardiac
hypertrophy. |
Table II.
Predicted data at day 42 using a
linear equation of the gene expression levels of cardiac
hypertrophy.
| Gene accession | State | Expression on day
1 | Expression on day
42 | Predicted on day
42 |
|---|
| GSM539275 | 1 | 332.1987 | 337.3279 | 326.1898781 |
| GSM539276 | 1 | 272.2375 | 126.1764 | 235.327208 |
| GSM539277 | 1 | 485.7471 | 792.9784 | 558.8706386 |
| GSM539278 | 1 | 778.9512 | 344.6311 | 1,003.179749 |
| GSM539279 | 1 | 320.8331 | 108.7458 | 308.9669279 |
| GSM539280 | 1 | 716.3563 | 479.7876 | 908.3260809 |
| GSM539281 | −1 | 85.13754 | 66.26252 | −48.1961695 |
| GSM539282 | −1 | 71.55708 | 13.26508 | −68.775425 |
| GSM539283 | −1 | 50.69723 | 41.25237 | −100.385561 |
| GSM539284 | −1 | 23.54682 | 75.99313 | −141.528145 |
| GSM539285 | −1 | 124.7012 | 29.73599 | 11.75692997 |
| GSM539286 | −1 | 49.61586 | 52.55618 | −102.024223 |
| GSM539275 | 1 | 4,201.869 | 6,096.354 | 6,190.124821 |
| GSM539276 | 1 | 1,882.365 | 5,415.158 | 2,675.24642 |
| GSM539277 | 1 | 3,337.275 | 9,621.91 | 4,879.955589 |
| GSM539278 | 1 | 3,016.572 | 4,261.265 | 4,393.975807 |
| GSM539279 | 1 | 2,658.368 | 3,865.638 | 3,851.168593 |
| GSM539280 | 1 | 1,956.894 | 8,021.108 | 2,788.184519 |
| GSM539281 | −1 | 1,219.844 | 959.4762 | 1,671.290077 |
| GSM539282 | −1 | 1,070.036 | 1,546.261 | 1,444.277361 |
| GSM539283 | −1 | 1,431.854 | 1,145.456 | 1,992.561078 |
| GSM539284 | −1 | 1,024.116 | 3,023.837 | 1,374.692133 |
| GSM539285 | −1 | 988.543 | 1,751.745 | 1,320.786311 |
| GSM539286 | −1 | 1,213.691 | 2,605.091 | 1,661.966081 |
| GSM539275 | 1 | 880.5447 | 147.3087 | 1,157.130248 |
| GSM539276 | 1 | 126.5936 | 169.5375 | 14.62459301 |
| GSM539277 | 1 | 1,011.612 | 281.1071 | 1,355.744099 |
| GSM539278 | 1 | 1,073.774 | 185.5347 | 1,449.941769 |
| GSM539279 | 1 | 340.023 | 62.10585 | 338.0464919 |
| GSM539280 | 1 | 122.0065 | 237.4351 | 7.673495398 |
| GSM539281 | −1 | 36.33411 | 32.24878 | −122.150826 |
| GSM539282 | −1 | 50.67635 | 24.24548 | −100.417201 |
| GSM539283 | −1 | 36.68185 | 45.16885 | −121.623876 |
| GSM539284 | −1 | 30.85578 | 71.55927 | −130.452456 |
| GSM539285 | −1 | 15.40947 | 32.20256 | −153.859142 |
| GSM539286 | −1 | 34.06184 | 51.90232 | −125.594128 |
| GSM539275 | 1 | 1,915.488 | 1,621.039 | 2,725.439616 |
| GSM539276 | 1 | 719.9728 | 1,732.95 | 913.8063723 |
| GSM539277 | 1 | 1,491.145 | 1,375.875 | 2,082.408155 |
| GSM539278 | 1 | 2,425.283 | 3,341.205 | 3,497.961428 |
| GSM539279 | 1 | 1,208.035 | 885.0079 | 1,653.395218 |
| GSM539280 | 1 | 1,999.254 | 1,564.762 | 2,852.375074 |
| GSM539281 | −1 | 391.4185 | 495.3794 | 415.929062 |
| GSM539282 | −1 | 355.6202 | 400.3427 | 361.6818301 |
| GSM539283 | −1 | 437.2545 | 578.2272 | 485.3870006 |
| GSM539284 | −1 | 215.4102 | 719.1659 | 149.2135176 |
| GSM539285 | −1 | 464.529 | 402.5466 | 526.717626 |
| GSM539286 | −1 | 483.1193 | 857.3302 | 554.8885815 |
| GSM539275 | 1 | 1,776.678 | 768.9708 | 2,515.092804 |
| GSM539276 | 1 | 998.7648 | 732.2133 | 1,336.275995 |
| GSM539277 | 1 | 2,373.809 | 1,362.486 | 3,419.959903 |
| GSM539278 | 1 | 3,322.548 | 1,513.086 | 4,857.638915 |
| GSM539279 | 1 | 879.2261 | 513.2602 | 1,155.132097 |
| GSM539280 | 1 | 1,201.621 | 1,250.521 | 1,643.675713 |
| GSM539281 | −1 | 411.144 | 251.4373 | 445.8202516 |
| GSM539282 | −1 | 375.7809 | 208.7139 | 392.2325034 |
| GSM539283 | −1 | 406.536 | 168.1061 | 438.837483 |
| GSM539284 | −1 | 297.8341 | 399.4494 | 274.1152146 |
| GSM539285 | −1 | 322.7278 | 352.2844 | 311.8380763 |
| GSM539286 | −1 | 316.283 | 400.1669 | 302.0718985 |
Discussion
In the present study, the expression profiles of
sham operated and ligated heart samples harvested from a Wistar rat
were analyzed and 319, 44 and 57 DEGs were subsequently identified
in the D1, D6 and D42 groups, respectively. AKIP1,
ANKRD23, LTBP2, TGF-β2 and TNFRSF12A
were identified as common DEGs among the three groups, and their
association with cardiac hypertrophy has previously been
demonstrated (34–37). AKIP1 was identified as a key
regulator of heart function via the cAMP-dependent protein kinase
signaling pathway (38). During
periods of the oxidant stress, the expression of AKIP1 is
capable of protecting cardiac myocytes from the ischemic injury via
enhanced mitochondrial integrity (38). Furthermore, the expression of
AKIP1 may also protect the heart via mitochondrial stress
adaptation (39), and it has been
demonstrated that mitochondrial DNA damage may contribute to the
development of cardiac hypertrophy and heart failure (40). These results suggested that
AKIP1 may serve a crucial function in the development of
cardiac hypertrophy via mitochondrial stress adaptation mechanisms.
Hellman et al (16) have
previously demonstrated that LTBP2 and TGF-β2 are
associated with the development of cardiac hypertrophy.
LTBP2, which belongs to the fibrillin superfamily, regulates
the release of TGF-β1 (41,42).
Previous studies have demonstrated that TGF-β, including
TGF-β1, TGF-β2 and TGF-β3, have an important
role in the pathogenesis of cardiac hypertrophy by stimulating the
proliferation of cardiomyocytes (43,44).
These results demonstrated that LTBP2 and TGF-β2 are
associated with the regulation of cardiac hypertrophy. However, the
role of ANKRD23 and TNFRSF12A in the development of
cardiac hypertrophy is yet to be elucidated. As the results of the
present study demonstrated that they were detected as common genes
in the three groups, we hypothesize that AKIP1,
ANKRD23, LTBP2, TGF-β2 and TNFRSF12A
may contribute to the development of cardiac hypertrophy.
Numerous mathematical techniques have been developed
in order to analyze large datasets, and mathematical modeling is a
useful and powerful tool for the analysis of gene expression
patterns (14). LDA is a well-known
multivariate technique that is used for dimension reduction and
classification (45). A 3-gene
model, TNFRSF8, BATF3 and TMOD1, which was
obtained by LDA and leave-one-out cross-validation, was previously
used to separate ALK (−) and anaplastic large-cell lymphoma from
peripheral T-cell lymphoma, and the accuracy of the model was ~97%
(46). Furthermore, a
class-prediction model of patients with Graft-vs-host disease was
previously constructed using LDA, and the accuracy was 63–80%, as
estimated by reverse transcription-quantitative polymerase chain
reaction (47). ROC, which directly
displays the correlation of specificity and sensitivity can be used
to assess the accuracy of diagnostic tests (48). In a previous study conducted by
Barretina et al (49), Cancer
Cell Line Encyclopedia, which is a predictive model, was
cross-validated by specificity and sensitivity of the ROC curve and
used to predict the drug response to gene expression, including
topoisomerase inhibitors associated with Schlafen family member 11.
Similarly, a predictions model has previously been constructed for
dementia using LDA and verified by ROC curve, and the accuracy of
the model was 66%; whereas the specificity and sensitivity were 73%
and 64%, respectively (50). In the
present study, a prediction model of cardiac hypertrophy was
constructed. The assessment of ROC curve demonstrated that the
predictive accuracy of the model was ~83.1% and the specificity and
sensitivity were 0.8, respectively. By comparing the predictive and
measurement data at 42 days, the consistency of these two datasets
was calculated to be 76.5%. These results suggested that the
present prediction model provides improved predictive ability,
which may contribute to the early prediction of the changing trends
in gene expression exhibited in patients with cardiac hypertrophy
disease. However, to elevate the discrimination ability of the
model, further studies with an increased number of samples and more
suitable machine learning algorithm are required.
In the present study, 319, 44 and 57 DEGs were
detected in D1, D6 and D42 groups, respectively. AKIP1,
ANKRD23, LTBP2, TGF-β2 and TNFRSF12A
were identified as common DEGs. A linear equation was calculated
between the D1 and D42 groups, as follows: y=1.526×-186.671. This
linear equation, which acted as a prediction model of gene
expression levels, may contribute to the early prediction of the
changing trends in cardiac hypertrophy disease.
Acknowledgements
The authors of the present study would like to thank
Fenghe Information Technology Co., Ltd (Shanghai, China) for
in-depth editing and language assistance.
References
|
1
|
Heineke J and Molkentin JD: Regulation of
cardiac hypertrophy by intracellular signalling pathways. Nat Rev
Mol Cell Biol. 7:589–600. 2006. View
Article : Google Scholar : PubMed/NCBI
|
|
2
|
Hubert HB, Feinleib M, McNamara PM and
Castelli WP: Obesity as an independent risk factor for
cardiovascular disease: A 26-year follow-up of participants in the
Framingham Heart Study. Circulation. 67:968–977. 1983. View Article : Google Scholar : PubMed/NCBI
|
|
3
|
Wang AY, Wang M, Woo J, Lam CW, Lui SF, Li
PK and Sanderson JE: Inflammation, residual kidney function and
cardiac hypertrophy are interrelated and combine adversely to
enhance mortality and cardiovascular death risk of peritoneal
dialysis patients. J Am Soc Nephrol. 15:2186–2194. 2004. View Article : Google Scholar : PubMed/NCBI
|
|
4
|
Dunn FG, Burns JM and Hornung RS: Left
ventricular hypertrophy in hypertension. Am Heart J. 122:312–315.
1991. View Article : Google Scholar : PubMed/NCBI
|
|
5
|
Osio A, Tan L, Chen SN, Lombardi R, Nagueh
SF, Shete S, Roberts R, Willerson JT and Marian AJ: Myozenin 2 is a
novel gene for human hypertrophic cardiomyopathy. Circ Res.
100:766–768. 2007. View Article : Google Scholar : PubMed/NCBI
|
|
6
|
Kontaraki JE, Parthenakis FI, Patrianakos
AP, Karalis IK and Vardas PE: Altered expression of early cardiac
marker genes in circulating cells of patients with hypertrophic
cardiomyopathy. Cardiovasc Pathol. 16:329–335. 2007. View Article : Google Scholar : PubMed/NCBI
|
|
7
|
Black FM, Packer SE, Parker TG, Michael
LH, Roberts R, Schwartz RJ and Schneider MD: The vascular smooth
muscle alpha-actin gene is reactivated during cardiac hypertrophy
provoked by load. J Clin Invest. 88:1581–1588. 1991. View Article : Google Scholar : PubMed/NCBI
|
|
8
|
Qing YF, Zhou JG, Zhang QB, Wang DS, Li M,
Yang QB, Huang CP, Yin L, Pan SY, Xie WG, et al: Association of
TLR4 Gene rs2149356 polymorphism with primary gouty arthritis in a
case-control study. PLoS One. 8:e648452013. View Article : Google Scholar : PubMed/NCBI
|
|
9
|
Planavila A, Redondo I, Hondares E,
Vinciguerra M, Munts C, Iglesias R, Gabrielli LA, Sitges M, Giralt
M, van Bilsen M and Villarroya F: Fibroblast growth factor 21
protects against cardiac hypertrophy in mice. Nat Commun.
4:20192013. View Article : Google Scholar : PubMed/NCBI
|
|
10
|
Grimwade D, Walker H, Oliver F, Wheatley
K, Harrison C, Harrison G, Rees J, Hann I, Stevens R, Burnett A and
Goldstone A: The importance of diagnostic cytogenetics on outcome
in AML: Analysis of 1,612 patients entered into the MRC AML 10
trial. The medical research council adult and children's leukaemia
working parties. Blood. 92:2322–2333. 1998.PubMed/NCBI
|
|
11
|
Covert MW, Schilling CH and Palsson B:
Regulation of gene expression in flux balance models of metabolism.
J Theor Biol. 213:73–88. 2001. View Article : Google Scholar : PubMed/NCBI
|
|
12
|
Wade KC, Guttentag SH, Gonzales LW,
Maschhoff KL, Gonzales J, Kolla V, Singhal S and Ballard PL: Gene
induction during differentiation of human pulmonary type II cells
in vitro. Am J Respir Cell Mol Biol. 34:727–737. 2006. View Article : Google Scholar : PubMed/NCBI
|
|
13
|
Saban MR, Hellmich H, Nguyen NB, Winston
J, Hammond TG and Saban R: Time course of LPS-induced gene
expression in a mouse model of genitourinary inflammation. Physiol
Genomics. 5:147–160. 2001.PubMed/NCBI
|
|
14
|
Tamayo P, Slonim D, Mesirov J, Zhu Q,
Kitareewan S, Dmitrovsky E, Lander ES and Golub TR: Interpreting
patterns of gene expression with self-organizing maps: Methods and
application to hematopoietic differentiation. Proc Natl Acad Sci
USA. 96:2907–2912. 1999. View Article : Google Scholar : PubMed/NCBI
|
|
15
|
Kondo S and Miura T: Reaction-diffusion
model as a framework for understanding biological pattern
formation. Science. 329:1616–1620. 2010. View Article : Google Scholar : PubMed/NCBI
|
|
16
|
Hellman U, Mörner S, Engström-Laurent A,
Samuel JL and Waldenström A: Temporal correlation between
transcriptional changes and increased synthesis of hyaluronan in
experimental cardiac hypertrophy. Genomics. 96:73–81. 2010.
View Article : Google Scholar : PubMed/NCBI
|
|
17
|
Revell LJ: Size-correction and principal
components for interspecific comparative studies. Evolution.
12:3258–3268. 2009. View Article : Google Scholar
|
|
18
|
Gennebäck N, Malm L, Hellman U,
Waldenström A and Mörner S: Using OPLS-DA to find new hypotheses in
vast amounts of gene expression data-Studying the progression of
cardiac hypertrophy in the heart of aorta ligated rat. Gene.
522:27–36. 2013. View Article : Google Scholar : PubMed/NCBI
|
|
19
|
Troyanskaya O, Cantor M, Sherlock G, Brown
P, Hastie T, Tibshirani R, Botstein D and Altman RB: Missing value
estimation methods for DNA microarrays. Bioinformatics. 17:520–525.
2001. View Article : Google Scholar : PubMed/NCBI
|
|
20
|
Fujita A, Sato JR, de Rodrigues LO,
Ferreira CE and Sogayar MC: Evaluating different methods of
microarray data normalization. BMC Bioinformatics. 7:4692006.
View Article : Google Scholar : PubMed/NCBI
|
|
21
|
Smyth GK Limma: Linear models for
microarray data. Bioinformatics and computational biology solutions
using R and Bioconductor. Gentleman R, Carey V, Huber W, Irizarry R
and Dudiot S: Springer-Verlag London Ltd. (London). 397–420. 2005.
View Article : Google Scholar
|
|
22
|
Benjamini Y and Hochberg Y: Controlling
the false discovery rate: A practical and powerful approach to
multiple testing. J R Statist Soc B. 57:289–300. 1995.
|
|
23
|
Eisen MB, Spellman PT, Brown PO and
Botstein D: Cluster analysis and display of genome-wide expression
patterns. Proc Natl Acad Sci USA. 95:14863–14868. 1998. View Article : Google Scholar : PubMed/NCBI
|
|
24
|
Liang J and Du R: Model-based fault
detection and diagnosis of HVAC systems using support vector
machine method. Int J Refrig. 30:1104–1114. 2007. View Article : Google Scholar
|
|
25
|
Polat K and Güneş S: Breast cancer
diagnosis using least square support vector machine. Digit Signal
Process. 17:694–701. 2007. View Article : Google Scholar
|
|
26
|
Chen LF, Liao HYM, Ko MT, Lin JC and Yu
GJ: A new LDA-based face recognition system which can solve the
small sample size problem. Pattern Recognition. 33:1713–1726. 2000.
View Article : Google Scholar
|
|
27
|
Jiang H, Deng Y, Chen HS, Tao L, Sha Q,
Chen J, Tsai CJ and Zhang S: Joint analysis of two microarray
gene-expression data sets to select lung adenocarcinoma marker
genes. BMC Bioinformatics. 5:812004. View Article : Google Scholar : PubMed/NCBI
|
|
28
|
Imai K: Multivariate regression analysis
for the item count technique. J Amer Statist Assoc. 106:407–416.
2011. View Article : Google Scholar
|
|
29
|
Zhou L, Cheng L, Tao L, Jia X, Lu Y and
Liao P: Detection of hypopharyngeal squamous cell carcinoma using
serum proteomics. Acta Otolaryngol. 126:853–860. 2006. View Article : Google Scholar : PubMed/NCBI
|
|
30
|
Navaglia F, Fogar P, Basso D, Greco E,
Padoan A, Tonidandel L, Fadi E, Zambon CF, Bozzato D, Moz S, et al:
Pancreatic cancer biomarkers discovery by surface-enhanced laser
desorption and ionization time-of-flight mass spectrometry. Clin
Chem Lab Med. 47:713–723. 2009. View Article : Google Scholar : PubMed/NCBI
|
|
31
|
Hewett R and Kijsanayothin P: Tumor
classification ranking from microarray data. BMC Genomics. 9(Suppl
2): S212008. View Article : Google Scholar : PubMed/NCBI
|
|
32
|
Roepman P, Schuurman A, Delahaye LJ,
Witteveen AT, Floore AN and Glas AM: A gene expression profile for
detection of sufficient tumour cells in breast tumour tissue:
Microarray diagnosis eligibility. BMC Med Genomics. 2:522009.
View Article : Google Scholar : PubMed/NCBI
|
|
33
|
Ye QH, Qin LX, Forgues M, He P, Kim JW,
Peng AC, Simon R, Li Y, Robles AI, Chen Y, et al: Predicting
hepatitis B virus-positive metastatic hepatocellular carcinomas
using gene expression profiling and supervised machine learning.
Nat Med. 9:416–423. 2003. View
Article : Google Scholar : PubMed/NCBI
|
|
34
|
Yu H, Tigchelaar W, Lu B, van Gilst WH, de
Boer RA, Westenbrink BD and Silljé HH: AKIP1, a cardiac hypertrophy
induced protein that stimulates cardiomyocyte growth via the Akt
pathway. Int J Mol Sci. 14:21378–21393. 2013. View Article : Google Scholar : PubMed/NCBI
|
|
35
|
Bang ML, Gu Y, Dalton ND, Peterson KL,
Chien KR and Chen J: The muscle ankyrin repeat proteins CARP,
Ankrd2, and DARP are not essential for normal cardiac development
and function at basal conditions and in response to pressure
overload. PloS One. 9:e936382014. View Article : Google Scholar : PubMed/NCBI
|
|
36
|
Kuba K, Zhang L, Imai Y, Arab S, Chen M,
Maekawa Y, Leschnik M, Leibbrandt A, Markovic M, Schwaighofer J, et
al: Impaired heart contractility in Apelin gene-deficient mice
associated with aging and pressure overload. Circ Res. 101:e32–e42.
2007. View Article : Google Scholar : PubMed/NCBI
|
|
37
|
Dobaczewski M, Chen W and Frangogiannis
NG: Transforming growth factor (TGF)-β signaling in cardiac
remodeling. J Mol Cell Cardiol. 51:600–606. 2011. View Article : Google Scholar : PubMed/NCBI
|
|
38
|
Sastri M, Haushalter KJ, Panneerselvam M,
Chang P, Fridolfsson H, Finley JC, Ng D, Schilling JM, Miyanohara
A, Day ME, et al: A kinase interacting protein (AKIP1) is a key
regulator of cardiac stress. Proc Natl Acad Sci USA. 110:E387–E396.
2013. View Article : Google Scholar : PubMed/NCBI
|
|
39
|
Yu H, Tigchelaar W, Koonen DP, Patel HH,
de Boer RA, van Gilst WH, Westenbrink BD and Silljé HH: AKIP1
expression modulates mitochondrial function in rat neonatal
cardiomyocytes. PLoS One. 8:e808152013. View Article : Google Scholar : PubMed/NCBI
|
|
40
|
Dai DF, Johnson SC, Villarin JJ, Chin MT,
Nieves-Cintrón M, Chen T, Marcinek DJ, Dorn GW II, Kang YJ, Prolla
TA, et al: Mitochondrial oxidative stress mediates angiotensin
II-induced cardiac hypertrophy and Galphaq overexpression-induced
heart failure. Circ Res. 108:837–846. 2011. View Article : Google Scholar : PubMed/NCBI
|
|
41
|
Sinha S, Heagerty AM, Shuttleworth CA and
Kielty CM: Expression of latent TGF-beta binding proteins and
association with TGF-beta1 and fibrillin-1 following arterial
injury. Cardiovasc Res. 53:971–983. 2002. View Article : Google Scholar : PubMed/NCBI
|
|
42
|
Sterner-Kock A, Thorey IS, Koli K, Wempe
F, Otte J, Bangsow T, Kuhlmeier K, Kirchner T, Jin S, Keski-Oja J
and von Melchner H: Disruption of the gene encoding the latent
transforming growth factor-beta binding protein 4 (LTBP-4) causes
abnormal lung development, cardiomyopathy, and colorectal cancer.
Genes Dev. 16:2264–2273. 2002. View Article : Google Scholar : PubMed/NCBI
|
|
43
|
Bujak M and Frangogiannis NG: The role of
TGF-beta signaling in myocardial infarction and cardiac remodeling.
Cardiovasc Res. 74:184–195. 2007. View Article : Google Scholar : PubMed/NCBI
|
|
44
|
Dobaczewski M, Chen W and Frangogiannis
NG: Transforming growth factor (TGF)-β signaling in cardiac
remodeling. J Mol Cell Cardiol. 51:600–606. 2011. View Article : Google Scholar : PubMed/NCBI
|
|
45
|
Roth V and Steinhage V: Nonlinear
discriminant analysis using kernel functions. Advances in Neural
Information Processing Systems. 12:Solla SA, Leen TK and Müller KR:
MIT Press. (Cambridge, MA). 568–574. 2000.
|
|
46
|
Agnelli L, Mereu E, Pellegrino E, Limongi
T, Kwee I, Bergaggio E, Ponzoni M, Zamò A, Iqbal J, Piccaluga PP,
et al: European T-Cell Lymphoma Study Group: Identification of a
3-gene model as a powerful diagnostic tool for the recognition of
ALK-negative anaplastic large-cell lymphoma. Blood. 120:1274–1281.
2012. View Article : Google Scholar : PubMed/NCBI
|
|
47
|
Baron C, Somogyi R, Greller LD, Rineau V,
Wilkinson P, Cho CR, Cameron MJ, Kelvin DJ, Chagnon P, Roy DC, et
al: Prediction of graft-versus-host disease in humans by donor
gene-expression profiling. PLoS Med. 4:e232007. View Article : Google Scholar : PubMed/NCBI
|
|
48
|
Beck JR and Shultz EK: The use of relative
operating characteristic (ROC) curves in test performance
evaluation. Arch Pathol Lab Med. 110:13–20. 1986.PubMed/NCBI
|
|
49
|
Barretina J, Caponigro G, Stransky N,
Venkatesan K, Margolin AA, Kim S, Wilson CJ, Lehár J, Kryukov GV,
Sonkin D, et al: The Cancer Cell Line Encyclopedia enables
predictive modelling of anticancer drug sensitivity. Nature.
483:603–607. 2012. View Article : Google Scholar : PubMed/NCBI
|
|
50
|
Maroco J, Silva D, Rodrigues A, Guerreiro
M, Santana I and de Mendonça A: Data mining methods in the
prediction of Dementia: A real-data comparison of the accuracy,
sensitivity and specificity of linear discriminant analysis,
logistic regression, neural networks, support vector machines,
classification trees and random forests. BMC Res Notes. 4:2992011.
View Article : Google Scholar : PubMed/NCBI
|