Introduction
Modern lifestyle changes, such as an increased
prevalence of high-calorie diets and low levels of physical
activity have lead to obesity becoming a global pandemic (1). Obesity may lead to insulin resistance
(IR), which in turn may lead to diabetes (2). Type II diabetes (T2D), which is caused
by chronic IR and loss of functional islet β-cells is now one of
the most prevalent types of diabetes (3,4). In
humans and animal models, obesity has been shown to be a major
causative factor in the development of IR (2), which is typically associated with
dysfunctional metabolism and leads to increased intracellular fat
content in liver (5). The liver
serves a key role in energy metabolism, as does IR. Therefore,
analyzing the changes in gene expression profiles of the liver may
elucidate the process by which T2D develops.
However, the underlying molecular mechanisms remain
to be determined (6). The
identification of a suitable model animal is critical for the study
of T2D (6). The db/db mouse
is one of the best animal models for the study of human T2D as some
of its phenotypes, including polyuria, hyperglycemia and
glucosuria, are similar to those observed in human patients with
T2D. Db/db mice were discovered by Hummel et al in
the inbred line of C57BLKS/J (BKS) in 1966, which is caused by
mutations in the gene of leptin receptor (Lepr) gene located in
mouse chromosome 4 (7). In
db/db mice this typically presents as a hypothalamic
defect; wherein satiety is not produced due to a lack of the
satiety substance (leptin), lack of reaction to anabolic greater
than catabolism, and gradually develop severe T2D accompanied by
hyperglycemia due to the accumulation of fat (8) Mice and humans with T2D exhibit similar
clinical symptoms, such as polydipsia, polyphagia, urorrhagia,
obesity, hyperglycemia, hyperglycemia, IR and lipid metabolism
abnormality (9). Using the
db/db mice model, it may be possible to investigate the
underlying molecular mechanisms and elucidate the complex intrinsic
metabolic processes associated with T2D.
It is widely accepted that if only a single gene is
mutated, the incidence of T2D is low (10). However, environmental factors may
lead to the modification of DNA. When mRNA expression reaches a
certain level as a result of this, the body may never recover to
the normal state (11). DNA
microarray technology allows for simple and precise detection of
significant changes in gene expression (11); however, searching large quantities of
data to identify small changes in the association between
biological molecules and disease is challenging. To overcome this
problem in the present study, a comprehensive analysis of
differences in mRNA expression in the db/db mice liver
tissue was performed by integrating genome-scale microarray gene
expression analysis with bioinformatics analysis. Several novel
potential biomarkers associated with T2D were also investigated,
with a view to facilitating the future development of a more
in-depth study of the pathogenesis of T2D.
Materials and methods
Ethics statement
All animal protocols were approved by the Animal
Experimental Ethical Committee of Heilongjiang University of
Chinese Medicine (Heilongjiang, China).
Animal models
Male BKS.Cg-m+/+Leprdb/J (db/db) mice
(Nanjing Biomedical Research Institute of Nanjing University,
Nanjing, China) aged three (body weight, 7.20±0.51 g), six (body
weight, 28.97±0.93 g) and nine weeks old (body weight, 40.27±0.63
g) were used. Age-matched male heterozygote mice (db/m), a
non-penetrant genotype (Nanjing Biomedical Research Institute of
Nanjing University), were used as the control animals (three weeks
old, 7.23±0.62 g; six weeks old, 18.06±0.84 g; nine weeks old,
23.05±0.35 g). A total of 30 mice were individually housed at a
constant temperature (20±1°C), humidity (50±5%) and light (12
h/day) conditions with a standard pellet diet and water provided
ad libitum.
A total of 15 male db/m mice were divided
into three groups: Three-, six- and nine-week-old control models
(n=5 each). Similarly, a total of 15 male db/db mice were
also divided into three groups: Three-, six- and nine-week-old
model groups (n=5 each). All mice were weighed and sacrificed via
inhaled 99% ether (Tianjin Tianhe Chemical Co., Ltd., Tianjin
China). Blood serum and livers were harvested snap frozen in liquid
nitrogen and stored at −80°C for further analysis.
RNA isolation and microarray
profiling
Liver tissues were thawed and homogenized on ice in
TRIzol (Invitrogen; Thermo Fisher Scientific, Inc., Waltham, MA,
USA) and total RNA was extracted using the TRIzol kit (cat. no.
15596-026; Invitrogen; Thermo Fisher Scientific, Inc.), according
to the manufacturer's protocol. Concentration and purity of RNA
were determined using the ASP-3700 spectrophotometer (ACT Gene,
Inc., Piscataway, NJ, USA).
Whole-genome expression profiling was performed
using Agilent mouse 4×44 K microarrays (Kang Chen Bio-Tech, Inc.,
Shanghai, China). Briefly, RNA samples were amplified and labeled
with the Agilent One-Color RNA Spike-In Kit (cat. no. 5188-5282;
Agilent Technologies, Inc., Santa Clara, CA, USA), and cRNA was
hybridized to the arrays in the Agilent Hybridization Chamber
(Agilent Technologies, Inc.). Hybridization and washing were
performed with the Gene Expression Wash Buffer kit (cat. no.
5188-5327; Agilent Technologies, Inc.), and arrays were scanned
with the GenePix 4000B microarray scanner (Molecular Devices LLC,
Sunnyvale, CA, USA). Image analysis for grid alignment and the
expression data was performed with Nimble Scan software (version
2.5; Roche NimbleGen, Inc., Madison, WI, USA). Volcano plots
(GeneSpring Software, version 7.2; Aligent Technologies, Inc.) were
used to analyze the raw data files.
Assessment of IR in the development of
T2D
Fasting blood-glucose (FBG) was assayed using a
blood glucose meter (Roche Diagnostics, Basel, Switzerland).
Fasting insulin (FINS) was assayed using a commercially available
Quantikine ELISA kit (cat. no. QC107; R&D Systems, Inc.,
Minneapolis, MN, USA). The fasting insulin sensitivity index (FISI)
was calculated using the following formula: FISI=ln [1/(FBG ×
FINS)].
Reverse transcription-quantitative
polymerase chain reaction (RT-qPCR)
RT-qPCR was performed to verify gene expression
microarray data. cDNA was synthesized via reverse transcription of
total liver RNA using the AccuPower Rocket Script RT Premix
(Bioneer Corporation, Daejeon, Korea), according to the
manufacturer's protocol. Primers used for amplification are
presented in Table I. Data were
normalized against the expression levels of the housekeeping gene
β-actin, and relative expression values were calculated using the
2−∆∆Cq method. PCR products were analyzed by agarose gel
electrophoresis to ensure specificity.
 | Table I.Primers used in reverse
transcription-quantitative polymerase chain reaction. |
Table I.
Primers used in reverse
transcription-quantitative polymerase chain reaction.
| Gene | Forward primer
sequence | Reverse primer
sequence |
|---|
| CBX8 |
5′-ATTCGCAAAGGACGCATGGAA-3′ |
5′-CCTCGCTTTTTGGGGCCATA-3′ |
| DDA1 |
5′-GGCTTGCCCGTCTACAACAA-3′ |
5′-CCGCAGAAGTATGTTCGTCTTTT-3′ |
| PIK3R6 |
5′-GACGCCGTGTCATCATTCC-3′ |
5′-TGGTGCAGAAGGTATAAGCTCTA-3′ |
| GATM |
5′GCTTCCTCCCGAAATTCCTGT-3′ |
5′-CCTCTAAAGGGTCCCATTCGT-3′ |
| WDR41 |
5′-CAGGGCCTAGCCGAGAAAG-3′ |
5′-CCAGCAGTTCAGTATAGGGGTT-3′ |
Statistical analysis
Statistical data was expressed as the mean ±
standard error of the mean. Statistical significance of the
differences between model groups and age-matched control groups was
analyzed using a Student's t-test and model groups at different
time points were analyzed by one-way analysis of variance with
Tukey's multiple comparison post hoc tests. Data were analyzed by
SPSS 2.0 statistical software (IBM Corp., Armonk, NY, USA).
P<0.05 was considered to indicate a statistically significant
difference.
Results
Physiological parameters of mice with
T2D of different ages
FINS, FBG and FISI were measured in db/db
mice and controls at three, six and nine weeks old to ensure that
they had developed T2D. Although FBG and weight were similar in
three-week-old db/db mice and controls they were
significantly increased at six (FBG, P<0.05; weight, P<0.001)
and nine weeks (both P<0.001; Fig. 1A
and B), and there was a significant reduction in FISI in
db/db mice compared with their respective controls at three,
six and nine weeks old (P<0.001; Fig.
1C). FINS in the db/db mice group was significantly
greater than in the control group at three, six and nine weeks old
(P<0.001; Fig. 1D). These
physiological parameters indicated that db/db mice had begun
to develop T2D at three, six and nine weeks old.
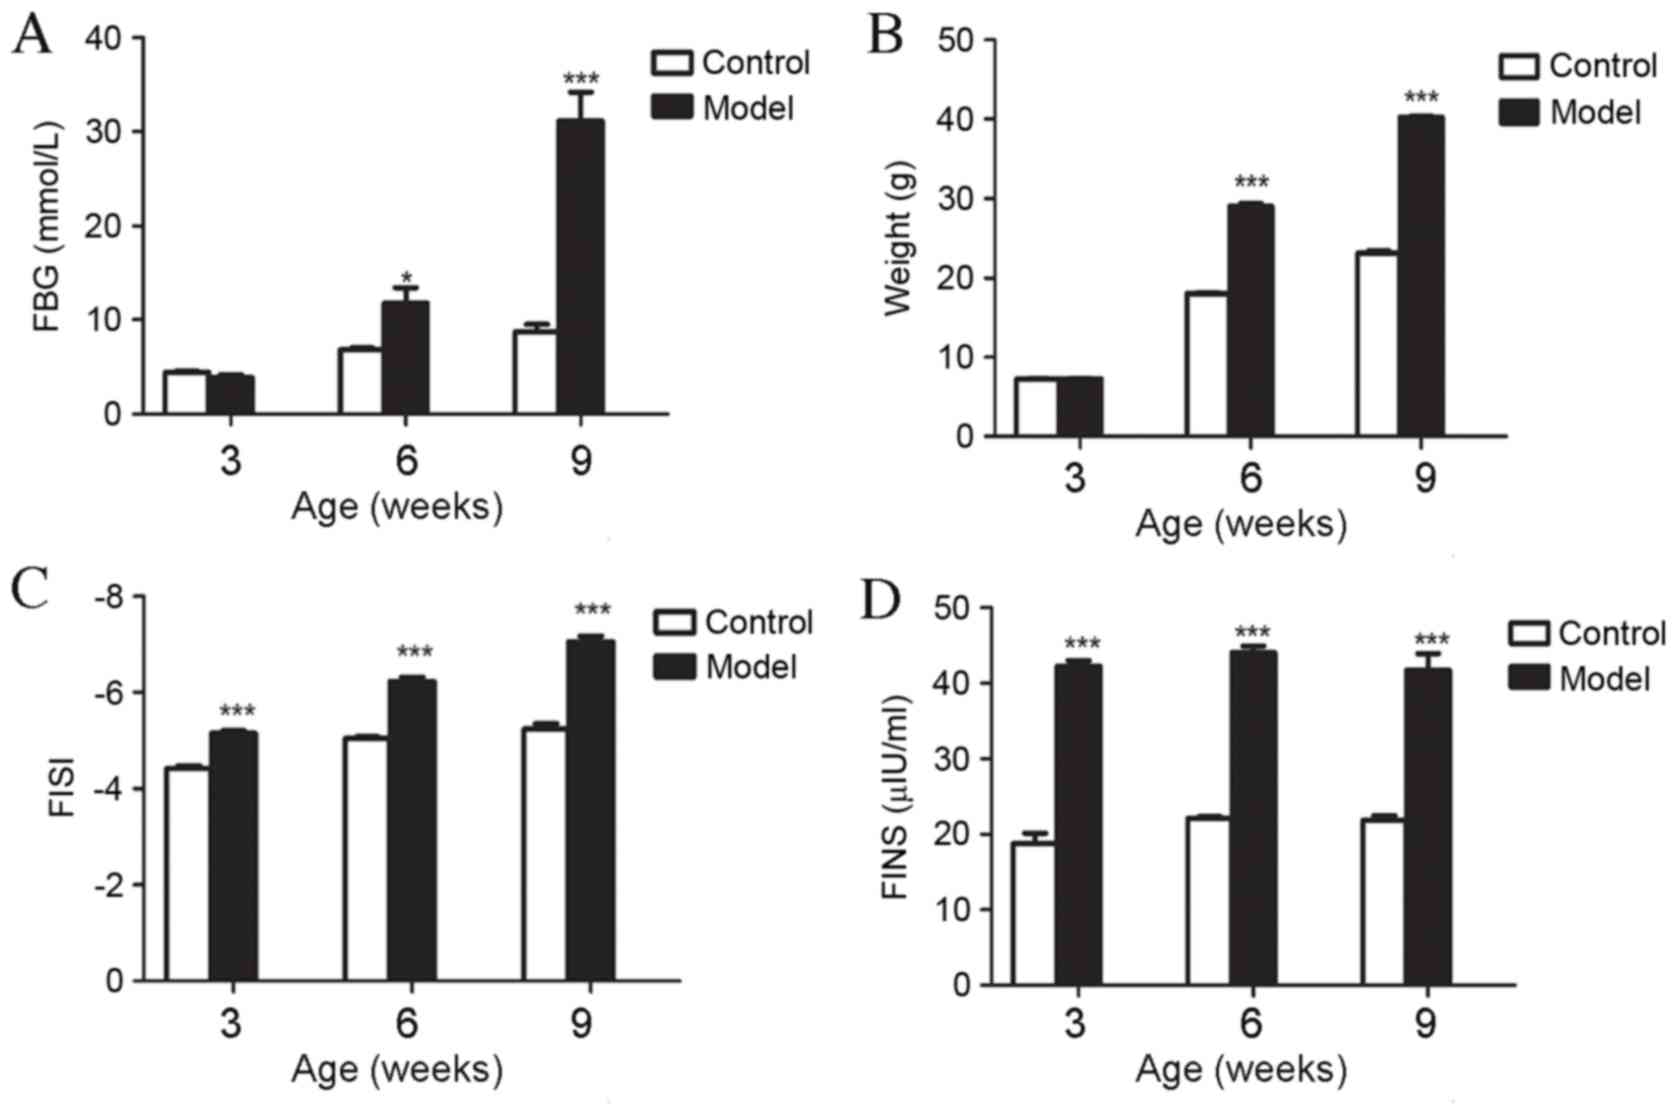 | Figure 1.FBG, weight, FISI and FINS in the
control and diabetic model groups for mice at three, six and nine
weeks old (n=5 each). (A) Significant increases in FBG were
observed in the model group at six and nine weeks old compared with
their respective control groups. (B) Weights of mice in the model
group were significantly greater than those in the control group
for mice at six and nine weeks old, whereas weight was similar in
mice at three weeks old. (C) Significant increases in FISI were
observed in model groups for mice at three, six and nine weeks old
compared with the control group. (D) Significant increases in FINS
were observed in the model group in three, six and nine weeks old
compared with the control group. All data are presented as the mean
± standard error of the mean. *P<0.05 vs. control; **P<0.01
vs. control; ***P<0.001 vs. control. FBG, fasting blood-glucose;
FISI, fasting insulin sensitivity index; FINS, fasting insulin;
model, BKS.Cg-m+/+Leprdb/J mice. |
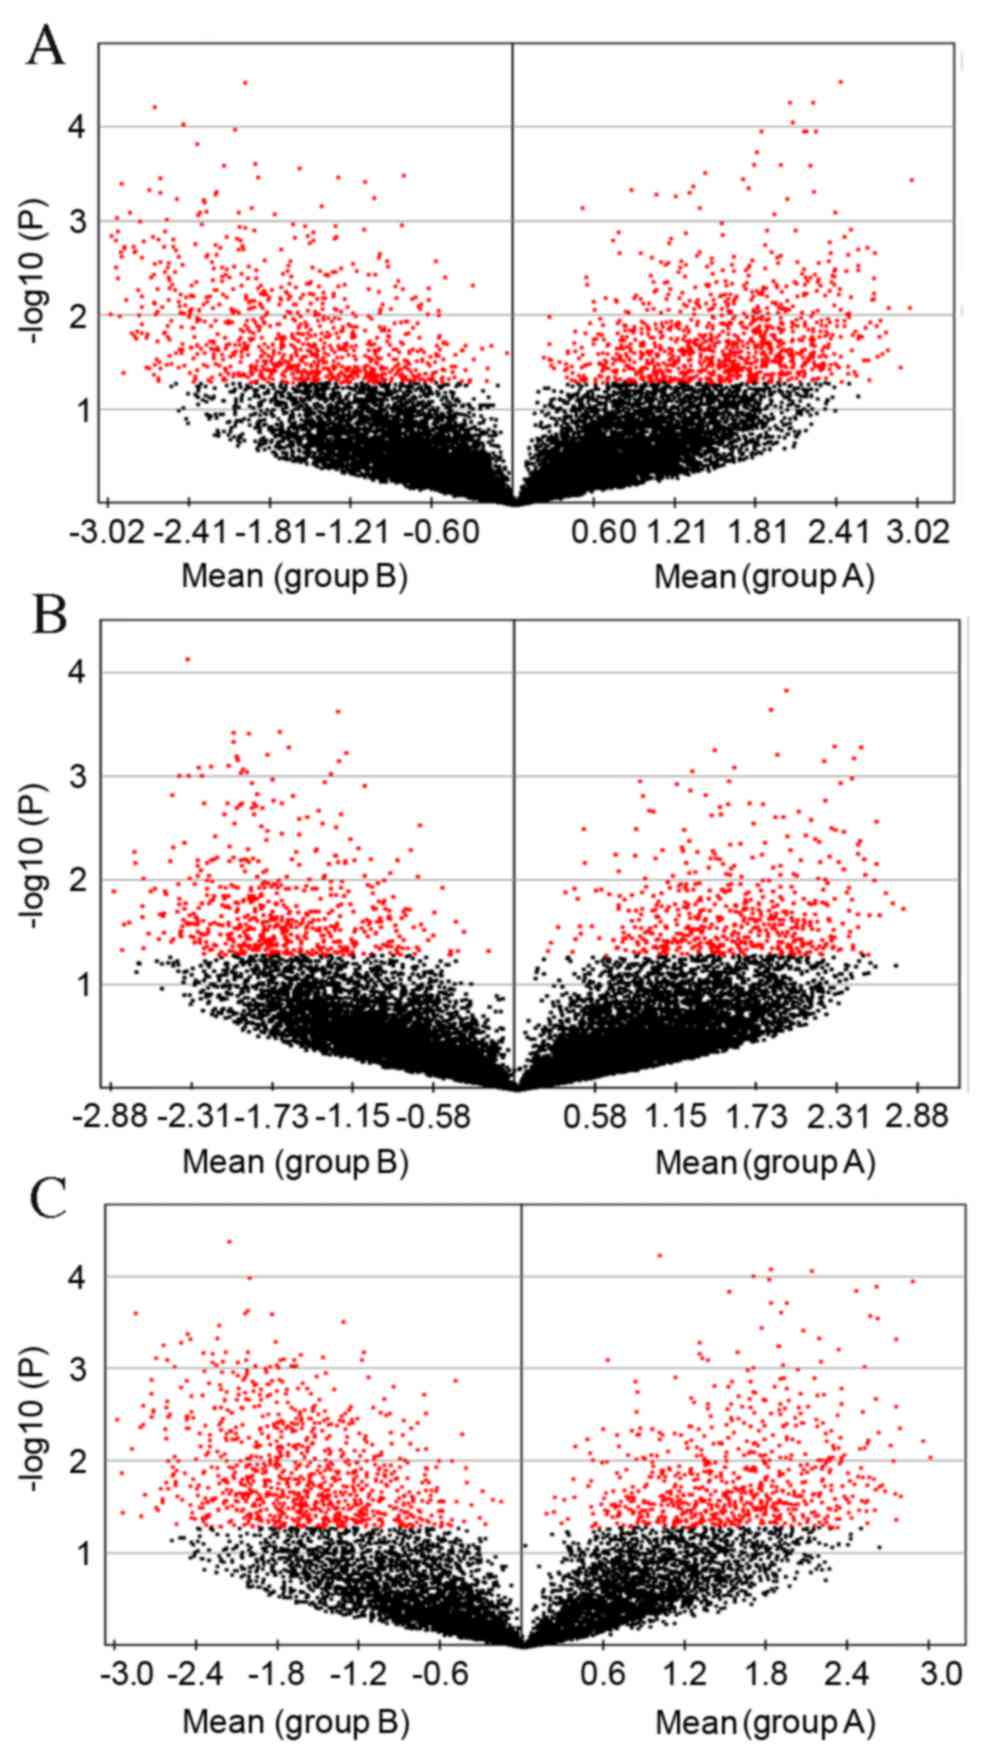
Microarray analysis of global gene
expression changes in liver tissues from mice at different
ages
One of the aims of the present study was to identify
patterns of gene expression that may be associated with the
development of T2D. Insight into the molecular changes may
ultimately guide clinical treatment of patients prior to the
establishment of advanced T2D. Genes that were significantly
differentially expressed in mice of different ages are shown in
Table II. Global gene expression
profiling was performed on RNA prepared from the liver tissue
harvested from five db/db model mice and five control mice
for each age group (three, six and nine weeks). Results were
selected according to the raw data data of the global genome
microarray data of mice at each age as shown in Fig. 2A-C.
| Table II.Significantly differentially
expressed genes in mice at different ages. |
Table II.
Significantly differentially
expressed genes in mice at different ages.
|
| 3 weeks old | 6 weeks old | 9 weeks old |
|---|
|
|
|
|
|
|---|
| Gene | Fold-change | P-value | Fold-change | P-value | Fold-change | P-value |
|---|
| CBX8 | 2.21 | 0.0350 | 2.48 | 0.0297 | 2.71 | 0.0009 |
| DDA1 | 0.74 | 0.0477 | 3.37 | 0.0085 | 3.96 | 0.0009 |
| PIK3R6 | 0.56 | 0.5040 | 2.1 | 0.0126 | 2.58 | 0.0317 |
| GATM | −1.02 | 0.2521 | −3.89 | 0.0125 | −4.44 | 0.0077 |
| WDR41 | 0.58 | 0.0713 | 4.25 | 0.0024 | 4.36 | 0.0011 |
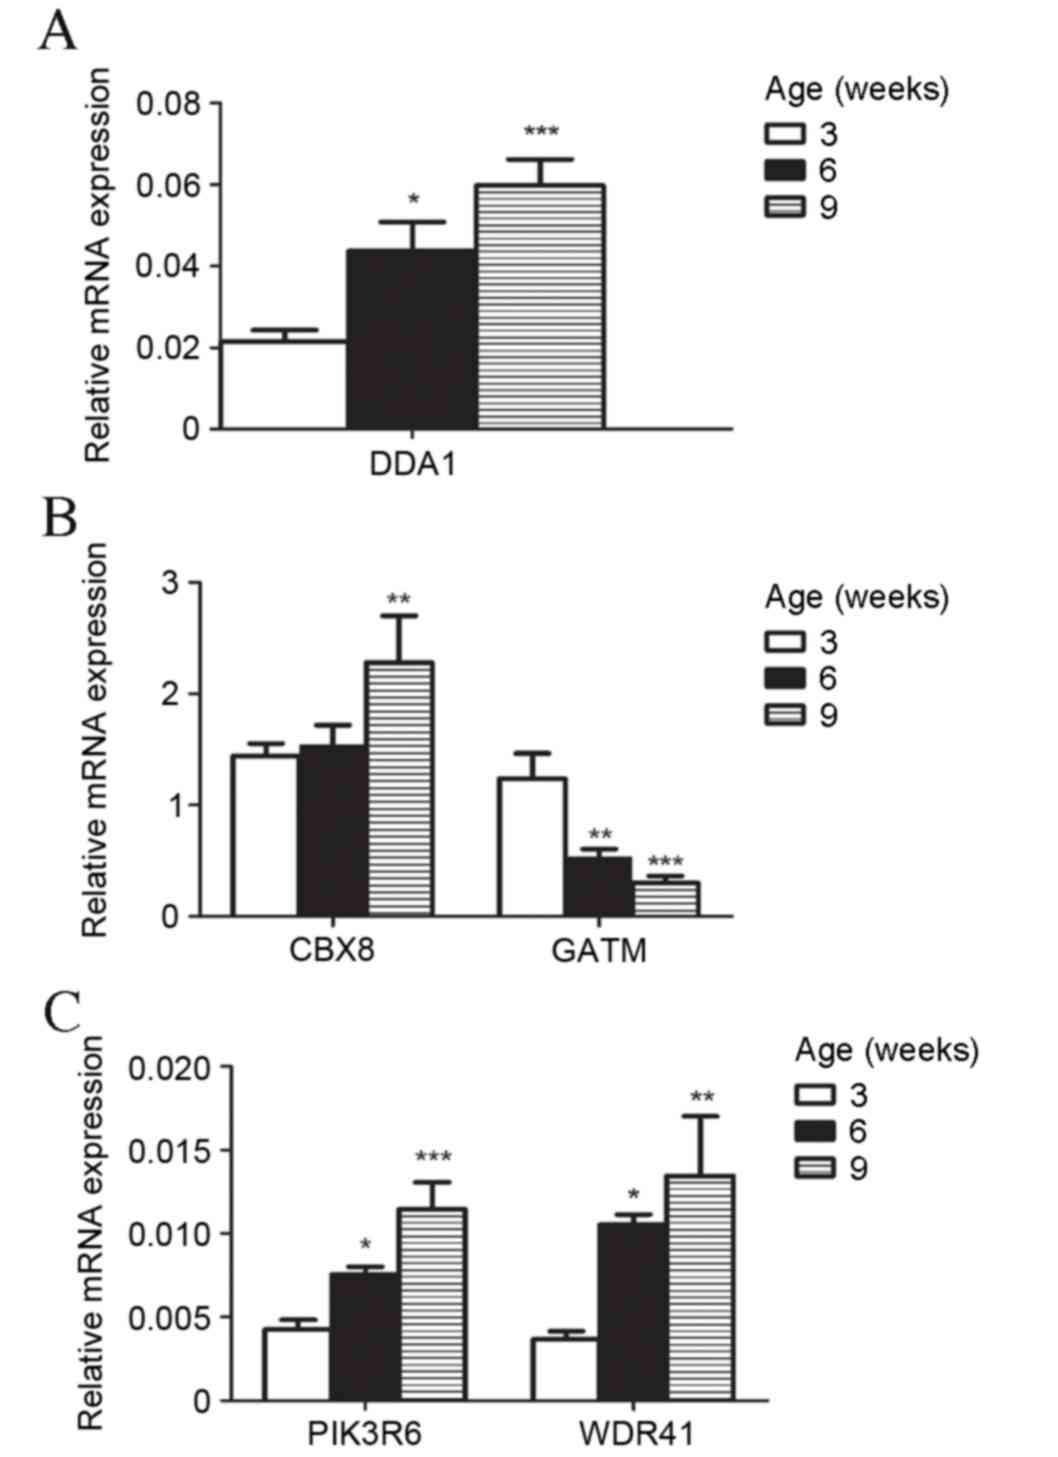
Validation of microarray data for five
differentially expressed mRNA in liver tissues by RT-qPCR
To validate the results of microarray gene
expression profiling, five mRNAs with different expression patterns
in the development of T2D, as identified by microarray analysis,
were selected for expression verification by RT-qPCR. All
expression levels were consistent with microarray predictions. mRNA
expression levels of chromobox 8 (CBX8), de-etiolated
homolog 1 and damage specific DNA binding protein 1 associated 1
(DDA1), Phosphoinositide-3-kinase regulatory subunit 6
(PIK3R6) and WD repeat domain 41 (WDR41) by RT-qPCR
increased significantly (P<0.05) and Glycine Amidinotransferase
(GATM) decreased significantly (P<0.05) in db/db
mice compared with controls (Fig.
3A-E). The upregulation and downregulation of these key genes
in db/db mice was markedly greater with increased age of
mice (Fig. 4A-C).
 | Figure 3.RT-qPCR confirmation of microarray
results. The expression levels of five genes selected from the
microarray data were validated via RT-qPCR. (A) Expression of
CBX8 increased in model mice compared with control mice at
three, six and nine weeks old. Expression of (B) DDA1, (C)
PIK3R6 and (D) WDR41 increased in model mice compared
with their respective controls at six and nine weeks old. (E)
GATM expression decreased in model mice compared with
control mice at six and nine weeks old. All data are presented as
the mean ± standard error of the mean. *P<0.05, **P<0.01 and
***P<0.001, vs. control groups. RT-qPCR, reverse
transcription-quantitative polymerase chain reaction; CBX8,
chromobox 8; DDA1, de-etiolated homolog 1 and damage
specific DNA binding protein 1 associated 1; PIK3R6,
phosphoinositide-3-kinase regulatory subunit 6; WDR41, WD
repeat domain 41; GATM, glycine amidinotransferase; model,
BKS.Cg-m+/+Leprdb/J mice. |
Discussion
T2D is the most prevalent metabolic disease
affecting various physiological functions and leading to diverse
health complications (12). Although
the base causes of T2D appear simple, global molecular changes must
occur in response to the inability to regulate glucose. Notably,
db/db mice, which are deficient in the leptin receptor and
thus leptin signaling, eventually develop hyperphagia and obesity
regardless of strain background (13), which induces T2D. Such mice develop
insulin resistance at an early age, as well as high FBG levels,
insulin levels and FISI (14,15). The
results of the present study demonstrate that there were
significant differences in FISI, FINS, FBG and weight between the
control and model groups for mice at six and nine weeks old, with
differences becoming more marked with age. This demonstrates that
the clinical symptoms of T2D in model rats become more apparent
with age, which provides rationale for the use of db/db mice
as a reliable model for T2D.
In the present study, a number of differentially
expressed mRNAs in liver tissue were detected in db/db mice
compared with normal controls. Differential gene data from mice at
three, six and nine weeks old demonstrated that there were hundreds
of differentially expressed genes. The five genes that were most
differentially expressed were identified and screened. RT-qPCR was
subsequently performed and analyzed to verify the differential
expression of the five mRNAs from the microarray results.
Differential expression of CBX8, DDA1, PIK3R6,
GATM and WDR41 in liver tissues was confirmed, which
may contribute to the occurrence and development of T2D. The
present study may provide useful information pertaining to the
association between mRNAs and T2D development and provide rationale
for further study.
To elucidate the molecular mechanisms responsible
for T2D development, different ages of db/db mice, which is
a frequently used and reliable animal model, were used to identify
the differentially expressed mRNAs in model and normal control
liver tissues and to predict the target genes that these mRNAs
regulate. This analysis demonstrated that the differentially
expressed mRNAs were responsible for regulating cell proliferation,
cell apoptosis and the genes responsible for hormone stimulus
(16). This indicates that
differential expression of these mRNAs may induce changes in liver
tissue and lead to T2D development. The key genes associated with
these processes include CBX8, DDA1, PIK3R6,
GATM and WDR41; however, further studies are required
to confirm their functions with T2D.
CBX8, part of the polycomb group repressive
complex 1, belongs to the CBX protein family, which is homologous
to the Drosophila polycomb protein (17) and regulates the proliferation of
diploid human and mouse fibroblasts through direct binding to the
INK4A-ARF locus (18). Furthermore,
a previous study demonstrated that the ectopic expression of
CBX8 leads to cellular immortalization (19). The activation of auxin response
factor and mouse double limit 2 homolog (MDM2) and subsequent
protein binding weakens the E3 ubiquitin ligase function,
inhibiting p53 protein degradation (20–23).
Additionally, a recent study demonstrated that human abdominal
adipose tissue from obese subjects and adipose tissue of mice fed a
high-fat diet exhibited a reduced expression of the E3 ubiquitin
ligase and exhibited IR (24). DDA1
is a DDB1-binding protein that links to a negative regulator
of E3 ubiquitin ligase (25).
Retinoblastoma and p53 proteins cross link to protect cells against
abnormal proliferation signals (26–29). The
protein kinase B (Akt) pathway is considered to increase cell
survival as the interaction of Akt with the phosphorylation of MDM2
in the PI3K-AKT pathway is associated with the survival,
proliferation, growth and death of cells (30). It is well known that the PI3K-AKT
signaling pathway is associated with the development of T2D
(31). RT-qPCR analysis demonstrated
an upregulation in mRNA in model liver tissues compared with normal
liver tissues. This suggests that CBX8 and DDA1 are
associated with the development of T2D.
PIK3R6 is a phosphoinositide 3-kinase (PI3K)γ
subunit (32). PI3Ks are classified
as class I, II or III based on substrate binding and sequence
homology. Class I PI3Ks are subdivided into α, β, γ and δ. PI3K
signaling is well known for its association with various functions,
including vesicle trafficking, cell metabolism, cell growth and
cell survival (33). It has
previously been demonstrated that PI3Kγ serves an essential role in
the formation of sarcomas induced by a viral
G-protein-coupled-receptor encoded by Kaposi's sarcoma herpes virus
(34). PI3Kγ also serves important
roles in the heart (35). These
studies have demonstrated that PI3K may be used as a target for the
treatment of certain inflammatory and cardiac disorders (36). PIK3R6 is able to regulate the
activity of PI3K, and further regulate the signal transduction of
the PI3K-AKT signaling pathway (37). Phosphorylation of PI3K-AKT has been
shown to improve glucose uptake and promote glucose transporter
type 4 translocation from the cytoplasm to the plasma membrane,
which may stimulate cellular uptake of glucose (38). Furthermore, unpublished data by the
present authors demonstrated that the expression of PIK3R6
was upregulated, which may disturb the conduction of the PI3K-AKT
signaling pathway and indirectly lead to the development of
T2D.
GATM is an enzyme required in the
rate-limiting step in the regulation of creatine biosynthesis
(39). In the present study,
activation of the compensatory mechanisms to increase serine,
glycine and the levels of creatine may be induced by the
differential expression of phosphoserine phosphatase, GATM
and GLDC in the skeletal muscle of individuals with diabetes
(40). Additionally, a recent study
demonstrated that reduced GATM expression may diminish the
capacity for phosphocreatine storage, and modify cellular energy
storage and adenosine monophosphate-activated protein kinase (AMPK)
signaling pathway conduction (41).
The PI3K-AKT and AMPK pathways may be potential targets for the
regulation of glucose metabolism associated with IR in patients
with T2D and obesity (42). Glucose
metabolism occurs primarily in the liver (43). In the present study, it was
demonstrated that expression of GATM was downregulated in
model liver tissues compared with normal liver tissues. This
downregulation may affect the AMPK pathway in the liver, inducing
glucose metabolism disorders, which may further affect the
development of T2D.
WDR41 contains a WD40 domain consisting of
six WD40 repeats. WD40 domains are associated with various cellular
functions, including signal transduction, vesicular trafficking,
cell cycle control, cell apoptosis, chromatin dynamics and DNA
damage response (44–46). These functions are prominent features
in proteins that mediate diverse protein-protein interactions and
coordinate downstream events, including ubiquitination and histone
methylation (45,46). Histone methylation is a reversible
process catalyzed by specific and general histone
methyltransferases and demethylases, which in turn rely on
metabolic coenzymes and respond to changes in energy supply and
metabolic status (47). The results
of the present study demonstrated that the genome-wide changes in
T2D were directly associated with the specific histone
modifications in the process of histone methylation (48). The WDR41 gene was upregulated
in db/db mice at three, six and nine weeks of age,
suggesting that WDR41 is associated with histone methylation
and serves a function in the development of T2D.
Gene profiling data from the present study may
illustrate the contributions of differentially expressed mRNAs to
the underlying mechanisms of T2D in the mouse model; however,
compared with human models, there are distinct physiological
differences. In conclusion, the present study documents the
potential molecular mechanisms associated with T2D in model mice.
Novel genes associated with T2D have been identified, and future
studies should investigate two aspects; to validate expression and
functions of these key mRNAs in T2D human and mice, and to
investigate how the knockout or knockin effect of these key mRNA
expression levels may affect T2D development.
Acknowledgements
The authors would like to thank Dr. Wei Liu of the
Key Laboratory of Myocardial Ischemia (Harbin Medical University)
of the Chinese Ministry of Education for guidance and assistance
for technical support. The present study was supported by grants
from the National Natural Science Foundation of China (grant no.
81273650); the Chinese Ministry of Science and Technology (grant
no. 2012ZX09103201-018); the Natural Science Foundation of
Heilongjiang province (grant no. LC2011C03); the Harbin Science and
Technology Bureau of Heilongjiang Province (grant no.
2011RFLXS024); Heilongjiang University of Chinese Medicine
‘Excellent Creative Talents Support Program’ (grant no. 2012RCD19)
and the Key Laboratory of Myocardial Ischemia, Harbin Medical
University, Chinese Ministry of Education (grant no. KF201319).
References
|
1
|
Haslam DW and James WP: Obesity. Lancet.
366:1197–1209. 2005. View Article : Google Scholar : PubMed/NCBI
|
|
2
|
Langeveld M and Aerts JM:
Glycosphingolipids and insulin resistance. Prog Lipid Res.
48:196–205. 2009. View Article : Google Scholar : PubMed/NCBI
|
|
3
|
Ai J, Wang N, Yang M, Du ZM, Zhang YC and
Yang BF: Development of Wistar rat model of insulin resistance.
World J Gastroenterol. 11:3675–3679. 2005. View Article : Google Scholar : PubMed/NCBI
|
|
4
|
Stoffers DA: The development of beta-cell
mass: Recent progress and potential role of GLP-1. Horm Metab Res.
36:811–821. 2004. View Article : Google Scholar : PubMed/NCBI
|
|
5
|
Flück CE, Slotboom J, Nuoffer JM, Kreis R,
Boesch C and Mullis PE: Normal hepatic glycogen storage after
fasting and feeding in children and adolescents with type 1
diabetes. Pediatr Diabetes. 4:70–76. 2003. View Article : Google Scholar : PubMed/NCBI
|
|
6
|
Kuang H, Han D, Xie J, Yan Y, Li J and Ge
P: Profiling of differentially expressed microRNAs in premature
ovarian failure in an animal model. Gynecol Endocrinol. 30:57–61.
2014. View Article : Google Scholar : PubMed/NCBI
|
|
7
|
Hummel KP, Dickie MM and Coleman DL:
Diabetes, a new mutation in the mouse. Science. 153:1127–1128.
1966. View Article : Google Scholar : PubMed/NCBI
|
|
8
|
Yun KU, Ryu CS, Lee JY, Noh JR, Lee CH,
Lee HS, Kang JS, Park SK, Kim BH and Kim SK: Hepatic metabolism of
sulfur amino acids in db/db mice. Food Chem Toxicol. 53:180–186.
2013. View Article : Google Scholar : PubMed/NCBI
|
|
9
|
Davis RC, Castellani LW, Hosseini M,
Ben-Zeev O, Mao HZ, Weinstein MM, Jung DY, Jun JY, Kim JK, Lusis AJ
and Péterfy M: Early hepatic insulin resistance precedes the onset
of diabetes in obese C57BLKS-db/db mice. Diabetes. 59:1616–1625.
2010. View Article : Google Scholar : PubMed/NCBI
|
|
10
|
Permutt MA, Wasson J and Cox N: Genetic
epidemiology of diabetes. J Clin Invest. 115:1431–1439. 2005.
View Article : Google Scholar : PubMed/NCBI
|
|
11
|
Bonnefond A, Froguel P and Vaxillaire M:
The emerging genetics of type 2 diabetes. Trends Mol Med.
16:407–416. 2010. View Article : Google Scholar : PubMed/NCBI
|
|
12
|
Panzer C, Lauer MS, Brieke A, Blackstone E
and Hoogwerf B: Association of fasting plasma glucose with heart
rate recovery in healthy adults: A population-based study.
Diabetes. 51:803–807. 2002. View Article : Google Scholar : PubMed/NCBI
|
|
13
|
Lutz TA and Woods SC: Overview of animal
models of obesity. Curr Protoc Pharmacol Chapter 5: Unit5.61. 2012.
View Article : Google Scholar
|
|
14
|
Lee W, Ham J, Kwon HC, Kim YK and Kim SN:
Anti-diabetic effect of amorphastilbol through PPARα/γ dual
activation in db/db mice. Biochem Biophys Res Commun. 432:73–79.
2013. View Article : Google Scholar : PubMed/NCBI
|
|
15
|
Puff R, Dames P, Weise M, Göke B, Seissler
J, Parhofer KG and Lechner A: Reduced proliferation and a high
apoptotic frequency of pancreatic beta cells contribute to
genetically-determined diabetes susceptibility of db/db BKS mice.
Horm Metab Res. 43:306–311. 2011. View Article : Google Scholar : PubMed/NCBI
|
|
16
|
Dweep H, Sticht C, Kharkar A, Pandey P and
Gretz N: Parallel analysis of mRNA and microRNA microarray profiles
to explore functional regulatory patterns in polycystic kidney
disease: Using PKD/Mhm rat model. PLoS One. 8:e537802013.
View Article : Google Scholar : PubMed/NCBI
|
|
17
|
Maertens GN, El Messaoudi-Aubert S, Racek
T, Stock JK, Nicholls J, Rodriguez-Niedenführ M, Gil J and Peters
G: Several distinct polycomb complexes regulate and co-localize on
the INK4a tumor suppressor locus. PLoS One. 4:e63802009. View Article : Google Scholar : PubMed/NCBI
|
|
18
|
Bracken AP, Kleine-Kohlbrecher D, Dietrich
N, Pasini D, Gargiulo G, Beekman C, Theilgaard-Mönch K, Minucci S,
Porse BT, Marine JC, et al: The Polycomb group proteins bind
throughout the INK4A-ARF locus and are disassociated in senescent
cells. Genes Dev. 21:525–530. 2007. View Article : Google Scholar : PubMed/NCBI
|
|
19
|
Dietrich N, Bracken AP, Trinh E,
Schjerling CK, Koseki H, Rappsilber J, Helin K and Hansen KH:
Bypass of senescence by the polycomb group protein CBX8 through
direct binding to the INK4A-ARF locus. EMBO J. 26:1637–1648. 2007.
View Article : Google Scholar : PubMed/NCBI
|
|
20
|
Stott FJ, Bates S, James MC, McConnell BB,
Starborg M, Brookes S, Palmero I, Ryan K, Hara E, Vousden KH and
Peters G: The alternative product from the human CDKN2A locus,
p14(ARF), participates in a regulatory feedback loop with p53 and
MDM2. EMBO J. 17:5001–5014. 1998. View Article : Google Scholar : PubMed/NCBI
|
|
21
|
Kamijo T, Weber JD, Zambetti G, Zindy F,
Roussel MF and Sherr CJ: Functional and physical interactions of
the ARF tumor suppressor with p53 and Mdm2. Proc Natl Acad Sci USA.
95:8292–8297. 1998. View Article : Google Scholar : PubMed/NCBI
|
|
22
|
Zhang Y, Xiong Y and Yarbrough WG: ARF
promotes MDM2 degradation and stabilizes p53: ARF-INK4a locus
deletion impairs both the Rb and p53 tumor suppression pathways.
Cell. 92:725–734. 1998. View Article : Google Scholar : PubMed/NCBI
|
|
23
|
Pomerantz J, Schreiber-Agus N, Liégeois
NJ, Silverman A, Alland L, Chin L, Potes J, Chen K, Orlow I, Lee
HW, et al: The Ink4a tumor suppressor gene product, p19Arf,
interacts with MDM2 and neutralizes MDM2's inhibition of p53. Cell.
92:713–723. 1998. View Article : Google Scholar : PubMed/NCBI
|
|
24
|
Yang S, Wang B, Humphries F, Hogan AE,
O'Shea D and Moynagh PN: The E3 ubiquitin ligase Pellino3 protects
against obesity-induced inflammation and insulin resistance.
Immunity. 41:973–987. 2014. View Article : Google Scholar : PubMed/NCBI
|
|
25
|
Pick E, Lau OS, Tsuge T, Menon S, Tong Y,
Dohmae N, Plafker SM, Deng XW and Wei N: Mammalian DET1 regulates
Cul4A activity and forms stable complexes with E2
ubiquitin-conjugating enzymes. Mol Cell Biol. 27:4708–4719. 2007.
View Article : Google Scholar : PubMed/NCBI
|
|
26
|
Bates S, Phillips AC, Clark PA, Stott F,
Peters G, Ludwig RL and Vousden KH: p14ARF links the tumour
suppressors RB and p53. Nature. 395:124–125. 1998. View Article : Google Scholar : PubMed/NCBI
|
|
27
|
de Stanchina E, McCurrach ME, Zindy F,
Shieh SY, Ferbeyre G, Samuelson AV, Prives C, Roussel MF, Sherr CJ
and Lowe SW: E1A signaling to p53 involves the p19(ARF) tumor
suppressor. Genes Dev. 12:2434–2442. 1998. View Article : Google Scholar : PubMed/NCBI
|
|
28
|
Zindy F, Eischen CM, Randle DH, Kamijo T,
Cleveland JL, Sherr CJ and Roussel MF: Myc signaling via the ARF
tumor suppressor regulates p53-dependent apoptosis and
immortalization. Genes Dev. 12:2424–2433. 1998. View Article : Google Scholar : PubMed/NCBI
|
|
29
|
Radfar A, Unnikrishnan I, Lee HW, DePinho
RA and Rosenberg N: p19(Arf) induces p53-dependent apoptosis during
abelson virus-mediated pre-B cell transformation. Proc Natl Acad
Sci USA. 95:13194–13199. 1998. View Article : Google Scholar : PubMed/NCBI
|
|
30
|
Nacerddine K, Beaudry JB, Ginjala V,
Westerman B, Mattiroli F, Song JY, van der Poel H, Ponz OB,
Pritchard C, Cornelissen-Steijger P, et al: Akt-mediated
phosphorylation of Bmi1 modulates its oncogenic potential, E3
ligase activity and DNA damage repair activity in mouse prostate
cancer. J Clin Invest. 122:1920–1932. 2012. View Article : Google Scholar : PubMed/NCBI
|
|
31
|
Kitagishi Y, Nakanishi A, Minami A, Asai
Y, Yasui M, Iwaizako A, Suzuki M, Ono Y, Ogura Y and Matsuda S:
Certain diet and lifestyle may contribute to islet β-cells
protection in type-2 diabetes via the modulation of cellular
PI3K/AKT Pathway. Open Biochem J. 8:74–82. 2014. View Article : Google Scholar : PubMed/NCBI
|
|
32
|
Biethahn K, Orinska Z, Vigorito E,
Goyeneche-Patino DA, Mirghomizadeh F, Föger N and Bulfone-Paus S:
miRNA-155 controls mast cell activation by regulating the PI3Kγ
pathway and anaphylaxis in a mouse model. Allergy. 69:752–762.
2014. View Article : Google Scholar : PubMed/NCBI
|
|
33
|
Engelman JA, Luo J and Cantley LC: The
evolution of phosphatidylinositol 3-kinases as regulators of growth
and metabolism. Nat Rev Genet. 7:606–619. 2006. View Article : Google Scholar : PubMed/NCBI
|
|
34
|
Martin D, Galisteo R, Molinolo AA, Wetzker
R, Hirsch E and Gutkind JS: PI3Kγ mediates kaposi's
sarcoma-associated herpesvirus vGPCR-induced sarcomagenesis. Cancer
Cell. 19:805–813. 2011. View Article : Google Scholar : PubMed/NCBI
|
|
35
|
Prasad SV Naga, Laporte SA, Chamberlain D,
Caron MG, Barak L and Rockman HA: Phosphoinositide 3-kinase
regulates beta2-adrenergic receptor endocytosis by AP-2 recruitment
to the receptor/beta-arrestin complex. J Cell Biol. 158:563–575.
2002. View Article : Google Scholar : PubMed/NCBI
|
|
36
|
Vadas O, Dbouk HA, Shymanets A, Perisic O,
Burke JE, Abi Saab WF, Khalil BD, Harteneck C, Bresnick AR,
Nürnberg B, et al: Molecular determinants of PI3Kγ-mediated
activation downstream of G-protein-coupled receptors (GPCRs). Proc
Natl Acad Sci USA. 110:18862–18867. 2013. View Article : Google Scholar : PubMed/NCBI
|
|
37
|
Geering B, Cutillas PR, Nock G, Gharbi SI
and Vanhaesebroeck B: Class IA phosphoinositide 3-kinases are
obligate p85-p110 heterodimers. Proc Natl Acad Sci USA.
104:7809–7814. 2007. View Article : Google Scholar : PubMed/NCBI
|
|
38
|
Zhu S, Sun F, Li W, Cao Y, Wang C, Wang Y,
Liang D, Zhang R, Zhang S, Wang H and Cao F: Apelin stimulates
glucose uptake through the PI3K/Akt pathway and improves insulin
resistance in 3T3-L1 adipocytes. Mol Cell Biochem. 353:305–313.
2011. View Article : Google Scholar : PubMed/NCBI
|
|
39
|
Walker JB: Creatine: Biosynthesis,
regulation, and function. Adv Enzymol Relat Areas Mol Biol.
50:177–242. 1979.PubMed/NCBI
|
|
40
|
Hansen JS, Zhao X, Irmler M, Liu X, Hoene
M, Scheler M, Li Y, Beckers J, Hrabĕ de Angelis M, Häring HU, et
al: Type 2 diabetes alters metabolic and transcriptional signatures
of glucose and amino acid metabolism during exercise and recovery.
Diabetologia. 58:1845–1854. 2015. View Article : Google Scholar : PubMed/NCBI
|
|
41
|
Choe CU, Nabuurs C, Stockebrand MC, Neu A,
Nunes P, Morellini F, Sauter K, Schillemeit S, Hermans-Borgmeyer I,
Marescau B, et al: L-arginine: Glycine amidinotransferase
deficiency protects from metabolic syndrome. Hum Mol Genet.
22:110–123. 2013. View Article : Google Scholar : PubMed/NCBI
|
|
42
|
Sharma BR, Kim HJ and Rhyu DY: Caulerpa
lentillifera extract ameliorates insulin resistance and regulates
glucose metabolism in C57BL/KsJ-db/db mice via PI3K/AKT signaling
pathway in myocytes. J Transl Med. 13:622015. View Article : Google Scholar : PubMed/NCBI
|
|
43
|
Mithieux G, Gautier-Stein A, Rajas F and
Zitoun C: Contribution of intestine and kidney to glucose fluxes in
different nutritional states in rat. Comp Biochem Physiol B Biochem
Mol Biol. 143:195–200. 2006. View Article : Google Scholar : PubMed/NCBI
|
|
44
|
Smith TF: Diversity of WD-repeat proteins.
Subcell Biochem. 48:20–30. 2008. View Article : Google Scholar : PubMed/NCBI
|
|
45
|
Xu C and Min J: Structure and function of
WD40 domain proteins. Protein Cell. 2:202–214. 2011. View Article : Google Scholar : PubMed/NCBI
|
|
46
|
Stirnimann CU, Petsalaki E, Russell RB and
Müller CW: WD40 proteins propel cellular networks. Trends Biochem
Sci. 35:565–574. 2010. View Article : Google Scholar : PubMed/NCBI
|
|
47
|
Teperino R, Schoonjans K and Auwerx J:
Histone methyl transferases and demethylases; can they link
metabolism and transcription? Cell Metab. 12:321–327. 2010.
View Article : Google Scholar : PubMed/NCBI
|
|
48
|
Jufvas A, Sjödin S, Lundqvist K, Amin R,
Vener AV and Strålfors P: Global differences in specific histone H3
methylation are associated with overweight and type 2 diabetes.
Clin Epigenetics. 5:152013. View Article : Google Scholar : PubMed/NCBI
|