Introduction
Multiple myeloma (MM) is a malignant disease of
complex etiology, characterized by the abnormal proliferation of
plasma cells with a concomitant increase of monoclonal
immunoglobulin in serum or urine, and immune deficiency. Patients
with MM present with anemia, hypercalcemia, renal impairment and/or
bone disease (1,2). Promoter hypermethylation as the
mechanism of transcriptional silencing of a number of genes has
been demonstrated in samples from the bone marrow and peripheral
blood of patients with MM and in MM cell lines, although the
published results and their interpretation have been inconsistent
(3,4). The functional suppression of genes
achieved by hypermethylation of CpG-enriched sites, known as CpG
islands, at the promoters and first exons is a mechanism associated
with the development of cancer in mammals (5–7). CpG
islands are found in ~40% of mammalian promoters, particularly
housekeeping and tumor suppressor genes (8). Hypermethylation, which involves the
enzymatic addition of a methyl group to the fifth position of the
deoxycytidine residue in each affected CpG dinucleotide (6,7,9), leads to chromatin remodeling. This
results in gene silencing and has been associated with cancer
development through the inactivation of tumor suppressor genes
(10–16). Unlike DNA sequence alterations,
epigenetic modifications, such as DNA methylation, are dynamic and
reversible with proven therapeutic implications (17–19).
Furthermore, this method of deregulating functional pathways is
more straightforward and therefore more likely to be effective than
generating mutations or chromosomal aberrations (17). The genes most frequently reported as
being hypermethylated in MM include the cell cycle inhibitors
P15 and P16 (4,20,21),
suppressor of cytokine signaling 1 (SOCS-1) (22), E-cadherin, which promotes
cellular adhesion, and the tumor suppressor genes P73 and
Src homology region 2 domain-containing phosphatase 1
(SHP-1) (23). The expression
of specific genes has been restored in vitro through the
utilization of demethylating agents, including
5-aza-2′-deoxycytidine, 5-azacitidine and zelaburine (24,25).
However, an alternate epigenetic mechanism for promoting
tumorigenesis is possible. Global loss of DNA methylation occurs in
genomic regions containing repetitive elements and retrotranposons,
resulting in chromosomal instability, activation of transposable
elements and transcriptional activation of oncogenes (15). The aims of the current study were to
determine the promoter methylation status and expression levels of
the genes P16, SOCS-1, E-cadherin, P73
and SHP-1 in patients with MM at two different phases of the
disease, active and remission. In addition, the present study aimed
to determine the status of global DNA methylation and its
association with clinical outcome in these patients.
Materials and methods
Patients
A total of 43 patients, including 20 males and 23
females (age range, 36–87 years) were recruited from the Multiple
Myeloma Clinic at the Instituto Nacional de Ciencias Médicas y
Nutrición Salvador Zubirán (Mexico City, Mexico) between November
2006 and December 2012. At the time of analysis, median follow-up
time was 39 months (range, 5–89 months). Bone marrow samples were
obtained from each patient at two different phases of the disease:
Active (diagnosis or relapse) and remission; therefore, a total of
86 samples were collected. Patients were included if they had a
symptomatic MM diagnosis according to the International Myeloma
Working Group (IMWG) criteria (26).
Patients were excluded if they had a history of previous malignant
disease, a concomitant malignant disease or were currently
prescribed any demethylating agents. The response criteria used
were the standard IMWG Uniform Response Criteria (26). The present study was approved by the
Ethics Committee of the Instituto Nacional de Ciencias Médicas y
Nutrición Salvador Zubirán (Mexico City, Mexico) and was conducted
in accordance with the guidelines stipulated in the Declaration of
Helsinki. All enrolled patients signed an informed consent
form.
Cluster of differentiation (CD) 138+
purified plasma cells (PCs)
PCs were separated from bone marrow aspirate.
Centrifugation on a ficoll gradient (27) was used to isolate total lymphocytes
from the sample. Samples were centrifuged at 322 × g for 30 min at
room temperature. The lymphocytes were then incubated on ice for 30
min with CD138 magnetic beads (Miltenyi Biotec GmbH, Bergisch
Gladbach, Germany). Cells were separated on a LS+ MACs
column (Miltenyi Biotec GmbH) following incubation and eluted
according to the manufacturer's protocol.
Methylation-specific polymerase chain
reaction (MS-PCR)
Genomic DNA was extracted from PCs using the DNeasy
Blood & Tissue kit (Qiagen, Benelux B.V., Venlo, The
Netherlands) according to the supplier's protocol. Extracted DNA
was subjected to sodium bisulfite modification using an EpiTect
Bisulfite Modification kit (Qiagen, Benelux, B.V.) according to the
manufacturer's instructions. For each reaction, 1.5 µg DNA was
used. CpG methylated Jurkat genomic DNA (New England BioLabs Ltd.,
Ipswich, MA, USA) was used as the positive control and
5-Aza-dC-treated Jurkat Genomic DNA (New England BioLabs, Ltd.) was
used as the negative control. Bisulfite-modified DNA was amplified
using primer sets specific for unmethylated (U) and methylated (M)
sequences in each gene. The MS-PCR was carried out in a final
volume of 15 µl using 15 ng of bisulfite-modified DNA and 10 pmol
forward and reverse primers. The cycling conditions were: 95°C for
30 sec, 30 sec at the annealing temperature (Table I) and 72°C for 45 sec for 40
cycles.
 | Table I.Methylation specific primer sequences
and conditions. |
Table I.
Methylation specific primer sequences
and conditions.
| Gene | Primer
sequences | Annealing temp,
°C | Size, bp |
|---|
| E-cadh |
| M | For
5′-TTAGGTTAGAGGGTTATCGCGT-3′ | 56.3 | 116 |
|
| Rev
5′-TAACTAAAAATTCACCTACCGAC-3′ |
|
|
| U | For
5′-TAATTTTAGGTTAGAGGGTTATTGT-3′ | 56.3 | 97 |
|
| Rev
5′-CACAACCAATCAACAACACA-3′ |
|
|
| P73 |
| M | For
5′-TTAGGTTAGTCGGGACGGAC-3′ | 56.4 | 204 |
|
| Rev
5′-CCGAAAAAACCCCTATATCG-3′ |
|
|
| U | For
5′-AGGTTAGTTGGGATGGATGT-3′ | 56.4 | 206 |
|
| Rev
5′-AACTCCAAAAAAACCCCTATATCAC-3′ |
|
|
| P16INK4A |
| M | For
5′-TTGGTAGTTAGGAAGGTTGTATCGC-3′ | 60 | 126 |
|
| Rev
5′-TCCCTACTCCCAACCGCG-3′ |
|
|
| U | For
5′-GGTAGTTAGGAAGGTTGTATTGT-3′ | 60 | 124 |
|
| Rev
5′-TCCCTACTCCCAACCACA-3′ |
|
|
| SHP-1 |
| M | For
5′-TTTTGTTGATGTTTATTTCGACGT-3′ | 56 | 159 |
|
| Rev
5′-GAAAATCCTCACACCTTACGAA-3′ |
|
|
| U | For
5′-GTTTTGTTGATGTTTATTTTGATGT-3′ | 56 | 162 |
|
| Rev
5′-ACCAAAAATCCTCACACCTTACA-3′ |
|
|
| SOCS-1 |
| M | For
5′-GTTCGGTTTCGTTTAGTTTTCGAGG-3′ | 62 | 139 |
|
| Rev
5′-ACCCCGACCGACCGCGATCTC-3′ |
|
|
| U | For
5′-GTTTGGTTTTGTTTAGTTTTTGAGG-3′ | 62 | 139 |
|
| Rev
5′-ACCCCAACCAACCACAATCTC-3′ |
|
|
Primer sequences (Integrated DNA Technologies, Inc.,
Coralville, IA, USA) are presented in Table I. The resulting MS-PCR products
underwent electrophoresis on 3% agarose gels and were visualized
with ethidium bromide staining. Each PCR reaction contained a water
blank, a positive control and a negative control. A visible PCR
product using the U set primers indicated the presence of
unmethylated gene promoters and the presence of product using M set
primers indicated the presence of promoter methylation. Samples
that revealed no PCR product in either the unmethylated or
methylated reactions indicated that an insufficient quantity of DNA
was present in the sample following processing and sodium bisulfite
modification. Each of the PCR amplifications was repeated at least
once to confirm the result. The sensitivity of MS-PCR to detect
methylated alleles in a background of unmethylated alleles was
1:1,000 (28). The percentage of
methylation status for each gene at disease activity and remission
was calculated.
RNA preparation and reverse-transcription PCR
(RT-PCR). RNA was isolated from CD 138-enriched bone marrow cells
using the RNeasy Mini kit (Qiagen, Benelux, B.V.) according to the
manufacturer protocol. For cDNA synthesis, 1 µg RNA was reverse
transcribed in a 20-µl volume reaction mixture, using a
High-Capacity cDNA Reverse Transcription kit (Applied Biosystems;
Thermo Fisher Scientific, Inc., Waltham, MA, USA). Primer sequences
and conditions were as described in Table II. Each reaction was performed with
2 µl cDNA template in a 15 µl reaction mixture containing 7.5 µl 2X
HotStarTaq Plus PCR Master Mix (Qiagen, Benelux, B.V.) and 0.2 µM
each primer. The cycling conditions were 95°C for 30 sec; 30 sec at
the annealing temperature (Table
II) and 72°C at 45 sec for 40 cycles. The presence or absence
of the amplified sequence was visualized using 3% agarose gel
electrophoresis stained with ethidium bromide and examined under UV
light. β-actin mRNA expression in each sample demonstrated the
integrity of the target transcript of interest. PCR performed with
DNA of the same patient or in the absence of cDNA, as controls,
yielded negative results.
| Table II.Reverse transcription polymerase
chain reaction primer sequences and conditions. |
Table II.
Reverse transcription polymerase
chain reaction primer sequences and conditions.
| Gene | Primer
sequences | Annealing Temp,
°C | Size, bp |
|---|
| β-actin | For
5′-GCTCGTCGTCGACAACGGCTC-3′ | 60.2 | 353 |
|
| Rev
5′-CAAACATGATCTGGGTCATCTTCTC-3′ |
|
|
| E-cadh | For
5′-GGTCTGTCATGGAAGGTGCTC-3′ | 61.5 | 124 |
|
| Rev
5′-CAGGATCTTGGCTGAGGATGG-3′ |
|
|
| P73 | For
5′-CCACGAGCCTACCATGCTTTAC-3′ | 56.5 | 314 |
|
| Rev
5′-GGCACTGCTGAGCAAATTGA-3′ |
|
|
| P16INK4A | For
5′-GGGGGCACCAGAGGCAGT-3′ | 63.1 | 159 |
|
| Rev
5′-GGTTGTGGCGGGGGCAGTT-3′ |
|
|
| SHP-1 | For
5′-CGAGGTGTCCACGGTAGCTT-3′ | 61.0 | 139 |
|
| Rev
5′-CCCCTCCATACAGGTCATAGAAAT-3′ |
|
|
| SOCS-1 | For
5′-CAGGTGGCAGCCGACAATGC-3′ | 64.3 | 52 |
|
| Rev
5′-CCGCCGTCGGGGCTCTG-3′ |
|
|
Global methylation
Global DNA methylation levels were measured using an
ELISA kit (Methylamp Global DNA Methylation Quantification Ultra
kit; P-1014B-96; Epigentek, Inc., Farmingdale, NY, USA). A total of
1 µl DNA at a concentration of 100-ng/ml was added to strip wells
that were specifically treated to have a high DNA affinity. Samples
were incubated at 37°C for 90 min followed by the introduction of
capture and detection monoclonal antibodies against
5-methylcytosine (5-mC) and 5-hydroxymethylcytosine, which were
provided with the kit. The absorbance was read at 450 nm. Paired
samples (active/remission) from each patient were analyzed
simultaneously on the same plate in neighboring positions to
decrease the possibility of experimental variance and each sample
was run in duplicate. A standard curve was generated from the plot
of optical density (OD) values vs. the quantity of positive control
[methylated polynucleotide containing 50% 5-mC at each
concentration point] using Excel 2013 version 15.0 (Microsoft
Corporation, Redmond, WA, USA) and used to quantify the percentage
of methylated DNA 5-mC in each total DNA sample. Results were
considered to be hypomethylated if they were below the median for
all samples. The percentage of DNA hypomethylation in disease
activity and remission was calculated. The associations of global
methylation between groups were calculated by Spearman's
correlation coefficient.
Statistical analysis
Continuous variables were presented as medians and
ranges; categorical variables were presented as frequencies and
proportions. Fisher's exact test was used to estimate statistical
significance between proportions. The mean was analyzed by
independent-sample t-test. Gene methylation status and expression
were compared for the same subject in active and remission states
using the McNemar paired χ2 test. In addition, continuous variables
measured in active vs. remission or with vs. without methylation
were compared with the paired t-test. Survival analysis was
performed using the Kaplan-Meier procedure. Survival-related
prognostic factors were analyzed with the Cox proportional hazards
regression model. Associations of global methylation between groups
were evaluated by Spearman's correlation coefficient. OS was
calculated from the time of diagnosis until mortality or the last
date in which it was ascertained that the patient was alive.
Progression-free survival (PFS) was calculated from the time of
treatment initiation to the date of progression or relapse.
P<0.05 was considered to indicate a statistically significant
difference. Data were analyzed using SPSS version 21.0 software
(IBM SPSS, Inc., Armonk, NY, USA).
Results
Patient demographics and clinical
features
Of the 43 patients enrolled in the present study, 28
(65%) were diagnosed when the first sample was taken. At the time
of the analysis, median follow-up time was 39 months (range; 5–89
months). Demographic and clinical characteristics were similar to
other reported MM series (29,30),
with the exception of a slight increase in the frequency of the
light chain myeloma sub-type. Most patients at diagnosis were at an
advanced stage of the disease, with 72.5% in categories II and III
of the International Staging System (ISS; Table III) (31).
| Table III.Baseline characteristics of the
patients. |
Table III.
Baseline characteristics of the
patients.
|
Characteristics | Descriptive
statistics |
|---|
| Age, years: Median
(range) | 60 (36–87) |
| Male gender: no.
(%) | 20 (46.5) |
| Durie-Salmon Stage:
no. (%) |
|
| I | 3 (7.1) |
| II | 4 (9.5) |
|
III | 35 (83.3) |
| ISS: no. (%) |
|
| I | 11 (27.5) |
| II | 13 (32.5) |
|
III | 16 (40) |
| Type of myeloma:
no. (%) |
|
|
IgG | 16 (47.1) |
|
IgA | 10 (29.4) |
| Light
chain | 7 (20.6) |
|
Biclonal | 1 (2.9) |
| Hemoglobin |
|
| Median
(range) g/dl | 11.5
(6.2–15.2) |
| Creatinine |
|
| Median
(range) mg/dl | 9.4 (4.8–8.8) |
| Calcium |
|
| Median
(range) mg/dl | 9.1 (9–13.6) |
| Lytic lesions: no.
(%) | 32 (74.4) |
| Plasmacytoma: no.
(%) | 18 (41.9) |
|
Osseous: no. (%) | 9 (21.4) |
|
Extramedullar: no. (%) | 9 (20.9) |
Treatment and clinical response
Various treatments were received by the patients
included in the current study. Of the 43 patients, 20 (46.5%)
received a combination based on alkylating agents [0.25 mg/kg
melphalan (Alkeran; GlaxoSmithKline plc, Brentford, UK) and 100 mg
prednisone daily for four days every four weeks, or 900 mg/m2
cyclophosphamide intravenously on day 1 and 40 mg dexamethasone
orally on days 1–4, 9–12 and 17–20 every 4 weeks], 12 (27.9%)
received a combination that included thalidomide [0.25 mg/kg
melphalan and 100 mg prednisone daily for four days every four
weeks plus 100 mg daily thalidomide (Talizer; Serral Laboratories;
SOMAR, Mexico City, Mexico) or 100 mg thalidomide daily plus 40 mg
dexamethasone on days 1–4, 9–12 and 17–20 every four weeks), 7
(16.3%) received a combination with bortezomib [1.5 mg/m2
bortezomib (Velcade; Janssen Pharmaceutica, Beerse, Belgium)
subcutaneously on days 1, 8, 15 and 22, 300 mg/m2 cyclophosphamide
intravenously on days 1, 8, 15 and 22, and 40 mg dexamethasone
orally on days 1–4, 9–12 and 17–20 for two cycles and 40 mg on days
1, 8, 15 and 22 thereafter], 2 (4.7%) received an infusional
polychemotherapy (400 mg/m2 cyclophosphamide daily, 15 mg/m2
cisplatin daily and 40 mg/m2 etoposide daily as a 24 h infusion,
with all three drugs administered on days 1–4; plus 40 mg
dexamethasone intravenously daily on days 1–4) and 2 (4.7%) did not
receive any treatment. The clinical responses were as follows: 9
patients (20.9%) achieved complete response (alkylating agents,
n=4; thalidomide, n=5), 16 (37.2%) achieved partial response
(alkylating agents, n=7; thalidomide, n=5; bortezomib, n=3;
infusional polychemotherapy, n=1), 9 (20.9%) achieved very good
partial response (alkylating agents, n=4; thalidomide, n=2;
bortezomib, n=2; infusional polychemotherapy, n=1), 3 (7%)
exhibited stable disease (alkylating agents, n=2; bortezomib, n=1),
and 4 (9.3%) suffered progressive disease (alkylating agents, n=3;
bortezomib, n=1). Clinical response was not evaluated in the two
patients (4.7%) who did not receive treatment.
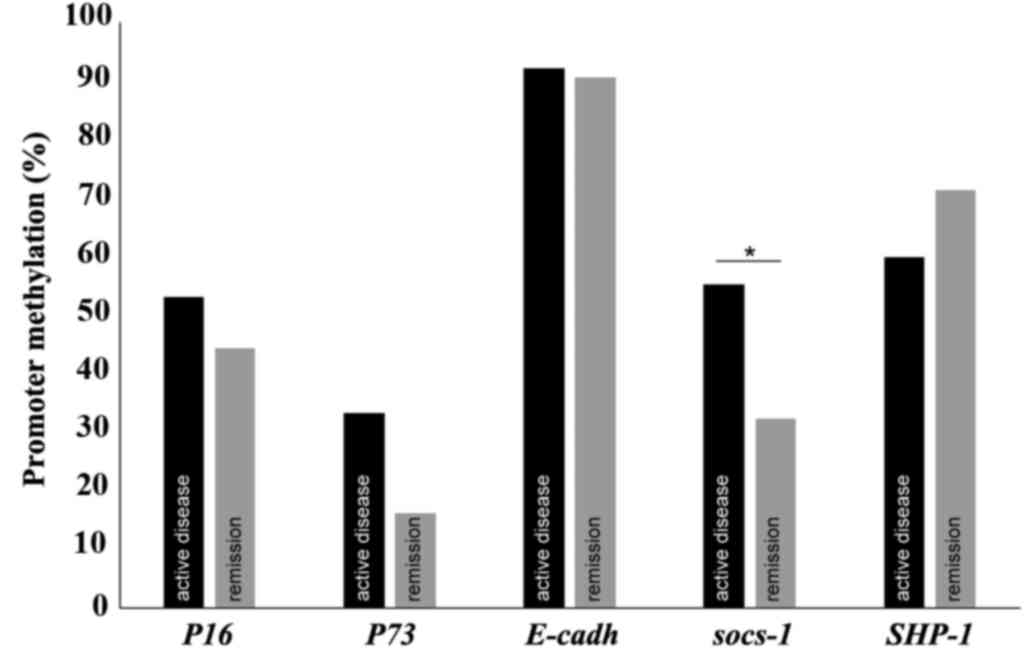
Methylation status of the promoters
and expression of the genes P16, SOCS-1, E-cadherin, p73 and
SHP-1
Methylation status of the promoters and expression
of the genes being assessed during active disease and remission
were compared. The percentage of promoter methylation for each gene
at the two time points is presented in Fig. 1. The behavior of both measures at
these two different stages of the disease was similar with the
exception of the methylation status of SOCS-1. For 9
patients (29%), SOCS-1 was methylated during active disease
but not in remission, and in 1 patient (3.2%) SOCS-1 was
methylated in remission but not during active disease (P=0.021).
The methylation status of the promoters of the genes was not
correlated with their expression (P>0.05). The number of samples
tested and the percentage of methylation for each gene are
indicated in Table IV.
| Table IV.Percentage of patients with
methylated genes and expressed in activity and remission. |
Table IV.
Percentage of patients with
methylated genes and expressed in activity and remission.
| Gene | Methylated in
activity | Methylated in
remission | Expressed in
activity | Expressed in
remission |
|---|
|
| n
(%) | n
(%) | n (%) | n (%) |
| P16 | 17 (53) | 12 (44) | 13 (54) | 8 (42) |
| P73 | 13 (33) | 5
(16) | 8 (38) | 1 (6) |
| E-cadh | 36 (92) | 29 (91) | 9 (60) | 10 (71) |
| SOCS-1 | 21 (55) | 10 (32) | 21 (100) | 18 (100) |
| SHP-1 | 24 (60) | 25 (71) | 12 (80) | 10 (71) |
Association of clinical variables with
gene methylation or expression status
Amyloidosis was present in 4 patients (16.67%)
without P16 expression during the active disease phase, but
in none of the patients expressing P16 during the active
phase (P=0.031). Differences in promoter methylation status of
P16 and SOCS-1 were observed with regard to ISS
grade. The percentage of patients with methylated P16 at
remission increased according to severity grade: ISS I, 0 patients
(0%); ISS II, 5 patients (20%); and ISS III, 6 patients (24%)
(P=0.027). In addition, the percentage of patients exhibiting
methylated SOCS-1 during advanced stage active disease, ISS
III, was 6 patients (16.67%), double that of those at an early
stage: ISS I, 3 patients (8.33%; P=0.037). The probability of
survival until the time of data analysis was associated with the
methylation status of P16: Unmethylated P16, 8
patients (29.6%); and methylated P16, 2 patients (7.41%;
P=0.058). The median OS of the group with methylated and
unmethylated P16 was 23 vs. 34 months, respectively
(P=0.04), and the median PFS was 21 vs. 36 months, respectively
(P=0.003). SHP-1 methylation during active disease was
associated with a lower probability of survival at 39-month follow
up, with a median of 52.5 vs. 87.5% (P=0.025). Methylation status
did not affect gene expression.
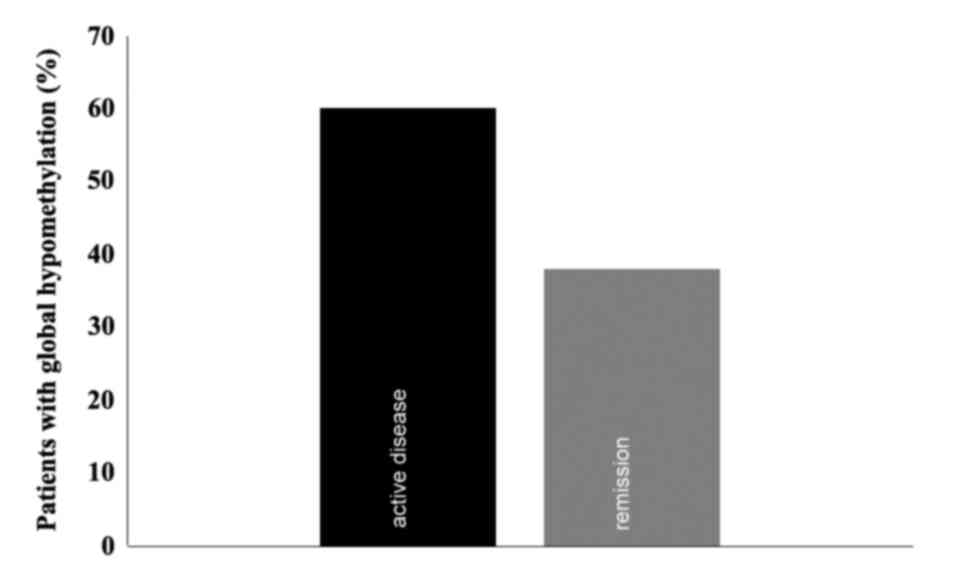
Global methylation
A Global methylation assay was conducted in patients
with available DNA once the MS-PCR assays were concluded (n=15).
The mean percentages of global methylation during active disease
and remission were 14.26 and 13.83% respectively, with standard
deviations of 21.48 [95% confidence interval (CI), 2.814–25.713]
and 10.72 (95% CI, 8.115–19.549), respectively, which were not
significantly different. The median of global methylation was 8.78%
(range; 0.41–88.34%; Fig. 2). There
was a trend towards a moderate positive correlation between both
variables, with a Spearman's relation coefficient of 0.494
(P=0.051).
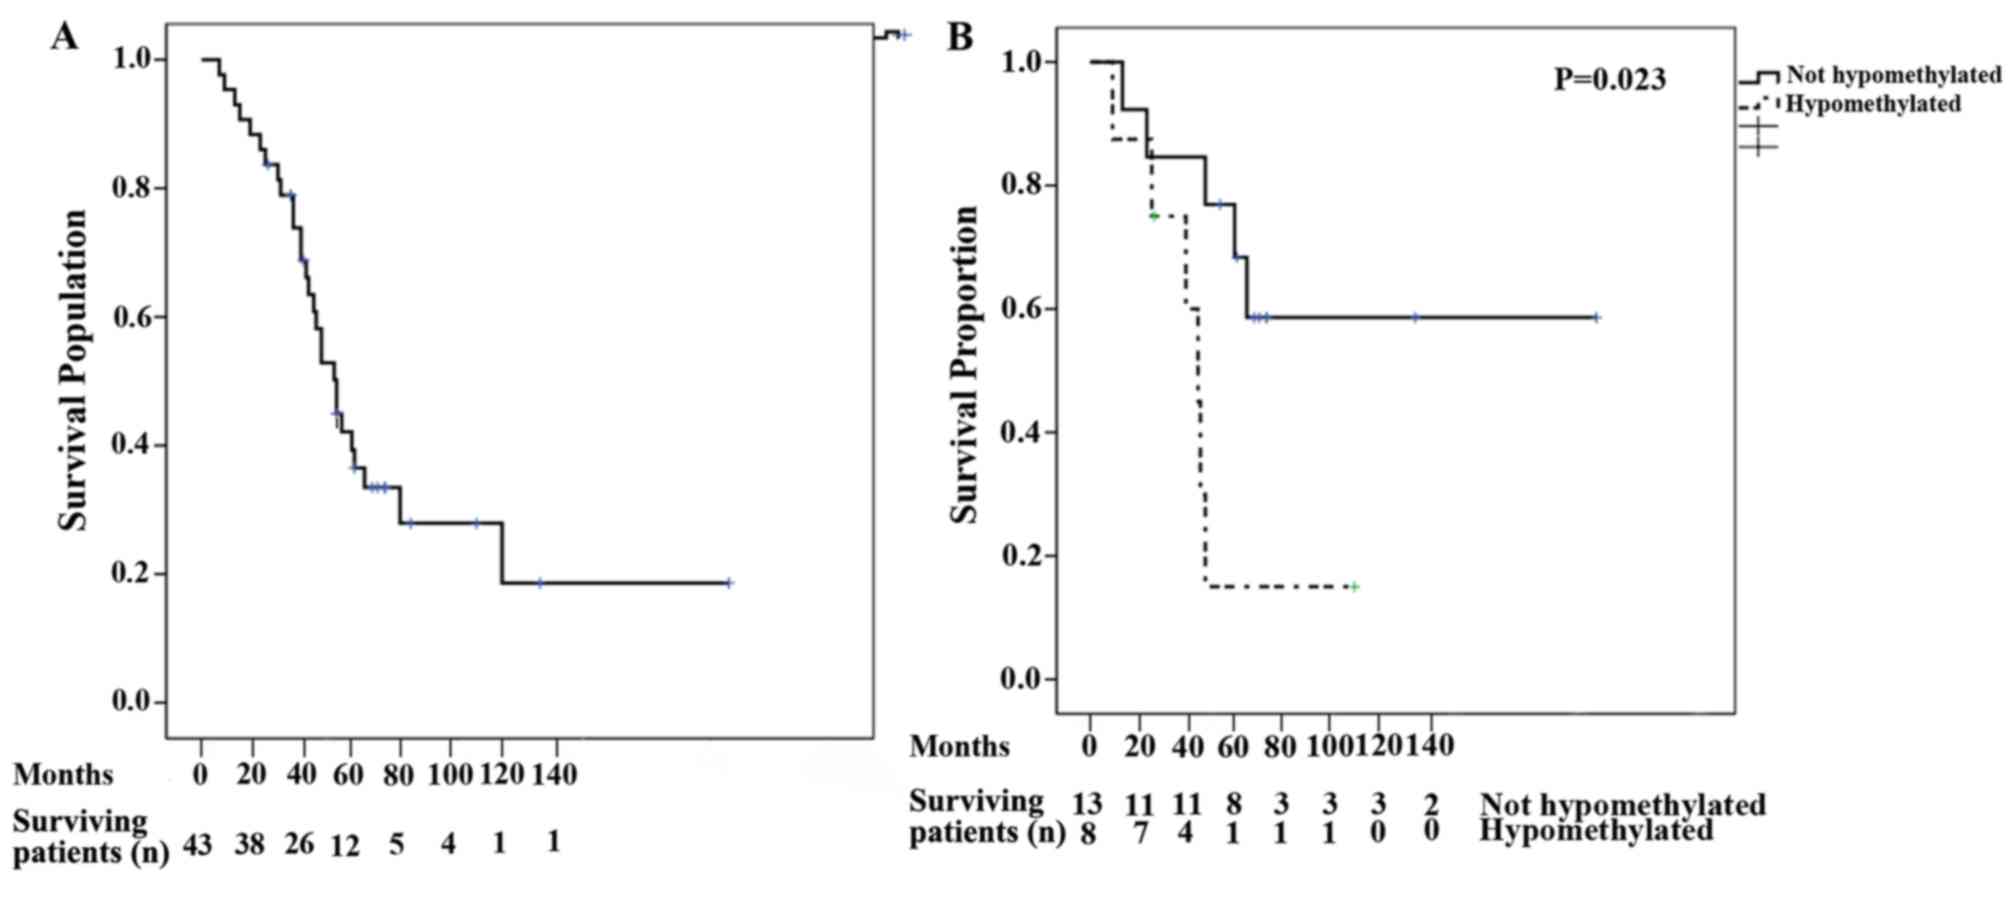
Patient survival measures
The median OS for all patients was 53 months (95%
CI, 43.55–62.44; Fig. 3A). Following
univariate analysis, the variables that were identified as relevant
for OS included the presence of hypercalcemia, lytic bone lesions
and global hypomethylation at remission (Table V). Following multivariate analysis
for OS, global hypomethylation at remission remained significant
(P=0.013; Fig. 3B). The median PFS
was 19 months (95% CI, 9.94–28.06). Following univariate analysis,
the variables identified to be relevant for PFS were hemoglobin,
lactate dehydrogenase, presence of lytic bone lesions and global
hypomethylation at remission. However, multivariate analysis for
PFS indicated that none of the variables were significant (Table V).
| Table V.Univariate and multivariate analyses
of variables associated with overall and progression free
survival. |
Table V.
Univariate and multivariate analyses
of variables associated with overall and progression free
survival.
|
| Univariate | Multivariate |
|---|
|
|
|
|
|---|
| Variable | HR | 95% CI | P-value | HR | 95% CI | P-value |
|---|
| Overall
survival |
|
Hypercalcemia | 1.322 | 1.020–1.020 | 0.035a | 0.952 | 0.593–1.593 | 0.838 |
| Lytic
bone lesions | 3.285 | 1.135–9.135 | 0.028a | 5.992 | 0.837–42.837 | 0.075 |
| Global
hypomethylation at remission | 3.866 | 1.117–13.117 | 0.033a | 12.873 | 1.730–95.730 | 0.013a |
| Progression free
survival |
|
Hemoglobin | 0.837 | 0.722–0.722 | 0.018a | 0.995 | 0.563–1.563 | 0.985 |
| Lactate
dehydrogenase | 1.006 | 1.001–1.001 | 0.013a | 1.017 | 0.961–1.961 | 0.557 |
| Lytic
bone lesions | 4.795 | 1.373–16.373 | 0.014a | 0.667 | 0.044–9.044 | 0.769 |
| Global
hypomethylation at remission | 9.066 | 1.692–48.692 | 0.010a | 7.258 | 0.255–206.255 | 0.246 |
Discussion
To the best of our knowledge, the present study is
the first cohort of patients with MM utilized to study regional and
global methylation during the active and remission disease phases.
In the present study, genes previously reported to exhibit
hypermethylation in MM were evaluated (32,33).
Overall, the results indicated that the methylation status of the
promoters for the genes tested had no impact on the expression of
these genes. However, the MS-PCR protocol utilized is only capable
of analyzing two CpG sites at the 3′ ends of each of the two PCR
primers, with the risk of involving noncrucial regions of the
promoter essential for transcription (34). The methylation of different regions
in a promoter have distinct potentials for suppressing promoter
activity; therefore, certain sites may be more informative at
predicting expression changes through direct functional interaction
(35). SOCS-1 methylation was
notably higher during active disease than at remission (29 vs.
3.2%). A higher proportion of SOCS-1 methylation was
observed in patients diagnosed with advanced stage MM at
presentation (ISS III). By contrast, Depil et al (36) studied the methylation status of
SOCS-1 in 51 untreated MM patients and identified
hypermethylation of SOCS-1 in 74.5% of patients, with no
influence on the clinical staging. SOCS-1 is able to
suppress the signaling of different cytokines including interleukin
6, an important B-cell growth factor essential for differentiation
into plasma cells and the survival rate of MM cells (37,38). It
has been identified that there is an association between
hypermethylation of SOCS-1 and the pathogenesis of different
tumors, including chronic myeloid leukemia, human melanoma and
gastric cancer (39–41). A previous study by Galm et al
(22), demonstrated that in patients
with MM exhibiting active disease, 62% exhibited SOCS-1
hypermethylation. By contrast, this frequency was markedly lower in
patients with lymphoma (3.2%). Additionally, no methylation of
SOCS-1 was observed in normal peripheral blood mononuclear
cells or nonmalignant bone marrow cells. Furthermore, the present
study identified that P16 hypermethylation at remission
occurred more frequently in patients with advanced disease (higher
ISS grade) and indicated a trend toward patient mortality by the
study cut-off point. Both results point to more aggressive behavior
of the disease in patients with P16 hypermethylation.
P16, an inhibitor of cyclin dependent kinase 4, negatively
regulates cell proliferation, which suggests that it exerts tumor
suppressor behavior. A previous study by Mateos et al
(41) assessed the methylation
status of P16 in a cohort of patients with MM and revealed
that hypermethylation of P16 was correlated with deleterious
prognosis features including high β2-microglobulin and high
C-reactive protein values, advanced stage of disease according to
the Durie-Salmon staging system and a high proliferation rate of
plasma cells. The same study showed that none of the patients at
stage I (Durie-Salmon) exhibited hypermethylation of P16
(41). The present study suggested
that P16 hypermethylation negatively affected OS and PFS.
However, when the high proliferation rate of PCs was incorporated
into the multivariate analysis, P16 hypermethylation lost
its predictive value of both endpoints, implying an association
between these variables. Guillerm et al (42) reported an association between
methylated P16 and OS (P=0.035; relative risk, 2.86,
1.076–7.60) and high β2-microglobulin (P=0.003; relative risk,
1.18, 1.08–1.3). By contrast, Gonzalez-Paz et al (3) did not identify any clinical or
biological differences in patients with MM according to P16
methylation status with the exception of a higher frequency of
P17 deletion in the P16 hypermethylated group (65%
vs. 35%, P=0.003) and a trend in PFS in favor of the unmethylated
group (median 30.2 vs. 27.4 months, P=0.71).
Ribas et al (43) failed to detect a correlation between
P16 methylation and prognostic factors. P16
hypermethylation has been associated with progression of the
disease, as the frequency of this phenomena increases as the
disease progresses through its different stages of evolution,
beginning at 0% at the preclinical phase or monoclonal gammopathy
of undetermined significance, at 0% for the asymptomatic phase, and
to 41.8% for symptomatic MM and 80% for plasma cell leukemia
(3,4,20,21). In
the current study, the probability of patients succumbing prior to
the time of analysis was 56.2% (7 patients) if SHP-1 was not
methylated during the active disease, whereas 12.5% (5 patients) of
patients remained alive if SHP-1 was methylated at this
point (P=0.025). SHP-1 encodes a member of the protein
tyrosine phosphatase (PTP) family (44). PTPs oppose the effects of protein
tyrosine kinases and maintain the overall homeostasis of protein
tyrosine phosphorylation. It has been identified that PTPs
dephosphorylate and thus inactivate Janus kinase/Signal transducer
and activator of transcription 3 (STAT3) signaling. They regulate a
variety of cellular processes including cell growth,
differentiation, oncogenic transformation and the mitotic cycle.
SHP-1 is expressed in normal lymphoid cells, but is lost in
a number of types of hematologic malignancies due to epigenetic
silencing (45,46). It has been demonstrated that loss of
SHP-1 directly contributes to the constitutive activation of
STAT3 in MM, chronic myeloid leukemia and anaplastic lymphoma
kinase-positive anaplastic large cell lymphoma (47). In the current study, the median OS
was 53 months (95% CI, 43.5–62.4). Following univariate analysis,
hypercalcemia, presence of lytic bone lesions and global
hypomethylation at remission were determined to have a negative
impact on OS. The presence of lytic bone lesions implies a more
advanced disease at the time of diagnosis. Global hypomethylation
at remission remained a negative predictor for OS upon multivariate
analysis. This raises the question of whether patients with global
hypomethylation at remission should receive more treatment than
patients without global hypomethylation. The assay was a
commercially available ELISA, an inexpensive and widely used
technique; therefore, prospective trials to measure methylation
levels could readily be performed. In support of this possibility,
Fernández de Larrea et al (48) reported the impact of global
methylation in relapsed patients with MM treated with bortezomib.
The study revealed that patients with >3.95% global DNA
methylation achieved an improved OS compared with lower levels of
hypomethylation (median; 30 vs. 15 months, P=0.004) (48).
Finally, it is important to emphasize that the OS
and PFS of the patients in the current study were lower than
expected according to those reported in other studies. These
unsatisfactory outcomes may be due to limited access to expensive
drugs (49–53). In this cohort, only 16% of the
patients were able to receive bortezomib and none received
lenalidomide.
To the best of our knowledge, the present study was
the first to investigate the impact of regional methylation and
global methylation in patients with MM over time in active and
remission disease states. The number of patients included in the
global methylation analysis was the primary limitation of the
present study.
In conclusion, methylated P16, SOCS-1
and SHP-1 are associated with clinical variables that
negatively impact prognosis, along with the persistence of global
hypomethylation at remission.
Acknowledgements
The authors would like to thank Dr Sergio Ponce de
Leon for expert assistance with the statistical analysis. Déborah
Martínez-Baños is a doctoral student from Programa de Doctorado en
Ciencias Biomédicas, Universidad Nacional Autónoma de México (UNAM)
and received a fellowship (SALUD-2007-C01-69695) from CONACYT that
supported the present study.
References
|
1
|
Kyle RA and Rajkumar SV: Treatment of
multiple myeloma: A comprehensive review. Clin Lymphoma Myeloma.
9:278–288. 2009. View Article : Google Scholar : PubMed/NCBI
|
|
2
|
Sonneveld P and Broijl A: Treatment of
relapsed and refractory multiple myeloma. Haematologica.
101:396–406. 2016. View Article : Google Scholar : PubMed/NCBI
|
|
3
|
Gonzalez-Paz N, Chng WJ, McClure RF, Blood
E, Oken MM, Van Ness B, James CD, Kurtin PJ, Henderson K, Ahmann
GJ, et al: Tumor suppressor p16 methylation in multiple myeloma:
Biological and clinical implications. Blood. 109:1228–1232. 2007.
View Article : Google Scholar : PubMed/NCBI
|
|
4
|
Mateos MV, García-Sanz R, López-Pérez R,
Moro MJ, Ocio E, Hernández J, Megido M, Caballero MD,
Fernández-Calvo J, Bárez A, et al: Methylation is an inactivating
mechanism of the p16 gene in multiple myeloma associated with high
plasma cell proliferation and short survival. Br J Haematol.
118:1034–1040. 2002. View Article : Google Scholar : PubMed/NCBI
|
|
5
|
Reik W, Dean W and Walter J: Epigenetic
reprogramming in mammalian development. Science. 293:1089–1093.
2001. View Article : Google Scholar : PubMed/NCBI
|
|
6
|
Baylin SB, Esteller M, Rountree MR,
Bachman KE, Schuebel K and Herman JG: Aberrant patterns of DNA
methylation, chromatin formation and gene expression in cancer. Hum
Mol Genet. 10:687–692. 2001. View Article : Google Scholar : PubMed/NCBI
|
|
7
|
Jones PL and Wolffe AP: Relationships
between chromatin organization and DNA methylation in determining
gene expression. Semin Cancer Biol. 9:339–347. 1999. View Article : Google Scholar : PubMed/NCBI
|
|
8
|
Fatemi M, Pao MM, Jeong S, Gal-Yam EN,
Egger G, Weisenberger DJ and Jones PA: Footprinting of mammalian
promoters: Use of a CpG DNA methyltransferase revealing nucleosome
positions at a single molecule level. Nucleic Acids Res.
33:e1762005. View Article : Google Scholar : PubMed/NCBI
|
|
9
|
Ahuja N and Issa JP: Aging, methylation
and cancer. Histol Histopathol. 15:835–842. 2000.PubMed/NCBI
|
|
10
|
Jones PA and Baylin SB: The epigenomics of
cancer. Cell. 128:683–692. 2007. View Article : Google Scholar : PubMed/NCBI
|
|
11
|
Berdasco M and Esteller M: Aberrant
epigenetic landscape in cancer: How cellular identity goes awry.
Dev Cell. 19:698–711. 2010. View Article : Google Scholar : PubMed/NCBI
|
|
12
|
Asmar F, Punj V, Christensen J, Pedersen
MT, Pedersen A, Nielsen AB, Hother C, Ralfkiaer U, Brown P,
Ralfkiaer E, et al: Genome-wide profiling identifies a DNA
methylation signature that associates with TET2 mutations in
diffuse large B-cell lymphoma. Haematologica. 98:1912–1920. 2013.
View Article : Google Scholar : PubMed/NCBI
|
|
13
|
Sandoval J, Mendez-Gonzalez J, Nadal E,
Chen G, Carmona FJ, Sayols S, Moran S, Heyn H, Vizoso M, Gomez A,
et al: A prognostic DNA methylation signature for stage I
non-small-cell lung cancer. J Clin Oncol. 31:4140–4147. 2013.
View Article : Google Scholar : PubMed/NCBI
|
|
14
|
Esteller M: Cancer epigenomics: DNA
methylomes and histone-modification maps. Nat Rev Genet. 8:286–298.
2007. View
Article : Google Scholar : PubMed/NCBI
|
|
15
|
Portela A and Esteller M: Epigenetic
modifications and human disease. Nat Biotechnol. 28:1057–1068.
2010. View
Article : Google Scholar : PubMed/NCBI
|
|
16
|
Shen L, Kondo Y, Guo Y, Zhang J, Zhang L,
Ahmed S, Shu J, Chen X, Waterland RA and Issa JP: Genome-wide
profiling of DNA methylation reveals a class of normally methylated
CpG island promoters. PLoS Genet. 3:2023–2036. 2007. View Article : Google Scholar : PubMed/NCBI
|
|
17
|
Issa JP and Kantarjian HM: Targeting DNA
methylation. Clin Cancer Res. 15:3938–3946. 2009. View Article : Google Scholar : PubMed/NCBI
|
|
18
|
Lee ES, Issa JP, Roberts DB, Williams MD,
Weber RS, Kies MS and El-Naggar AK: Quantitative promoter
hypermethylation analysis of cancer-related genes in salivary gland
carcinomas: Comparison with methylation-specific PCR technique and
clinical significance. Clin Cancer Res. 14:2664–2672. 2008.
View Article : Google Scholar : PubMed/NCBI
|
|
19
|
Li H, Chiappinelli KB, Guzzetta AA,
Easwaran H, Yen RW, Vatapalli R, Topper MJ, Luo J, Connolly RM,
Azad NS, et al: Immune regulation by low doses of the DNA
methyltransferase inhibitor 5-azacitidine in common human
epithelial cancers. Oncotarget. 5:587–598. 2014. View Article : Google Scholar : PubMed/NCBI
|
|
20
|
González M, Mateos MV, García-Sanz R,
Balanzategui A, López-Pérez R, Chillón MC, González D, Alaejos I
and Miguel San JF: De novo methylation of tumor suppressor gene
p16/INK4a is a frequent finding in multiple myeloma patients at
diagnosis. Leukemia. 14:183–187. 2000. View Article : Google Scholar : PubMed/NCBI
|
|
21
|
Krämer A, Schultheis B, Bergmann J, Willer
A, Hegenbart U, Ho AD, Goldschmidt H and Hehlmann R: Alterations of
the cyclin D1/pRb/p16(INK4A) pathway in multiple myeloma. Leukemia.
16:1844–1851. 2002. View Article : Google Scholar : PubMed/NCBI
|
|
22
|
Galm O, Yoshikawa H, Esteller M, Osieka R
and Herman JG: SOCS-1, a negative regulator of cytokine signaling,
is frequently silenced by methylation in multiple myeloma. Blood.
101:2784–2788. 2003. View Article : Google Scholar : PubMed/NCBI
|
|
23
|
Chim CS, Liang R, Leung MH, Yip SF and
Kwong YL: Aberrant gene promoter methylation marking disease
progression in multiple myeloma. Leukemia. 20:1190–1192. 2006.
View Article : Google Scholar : PubMed/NCBI
|
|
24
|
Amatori S, Bagaloni I, Donati B and
Fanelli M: DNA demethylating antineoplastic strategies: A
comparative point of view. Genes Cancer. 1:197–209. 2010.
View Article : Google Scholar : PubMed/NCBI
|
|
25
|
Flotho C, Claus R, Batz C, Schneider M,
Sandrock I, Ihde S, Plass C, Niemeyer CM and Lübbert M: The DNA
methyltransferase inhibitors azacitidine, decitabine and zebularine
exert differential effects on cancer gene expression in acute
myeloid leukemia cells. Leukemia. 23:1019–1028. 2009. View Article : Google Scholar : PubMed/NCBI
|
|
26
|
Durie BG, Harousseau JL, Miguel JS, Bladé
J, Barlogie B, Anderson K, Gertz M, Dimopoulos M, Westin J,
Sonneveld P, et al: International uniform response criteria for
multiple myeloma. Leukemia. 20:1467–1473. 2006. View Article : Google Scholar : PubMed/NCBI
|
|
27
|
Draube A, Pfister R, Vockerodt M, Schuster
S, Kube D, Diehl V and Tesch H: Immunomagnetic enrichment of CD138
positive cells from weakly infiltrated myeloma patients samples
enables the determination of the tumor clone specific IgH
rearrangement. Ann Hematol. 80:83–89. 2001. View Article : Google Scholar : PubMed/NCBI
|
|
28
|
Herman JG, Graff JR, Myöhänen S, Nelkin BD
and Baylin SB: Methylation-specific PCR: A novel PCR assay for
methylation status of CpG islands. Proc Natl Acad Sci USA.
93:9821–9826. 1996. View Article : Google Scholar : PubMed/NCBI
|
|
29
|
Miguel San J, Schlag R, Khuageva N,
Dimopoulos M, Schpilberg O, Kropff M, Spicka I, Petrucci M, Palumbo
A, Samoilova O, et al: Bortezomib plus melphalan and prednisone for
initial treatment of multiple myeloma. N Engl J Med. 359:906–917.
2008. View Article : Google Scholar : PubMed/NCBI
|
|
30
|
Richardson PG, Sonneveld P, Schuster MW,
Irwin D, Stadtmauer EA, Facon T, Harousseau JL, Ben-Yehuda D,
Lonial S, Goldschmidt H, et al: Bortezomib or high-dose
dexamethasone for relapsed multiple myeloma. N Eng J Med.
352:2487–2498. 2005. View Article : Google Scholar
|
|
31
|
Greipp PR, Miguel San J, Durie BG, Crowley
JJ, Barlogie B, Bladé J, Boccadoro M, Child JA, Avet-Loiseau H,
Kyle RA, et al: International staging system for multiple myeloma.
J Clin Oncol. 23:3412–3420. 2005. View Article : Google Scholar : PubMed/NCBI
|
|
32
|
Guillerm G, Depil S, Wolowiec D and
Quesnel B: Different prognostic values of p15(INK4b) and p16(INK4a)
gene methylations in multiple myeloma. Haematologica. 88:476–478.
2003.PubMed/NCBI
|
|
33
|
Galm O, Wilop S, Reichelt J, Jost E,
Gehbauer G, Herman JG and Osieka R: DNA methylation changes in
multiple myeloma. Leukemia. 18:1687–1692. 2004. View Article : Google Scholar : PubMed/NCBI
|
|
34
|
Deng G, Chen A, Hong J, Chae HS and Kim
YS: Methylation of CpG in a small region of the hMLH1 promoter
invariably correlates with the absence of gene expression. Cancer
Res. 59:2029–2033. 1999.PubMed/NCBI
|
|
35
|
Deng G, Chen A, Pong E and Kim YS:
Methylation in hMLH1 promoter interferes with its binding to
transcription factor CBF and inhibits gene expression. Oncogene.
20:7120–7127. 2001. View Article : Google Scholar : PubMed/NCBI
|
|
36
|
Depil S, Saudemont A and Quesnel B: SOCS-1
gene methylation is frequent but does not appear to have prognostic
value in patients with multiple myeloma. Leukemia. 17:1678–1679.
2003. View Article : Google Scholar : PubMed/NCBI
|
|
37
|
Kyle RA and Rajkumar SV: Multiple myeloma.
N Engl J Med. 351:1860–1873. 2004. View Article : Google Scholar : PubMed/NCBI
|
|
38
|
Roman-Gomez J, Jimenez-Velasco A,
Castillejo JA, Cervantes F, Barrios M, Colomer D, Heininger A and
Torres A: The suppressor of cytokine signaling-1 is constitutively
expressed in chronic myeloid leukemia and correlates with poor
cytogenetic response to interferon-alpha. Haematologica. 89:42–48.
2004.PubMed/NCBI
|
|
39
|
Li Z, Metze D, Nashan D, Müller-Tidow C,
Serve HL, Poremba C, Luger TA and Böhm M: Expression of SOCS-1,
suppressor of cytokine signalling-1, in human melanoma. J Invest
Dermatol. 123:737–745. 2004. View Article : Google Scholar : PubMed/NCBI
|
|
40
|
Qu Y, Dang S and Hou P: Gene methylation
in gastric cancer. Clin Chim Acta. 424:53–65. 2013. View Article : Google Scholar : PubMed/NCBI
|
|
41
|
Mateos MV, Garcia-Sanz R, López-Pérez R,
Balanzategui A, González MI, Fernández-Calvo J, Moro MJ, Hernández
J, Caballero MD, González M and Miguel San JF: p16/INK4a gene
inactivation by hypermethylation is associated with aggressive
variants of monoclonal gammopathies. Hematol J. 2:146–149. 2001.
View Article : Google Scholar : PubMed/NCBI
|
|
42
|
Guillerm G, Depil S, Wolowiec D and
Quesnel B: Different prognostic values of p15 (INK4b) and p16
(INK4a) gene methylations in multiple myeloma. Haematologica.
88:476–478. 2003.PubMed/NCBI
|
|
43
|
Ribas C, Colleoni GW, Felix RS, Silva
Regis MR, Caballero OL, Brait M and Bordin JO: p16 gene methylation
lacks correlation with angiogenesis and prognosis in multiple
myeloma. Cancer Lett. 26:247–254. 2005. View Article : Google Scholar
|
|
44
|
Chim CS, Fung TK, Cheung WC, Liang R and
Kwong YL: SOCS1 and SHP1 hypermethylation in multiple myeloma:
Implications for epigenetic activation of the Jak/STAT pathway.
Blood. 103:46302004. View Article : Google Scholar : PubMed/NCBI
|
|
45
|
Esposito N, Colavita I, Quintarelli C,
Rodeo A, AL Peluso Luciano L, Picardi M, Vecchio L, Buonomo T and
Hughes T: SHP-1 expression accounts for resistance to imatinib
treatment in Philadelphia chromosome-positive cells derived from
patients with chronic myeloid leukemia.
|
|
46
|
Valentino L and Pierre J: JAK/STAT signal
transduction: Regulators and implications in hematological
malignancies. Biochem Pharmacol. 71:713–721. 2006. View Article : Google Scholar : PubMed/NCBI
|
|
47
|
Zhang HF and Lai R: STAT3 in cancer-friend
or Foe? Cancers (Basel). 6:1408–1440. 2004. View Article : Google Scholar
|
|
48
|
de Fernández Larrea C, Martín-Antonio B,
Cibeira MT, Navarro A, Tovar N, Díaz T, Rosiñol L, Monzó M,
Urbano-Ispizua A and Bladé J: Impact of global and gene-specific
DNA methylation pattern in relapsed multiple myeloma patients
treated with bortezomib. Leuk Res. 37:641–646. 2013. View Article : Google Scholar : PubMed/NCBI
|
|
49
|
Homedes N and Ugalde A: Availability and
affordability of new medicines in Latin American countries where
pivotal clinical trials were conducted. Bull World Health Organ.
93:674–683. 2015. View Article : Google Scholar : PubMed/NCBI
|
|
50
|
Pichon-Riviere A, Garay OU, Augustovski F,
Vallejos C, Huayanay L, Mdel Bueno P, Rodriguez A, de Andrade CJ,
Buendía JA and Drummond M: Implications of global pricing policies
on access to innovative drugs: The case of trastuzumab in seven
Latin American countries. Int J Technol Assess Health Care.
31:2–11. 2015. View Article : Google Scholar : PubMed/NCBI
|
|
51
|
Goss PE, Lee BL, Badovinac-Crnjevic T,
Strasser-Weippl K, Chavarri-Guerra Y, St Louis J, Villarreal-Garza
C, Unger-Saldaña K, Ferreyra M, Debiasi M, et al: Planning cancer
control in Latin America and the Caribbean. Lancet Oncol.
14:391–436. 2013. View Article : Google Scholar : PubMed/NCBI
|
|
52
|
Amador-Medina LF, Lacayo-Leñero D,
Crespo-Solís E, Aguayo Á and Martínez-Baños D: Thalidomide and
dexamethasone induction therapy until best response in recently
diagnosed patients with multiple myeloma: Results from a pilot
study. Rev Invest Clin. 67:304–312. 2015.PubMed/NCBI
|
|
53
|
Knaul FM, González-Pier E, Gómez-Dantés O,
García-Junco D, Arreola-Ornelas H, Barraza-Lloréns M, Sandoval R,
Caballero F, Hernández-Avila M, Juan M, et al: The quest for
universal health coverage: Achieving social protection for all in
Mexico. Lancet. 380:1259–1279. 2012. View Article : Google Scholar : PubMed/NCBI
|