Introduction
Portal hypertension is a progressive complication
secondary to intra-hepatic, pre-hepatic or post-hepatic etiologies
(1). Liver cirrhosis is the most
common intra-hepatic cause of portal hypertension and affects ~1%
of the worldwide population, primarily in Asia and Africa (1). Although portal hypertension is
associated with a series of complications, including ascites,
hepatic encephalopathy, hepatorenal syndrome and portal venous
thrombosis, the most acute and common gastrointestinal emergency is
gastroesophageal variceal rupture (2,3). The
prevalence of gastroesophageal varices is ~50% among patients with
cirrhosis at the time of diagnosis, with a higher prevalence
amongst Child-Pugh class B and C patients (3). Rupture or gastroesophageal hemorrhage
may lead to uncontrollable torrential hemorrhage, which is
associated with a high mortality rate of 15–30%-possibly higher in
developing countries (4). The
incidence of gastroesophageal varices is associated with the
hepatic venous pressure gradient (HVPG) (5). HVPG is an accurate reflection of
disease severity; however, measurement involves an invasive
interventional procedure that is not always readily available,
particularly in primary and hospitals (6). Patients with HVPG measurements ≥10 mmHg
are considered to have clinically significant portal hypertension
(CSPH) (7). HVPG is also used to
monitor prognostic and therapeutic indications. A decrease in HVPG
>20% from the baseline, or to ≤12 mmHg, is clinically
substantial (5–7). According to the Baveno VI Consensus
Workshop, CSPH is predictive of gastroesophageal varices and
decompensation, which requires a prompt primary prophylactic
treatment with either non-selective beta-blockers or endoscopic
therapy (7). Various alternative
non-invasive techniques have been explored, including non-invasive
biomarkers, Doppler sonography, transient elastography, computed
tomography (CT) and magnetic resonance imaging, in an attempt to
accurately predict HVPG and the risk of gastroesophageal variceal
hemorrhage in patients with portal hypertension (5,6,8). However, the assessment of portal
hypertension is HVPG-driven and, at present, does not have a
non-invasive equivalent (9). The aim
of the present study was to explore the potential of liver and
spleen volume values calculated using 3D CT-rendering technology to
provide an accurate diagnosis of HVPG. The improved availability of
clinically significant data would allow for prompt primary
prophylaxis intervention, which may result in lower mortality and
morbidity rates in patients with decompensated cirrhosis.
Patients and methods
Study population
A total of 161 patients diagnosed with cirrhosis of
varying etiologies underwent HVPG examination at Zhongshan
Hospital, Fudan University (Shanghai, China), a tertiary medical
center, between March 2013 and August 2015. A diagnosis of
cirrhosis was made according a series of physical [presence of
liver palm, spider angioma, hepatic encephalopathy based on
clinical symptoms, including cognitive dysfunction, asterixis and
increased ammonia level levels (18–72 µmol/l)] (10), laboratory [complete blood count:
Hemoglobin (115–150 g/l), platelet (125–350×109/l) liver
function: total bilirubin (3.4–20.4 µmol/l), albumin (35–55 g/l),
aspartate aminotransferase (AST; 7–40 U/l), alanine
aminotransferase (ALT; 13–35 U/l) and renal function: Serum
creatinine (44–115 µmol/l), coagulation tests: Prothrombin time
(10.0–13.0 sec)], radiological (computed tomography or magnetic
resonance imaging of the liver presenting as nodular hepatic
contour or changes in volume distribution) or histological [liver
biopsy and METAVIR score (11)]
findings. The inclusion criteria were as follows: i) No previous
treatment for portal hypertension or gastroesophageal varices; and
ii) diagnosis of gastroesophageal varices confirmed through an
endoscopic exam. A total of 44 patients were excluded from the
present study due to a prior history of splenectomy. A further 34
patients were excluded due to concurrent conditions that had the
potential to affect the accuracy of HVPG measurements, including 3
patients with hepatocellular carcinoma and 31 with portal venous
thrombosis evident on imaging exams. A total of 6 patients had
insufficient radiological data to construct a 3D rendering model
for liver and spleen volume and so were excluded from the study
cohort. The final study population comprised 77 patients and the
appropriate clinical (laboratory parameters) and radiological data
(CT imaging studies) were retrospectively reviewed via an unique
patient identification number. Patient data are presented in
Table I. The present study was
approved by the Ethics Committee of Zhongshan Hospital Fudan
University (approval no. B2015-133R; Shanghai, China). Prior
informed consent was provided by all patients.
 | Table I.Clinical characteristics of study
population (n=77). |
Table I.
Clinical characteristics of study
population (n=77).
| Variables | Mean ± standard
deviation or n (%) |
|---|
| Sex |
|
|
Male | 48 (62.3) |
|
Female | 29 (37.7) |
| Age (years) | 56.78±12.09 |
| HVPG (mmHg) | 14.25±6.18 |
| Laboratory
findings |
|
| Total
bilirubin | 18.93±20.58 |
| Albumin
(g/l) | 34.65±4.88 |
|
ALT | 27.56±17.24 |
|
AST | 37.52±20.63 |
|
Creatinine | 67.18±15.89 |
|
Hemoglobin | 93.06±26.51 |
|
Platelet | 75.04±51.01 |
|
APRI | 1.29±0.96 |
|
Prothrombin time (sec) | 14.15±1.48 |
| Radiological
findings |
|
| Liver
volume (cm3) |
1,138.81±407.89 |
| Spleen
volume (cm3) | 848.73±399.13 |
| Liver
volume: Spleen volume | 1.61±0.92 |
| Spleen
volume: Platelet | 15.96±12.19 |
| Child
Pugh score | 6.26±1.49 |
| Child-Pugh
class |
|
| A | 49 (63.6) |
| B | 26 (33.8) |
| C | 2 (2.6) |
| Etiology |
|
| Viral
cirrhosis | 47 (61.0) |
|
Non-viral cirrhosis | 30 (39.0) |
| GOV type |
|
|
GOV1 | 38 (49.4) |
|
GOV2 | 22 (28.6) |
|
IGV1 | 8 (10.4) |
|
IGV2 | 0 (0.0) |
| EV | 9 (11.7) |
| Treatment |
|
|
None | 6 (7.8) |
|
EBL | 10 (13.0) |
|
EIS | 1 (1.3) |
|
Cyanoacrylate injection | 2 (2.6) |
| EBL +
cyanoacrylate injection | 46 (59.7) |
|
BRTO | 12 (15.6) |
| Variceal
rebleed |
|
|
Rebleed | 19 (24.7) |
| No
rebleed ≥6 months | 58 (75.3) |
Endoscopic examination
All patients underwent an esophagogastroduodenoscopy
(EGD) examination performed by one of two experienced endoscopists,
each with over 15 years of experience. The presence of
gastroesophageal varices (GOV) was assessed and graded according to
Sarin's classification (12). GOV
type 1 appears as a continuation of esophageal varices and extends
along the lesser curvature of the stomach, whereas GOV type 2
extends beyond the gastro-esophageal junction into the fundus. IGV
type 1 are located in the fundus and IGV type 2 are ectopic varices
that may be located in the gastric body, antrum or pylorus
(12,13). Patients were treated appropriately
with different endoscopic procedures based on the degree and
presentation of gastroesophageal varices under endoscopic
observation. Treatment methods included endoscopic band ligation
(EBL), endoscopic injection sclerotherapy (EIS) for esophageal
varices, cyanoacrylate injection for gastric varices, EBL combines
with cyanoacrylate injection for concurrent esophageal and gastric
varices and finally balloon-occluded retrograde transvenous
obliteration (BRTO) for patients with gastric varices and
spontaneous portosystemic shunts.
HVPG
Patients were placed in a supine position and given
local percutaneous anesthesia (0.1 g lidocaine hydrochloride
injection; Shandong Hualu Pharmaceutical Co., Ltd., Liaocheng,
China). A balloon catheter (Synergy; Boston Scientific, Boston, MA,
USA) attached to a pressure transducer (cat. no. 42584; ICU
Medical, Inc., San Clemente, CA, USA) was inserted through the
internal jugular vein and threaded to the hepatic vein under
guidance from a guide-wire (cat. no. RF-PA3523M; Terumo
Corporation, Tokyo, Japan) and intravenous contrast (iopromide
injection; Bayer, Shanghai, China). Free hepatic venous pressure
(FHVP) and wedged hepatic venous pressure (WHVP) or occluded venous
pressure were measured after repeated calibration to ensure
accurate measurements. The difference between FHVP and WHVP was
calculated and recorded as HVPG.
CT
All patients undergoing abdominal contrast CT were
required to fast for a minimum of 4 h prior to the examination. The
5 mm transverse, sagittal and coronal planes were utilized for the
purpose of this study.
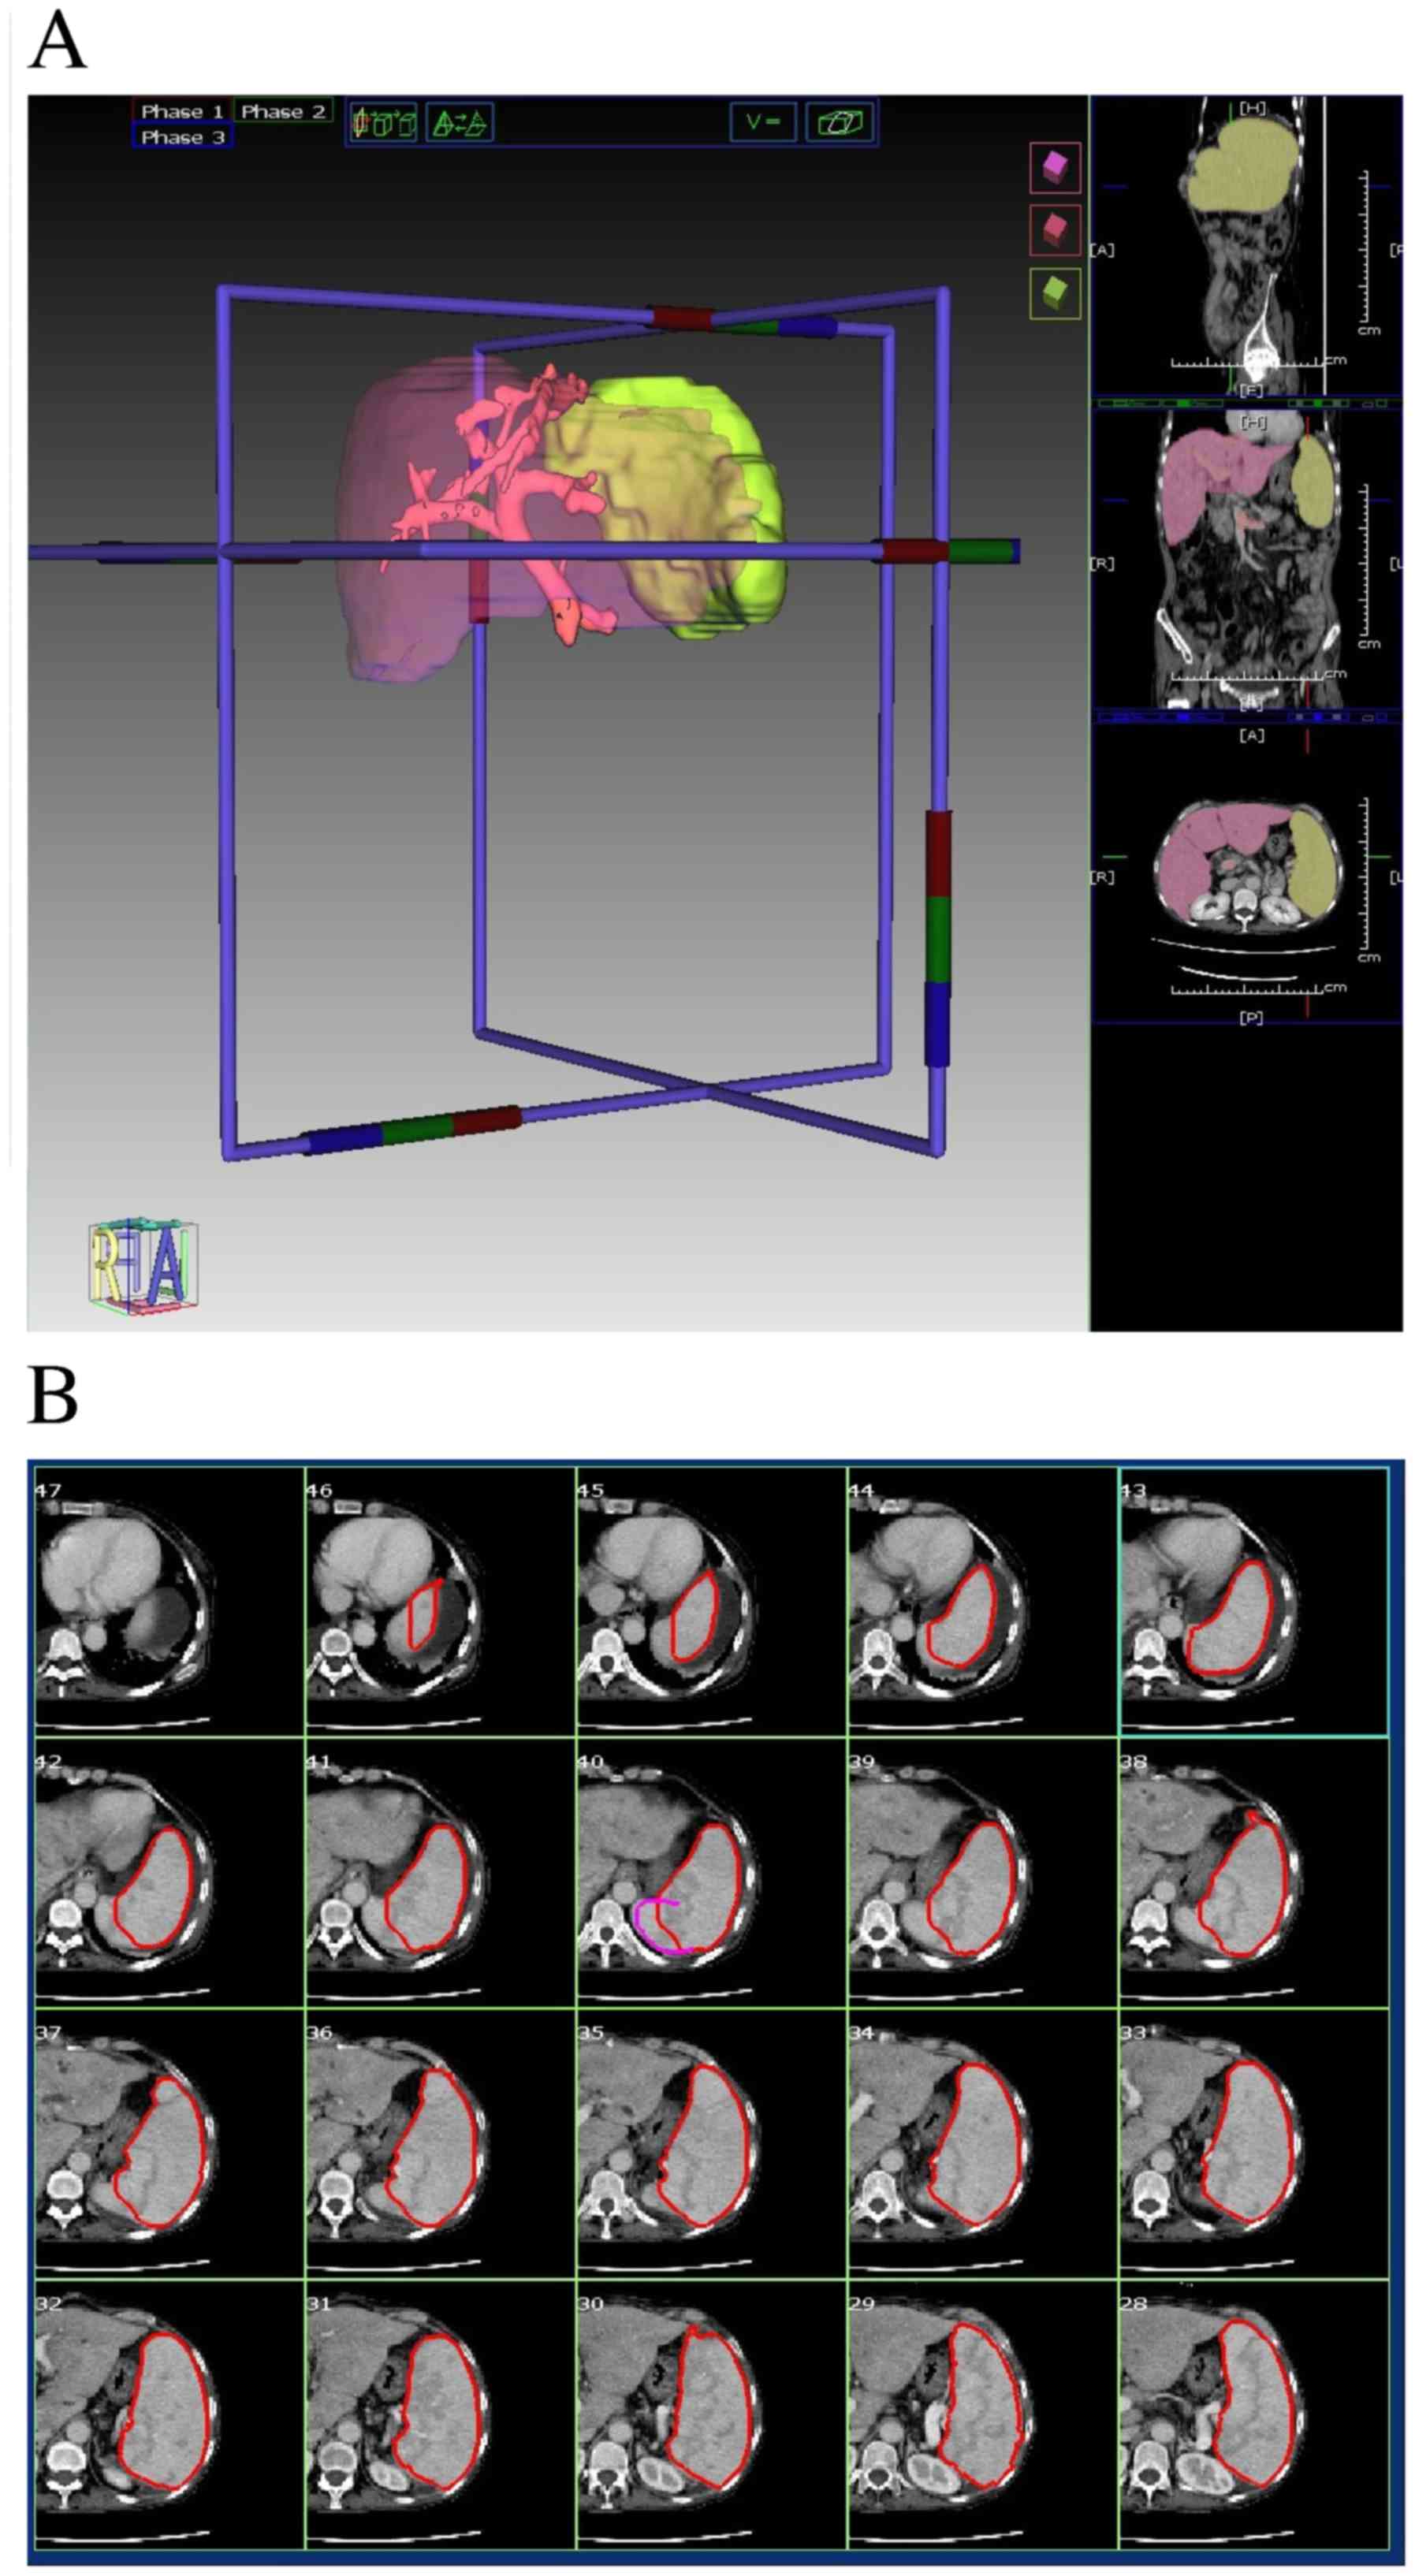
Liver volume and spleen volume
measurements
A 3D rendering model for liver and spleen were
constructed using IQQA-Liver (version 1.2.5; EDDA Technology, Inc.,
Princeton, NJ, USA) for volume measurements. Pre-contrast, arterial
and venous phase abdominal CT images at 5 mm slices were used for
volume rendering. Two authors (YJT and XQZ) manually traced the
area of both organs in the sagittal, coronal and transverse planes.
IQQA-Liver allows for an automatic construction of a 3D rendering
model for the traced region. Each transverse plane was meticulously
reviewed and corrected for any inconsistencies. All volume
measurements were measured in cm3. A sample of the
volume calculation process is presented in Fig. 1.
Clinical data
All laboratory parameters were collected upon
hospital admission, including total bilirubin (3.4–20.4 µmol/l),
albumin (35–55 g/l), AST (7–40 U/l), ALT (13–35 U/l), serum
creatinine (44–115 µmol/l), hemoglobin (115–150 g/l), platelet
(125–350×109/l), prothrombin time (10.0–13.0 sec) and
amino transferase to platelet ratio index (APRI). The Child-Pugh
Score for each patient were also calculated (14). Patient histories were retrospectively
reviewed and assessed for the presence or absence of the following
comorbidities: Portal venous thrombosis, hepatocellular carcinoma,
spontaneous portosystemic shunt and ascites. Follow-ups were
conducted 6 months following the initial endoscopic procedure
through telephone interviews or review of readmission medical
records. The incidence of variceal rebleed and mortality were
recorded.
Statistical analysis
A univariate linear regression analysis was
conducted to assess the association between HVPG and an independent
continuous variable, including total bilirubin, albumin, ALT, AST,
creatine, hemoglobin, platelet, APRI, prothrombin time, age, liver
volume, spleen volume, liver to spleen volume, spleen volume to
platelet and Child-Pugh score. All variables achieving statistical
significance at a 0.20 level were considered in the multivariate
linear regression model. A backward variable selection was employed
to identify a probable prediction model at the significance level
of 0.05. An ROC curve was used to assess the HVPG predictive model
for accurate identification of clinically significant portal
hypertension (CSPH or HVPG ≥10 mmHg). Comparisons between
continuous data were achieved using individual sample t-tests,
while categorical data was compared using Chi-square tests. All
statistical analysis was performed using SPSS 22.0 software (IBM
Corp., Armonk, NY, USA). P<0.05 was considered to indicate a
statistically significant difference.
Results
Baseline characteristics
Of the 77 patients included in the present study, 48
(62.3%) were male and 29 (37.7%) were female with a mean age of
56.78±12.09 years (range, 24–81 years). The mean HVPG was
14.25±6.18 mmHg (reference range, 1–5 mmHg) (15). A total of 49 patients (63.6%) were
Child-Pugh class A, 25 (33.8%) were class B and 2 (2.6%) were class
C. The mean liver and spleen volumes calculated via 3D rendering
technology were 1,138.81±407.89 (reference range, 984–2,439
cm3) (15) and
848.73±399.13 cm3 (reference range, 107.2–314.5
cm3) (16), respectively.
Endoscopic examinations revealed the presence of GOV type 1 in 38
patients (49.4%), GOV type 2 in 22 patients (28.6%), IGV type 1 in
8 patients (10.4%) and esophageal varices (EV) in 9 patients
(11.7%). No patients included in the present study had IGV type 2.
A total of 71 patients received endoscopic therapy as a primary
prophylaxis measure, including 10 cases of EBL, 1 case of EIS, 2
cases of cyanoacrylate injection, 46 cases combined EBL +
cyanoacrylate injection and 12 cases of BRTO (15–18). The
clinical characteristics and laboratory parameters of the study
population are presented in Table
I.
Non-invasive prediction of HVPG
A univariate linear regression analysis revealed 6
clinically significant continuous variable: Albumin, ALT, AST,
APRI, Child-Pugh score, and liver volume. All 6 parameters were
entered into a backwards multivariate regression analysis, which
resulted in an HVPG predictive model including 3 statistically
significant variables: Liver volume, albumin and APRI. The
constructed model is as follows: HVPG = 18.726–0.324 (albumin) +
1.57 (APRI) + 0.004 (liver volume) (multivariate analysis,
P=0.006).
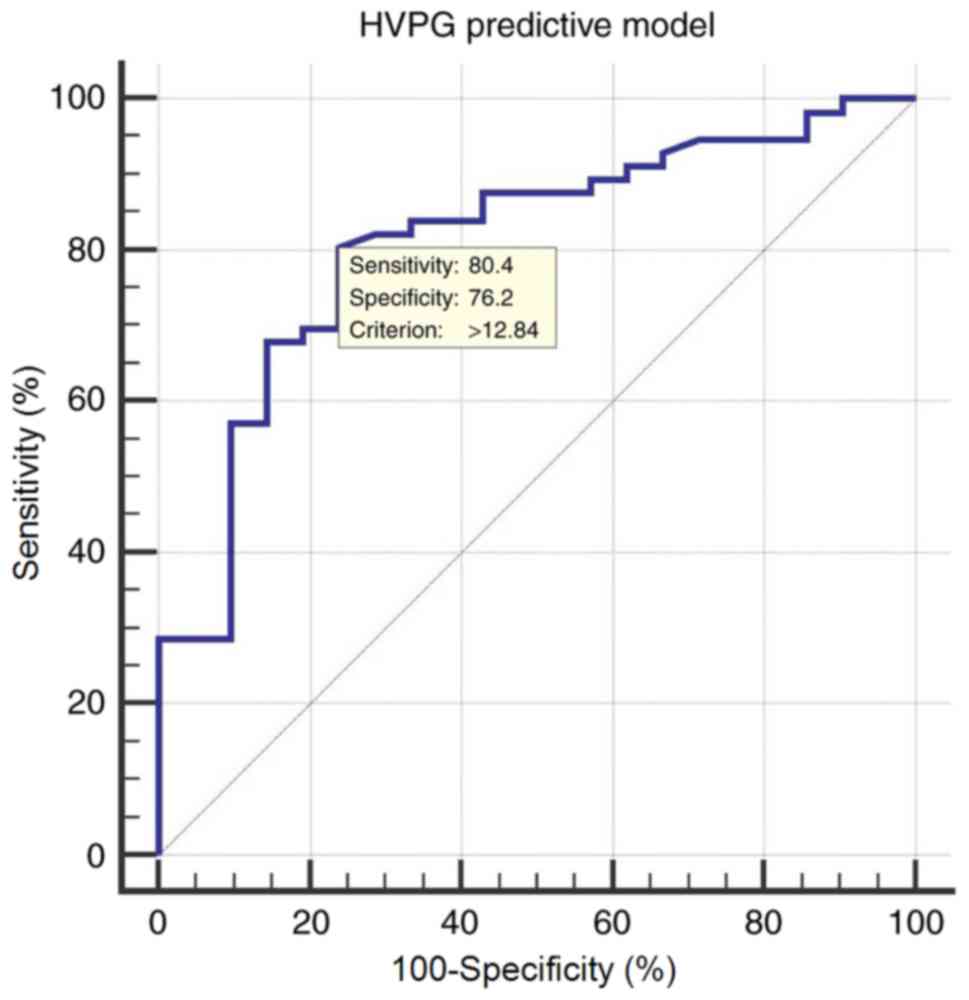
Diagnostic accuracy of the HVPG
predictive model
A corresponding ROC curve was constructed for the
HVPG predictive model to identify clinically significant portal
hypertension, defined as HVPG ≥10 mmHg. The area under receiver
operating characteristic (AUROC) was 0.810 [95% confidence interval
(CI), 0.705–0.891], with an optimal cut-off value of 12.84 yielding
a sensitivity of 80.36%, a specificity of 76.19%, a positive
predictive value (PPV) of 90.0 and a negative predictive value
(NPV) of 59.3 (Fig. 2).
HVPG predictive model for viral
vs
non-viral cirrhosis. Of the 77 included study
subjects, 47 had viral cirrhosis and 30 patients had non-viral
cirrhosis. Viral cirrhosis included 44 cases of hepatitis B and 3
cases of hepatitis C. Non-viral etiologies of cirrhosis included
schistosomiasis cirrhosis, alcoholic cirrhosis, primary biliary
cirrhosis, and cryptogenic cirrhosis. Details and differences
between patients with viral and non-viral cirrhosis are summarized
in Table II.
| Table II.Viral cirrhosis vs. non-viral
cirrhosis. |
Table II.
Viral cirrhosis vs. non-viral
cirrhosis.
| Variables | Viral cirrhosis
(n=47) | Non-viral cirrhosis
(n=30) | P-value |
|---|
| Sex |
|
|
|
|
Male | 35 (74.5) | 13 (43.3) |
|
|
Female | 12 (25.5) | 17 (56.7) |
|
| Age (years) | 55.57±11.68 | 58.67±12.67 | 0.276 |
| HVPG (mmHg) | 14.06±6.43 | 14.53±5.87 | 0.747 |
| Laboratory
findings |
|
|
|
| Total
bilirubin | 16.59±7.24 | 22.61±31.69 | 0.212 |
| Albumin
(g/l) | 34.68±5.39 | 34.60±4.04 | 0.944 |
|
ALT | 28.43±18.33 | 26.20±15.56 | 0.584 |
|
AST | 36.0±20.34 | 39.90±21.21 | 0.422 |
|
Creatinine | 71.28±14.91 | 60.77±15.48 | 0.004 |
|
Hemoglobin | 94.79±26.90 | 90.37±26.10 | 0.479 |
|
Platelet | 60.36±27.51 | 98.03±68.71 | 0.007 |
|
APRI | 1.43±1.08 | 1.06±0.69 | 0.098 |
|
Prothrombin time (sec) | 14.26±1.46 | 13.99±1.51 | 0.451 |
| Radiological
findings |
|
|
|
| Liver
volume (cm3) |
1,001.82±249.34 |
1,353.42±509.26 | 0.001 |
| Spleen
volume (cm3) | 875.30±379.16 | 807.11±431.87 | 0.468 |
| Liver
volume: Spleen volume | 1.32±0.58 | 2.06±1.16 | 0.002 |
| Spleen
volume: Platelet | 18.59±12.78 | 11.84±10.09 | 0.017 |
|
Child-Pugh score | 6.32±1.630 | 6.17±1.262 | 0.664 |
| Child-Pugh
class |
|
|
|
| A | 31 (66.0) | 18 (60.0) |
|
| B | 14 (29.8) | 12 (40.0) |
|
| C | 2 (4.3) | 0 (0.0) |
|
| GOV type |
|
|
|
|
GOV1 | 26 (55.3) | 12 (40.0) |
|
|
GOV2 | 13 (27.7) | 9 (30.0) |
|
|
IGV1 | 5 (10.6) | 3 (10.0) |
|
|
IGV2 | 0 (0.0) | 0 (0.0) |
|
| EV | 3 (6.4) | 6 (20.0) |
|
| Treatment |
|
|
|
|
None | 5 (10.6) | 1 (3.3) |
|
|
EBL | 3 (6.4) | 7 (23.3) |
|
|
EIS | 0 (0.0) | 1 (3.3) |
|
|
Cyanoacrylate injection | 2 (4.3) | 0 (0.0) |
|
| EBL +
Cyanoacrylate injection | 30 (63.8) | 16 (53.3) |
|
|
BRTO | 7 (14.9) | 5 (16.7) |
|
| Variceal
rebleed |
|
|
|
|
Rebleed | 11 (23.4) | 8 (26.7) |
|
| No
rebleed ≥6 months | 36 (76.6) | 22 (73.3) |
|
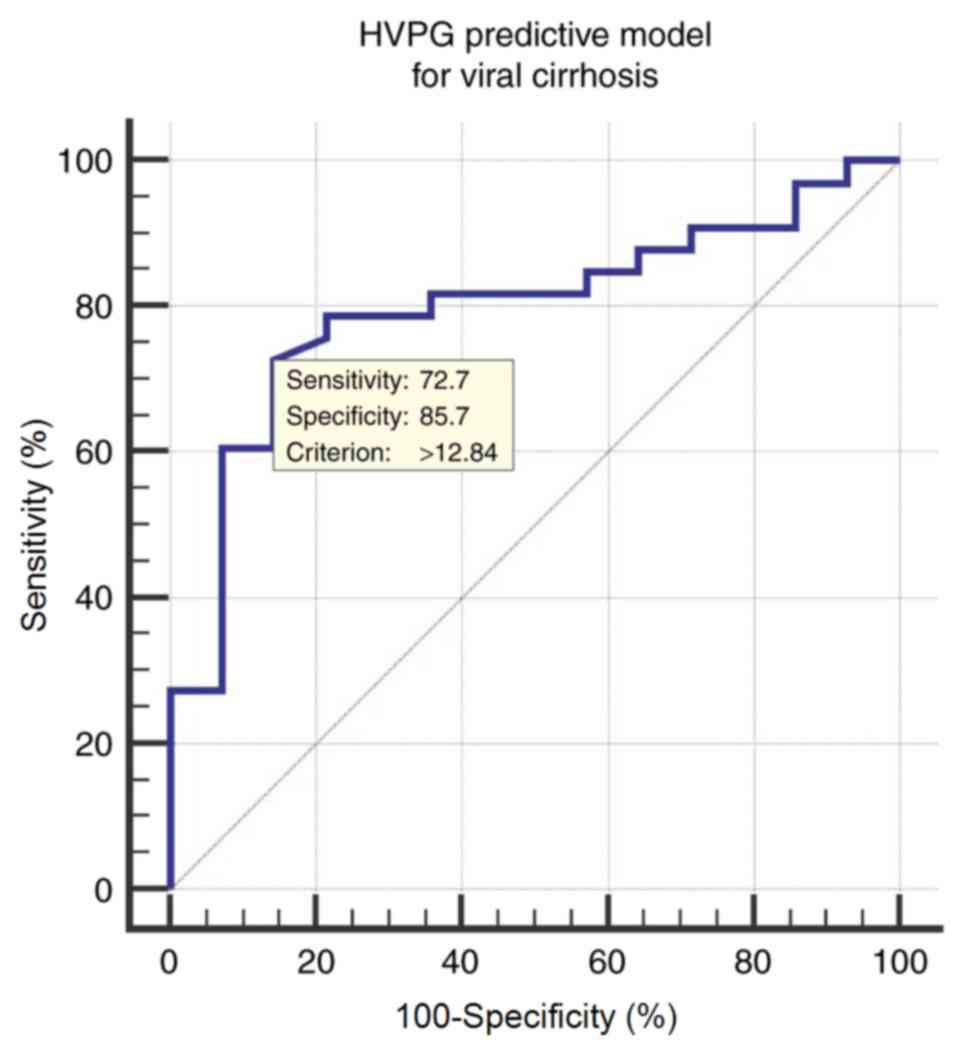
HVPG predictive model in patients with
viral cirrhosis
The ROC curve of the HVPG predictive model for
determining CSPH (HVPG ≥10 mmHg) in patients with viral cirrhosis
resulted in an AUROC of 0.798 (95% CI; 0.655–0.901). The optimal
cut-off value is 12.84, with a corresponding sensitivity of 72.73%,
specificity of 85.71%, a PPV of 92.3 and a NPV of 57.1 (Fig. 3).
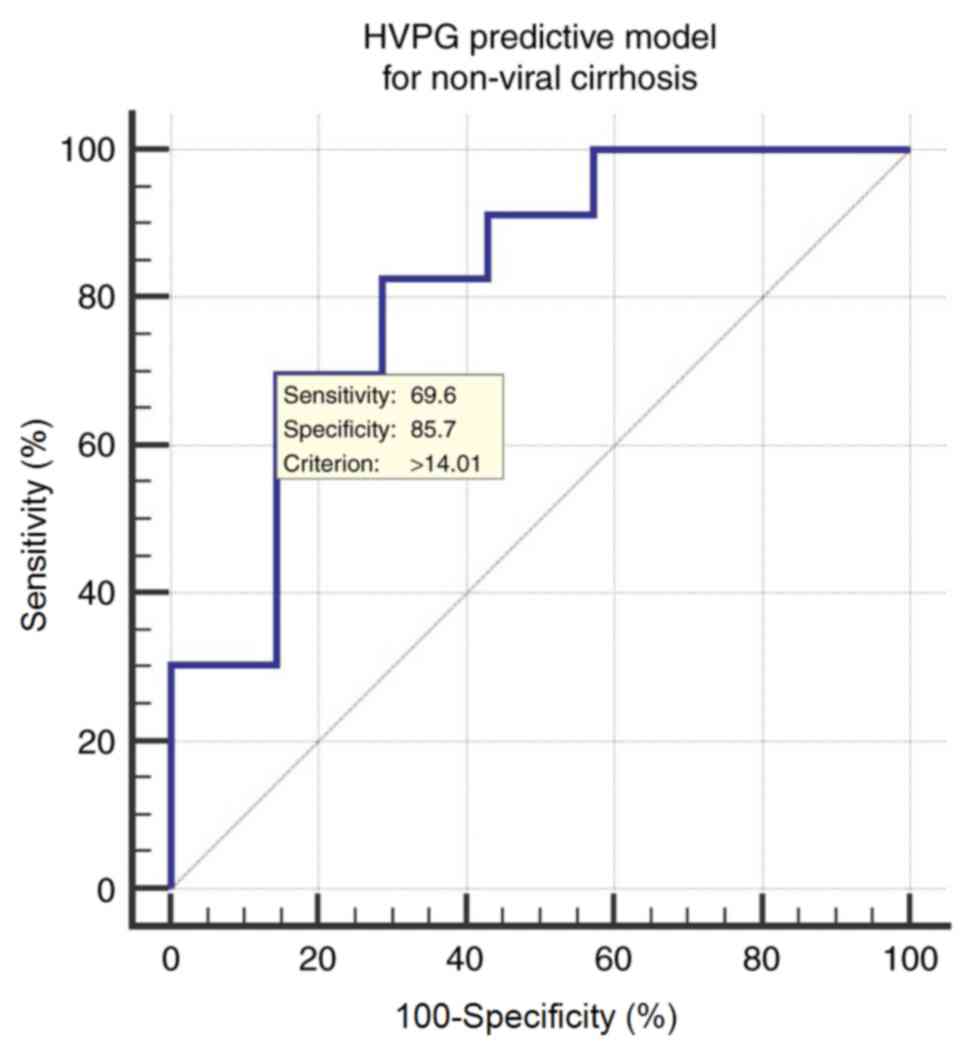
HVPG predictive model in patients with
non-viral cirrhosis
The ROC curve of the HVPG predictive model
constructed to determine CSPH (HVPG ≥10 mmHg) in patients with
non-viral cirrhosis yielded an AUROC of 0.820 (95% CI;
0.637–0.935). The optimal cut-off value is 14.01, with a
sensitivity of 69.57%, specificity of 85.71%, a PPV of 94.1 and an
NPV of 46.2 (Fig. 4).
Discussion
The aim of the present study was to investigate the
potential of liver and spleen volume as a non-invasive predictor
for assessing HVPG and gastroesophageal varices in patients with
portal hypertension. All patients underwent an upper abdominal CT
examination with contrast, transjugular measurement of HVPG, an
endoscopic examination to identify the presence of gastroesophageal
varices and endoscopic treatment when deemed necessary.
A univariate analysis of all non-invasive parameters
identified six clinically significant continuous variables that
were entered into a multivariate regression analysis, with a
resulting HVPG predictive model: HVPG = 18.726–0.324 (albumin) +
1.57 (APRI) + 0.004 (liver volume). In order to further understand
the suitability of the HVPG predictive model based on clinical
etiology, the study subjects were divided into viral (n=47) and
non-viral cirrhosis (n=30). Studies revealed that patients with
viral cirrhosis tend to have more prominent liver atrophy, whereas
liver hypertrophy may be observed in non-viral etiologies,
including alcoholic cirrhosis (19).
Although the performance of AUROC is slightly better in the
non-viral cirrhosis group compared with the viral cirrhosis group,
the cut-off value yielded a more desirable diagnostic accuracy for
patients with viral cirrhosis. The HVPG predictive model was
constructed based on the whole population with varying etiologies,
and so the model is feasible for both viral and non-viral
cirrhosis.
Previous studies have demonstrated that liver volume
to spleen volume ratio may be useful for predicting HVPG score in
patients with HVPG >12 mmHg (20). However, such prediction requires
prior knowledge of gastroesophageal variceal classification, which
is only possible via an endoscopy exam. To the best of our
knowledge, no studies have presented a truly non-invasive
diagnostic method for HVPG and gastroesophageal varices in patients
with portal hypertension based on liver and spleen volume alone.
The early detection of CSPH is important due to its association
with cirrhotic complications, including gastroesophageal variceal
hemorrhage (21,22). At present, the gold standard for
stratifying the degree of portal hypertension is invasive
measurement of HVPG (23–25); no effective non-invasive replacement
for HVPG measurements is currently available (6,7,21). Various non-invasive methods have been
suggested to replace HVPG measurements, ranging from serum
biomarkers to imaging modalities or the combination of different
techniques (5,8,26).
Transient elastography (TE) has yielded the most promising results,
however the accuracy of TE may be influenced by comorbidities,
including the presence of ascites and obesity (20,27–30). 3D
rendering of liver volume based on CT images has potential for
predicting HVPG and assessing disease severity. The widespread
availability of CT imaging may allow physicians to accurately
assess the full scope of the disease and perhaps monitor treatment
responses and disease progression.
There are several limitations to the present study.
Due to the limited number of study subjects, a control group was
not employed to verify the proposed model. The majority of patients
did not undergo a follow-up CT examination following treatment. The
utility of the proposed model as a monitor for disease progression
remains to be determined. Furthermore, the proposed equation had a
positive coefficient for the liver variable, which is uncommon as
cirrhosis is typically associated with a decrease in liver volume.
A potential explanation for this is the difference in cirrhosis
etiologies. Kim et al (19)
demonstrated that there is a significant difference in liver volume
in patients with cirrhosis of different etiologies. Patients with
alcoholic cirrhosis had an average volume of 1,204.2
cm3, whereas those with HBV had a mean volume of 946.6
cm3 (19). In the present
study, patients with different etiologies, including viral
hepatitis, cirrhosis, primary biliary cirrhosis and alcoholic
cirrhosis, were included, which may result in inconsistencies in
liver size. Another possible explanation is that body mass index
(BMI) may affect liver and spleen size in each individual patient.
Unfortunately, BMI data was not available in the present study. In
order to confirm the efficacy of the method of HVPG prediction
presented in the present study, further, multi-center studies with
a larger study population should be performed.
Acknowledgements
The present study was supported by the Innovation
Fund of Shanghai Scientific Committee (grant no. 15411950501) and
the Foundation of Shanghai Municipal Commission of Health and
Family Planning (grant no. 20154Y0065).
Glossary
Abbreviations
Abbreviations:
|
HVPG
|
hepatic venous pressure gradient
|
|
CSPH
|
clinically significant portal
hypertension
|
|
EGD
|
esophagogastroduodenoscopy
|
|
GOV
|
gastroesophageal varices
|
|
IGV
|
isolated gastric varices
|
|
EBL
|
endoscopic band ligation
|
|
EIS
|
endoscopic injection sclerotherapy
|
|
BRTO
|
balloon-occluded retrograde
transvenous obliteration
|
|
FHVP
|
free hepatic venous pressure
|
|
WHVP
|
wedged hepatic venous pressure
|
|
CT
|
computed tomography
|
|
APRI
|
aminotransferase-to-platelet ratio
index
|
|
ROC
|
receiver operating characteristic
|
|
AUROC
|
area under receiver operating
characteristic
|
|
NPV
|
negative predictive value
|
|
PPV
|
positive predictive value
|
References
|
1
|
Mokdad AA, Lopez AD, Shahraz S, Lozano R,
Mokdad AH, Stanaway J, Murray CJ and Naghavi M: Liver cirrhosis
mortality in 187 countries between 1980 and 2010: A systematic
analysis. BMC Med. 12:1452014. View Article : Google Scholar : PubMed/NCBI
|
|
2
|
Triantos CK, Nikolopoulou V and Burroughs
AK: Review article: The therapeutic and prognostic benefit of
portal pressure reduction in cirrhosis. Aliment Pharmacol Ther.
28:943–952. 2008. View Article : Google Scholar : PubMed/NCBI
|
|
3
|
Garcia-Tsao G, Sanyal AJ, Grace ND and
Carey W; Practice Guidelines Committee of the American Association
for the Study of Liver Diseases, ; Practice Parameters Committee of
the American College of Gastroenterology, : Prevention and
management of gastroesophageal varices and variceal hemorrhage in
cirrhosis. Hepatology. 46:922–938. 2007. View Article : Google Scholar : PubMed/NCBI
|
|
4
|
Garcia-Tsao G and Bosch J: Management of
varices and variceal hemorrhage in cirrhosis. N Engl J Med.
362:823–832. 2010. View Article : Google Scholar : PubMed/NCBI
|
|
5
|
Procopet B, Cristea VM, Robic MA,
Grigorescu M, Agachi PS, Metivier S, Peron JM, Selves J, Stefanescu
H, Berzigotti A, et al: Serum tests, liver stiffness and artificial
neural networks for diagnosing cirrhosis and portal hypertension.
Dig Liver Dis. 47:411–416. 2015. View Article : Google Scholar : PubMed/NCBI
|
|
6
|
Suk KT: Hepatic venous pressure gradient:
Clinical use in chronic liver disease. Clin Mol Hepatol. 20:6–14.
2014. View Article : Google Scholar : PubMed/NCBI
|
|
7
|
de Franchis R: Baveno VI Faculty:
Expanding consensus in portal hypertension: Report of the Baveno VI
consensus workshop: Stratifying risk and individualizing care for
portal hypertension. J Hepatol. 63:743–752. 2015. View Article : Google Scholar : PubMed/NCBI
|
|
8
|
Procopet B, Berzigotti A, Abraldes JG,
Turon F, Hernandez-Gea V, Garcia-Pagan JC and Bosch J: Real-time
shear-wave elastography: Applicability, reliability and accuracy
for clinically significant portal hypertension. J Hepatol.
62:1068–1075. 2015. View Article : Google Scholar : PubMed/NCBI
|
|
9
|
Merkel C and Montagnese S: Should we
routinely measure portal pressure in patients with cirrhosis, using
hepatic venous pressure gradient (HVPG) as guidance for prophylaxis
and treatment of bleeding and re-bleeding? Yes! Eur J Intern Med.
22:1–4. 2011. View Article : Google Scholar : PubMed/NCBI
|
|
10
|
Ferenci P, Lockwood A, Mullen K, Tarter R,
Weissenborn K and Blei AT: Hepatic encephalopathy-definition,
nomenclature, diagnosis and quantification: Final report of the
working party at the 11th World Congresses of Gastroenterology,
Vienna, 1998. Hepatology. 35:716–721. 2002. View Article : Google Scholar : PubMed/NCBI
|
|
11
|
Bedossa P and Poynard T: An algorithm for
the grading of activity in chronic hepatitis C. The METAVIR
Cooperative Study Group. Hepatology. 24:289–293. 1996. View Article : Google Scholar : PubMed/NCBI
|
|
12
|
Sarin SK, Lahoti D, Saxena SP, Murthy NS
and Makwana UK: Prevalence, classification and natural history of
gastric varices: A long-term follow-up study in 568 portal
hypertension patients. Hepatology. 16:1343–1349. 1992. View Article : Google Scholar : PubMed/NCBI
|
|
13
|
Sarin SK and Lahoti D: Management of
gastric varices. Baillieres Clin Gastroenterol. 6:527–548. 1992.
View Article : Google Scholar : PubMed/NCBI
|
|
14
|
Cholongitas E, Papatheodoridis GV, Vangeli
M, Terreni N, Patch D and Burroughs AK: Systematic review: The
model for end-stage liver disease-should it replace Child-Pugh's
classification for assessing prognosis in cirrhosis? Aliment
Pharmacol Ther. 22:1079–1089. 2005. View Article : Google Scholar : PubMed/NCBI
|
|
15
|
Sarin SK and Kumar A: Endoscopic treatment
of gastric varices. Clin Liver Dis. 18:809–827. 2014. View Article : Google Scholar : PubMed/NCBI
|
|
16
|
Sarin SK: Injection sclerotherapy for
varices. Trop Gastroenterol. 8:177–181. 1987.PubMed/NCBI
|
|
17
|
Saad WE: Balloon-occluded retrograde
transvenous obliteration of gastric varices: Concept, basic
techniques, and outcomes. Semin Intervent Radiol. 29:118–128. 2012.
View Article : Google Scholar : PubMed/NCBI
|
|
18
|
Garcia-Pagán JC, Barrufet M, Cardenas A
and Escorsell À: Management of gastric varices. Clin Gastroenterol
Hepatol. 12:919–928. 2014. View Article : Google Scholar : PubMed/NCBI
|
|
19
|
Kim I, Jang YJ, Ryeom H, Lee SM, Lee HJ,
Kim GC and Kim HJ: Variation in hepatic segmental volume
distribution according to different causes of liver cirrhosis: CT
volumetric evaluation. J Comput Assist Tomogr. 36:220–225. 2012.
View Article : Google Scholar : PubMed/NCBI
|
|
20
|
Yan S, Wu H, Wang G, Chen Y, Zhang C and
Zhu Q: A new model combining the liver/spleen volume ratio and
classification of varices predicts HVPG in hepatitis B patients
with cirrhosis. Eur J Gastroen Hepat. 27:335–343. 2015. View Article : Google Scholar
|
|
21
|
de Franchis R: Baveno V Faculty: Revising
consensus in portal hypertension: report of the Baveno V consensus
workshop on methodology of diagnosis and therapy in portal
hypertension. J Hepatol. 53:762–768. 2010. View Article : Google Scholar : PubMed/NCBI
|
|
22
|
Kim TY, Jeong WK, Sohn JH, Kim J, Kim MY
and Kim Y: Evaluation of portal hypertension by real-time shear
wave elastography in cirrhotic patients. Liver Int. 35:2416–2424.
2015. View Article : Google Scholar : PubMed/NCBI
|
|
23
|
Kim MY, Jeong WK and Baik SK: Invasive and
non-invasive diagnosis of cirrhosis and portal hypertension. World
J Gastroenterol. 20:4300–4315. 2014. View Article : Google Scholar : PubMed/NCBI
|
|
24
|
Abraldes JG, Sarlieve P and Tandon P:
Measurement of portal pressure. Clin Liver Dis. 18:779–792. 2014.
View Article : Google Scholar : PubMed/NCBI
|
|
25
|
Silva-Junior G, Baiges A, Turon F, Torres
F, Hernández-Gea V, Bosch J and Garcia-Pagan JC: The prognostic
value of hepatic venous pressure gradient in patients with
cirrhosis is highly dependent on the accuracy of the technique.
Hepatology. 62:1584–1592. 2015. View Article : Google Scholar : PubMed/NCBI
|
|
26
|
Berzigotti A, Reverter E, García-Criado A,
Abraldes JG, Cerini F, García-Pagán JC and Bosch J: Reliability of
the estimation of total hepatic blood flow by Doppler ultrasound in
patients with cirrhotic portal hypertension. J Hepatol. 59:717–722.
2013. View Article : Google Scholar : PubMed/NCBI
|
|
27
|
Lemoine M, Katsahian S, Ziol M, Nahon P,
Ganne-Carrie N, Kazemi F, Grando-Lemaire V, Trinchet JC and
Beaugrand M: Liver stiffness measurement as a predictive tool of
clinically significant portal hypertension in patients with
compensated hepatitis C virus or alcohol-related cirrhosis. Aliment
Pharm Ther. 28:1102–1110. 2008. View Article : Google Scholar
|
|
28
|
Hong WK, Kim MY, Baik SK, Shin SY, Kim JM,
Kang YS, Lim YL, Kim YJ, Cho YZ, Hwang HW, et al: The usefulness of
non-invasive liver stiffness measurements in predicting clinically
significant portal hypertension in cirrhotic patients: Korean data.
Clin Mol Hepatol. 19:370–375. 2013. View Article : Google Scholar : PubMed/NCBI
|
|
29
|
Zhang QW, Wang Y, Wang J, Zhao HB, Yu H,
Liu SY, Zeng X, Chen Q, Hu ZQ, Guo WY, et al: A non-invasive
magnetic resonance imaging-based model predicts portal venous
pressure. J Digest Dis. 17:175–185. 2016. View Article : Google Scholar
|
|
30
|
Hayashi H, Beppu T, Okabe H, Nitta H, Imai
K, Doi K, Chikamoto A and Baba H: Combined measurements of serum
bile acid level and splenic volume may be useful to noninvasively
assess portal venous pressure. J Gastroenterol. 47:1336–1341. 2012.
View Article : Google Scholar : PubMed/NCBI
|