Introduction
Ethanol is eventually metabolized to carbon dioxide
and water via a dehydrogenase and oxidase. Ethanol and a series of
intermediate products in its metabolism have certain toxic effects
on tissues and cells, which may result in a wide range of mental
and physical abnormalities (1).
Chronic alcoholism may damage multiple systems and organs including
the nervous, cardiovascular, digestive and immune system, as well
as muscle. In a previous study, it was demonstrated that ethanol
may lead to the loss of neurons in specific brain regions (2). It has been suggested that cell necrosis
or apoptosis may be activated by ethanol via a variety of
mechanisms, such as enhancing expression of tumor necrosis factor-α
(3,4)
and Fas/Fas ligand (5,6), inducing transcriptional activity of
nuclear factor-κB (7,8), activating caspases in mitochondria
(9) and causing transport disorders
of intracellular Ca2+ (10). Intracellular Ca2+ serves
an important role in cell biology, which influences or determines
necrosis or apoptosis independently. Cellular Ca2+
overload is the hub of necrosis or apoptosis (11,12).
Intracellular Ca2+ originates from L-type
voltage-operated calcium channels, N-methyl-D-aspartate receptor
(NMDAR)-mediated calcium influx into cells (13), inositol 1, 4,5-trisphosphate
(IP3)-induced calcium release (14)
and ryanodine receptor-induced calcium release (15). A previous report has identified a
rise of excitatory amino acids in patients with chronic alcohol
poisoning (16), such as glutamate,
aspartate and homocysteine, which significantly increased the
vulnerability of neurons to excitotoxicity and oxidative damage.
Excitatory amino acids serve a role in NMDAR overstimulation,
oxidative stress, caspase activation, DNA damage and mitochondrial
dysfunction (17). NMDAR is a
ligand-gated Ca2+ channel that is closely associated
with central nervous system development, learning and memory
(18,19). Following chronic ethanol exposure,
NMDAR in the central nervous system is more sensitive to NMDA,
which is known as NMDAR hyper-excitement (20), a primary cause of ethanol withdrawal
symptoms and neuronal over-excitability (21). NMDAR is heteromeric and consists of
three subunits: NR1, NR2 and NR3 (22). The NR1 subunit is the functional
subunit of NMDAR, which is widespread in the central nervous system
of animals (23). It has been
demonstrated previously that, following long-term ethanol feeding,
cerebral cortical MK-801 binding in guinea pigs was significantly
higher than that in a control group (24) and there appeared to be greater
expression of NR1 in the cerebral cortex, hypothalamus and
hippocampus of rats (25). These
findings suggested that long-term ethanol exposure results in an
adaptive increase in NMDAR, causing hyper-excitation of NMDAR.
Preconditioning with non-competitive NMDAR antagonist, memantine
and downregulation of NMDAR expression by small interfering RNA
(siRNA) control intracellular Ca2+ release (26), thereby inhibiting caspase-3
activation and controlling or reducing the occurrence of neuronal
apoptosis induced by isoflurane. The present study aimed to
determine the role of NMDAR and intracellular calcium in
ethanol-induced SK-N-SH cell apoptosis and assess the
neuroprotective and therapeutic effect of memantine.
Materials and methods
Cell line
In the present study, SK-N-SH human neuroblastoma
cells were purchased from Nanjing KeyGen Biotech Co., Ltd.
(Nanjing, China). The cells were cultured in high glucose
Dulbecco's modified Eagle's medium (DMEM; Biological Industries,
Kibbutz Beit-Haemek, Israel) containing 10% fetal bovine serum, 100
U/ml penicillin and 100 µg/ml streptomycin (all purchased from
Biological Industries). Cells were maintained at 37°C in a
humidified atmosphere containing 5% CO2.
Ethanol volatilization detection
The present study determined that ethanol
volatilized over time under normal culture conditions, thereby
reducing the ethanol concentration in the culture medium.
Therefore, ethanol volatilization was determined per 24 h and
appropriate quantities of ethanol were added to maintain relatively
stable concentrations of ethanol in the medium. 5 ml culture medium
containing ethanol (50, 100, 200 and 400 mM) was added into a
25-cm2 cell culture flask. After 24 h at 37°C, the
remaining ethanol concentration was detected using headspace gas
chromatography (cat. no. GC-14A; Shimadzu Corporation, Kyoto,
Japan), as described in a previous study (27). The quantity of daily ethanol
volatilization was calculated using the following equation:
Quantity of daily ethanol volatilization = initial quality -
remaining quality.
Grouping
SK-N-SH cells were cultured in a 25-cm2
cell culture flask at a density of 1×10⁶ cells/ml.
Ethanol was added into DMEM culture medium at 37°C. When cells
reached an 80–90% confluence, according to the duration of ethanol
treatment, SK-N-SH cells were divided into 24, 48 and 72 h groups,
and according to the ethanol concentration, cells were divided into
0 (control group), 50, 100, 200 and 400 mM groups. Ethanol at 0 and
100 mM was also used to treat SK-N-SH cells for 2 days at 37°C and
cells were categorized into memantine (Sigma-Aldrich; Merck KGaA,
Darmstadt, Germany) and non-memantine groups. The concentration of
memantine used was 4 µM. According to whether protein expression of
NR1 was downregulated by RNA interference (RNAi), cells were
divided into NR1 short hairpin RNA (shRNA) and control shRNA
groups.
RNAi
SK-N-SH cells were seeded in 6-well plates at a low
density (<10% confluence) in normal growth medium containing
various concentrations of puromycin (cat. no. sc108071; Santa Cruz
Biotechnology, Inc., Dallas, TX, USA) (0, 1, 2, 3, 4, 6, 8 and 10
µg/ml) to determine the minimum concentration necessary to kill all
untransfected cells. An NR1 shRNA plasmid (cat. no. sc-91941-SH;
Santa Cruz Biotechnology, Inc.) was used in the RNAi. It is a pool
of 3 target-specific lentiviral vector plasmids, each encoding
19–25 nucleotide (plus hairpin) shRNAs designed to knock down gene
expression. The control shRNA plasmid (cat. no. sc-108060; Santa
Cruz Biotechnology, Inc.) encodes a scrambled shRNA sequence that
does not degrade any known cellular mRNA. The NR1 shRNA plasmid and
the control shRNA plasmid were of the same vector type. Each
plasmid contained a puromycin resistance gene for the selection of
stable cells that express the desired shRNA. At 60–70% confluency,
shRNA Plasmid Transfection Reagent (10/200 µl, cat. no. sc-108061;
Santa Cruz Biotechnology, Inc.) was used to transfect the NR1 shRNA
plasmid (5/200 µl) and control shRNA plasmid (5/200 µl) into cells,
according to the manufacturers' protocol. Following 48 h
transfection at 37°C, the medium was replaced with fresh DMEM
medium containing puromycin (1 µg/ml) to select the transfected
cells over 5 days at 37°C. At 90% confluency, total protein was
extracted and the transfection efficiency was determined by western
blotting. The sequences of NR1 shRNA and control shRNA (28) are presented in Table I.
 | Table I.Sequences of shRNA. |
Table I.
Sequences of shRNA.
| shRNA | Sequence |
|---|
| NR1 shRNA-A |
|
| Hairpin
sequence |
5′GATCCCCATGTTCTTAGAGAAGATTTCAAGAGAATCTTCTCTAAGAACATGGTTTTT′3 |
|
Corresponding siRNA sense
sequence |
5′CCAUGUUCUUAGAGAAGAUtt′3 |
|
Corresponding siRNA antisense
sequence |
5′AUCUUCUCUAAGAACAUGGtt′3 |
| NR1 shRNA-B |
|
| Hairpin
sequence |
5′GATCCCTTGTATTGTCGGGAAAGATTCAAGAGATCTTTCCCGACAATACAAGTTTTT′3 |
|
Corresponding siRNA sense
sequence |
5′CUUGUAUUGUCGGGAAAGAtt′3 |
|
Corresponding siRNA antisense
sequence |
5′UCUUUCCCGACAAUACAAGtt′3 |
| NR1 shRNA-C |
|
| Hairpin
sequence |
5′GATCCCAAGGTGGATCCAGTTTCTTTCAAGAGAAGAAACTGGATCCACCTTGTTTTT′3 |
|
Corresponding siRNA sense
sequence |
5′CAAGGUGGAUCCAGUUUCUtt′3 |
|
Corresponding siRNA antisense
sequence |
5′AGAAACUGGAUCCACCUUGtt′3 |
| Control shRNA |
5′TTCTCCGAACGTGTCACGTTTCAAGAGAACGTGACACGTTCGGAGAATTTTT′3 |
MTS assay
Cell viability was determined using an MTS kit
(Promega Corporation, Madison, WI, USA). SK-N-SH cells were seeded
at a density of 4,000 cells/well and treated in 96-well plates for
various durations. Following 24 h culture, the cells were washed
with PBS three times and fresh DMEM medium (100 µl) and MTS (20 µl)
reagent were added to the wells for 1 h at 37°C in the dark
(25,26). The absorbance was measured at a
wavelength of 490 nm on an ELx808 absorbance reader (BioTek
Instruments, Inc., Winooski, VT, USA). To eliminate possible
interference by alcohol, cells treated with the same concentrations
of alcohol (0, 50, 100, 200 and 400 mM) and memantine (4 µM) but
without addition of assay reagents were used as blank controls. All
experiments were repeated at least five times.
Annexin V/propidium iodide (PI)
double-staining
Cell apoptosis was measured using an Annexin
V-fluorescein isothiocyanate (FITC)/PI apoptosis detection kit (BD
Biosciences, San Jose, CA, USA). SK-N-SH cells were seeded at a
density of 1×10⁶ cells/ml and treated in
25-cm2 tissue culture flasks until an 80–90% confluence
was observed. Following washing with PBS twice, cells were
double-stained with FITC-conjugated Annexin V and PI for 15 min at
20°C in a Ca2+-enriched binding buffer in the kit. Cells
were immediately analyzed on a flow cytometer in their staining
solution. Annexin V and PI emissions were detected in the FL-1
(band pass, 530 nm; band width, 30 nm) and FL-2 (band pass, 585 nm;
band width, 42 nm) channels. A total of 10,000–20,000 events were
recorded per sample. BD FACSDiva V8.0.1 software (BD Biosciences)
was used to analyze this data.
Intracellular calcium measurement
Intracellular Ca2+ was measured with the
Ca2+-sensitive dye fura-2-acetoxymethyl ester
(fura-2-AM; Dojindo Molecular Technologies, Inc., Kumamoto, Japan)
as previously described (29).
SK-N-SH cells were seeded to 80–90% confluence and treated in
25-cm2 tissue culture flasks. To prepare cell
suspensions, the cells were washed twice with Hank's balanced salt
solution (HBSS; Biological Industries), trypsinized (Biological
Industries), centrifuged at a speed of 2,000 × g, for 5 min at room
temperature) and resuspended in HBSS containing 20 g/l bovine serum
albumin (Biological Industries), and the cell concentration was
adjusted to 1×10⁶-1×10⁷ cells/ml. The
survival rate of the cells was determined using a trypan blue
staining cell viability assay kit (Beyotime Institute of
Biotechnology, Shanghai, China) according to the manufactures'
protocol. A total of 0.1 ml cell suspension, containing
105 cells was mixed with 0.4% trypan blue solution (0.1
ml). The mixture was then incubated for 3 min at room temperature.
The quantity of living cells (which were not stained by trypan
blue) were counted and determined to be >95%. SK-N-SH cells
(1×10⁶-3×10⁶ cells/ml) were loaded with 3 mM
fura-2-AM in HBSS at 37°C for 20 min. The cells were then washed
once with HBSS and incubated for 1 h at 37°C in HBSS. The
fluorescence of the cell suspension was monitored continuously
using a F-4500 fluorescence spectrometer (Hitachi, Ltd., Tokyo,
Japan) with excitation at 340 and 380 nm and emission at 500 nm.
Triton X-100 (0.1%) and 10 mM EDTA were added to obtain the maximum
and minimum concentrations of calcium, respectively.
Cell lysis and protein
quantification
SK-N-SH cells were seeded until an 80–90% confluence
was reached and treated with ethanol (0, 50, 100, 200 and 400 mM)
and memantine (4 µM) in 25-cm2 tissue culture flasks.
Cells were subsequently washed with Dulbecco's PBS (Biological
Industries) and lysed on ice using radioimmunoprecipitation assay
lysis buffer (Beyotime Institute of Biotechnology) containing 1 mM
phenylmethanesulfonyl fluoride (Beyotime Institute of
Biotechnology). Lysates were harvested using cell scrapers, placed
on ice for 30 min and then fragmented using an ultrasonicator. The
lysates were centrifuged at 21,000 × g for 15 min at 4°C and
quantified for total proteins using a bicinchoninic acid protein
assay kit (Beyotime Institute of Biotechnology).
Western blotting
Equal quantities of protein (~30 µg) were separated
using 10% SDS-PAGE and the separated protein was transferred onto
polyvinylidene fluoride membranes. The membranes were blocked for
non-specific binding with 5% non-fat dry milk in Tris-buffered
saline containing 0.05% Tween-20 (TBS-T) for 2 h at room
temperature and then probed with primary antibodies overnight at
4°C. The primary antibodies used were as follows: Rabbit anti-NR1
(1:500; cat. no. 13771-1-AP; ProteinTech Group, Inc., Chicago, IL,
USA), rabbit anti-caspase-3 (1:200; cat. no. sc-98785; Santa Cruz
Biotechnology, Inc.) and mouse anti-β-actin (1:1,000; cat. no.
TA-09; OriGene Technologies, Inc., Rockville, MD, USA).
Subsequently, the blots were washed with TBS-T three times (5
mins/wash) and incubated with the corresponding
peroxidase-conjugated goat anti-mouse or anti-rabbit secondary
antibodies (1:10,000; cat. nos. E030110-02 and E030120-02; EarthOx
Life Sciences, Millbrae, CA, USA) for 2 h at room temperature.
Protein bands were detected with enhanced chemiluminescence reagent
(EMD Millipore, Billerica, MA, Germany). Chemiluminescent signals
were detected and analyzed by a Tanon 5500 Chemiluminescent Imaging
system (Tanon Science and Technology Co., Ltd., Shanghai, China).
Band densities were analyzed semi-quantitatively using Image J
1.6.0 software (National Institute of Health, Bethesda, MD,
USA).
RNA extraction and reverse
transcription-quantitative polymerase chain reaction (RT-qPCR)
Total RNA was extracted from cells using
TRIzol® (Thermo Fisher Scientific, Inc., Waltham, MA,
USA) and reverse transcribed into cDNA using a PrimeScript™RT
Reagent kit (Perfect Real Time; Takara Biotechnology Co., Ltd.,
Dalian, China). qPCR was performed using a SYBR® Premix
Ex Taq™ II (TliRnaseH Plus; Takara Biotechnology Co., Ltd.) in a
reaction volume of 20 µl on an ABI 7500 Real-Time PCR system
(Thermo Fisher Scientific, Inc.) using the following thermocycling
conditions: 95°C for 30 sec, followed by 40 cycles of 95°C for 5
sec and 60°C for 34 sec, 95°C for 15 sec, 60°C for 60 sec and 95°C
for 15 sec. The primer sequences used were as follows: β-actin
forward, 5′-CTAACTTGCGCAGAAAACAAGAT-3′ and reverse,
5′-TTCCTGTAACAACGCATCTCATA-3′; and NMDAR1 forward,
5′-CGCCAACTACAGCATCAT-3′ and reverse, 5′-ATCGTCACAATCTTCAGTCT-3′.
β-actin was used as the reference gene. The relative gene
expression levels were represented as ΔΔ quantification cycle
(ΔΔCq) and the fold change of gene expression was calculated via
the 2−ΔΔCq method (30).
Experiments were repeated in triplicate.
Statistical analysis
GraphPad Prism version 6 (GraphPad Software, Inc.,
La Jolla, CA, USA) was used for statistical analysis. Measurement
data are expressed as the mean ± standard error. One-way analysis
of variance and Turkey's multiple comparisons test was used to
compare differences between groups. The Wilcoxon rank sum test was
used to compare differences among other types of data, including
the percentage of apoptotic cells. P<0.05 was considered to
indicate a statistically significant difference.
Results
Daily ethanol volatilization
The ethanol volatilization per 24 h from
25-cm2 flasks containing 5 ml culture medium with
ethanol are presented in the Table
II.
| Table II.Daily ethanol volatilization. |
Table II.
Daily ethanol volatilization.
| Groups | % daily ethanol
volatilization (mean ± standard error) |
|---|
| 50 mM ethanol | 19.57±1.37 |
| 100 mM ethanol | 22.12±1.07 |
| 200 mM ethanol | 24.57±0.60 |
| 400 mM ethanol | 27.55±1.01 |
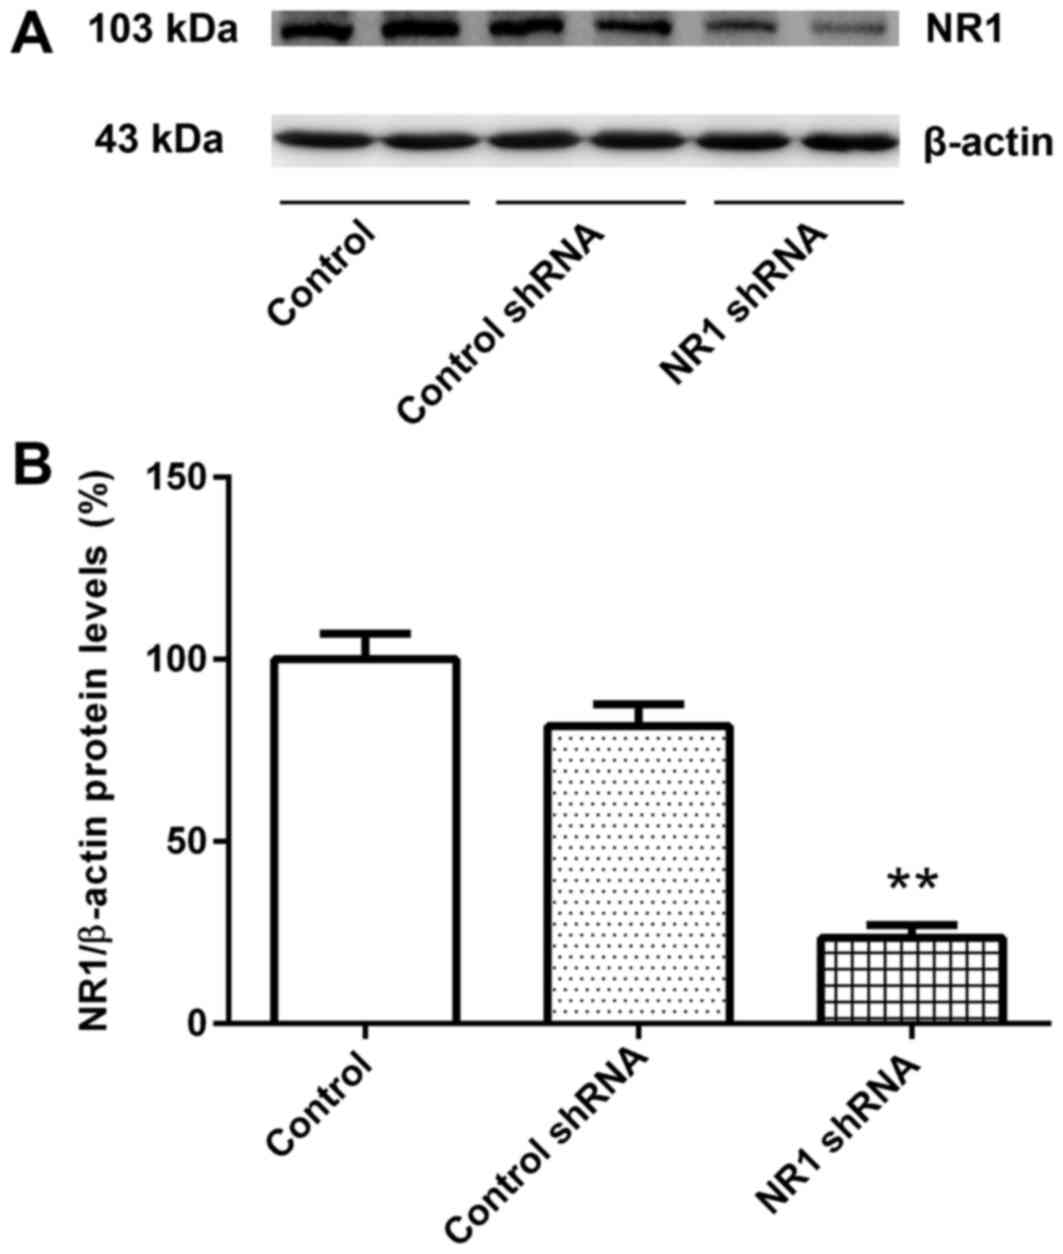
Transfection efficiency for RNAi
The relative expression levels of NR1 protein in the
untransfected group and control shRNA group were similar (Fig. 1A and B). Compared with the control
group, the relative NR1 protein expression level in the NR1 shRNA
group was significantly lower (Fig. 1A
and B). These results suggested that RNAi was successful and
cells transfected with NR1 shRNA and control shRNA were used for
subsequent experiments.
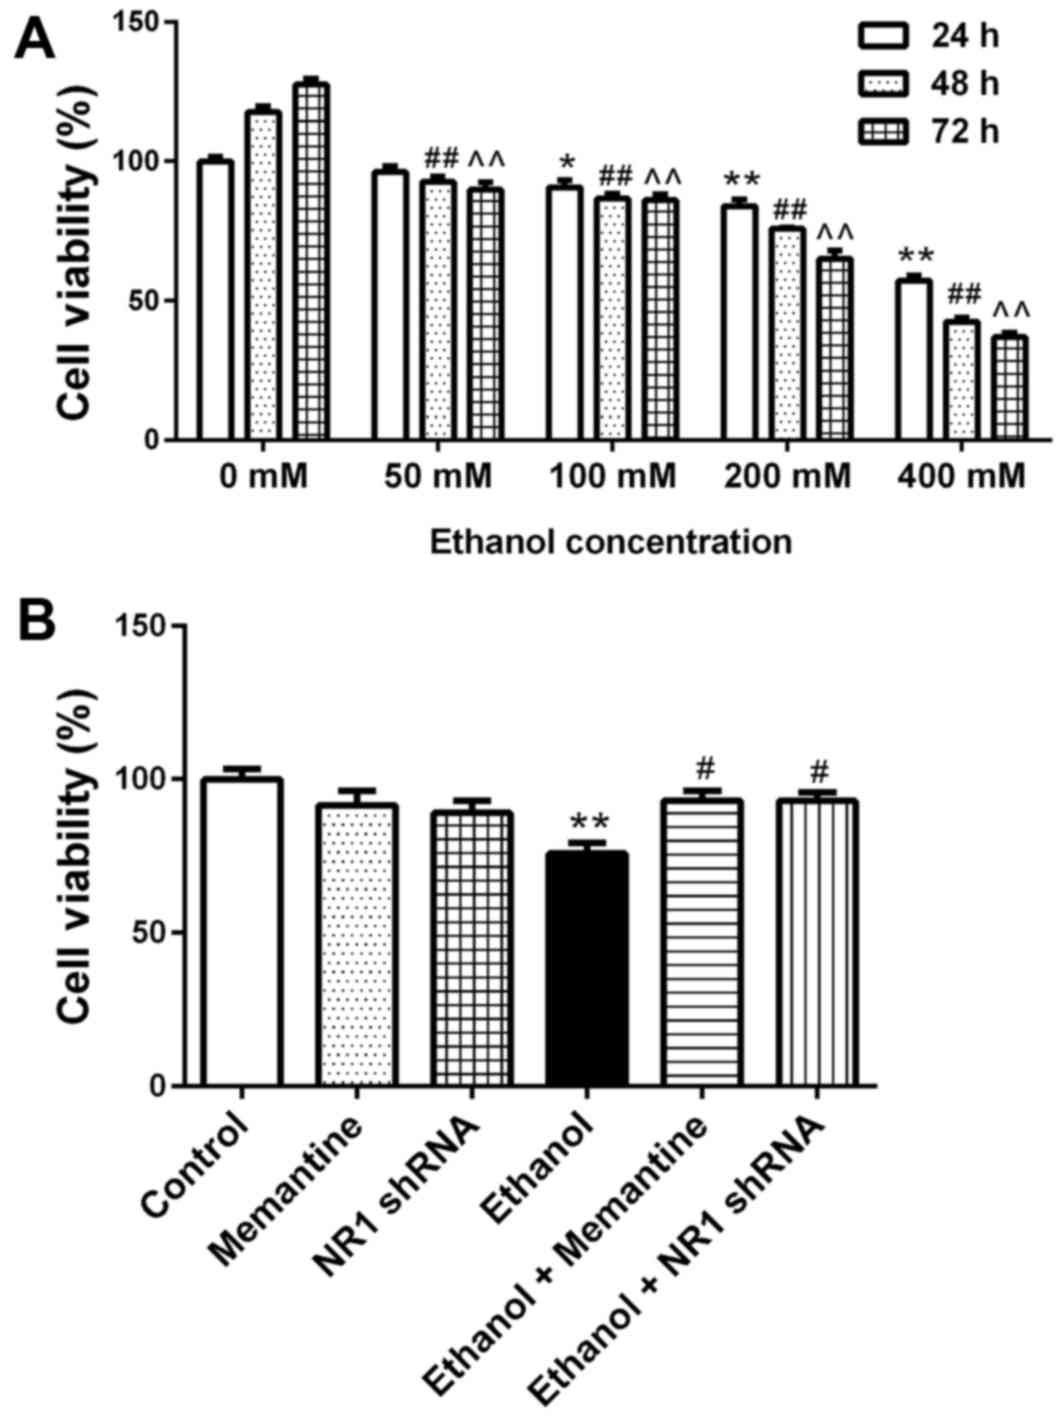
SK-N-SH cell activity decreases
following chronic ethanol exposure and the effect is attenuated by
memantine and downregulation of NR1 protein
SK-N-SH cells were treated with increasing
concentrations of ethanol for 24–72 h and then cell viability was
measured. Compared with the 24 h/0 mM ethanol group, cell viability
decreased with increasing ethanol concentration and time (Fig. 2A). Compared with the control group,
the cell viability of the ethanol groups was significantly lower.
Compared with the ethanol group, the cell viability of the ethanol
+ memantine and ethanol + NR1 shRNA groups was significantly higher
(Fig. 2B).
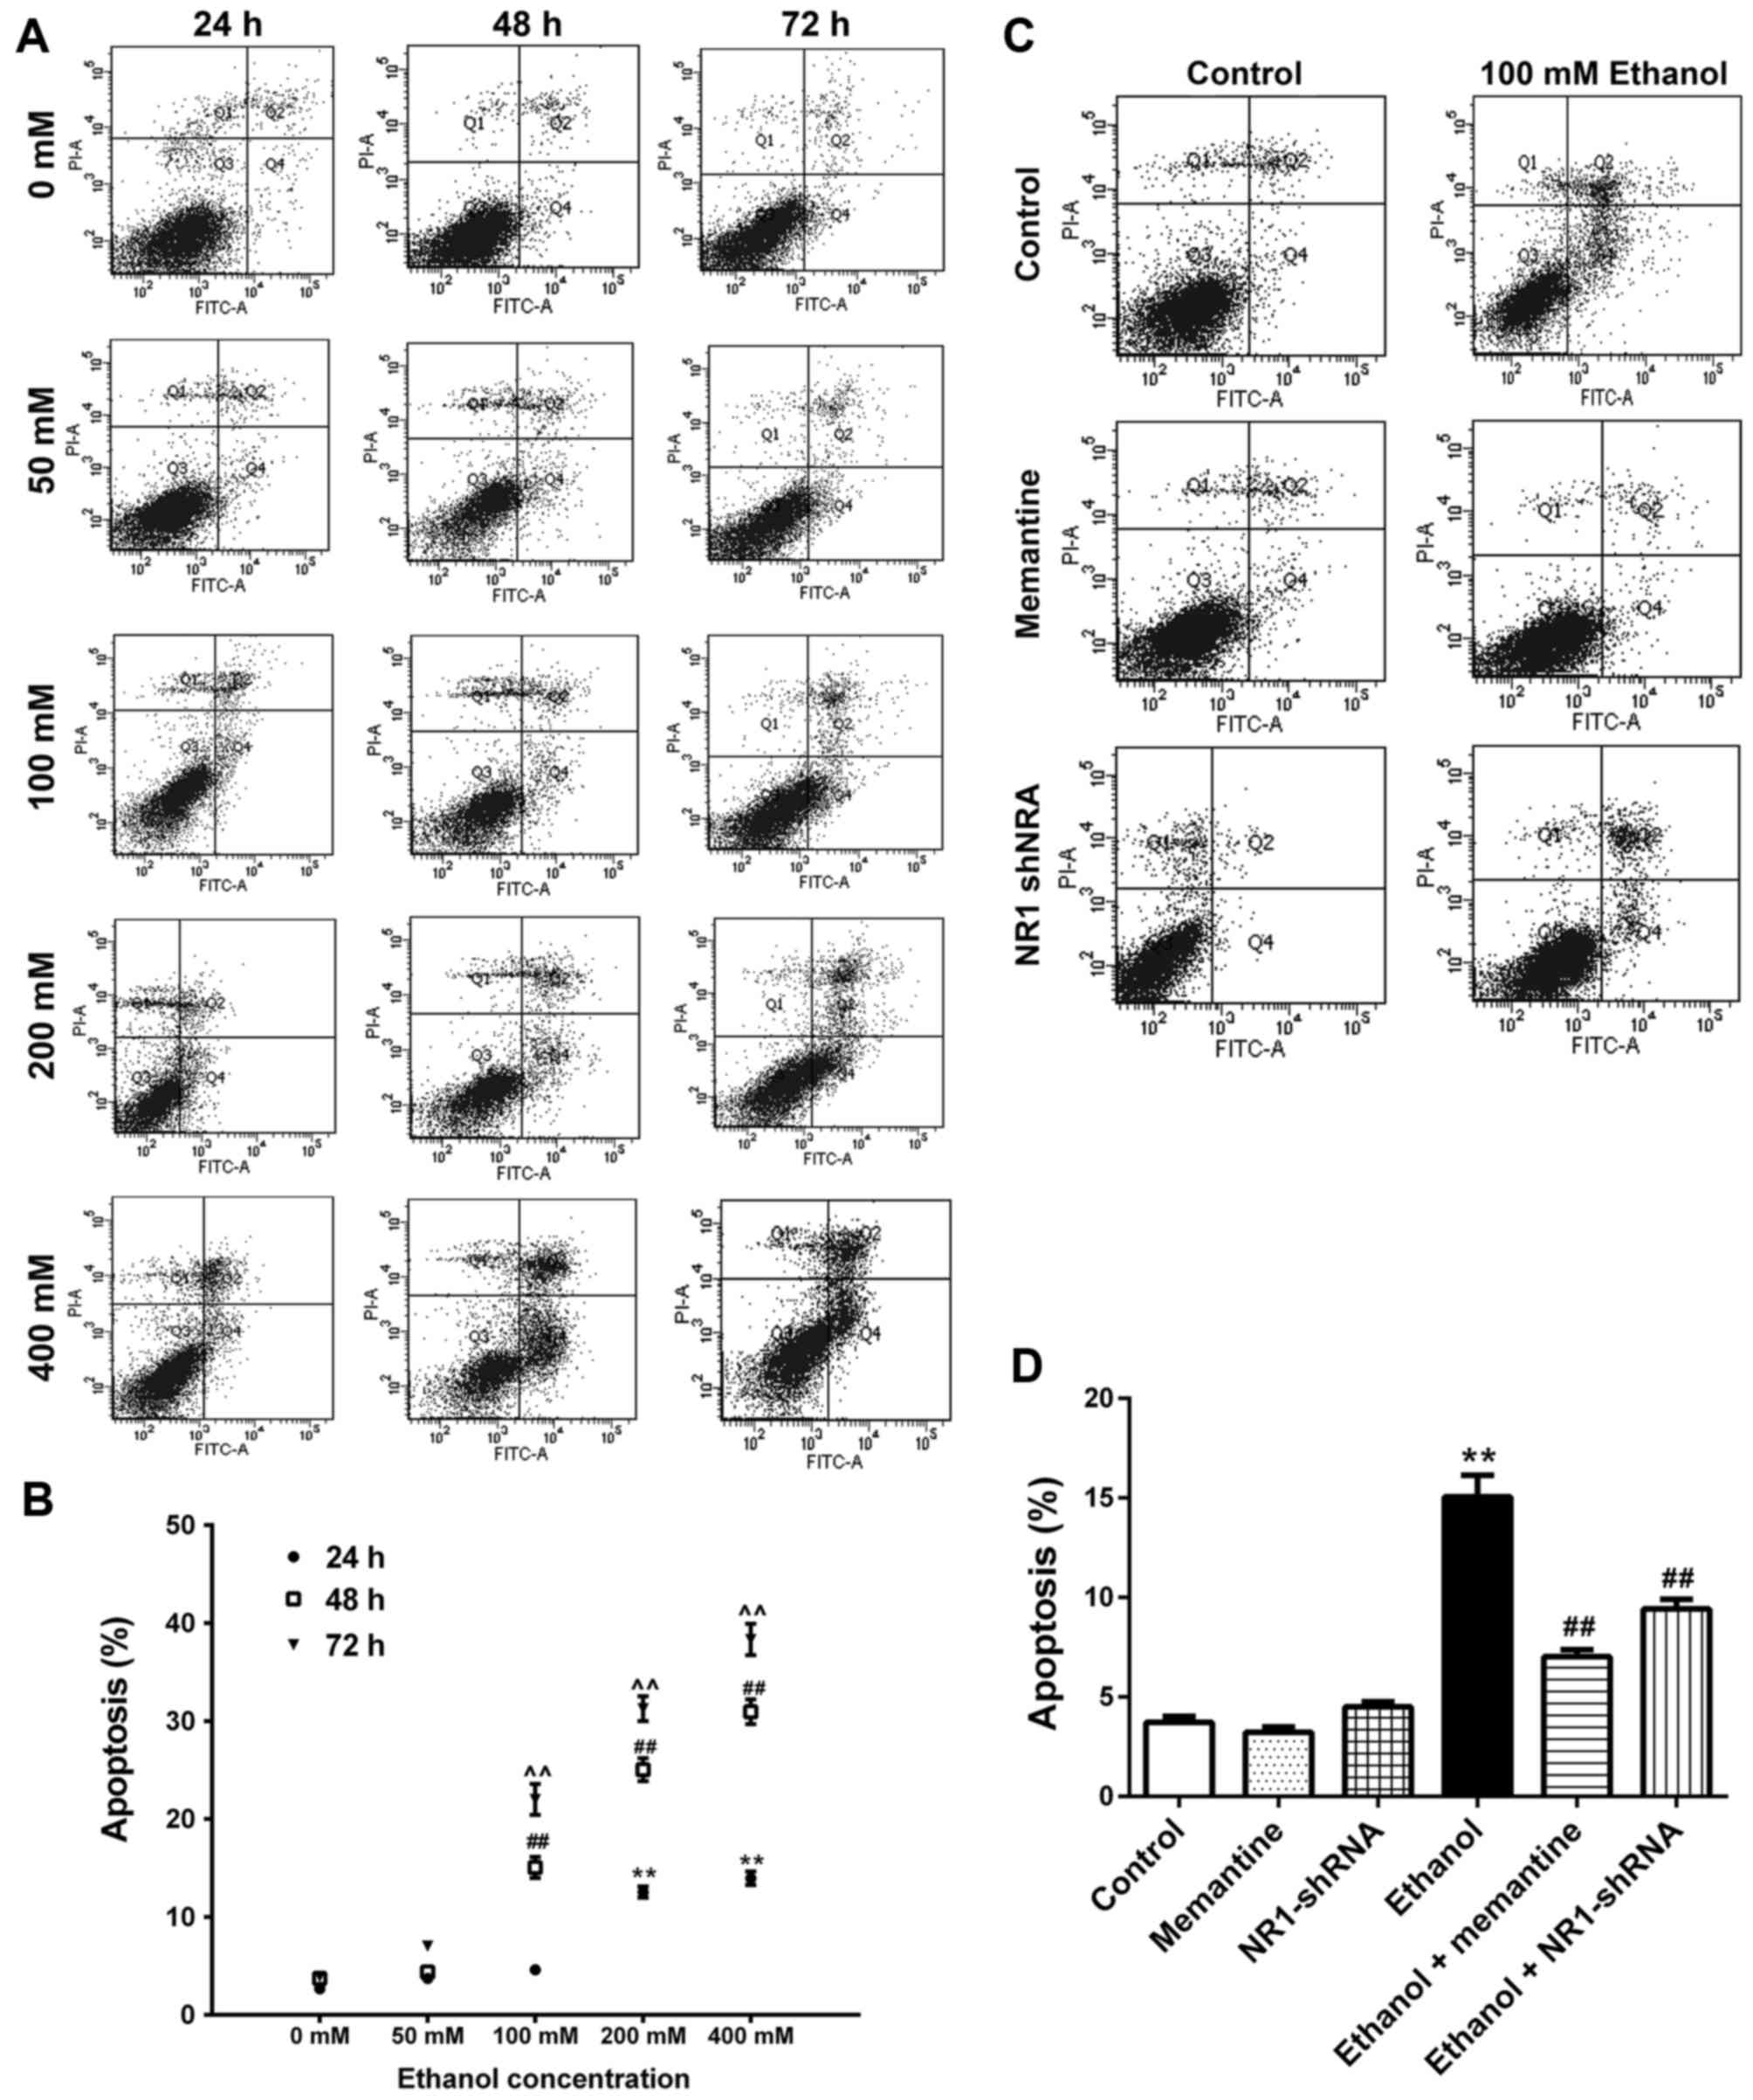
Apoptosis of SK-N-SH cells increases
following chronic ethanol exposure and the effect is attenuated by
memantine and downregulation of the NR1 protein
SK-N-SH cells were treated with increasing
concentrations of ethanol for 24–72 h. Annexin V-FITC/PI double
staining was used to detect the apoptotic rate of cells. Apoptotic
cells included early apoptotic and late apoptotic cells (Fig. 3A and B; Table III). Compared with the 0 mM ethanol
groups at 24, 48 and 72 h, apoptosis was increased gradually with
increasing ethanol concentration and time (Fig. 3A and B). Compared with the control
group, apoptosis of the ethanol group was significantly higher.
Compared with the ethanol group, apoptosis of the ethanol +
memantine and ethanol + NR1 shRNA groups were significantly lower
(Fig. 3C and D).
| Table III.Analysis of apoptosis in each
group. |
Table III.
Analysis of apoptosis in each
group.
| Groups | % cell apoptosis
(mean ± standard error) |
|---|
| 24 h |
|
|
Control |
2.66±0.19 |
| 50 mM
ethanol |
3.72±0.13 |
| 100 mM
ethanol |
4.60±0.25 |
| 200 mM
ethanol |
12.54±0.58a |
| 400 mM
ethanol |
13.96±0.70a |
| 48 h |
|
|
Control |
3.72±0.30 |
|
Memantine |
3.22±0.27 |
| NR1
shRNA |
4.50±0.25 |
| 50 mM
ethanol |
4.36±0.42 |
| 100 mM
ethanol |
15.06±1.08a |
| 100 mM
ethanol + memantine |
7.02±0.35b |
| 100 mM
ethanol + NR1 shRNA |
9.42±0.48b |
| 200 mM
ethanol |
25.04±1.18a |
| 400 mM
ethanol |
30.94±1.28a |
| 72 h |
|
|
Control |
3.92±0.55 |
| 50 mM
ethanol |
7.04±0.51 |
| 100 mM
ethanol |
22.00±1.59a |
| 200 mM
ethanol |
31.26±1.26a |
| 400 mM
ethanol |
38.32±1.62a |
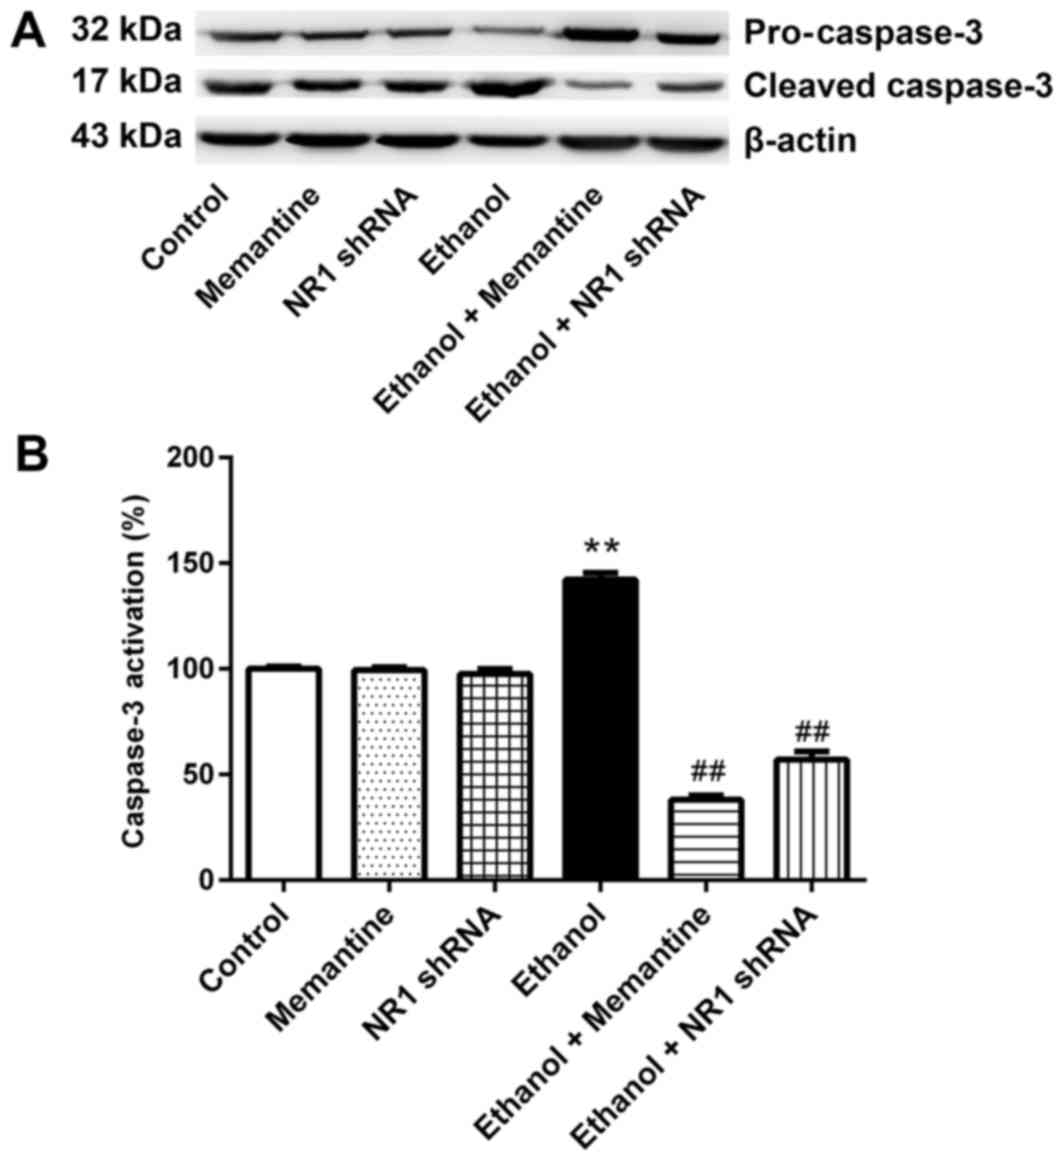
Memantine and downregulation of NR1
protein attenuates activation of the caspase-3 protein induced by
ethanol
Western blotting revealed that the expression of
cleaved caspase-3 was higher in the ethanol group compared with the
control group, whereas expression of cleaved caspase-3 was
significantly lower in the ethanol + memantine and ethanol + NR1
shRNA groups compared with the ethanol group (Fig. 4A and B).
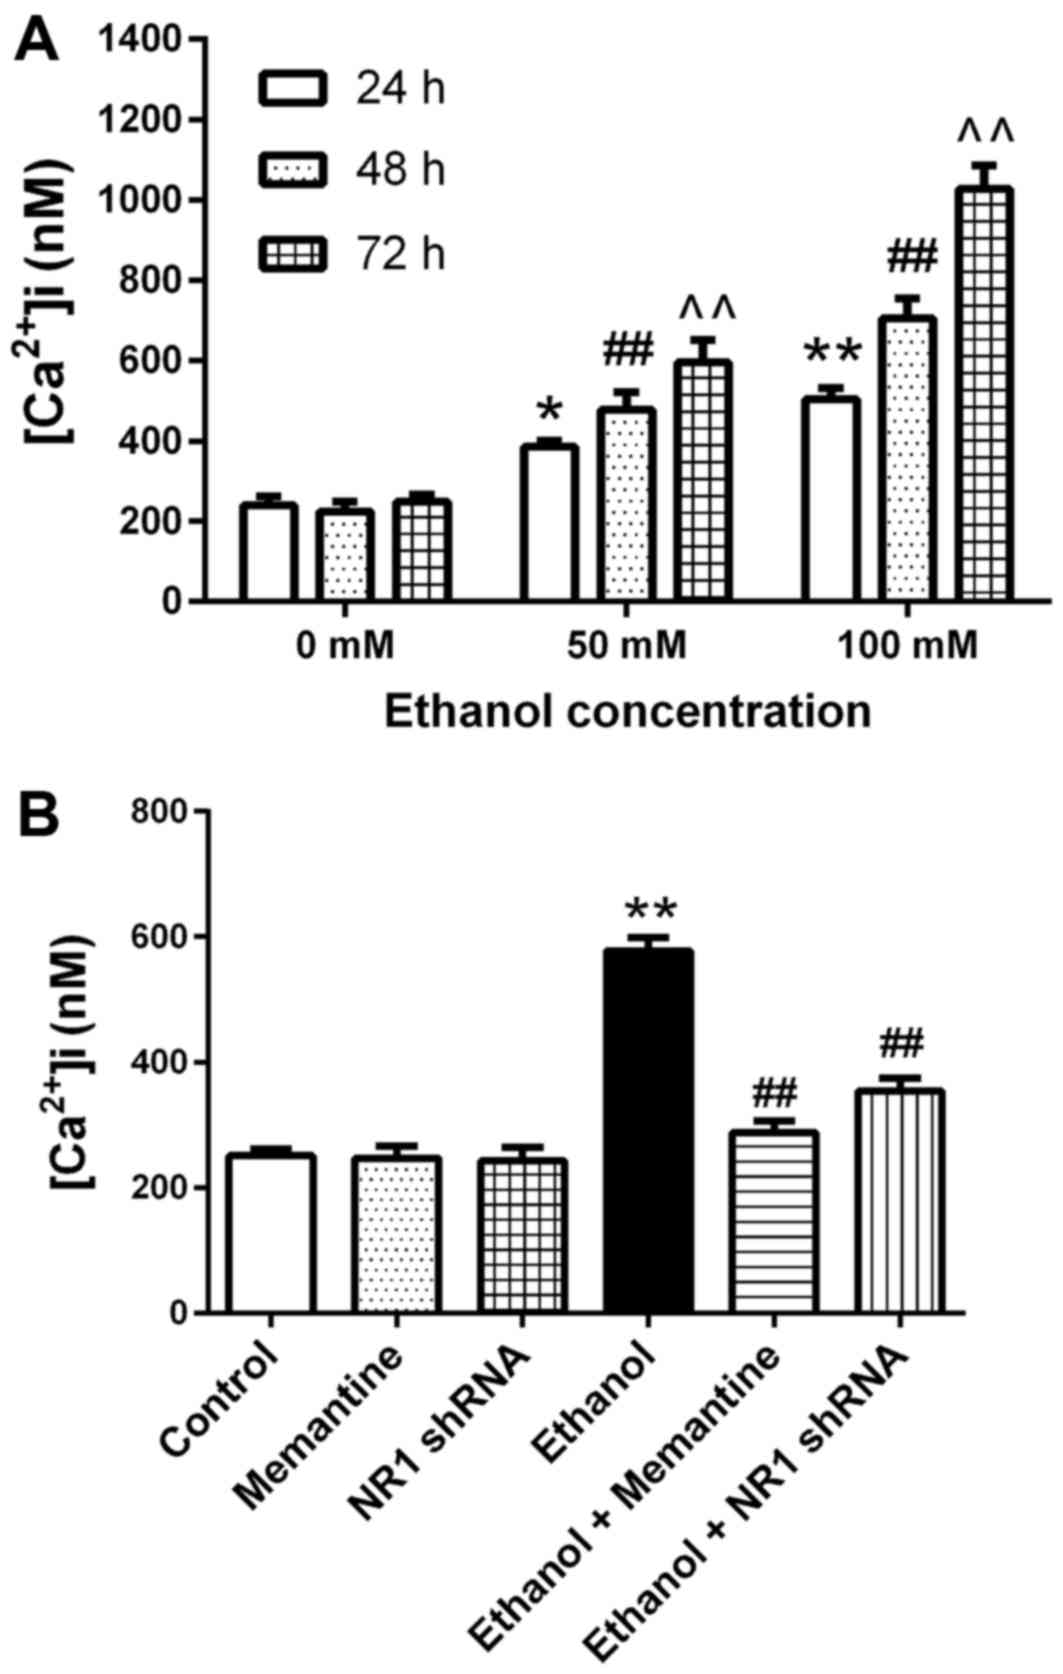
Ca2+ concentrations in
SK-N-SH cells increase following chronic ethanol exposure and the
effect is attenuated by memantine and downregulation of the NR1
protein
Compared with the 0 mM ethanol groups at 24–72 h,
the mean intracellular Ca2+ concentration increased with
increasing ethanol exposure concentration and time (Fig. 5A). Compared with the control group,
the mean intracellular calcium concentration in the ethanol group
was significantly higher. Compared with the ethanol group, the mean
intracellular calcium concentration in the ethanol + memantine and
ethanol + NR1 shRNA groups was significantly lower (Fig. 5B).
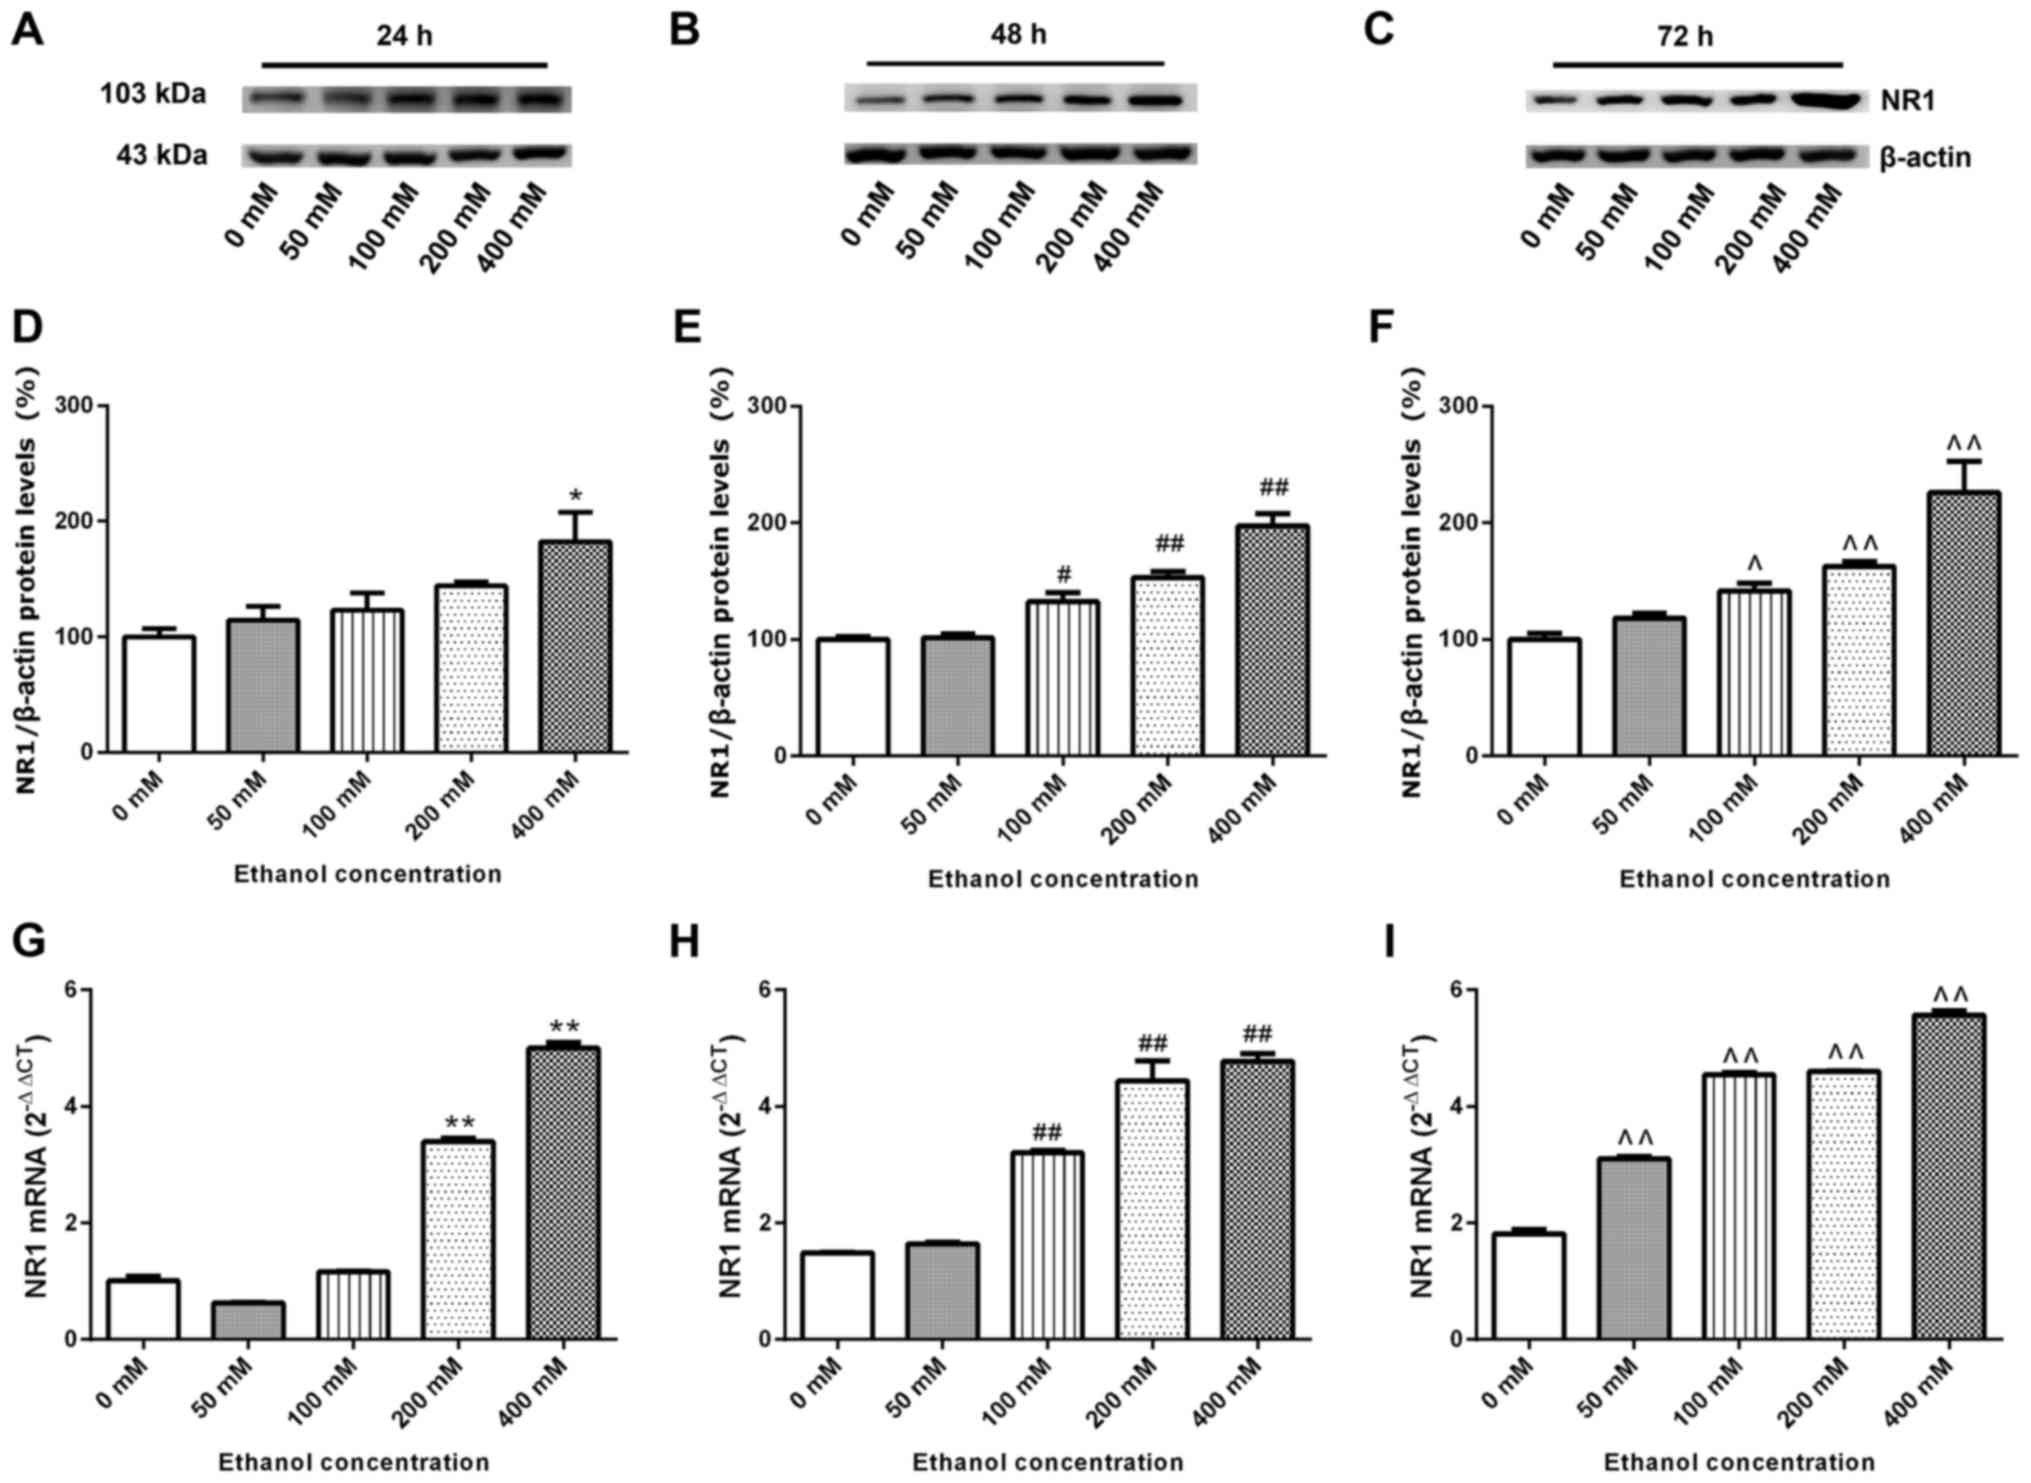
NR1 protein and mRNA expression levels
in SK-N-SH cells increase following chronic ethanol exposure
SK-N-SH cells were treated with increasing
concentrations of ethanol for 24–72 h. Whole proteins were
extracted for western blotting and the relative expression levels
of the NR1 protein was detected. β-actin was used as the internal
reference. Compared with the 0 mM ethanol groups at 24–72 h,
relative expression levels of the NR1 protein increased with
increasing ethanol concentration and time (Fig. 6A-F). SK-N-SH cells were treated with
increasing concentrations of ethanol for 24–72 h, and then the
relative expression levels of NR1 mRNA were measured via RT-qPCR.
Fig. 6G-I demonstrate that, compared
with the 0 mM ethanol groups at 24, 48 and 72 h, the relative mRNA
expression of NR1 increased gradually (excluding the 50 mM group at
24 h) with increasing ethanol concentration and time (P<0.05;
Fig. 6G-I).
Discussion
Previous studies have indicated that light, moderate
to chronic or acute ethanol consumption may reduce neuron death and
exhibit potentially neuroprotective effects (31,32). But
most studies have reported nerve cell degeneration, apoptosis and
reduced densities in deceased individuals who succumb to chronic
ethanol poisoning, as well as in experimental animals and cultured
cells that undergo chronic ethanol exposure (33,34).
These findings indicated that ethanol induces nerve cell apoptosis
via a number of mechanisms (35). It
has previously been speculated that ethanol causes neuronal ATP
metabolic disorders and calcium overload by decreasing cytochrome
oxidase activity (36). Ethanol
under the action of dehydrogenase and aldehyde dehydrogenase
produce oxygen-free radicals that damage nerve cell DNA (37). As such, there is a strong interest in
studies assessing ethanol neurotoxicity. However, due to the
self-repair of cells and volatility of ethanol, the underlying
mechanism of chronic ethanol exposure during apoptosis of cultured
neurons in vitro remains unclear (38,39). A
previous study has suggested that the use of siRNAs to downregulate
gene expression of NMDAR, IP3 receptor or sarco/endoplasmic
reticulum calcium adenosine triphosphatase ATP-1 (SERCA1), or
pre-administration of non-competitive NMDAR antagonist, memantine,
inhibit intracellular Ca2+ release, thereby inhibiting
the activation of caspase-3 induced by isoflurane to control and
reduce the occurrence of neuronal apoptosis (26). To the best of our knowledge, no
previous studies have assessed the relationship between ethanol,
NMDAR, intracellular Ca2+ and apoptosis. The present
study therefore speculated that an abnormal intracellular
Ca2+ transport pathway is of great importance in
ethanol-induced neuronal cell apoptosis.
In the present study, SK-N-SH human neuroblastoma
cells were used to examine whether ethanol-induced apoptosis was
associated with NMDAR and intracellular calcium. SK-N-SH cells have
been used in a previous study of neuronal cell apoptosis (40). Ethanol has strong volatility and many
in vitro studies of ethanol exposure have investigated the
effect of ethanol on cells cultured for a short period of time
(41,42). In a preliminary experiment, it was
observed that due to its strong volatility, ethanol is unable to
maintain relatively stable concentrations, which is accompanied by
a compensatory response of self-protection by SK-N-SH cells.
Therefore, the present study performed an ethanol volatilization
experiment to ensure maintenance of chronic ethanol exposure.
Compared with the control group, an increase was
observed in NR1 protein expression, mean intracellular
Ca2+ concentration and apoptotic rate of SK-N-SH cells,
and a decrease was observed in in cell viability. It was also
demonstrated that with greater exposure concentration and duration
of ethanol to SK-N-SH cells, the degree of cell damage was
increased. These results indicated successful establishment of the
chronic ethanol exposure model in SK-N-SH cells and confirmed that
expression of the NR1 protein in SK-N-SH cells was increased by
chronic ethanol exposure. As the expression of NR1 protein
increased, the intracellular calcium concentration also increased.
This suggested that the effects of chronic ethanol exposure may be
mediated via the NMDAR-mediated calcium transport pathway to
increase the intracellular calcium concentration in SK-N-SH cells.
High intracellular calcium may activate apoptosis and reduce cell
viability and proliferation.
To support the above speculation, SK-N-SH cells were
treated with 100 mM ethanol for 48 h and then with the
noncompetitive NMDAR antagonist, memantine, at 4 µM. In addition,
the expression levels of the NR1 gene in SK-N-SH cells was
downregulated by NR1 shRNA. The results revealed an increase in the
mean Ca2+ concentration, of cleaved caspase-3 and
apoptosis, and a decrease in cell viability of the ethanol group
compared with the control group. Compared with the ethanol group,
there were decreases in the mean intracellular Ca2+
concentration, expression of cleaved caspase-3 and apoptotic rate,
and an increase in the cell viability of the ethanol + memantine
and ethanol + NR1 shRNA groups.
However, the present study also observed that
shRNA-mediated downregulation of NR1 protein expression and
non-competitive antagonism by memantine did not completely reverse
the increase in the intracellular Ca2+ concentration,
increase in apoptosis, or the decrease of cell viability and other
neurotoxic effects caused by chronic ethanol exposure in neuronal
cells. These results suggested that the neurotoxicity caused by
chronic ethanol exposure is not limited to its effect on NMDAR, but
also involves a variety of mechanisms working together. The
mechanism of cellular damage caused by chronic ethanol exposure to
neuronal cells is complex. Therefore, a follow-up study of IP3R
(43), SERCA1 (44) and other proteins associated with
Ca2+ transport pathway and other signaling pathways
associated with neuronal cell damage, will be investigated in
future studies.
In conclusion, chronic ethanol exposure inhibited
neuronal cell viability and caused apoptosis of neuronal SK-N-SH
cells, and the extent of damage in SK-N-SH cells was associated
with ethanol exposure concentration and duration. In addition,
chronic ethanol exposure induced expression of NMDAR and increased
the concentration of intracellular Ca2+ in SK-N-SH
cells, resulting in apoptosis. Memantine had a protective effect
against damage in SK-N-SH cells. The results of the present study
indicate that the application of memantine may provide a novel
strategy in the treatment of alcoholic dementia. However, future
studies should be conducted in vivo using animals to assess
the effects of ethanol on the brain, including in learning and
memory.
Acknowledgements
The authors of the present study thank Mr. M. Arico
from Liwen Bianji, Edanz Group China (www.liwenbianji.cn/ac), for editing the English of
this manuscript.
Funding
The present study was supported by the National
Natural Science Foundation of China (grant no. 81172904), Natural
Science Foundation of Liaoning Province, China (grant no.
201102299), Shenyang Scientific and Technological Plan, China
(grant no. F11-264-1-67) and the Program for Medical Teaching and
Science Research of China Medical University, the 13th Five-Year
Plan (grant no. YDJK2016034).
Availability of data and materials
The analyzed data sets generated during the present
study are available from the corresponding author on reasonable
request.
Authors' contributions
The work presented here was carried out in
collaboration between all authors. GZ and RZ collaborated to design
the study. HW, XW, YL, HY and JC the designed methods and
experiments. HW, CW, GX and JY carried out the laboratory
experiments. CF and PW analyzed the data. HW, XW and YL drafted the
manuscript. XW, RZ and GZ provided critical revision and
contributed to the interpretation of findings. All authors have
contributed to, read and approved the manuscript.
Ethics approval and consent to
participate
Not applicable.
Consent for publication
Not applicable.
Competing interests
The authors declare that they have no competing
interests.
Glossary
Abbreviations
Abbreviations:
|
NMDAR
|
N-methyl-D-aspartic acid receptor
|
|
IP3
|
inositol 1, 4,5-trisphosphate
|
|
SERCA
|
sarco/endoplasmic reticulum calcium
adenosine triphosphatase ATP
|
|
shRNA
|
short hairpin RNA
|
|
HBSS
|
Hank's balanced salt solution
|
|
PI
|
propidium iodide
|
|
TBS-T
|
Tris-buffered saline containing 0.05%
Tween-20
|
|
Cq
|
quantification cycle
|
References
|
1
|
Masaki T, Mochizuki H, Matsushita S,
Yokoyama A, Kamakura K and Higuchi S: Association of aldehyde
dehydrogenase-2 polymorphism with alcoholic polyneuropathy in
humans. Neurosci Lett. 363:288–290. 2004. View Article : Google Scholar : PubMed/NCBI
|
|
2
|
Johansson S, Ekström TJ, Marinova Z,
Okvist A, Sheedy D, Garrick T, Harper C, Kuzmin A, Yakovleva T and
Bakalkin G: Dysregulation of cell death machinery in the prefrontal
cortex of human alcoholics. Int J Neuropsychopharmacol. 12:109–115.
2009. View Article : Google Scholar : PubMed/NCBI
|
|
3
|
McVicker BL, Tuma DJ, Kharbanda KK, Kubik
JL and Casey CA: Effect of chronic ethanol administration on the in
vitro production of proinflammatory cytokines by rat kupffer cells
in the presence of apoptotic cells. Alcohol Clin Exp Res.
31:122–129. 2007. View Article : Google Scholar : PubMed/NCBI
|
|
4
|
Crews F, Nixon K, Kim D, Joseph J,
Shukitt-Hale B, Qin L and Zou J: BHT blocks NF-kappaB activation
and ethanol-induced brain damage. Alcohol Clin Exp Res.
30:1938–1949. 2006. View Article : Google Scholar : PubMed/NCBI
|
|
5
|
Wang Y, Seitz HK and Wang X: Moderate
alcohol consumption aggravates high-fat diet induced
steatohepatitis in rats. Alcohol Clin Exp Res. 34:567–573. 2010.
View Article : Google Scholar : PubMed/NCBI
|
|
6
|
Akane K, Kojima S, Mak TW, Shiku H and
Suzuki H: CD8+CD122+CD49dlow regulatory T
cells maintain T-cell homeostasis by killing activated T cells via
Fas/FasL-mediated cytotoxicity. Proc Natl Acad Sci USA.
113:2460–2465. 2016. View Article : Google Scholar : PubMed/NCBI
|
|
7
|
Jeong JB, Choi J, Lou Z, Jiang X and Lee
S: Patchouli alcohol, an essential oil of Pogostemoncablin,
exhibits anti-tumorigenic activity in human colorectal cancer
cells. Int Immunopharmacol. 16:184–190. 2013. View Article : Google Scholar : PubMed/NCBI
|
|
8
|
Zou J and Crews F: Induction of innate
immune gene expression cascades in brain slice cultures by ethanol:
Key role of NF-κB and proinflammatory cytokines. Alcohol Clin Exp
Res. 34:777–789. 2010. View Article : Google Scholar : PubMed/NCBI
|
|
9
|
Baykara B, Micili SC, Tugyan K, Tekmen I,
Bagriyanik H, Sonmez U, Sonmez A, Oktay G, Yener N and Ozbal S: The
protective effects of carnosine in alcohol-induced hepatic injury
in rats. Toxicol Ind Health. 30:25–32. 2014. View Article : Google Scholar : PubMed/NCBI
|
|
10
|
Bolnick JM, Karana R, Chiang PJ, Kilburn
BA, Romero R, Diamond MP, Smith SM and Armant DR: Apoptosis of
alcohol-exposed human placental cytotrophoblast cells is downstream
of intracellular calcium signaling. Alcohol Clin Exp Res.
38:1646–1653. 2014. View Article : Google Scholar : PubMed/NCBI
|
|
11
|
Grynkiewicz G, Poenie M and Tsien RY: A
new generation of Ca2+ indicators with greatly improved
fluorescence properties. J Biol Chem. 260:3440–3450.
1985.PubMed/NCBI
|
|
12
|
La Rovere RM, Roest G, Bultynck G and
Parys JB: Intracellular Ca(2+) signaling and Ca(2+) microdomains in
the control of cell survival, apoptosis and autophagy. Cell
Calcium. 60:74–87. 2016. View Article : Google Scholar : PubMed/NCBI
|
|
13
|
MacDermott AB, Mayer ML, Westbrook GL,
Smith SJ and Barker JL: NMDA-receptor activation increases
cytoplasmic calcium concentration in cultured spinal cord neurones.
Nature. 321:519–522. 1986. View
Article : Google Scholar : PubMed/NCBI
|
|
14
|
Finch EA, Turner TJ and Goldin SM: Calcium
as a coagonist of inositol 1,4,5-trisphosphate-induced calcium
release. Science. 252:443–446. 1991. View Article : Google Scholar : PubMed/NCBI
|
|
15
|
Bezprozvanny I, Watras J and Ehrlich BE:
Bell-shaped calcium-response curves of Ins(1,4,5)P3- and
calcium-gated channels from endoplasmic reticulum of cerebellum.
Nature. 351:751–754. 1991. View
Article : Google Scholar : PubMed/NCBI
|
|
16
|
Flatscher-Bader T and Wilce PA: Impact of
alcohol abuse on protein expression of midkineand excitatory amino
acid transporter 1 in the human prefrontal cortex. Alcohol Clin Exp
Res. 32:1849–1858. 2008. View Article : Google Scholar : PubMed/NCBI
|
|
17
|
Sattler R and Tymianski M: Molecular
mechanisms of calcium-dependent excitotoxicity. J Mol Med (Berl).
78:3–13. 2000. View Article : Google Scholar : PubMed/NCBI
|
|
18
|
Pérez-Otaño I and Ehlers MD: Homeostatic
plasticity and NMDA receptor trafficking. Trends Neurosci.
28:229–238. 2005. View Article : Google Scholar : PubMed/NCBI
|
|
19
|
Lau CG and Zukin RS: NMDA receptor
trafficking in synaptic plasticity and neuropsychiatric disorders.
Nat Rev Neurosci. 8:413–426. 2007. View Article : Google Scholar : PubMed/NCBI
|
|
20
|
Glue P and Nutt D: Overexcitement and
disinhibition. Dynamic neurotransmitter interactions in alcohol
withdrawal. Br J Psychiatry. 157:491–499. 1990. View Article : Google Scholar : PubMed/NCBI
|
|
21
|
Addolorato G, Mirijello A, Leggio L,
Ferrulli A and Landolfi R: Management of alcohol dependence in
patients with liver disease. CNS Drugs. 27:287–299. 2013.
View Article : Google Scholar : PubMed/NCBI
|
|
22
|
Petralia RS, Wang YX, Hua F, Yi Z, Zhou A,
Ge L, Stephenson FA and Wenthold RJ: Corrigendum to organization of
NMDA receptors at extrasynaptic locations. Neuroscience. 167:68–87.
2010. View Article : Google Scholar : PubMed/NCBI
|
|
23
|
Vicini S, Wang JF, Li JH, Zhu WJ, Wang YH,
Luo JH, Wolfe BB and Grayson DR: Functional and pharmacological
differences between recombinant N-methyl-D-aspartate receptors. J
Neurophysiol. 79:555–566. 1998. View Article : Google Scholar : PubMed/NCBI
|
|
24
|
Chiu J, Brien JF, Wu P, Eubanks JH, Zhang
L and Reynolds JN: Chronic ethanol exposure alters MK-801 binding
sites in the cerebral cortex of the near-term fetal guinea pig.
Alcohol. 17:215–221. 1999. View Article : Google Scholar : PubMed/NCBI
|
|
25
|
Devaud LL, Morrow AL and Nguyen UT:
Ovariectomy has minimal effects on neuroadaptations associated with
ethanol dependence in female rats. Neurochem Int. 37:433–442. 2000.
View Article : Google Scholar : PubMed/NCBI
|
|
26
|
Zhang G, Dong Y, Zhang B, Ichinose F, Wu
X, Culley DJ, Crosby G, Tanzi RE and Xie Z: Isoflurane-induced
caspase-3 activation is dependent on cytosolic calcium and can be
attenuated by memantine. J Neurosci. 28:4551–4560. 2008. View Article : Google Scholar : PubMed/NCBI
|
|
27
|
Wasfi IA, Al-Awadhi AH, Al-Hatali ZN,
Al-Rayami FJ and Al Katheeri NA: Rapid and sensitive static
headspace gas chromatography-mass spectrometry method for the
analysis of ethanol and abused inhalants in blood. J Chromatogr B
Analyt Technol Biomed Life Sci. 799:331–336. 2004. View Article : Google Scholar : PubMed/NCBI
|
|
28
|
Joshi R, Tawfik A, Edeh N, McCloud V,
Looney S, Lewis J, Hsu S and Ogbureke KU: Dentin
sialophosphoprotein (DSPP) gene-silencing inhibits key tumorigenic
activities in human oral cancer cell line, OSC2. PLoS One.
5:e139742010. View Article : Google Scholar : PubMed/NCBI
|
|
29
|
Wang P, Wang Q, Yang L, Qin QL and Wu YJ:
Characterization of lysophosphatidylcholine-induced changes of
intracellular calcium in Drosophila S2 cells. Life Sci. 131:57–62.
2015. View Article : Google Scholar : PubMed/NCBI
|
|
30
|
Livak KJ and Schmittgen TD: Analysis of
relative gene expression data using real-time quantitative PCR and
the 2(-Delta Delta C(T)) method. Methods. 25:402–408. 2001.
View Article : Google Scholar : PubMed/NCBI
|
|
31
|
Qi SH, Liu Y, Hao LY, Guan QH, Gu YH,
Zhang J, Yan H, Wang M and Zhang GY: Neuroprotection of ethanol
against ischemia/reperfusion-induced brain injury through
decreasing c-Jun N-terminal kinase 3 (JNK3) activation by enhancing
GABA release. Neuroscience. 167:1125–1137. 2010. View Article : Google Scholar : PubMed/NCBI
|
|
32
|
Nazam Ansari M, Bhandari U, Islam F and
Tripathi CD: Evaluation of antioxidant and neuroprotective effect
of ethanolic extract of Embelia ribes Burm in focal cerebral
ischemia/reperfusion-induced oxidative stress in rats. Fundam Clin
Pharmacol. 22:305–314. 2008. View Article : Google Scholar : PubMed/NCBI
|
|
33
|
Hwang DW, Givens B and Nishijima I:
Ethanol-induced developmental neurodegeneration in secretin
receptor-deficient mice. Neuroreport. 20:698–701. 2009. View Article : Google Scholar : PubMed/NCBI
|
|
34
|
Oliveira-da-Silva A, Vieira FB,
Cristina-Rodrigues F, Filgueiras CC, Manhães AC and Abreu-Villaça
Y: Increased apoptosis and reduced neuronal and glial densities in
the hippocampus due to nicotine and ethanol exposure in adolescent
mice. Int J Dev Neurosci. 27:539–548. 2009. View Article : Google Scholar : PubMed/NCBI
|
|
35
|
Harper C: The neuropathology of
alcohol-related brain damage. Alcohol Alcohol. 44:136–140. 2009.
View Article : Google Scholar : PubMed/NCBI
|
|
36
|
Mooney SM and Miller MW: Effects of
prenatal exposure to ethanol on the expression of bcl-2, bax and
caspase 3 in the developing rat cerebral cortex and thalamus. Brain
Res. 911:71–81. 2001. View Article : Google Scholar : PubMed/NCBI
|
|
37
|
Brooks PJ: Brain atrophy and neuronal loss
in alcoholism: A role for DNA damage? Neurochem Int. 37:403–412.
2000. View Article : Google Scholar : PubMed/NCBI
|
|
38
|
Kumral A, Tugyan K, Gonenc S, Genc K, Genc
S, Sonmez U, Yilmaz O, Duman N, Uysal N and Ozkan H: Protective
effects of erythropoietin against ethanol-induced apoptotic
neurodegenaration and oxidative stress in the developing C57BL/6
mouse brain. Brain Res Dev Brain Res. 160:146–156. 2005. View Article : Google Scholar : PubMed/NCBI
|
|
39
|
Mooney SM and Miller MW: Nerve growth
factor neuroprotection of ethanol-induced neuronal death in rat
cerebral cortex is age dependent. Neuroscience. 149:372–381. 2007.
View Article : Google Scholar : PubMed/NCBI
|
|
40
|
Li Y, Li R, Zhu S, Zhou R, Wang L, DU J,
Wang Y, Zhou B and Mai L: Cordycepin induces apoptosis and
autophagy in human neuroblastoma SK-N-SH and BE(2)-M17 cells. Oncol
Lett. 9:2541–2547. 2015. View Article : Google Scholar : PubMed/NCBI
|
|
41
|
Hurley MM, Martin D and Raisz LG: Changes
in ethanol concentration during incubation in multiwell tissue
culture trays. Proc Soc Exp Biol Med. 186:139–141. 1987. View Article : Google Scholar : PubMed/NCBI
|
|
42
|
Borgs P, Way DL, Witte MH and Witte CL:
Effective stabilization of ethanol levels in multiple-well tissue
culture plates. Alcohol. 10:31–35. 1993. View Article : Google Scholar : PubMed/NCBI
|
|
43
|
Hanson CJ, Bootman MD and Roderick HL:
Cell signalling: IP3 receptors channel calcium into cell death.
Curr Biol. 14:R933–R935. 2004. View Article : Google Scholar : PubMed/NCBI
|
|
44
|
MacLennan DH, Rice WJ and Green NM: The
mechanism of Ca2+ transport by sarco(endo)plasmic
reticulum Ca2+-ATPases. J Biol Chem. 272:28815–28818.
1997. View Article : Google Scholar : PubMed/NCBI
|