Introduction
Cerebrovascular diseases have become major factors
harming the life and health of the middle-aged and elderly in
China, among which the acute cerebral infarction (ACI),
characterized by high disability, mortality and recurrence rates,
is the most common type (1).
Scholars believe that the main pathogenesis of ACI
is the deposition of lipid, mainly low density lipoprotein (LDL),
in the cerebral arterial wall, arterial intimal thickening, luminal
stenosis, and blood supply disturbance in the corresponding brain
tissues, leading to ischemia-hypoxia necrosis (2). Atherosclerosis can also be seen as a
kind of chronic inflammatory injury involving adaptive immunity
(3–5). Therefore, the inflammatory response
markers also play an important role in ACI (6). Procalcitonin (PCT) is a more sensitive
serum inflammatory factor, which is associated with the risk of ACI
(7). The accurate judgement of
condition and prediction of development play key roles in the
prevention and treatment of ACI (8).
Moreover, timely intervention and appropriate treatment measures
based on the correct judgement will greatly improve the prognosis
of patients (9).
Values of LDL and PCT levels in evaluating the
condition and prognosis of patients with ACI were investigated.
Pearson's correlation analysis revealed that the serum LDL and PCT
levels in acute phase were negatively correlated with the National
Institutes of Health Stroke Scale (NIHSS) score after 1 month of
treatment (P<0.05). Thus, the dynamic monitoring of serum LDL
and PCT levels in ACI patients can help evaluate the condition and
prognosis of patients.
Patients and methods
General data
One hundred and fifty patients diagnosed with ACI in
Binzhou City Center Hospital (Binzhou, China) from February 2017 to
August 2017 were selected as the observation group, and another 50
healthy subjects were selected during the same period as the
control group. The differences in sex and age were not
statistically significant between the two groups (Table I). According to the volume of
cerebral infarction, the observation group was divided into three
groups: the mild infarction group (n=50), the moderate infarction
group (n=50) and the severe infarction group (n=50). There were no
statistically significant differences in the age and sex among the
three groups (Table II), and the
results were comparable. Inclusion criteria were: i) patients aged
18–81 years of either sex; ii) patients meeting the diagnostic
criteria for ACI developed by the Fourth National Conference on
Cerebrovascular Disease with the time from onset to admission of
<3 days (10,11); iii) patients whose infarction
location could be clearly defined via head computed tomography (CT)
or magnetic resonance imaging (MRI) scan with a single lesion; and
iv) patients who agreed and signed the informed consent of clinical
trial. Exclusion criteria were: i) patients with a history of
cerebral infarction or coronary heart disease who received recent
thrombolytic therapy; ii) patients with brain metastasis of
malignant tumor; iii) patients with autoimmune diseases; iv)
patients complicated by severe disorders in other organs; v)
patients with infection or had received recent trauma surgery; and
vi) patients who had received recently immune or biological agents.
The study was approved by the Ethics Committee of Binzhou City
Center Hospital.
 | Table I.Comparison of general data between the
two groups. |
Table I.
Comparison of general data between the
two groups.
| General data | Observation
group | Control group | χ2 | P-value |
|---|
| n | 150 | 50 |
|
|
| Sex (%) |
| Male | 88 (58.67%) | 28 (56.00%) | 3.06 | 0.36 |
|
Female | 62 (41.33%) | 22 (44.00%) | 3.06 | 0.36 |
| Age (years) |
|
|
| 0.29 |
|
<50 | 20 (13.33%) | 8 (16.00%) | 3.12 | 0.38 |
|
50–70 | 98 (65.33%) | 33 (66.00%) | 3.02 | 0.39 |
|
>70 | 32 (21.33%) | 9 (18.00%) | 2.79 | 0.28 |
| BMI
(kg/m2) | 25.05±3.24 | 24.77±2.98 | t=1.012 | 0.59 |
| Table II.Comparison of general data among the
three groups in the observation group. |
Table II.
Comparison of general data among the
three groups in the observation group.
| General data | Mild infarction
group | Moderate infarction
group | Severe infarction
group | χ2 | P-value |
|---|
| n | 50 | 50 | 50 |
|
|
| Sex (%) |
| Male | 28 (56.00%) | 24 (48.00%) | 27 (54.00%) | 3.01 | 0.44 |
|
Female | 22 (44.00%) | 26 (52.00%) | 23 (46.00%) | 3.01 | 0.44 |
| Age (years) |
|
<50 | 6 (12.00%) | 8 (16.00%) | 9 (18.00%) | 2.68 | 0.35 |
|
50–70 | 38 (76.00%) | 35 (70.00%) | 31 (62.00%) | 2.88 | 0.37 |
|
>70 | 6 (12.00%) | 7 (14.00%) | 10 (20.00%) | 2.57 | 0.31 |
| BMI
(kg/m2) | 28.12±3.22 | 23.29±4.46 | 25.47±2.29 | t=1.001 | 0.96 |
Evaluation criteria
i) Evaluation of infarction volume using Coniglobus
formula (11): Cerebral infarction
volume V (cm3) = a × b × c × π/6, where a, long diameter
of infarction focus (cm); b, short diameter of infarction focus
(cm); c, layer spacing of infarction focus (cm). ii) Evaluation of
clinical efficacy. The clinical efficacy was divided into five
grades according to the NIHSS score (Table III). The patients with progress,
remarkable progress and basic recovery were classified as effective
group, while those with other grades were classified as the
non-effective group. NIHSS scores were measured 10 days after
treatment.
| Table III.NIHSS score. |
Table III.
NIHSS score.
| Item | Progress | Remarkable
progress | Basic recovery | No change | Aggravation |
|---|
| NIHSS score | Reduced by
18–45% | Reduced by
46–89% | Reduced by
90–100% | Fluctuation of
<18% | Increase of ≥18% |
Research methods
Fasting elbow venous blood (3 ml) was drawn from
patients in the observation group at approximately 6 a.m. at the
1st, 3rd, 7th and 10th days after admission, while 3 ml fasting
elbow venous blood was drawn from patients in control group in the
early morning on the day of physical examination. The serum PCT and
LDL were detected via enzyme-linked immunosorbent assay (ELISA).
The normal reference ranges are as follows: PCT <0.5 ng/ml and
LDL <3.36 mmol/l. After 10 days, patients were divided into the
effective group and non-effective group based on the clinical
efficacy. After 1 month, the clinical efficacy was evaluated again,
and the correlations of LDL and PCT levels with NIHSS score 1 month
after treatment were analyzed.
Statistical analysis
Statistical analysis was performed using Statistical
Product and Service Solutions (SPSS) 21.0 software (Cabit
Information Technology Co., Ltd., Shanghai, China). The measurement
data in normal distribution were presented as mean ± standard
deviation. The t-test was used for the comparison of data with
homogeneous variance, and one-way analysis of variance (ANOVA) was
used for the comparison among groups. The Mann-Whitney U test was
used for the comparison of data in abnormal distribution or with
heterogeneous variance. The Kruskal Wallis H test was used for the
comparison among groups, and the repeated measures ANOVA used for
the comparison at different time-points within the group. RxC
Chi-square test was used for the comparison of enumeration data.
The correlations of LDL and PCT with treatment time were analyzed
using linear correlation analysis. P<0.05 was conside red to
indicate a statistically significant difference.
Results
Comparison of PCT and LDL levels 1 day
after admission between the observation group and control
group
The levels of serum PCT and LDL in the observation
group at the 1st day after admission were significantly higher than
those in the control group, and the differences were statistically
significant (P<0.05) (Table
IV).
| Table IV.Comparison of PCT (ng/ml) and LDL
levels (mmol/l) at 1 day after admission between the observation
group and control group. |
Table IV.
Comparison of PCT (ng/ml) and LDL
levels (mmol/l) at 1 day after admission between the observation
group and control group.
| Items | Observation
group | Control group | t value | P-value |
|---|
| PCT (ng/ml) | 1.28±0.52 | 0.24±0.11 | 0.014 | 0.02 |
| LDL (mmol/l) | 6.98±0.61 | 3.35±0.77 | 0.020 | 0.04 |
Levels of serum LDL and PCT in
observation group at the 1st, 3rd, 7th and 10th day after
admission
The levels of serum LDL and PCT in observation group
at the 1st day after admission were 6.98±0.61 ng/ml and 1.28±0.52
mmol/l respectively, reached the peak at the 3rd day, continuously
declined after the 7th day and got close to the normal ranges at
the 10th day (Fig. 1). The levels in
each group were compared with those at the previous time-point, and
the differences were statistically significant (P<0.05).
Dynamic changes in LDL and PCT levels
in the observation group
The levels of serum LDL and PCT at the 1st day after
admission in the three groups of ACI patients were significantly
higher than those in the control group (P<0.05), which reached
the peak at the 3rd day and declined at the 7th day, but they were
still higher than those in the control group (P<0.05). The
levels in each group were compared with those at the previous
time-point, and the differences were statistically significant
(P<0.05). The serum LDL and PCT levels in the three groups
showed increasing trends with the increase of infarction volume,
and the differences were statistically significant (P<0.05)
(Table V), suggesting that LDL and
PCT levels are related to the severity of disease.
| Table V.Dynamic changes in LDL and PCT levels
in observation group. |
Table V.
Dynamic changes in LDL and PCT levels
in observation group.
| Items | Treatment time
(day) | Mild infarction group
(n=50) | Moderate infarction
group (n=50) | Severe infarction
group (n=50) | F-value | P-value |
|---|
| LDL (ng/ml) | 1 | 2.39±0.53 | 7.17±1.16 | 10.02±2.29 | 2.12 | <0.05a |
|
| 3 | 6.72±0.42 | 12.39±1.04 | 22.04±2.16 | 2.34 |
<0.05a |
|
| 7 | 5.43±0.69 | 8.91±1.37 | 11.44±1.49 | 2.76 |
<0.05a |
|
| 10 | 1.23±0.62 | 4.41±1.66 | 7.17±1.31 | 2.44 |
<0.05a |
| F-value |
| 2.22 | 2.15 | 2.57 |
|
|
| P-value |
|
<0.05b |
<0.05b |
<0.05b |
|
|
| PCT (mmol/l) | 1 | 0.27±0.07 | 1.76±0.12 | 2.55±0.43 | 2.45 |
<0.05c |
|
| 3 | 3.47±0.53 | 4.92±1.28 | 8.38±1.95 | 2.53 |
<0.05c |
|
| 7 | 0.24±0.08 | 1.98±0.17 | 3.74±0.51 | 2.12 |
<0.05c |
|
| 10 | 0.13±0.05 | 1.06±0.09 | 2.01±0.11 | 2.34 |
<0.05c |
| F-value |
| P-value |
|
<0.05d |
<0.05d |
<0.05d |
|
|
Correlations of LDL and PCT levels
with curative effect
After 10 days of treatment, there were 121 out of
150 ACI patients (80.67%) in the effective group and 29 patients
(19.33%) in the non-effective group (Table VI). The LDL and PCT levels in the
effective group were lower than those in the non-effective group,
and there were statistically significant differences (P<0.05),
suggesting that the lower the LDL and PCT levels are, the better
the curative effect may be.
| Table VI.Correlation of LDL and PCT levels
with curative effect (mean ± standard deviation). |
Table VI.
Correlation of LDL and PCT levels
with curative effect (mean ± standard deviation).
| Groups | Effective
group | Non-effective
group |
t/χ2 | P-value |
|---|
| n (%) | 121 (80.67) | 29 (19.33) | 2.68 | 0.012 |
| Age (years) | 50.34±13.47 | 67.39±11.83 | 1.33 | 0.27 |
| LDL (mmol/l) | 5.04±1.27 | 13.32±3.13 | 2.84 | 0.01 |
| PCT (ng/ml) | 1.13±0.47 | 5.74±2.48 | 2.52 | 0.03 |
Correlation of LDL and PCT levels with
prognosis
As seen in Table
VII the linear correlation analysis showed that the PCT levels
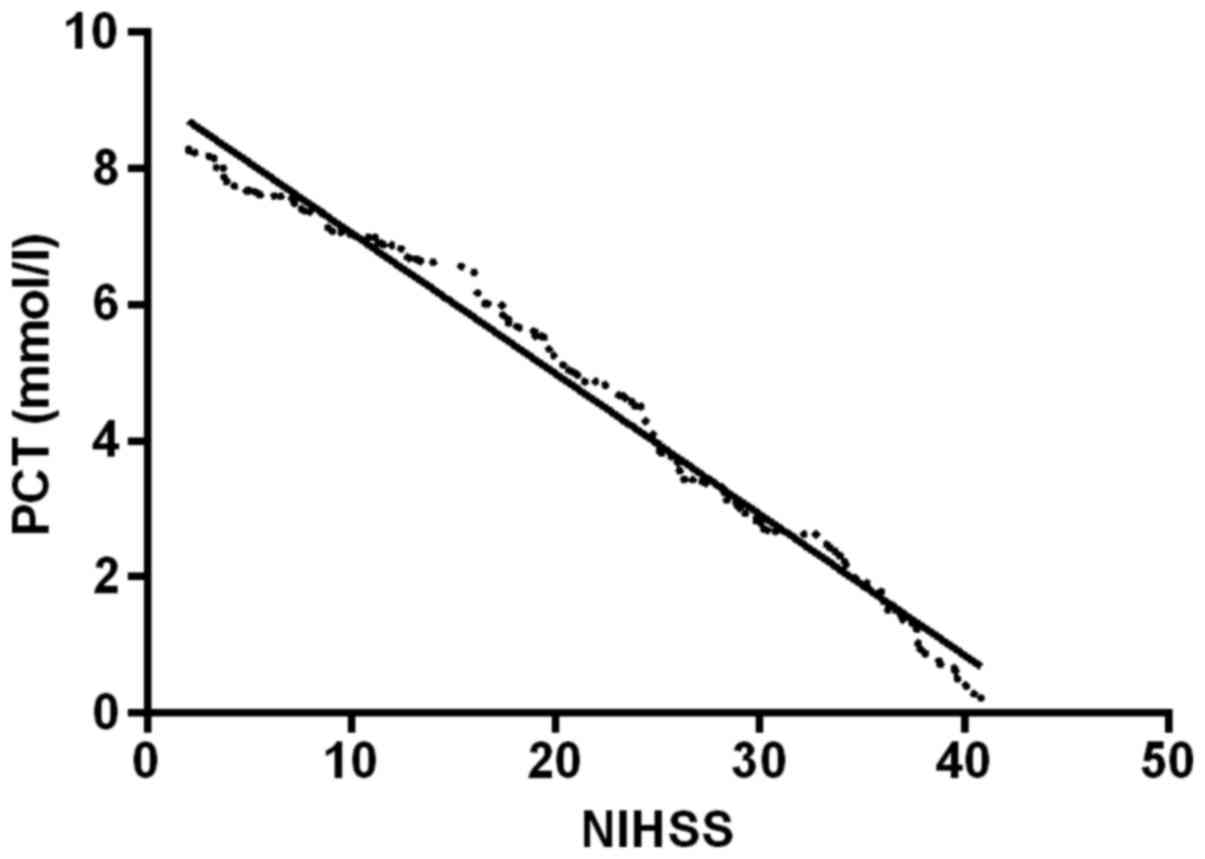
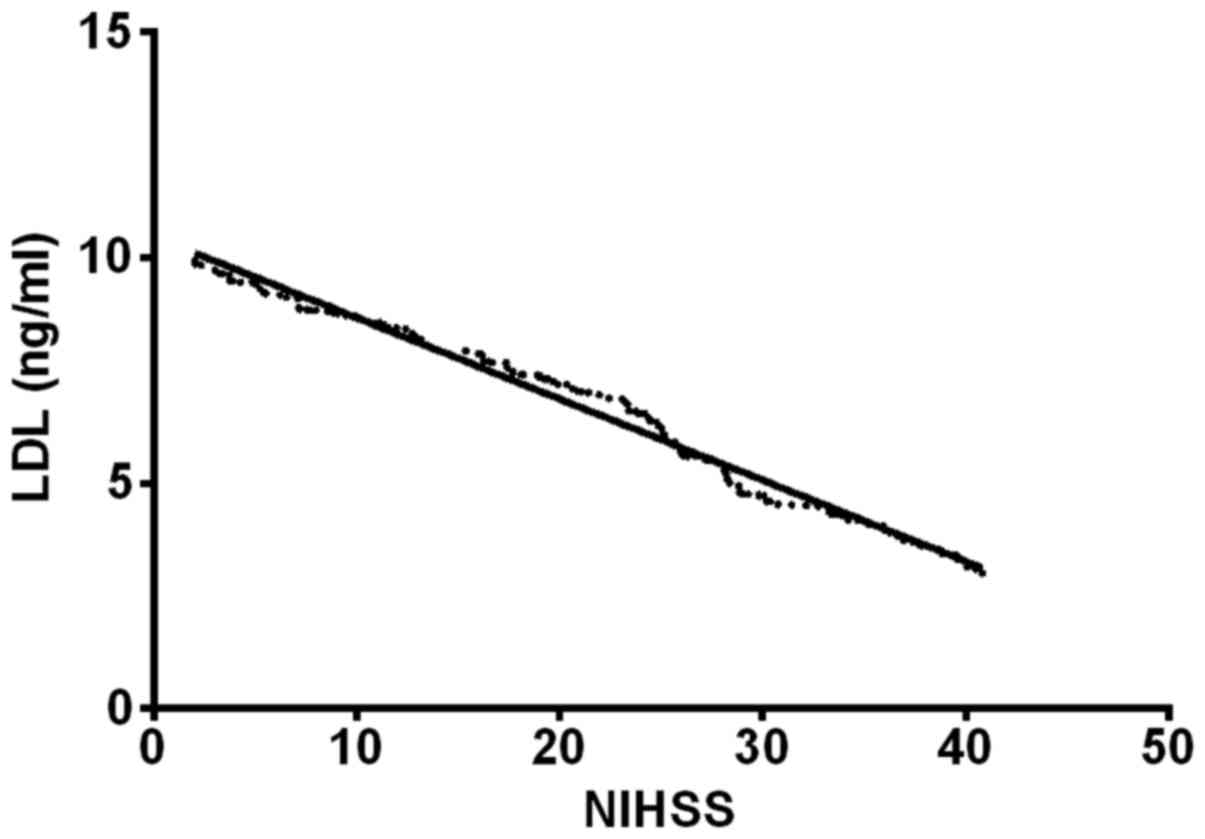
were negatively correlated with NIHSS score (r=−1.38, P<0.05);
LDL was negatively correlated with NIHSS score (r=−0.61, P<0.05)
(Figs. 1 and 2).
| Table VII.Correlation of LDL and PCT levels
with prognosis (mean ± standard deviation). |
Table VII.
Correlation of LDL and PCT levels
with prognosis (mean ± standard deviation).
|
| NIHSS score |
|---|
|
|
|
|---|
| Indexes | r | P-value |
|---|
| LDL |
| 1st day
after treatment | 0.356 | 0.028 |
| 3rd day
after treatment | 0.533 | 0.001 |
| 7th day
after treatment | 0.278 | 0.144 |
| 10th
day after treatment | 0.126 | 0.123 |
| PCT |
| 1st day
after treatment | 0.472 | 0.004 |
| 3rd day
after treatment | 0.701 | 0.027 |
| 7th day
after treatment | 0.413 | 0.232 |
| 10th
day after treatment | 0.207 | 0.204 |
Discussion
ACI has a high incidence rate in the elderly in
China. If there is no timely and effective treatment, the prognosis
will be poor and the patients' life, health and life quality later
will also be seriously threatened. Its incidence is closely related
to the lipid deposition and inflammatory response (12).
In recent years, many studies (13,14) have
pointed out that the inflammatory response has an extremely close
correlation with atherosclerosis, and they interact with each
other, exacerbating brain damage. First, the inflammatory response,
as a starting link, can cause changes in the brain arterial plaque
and thrombosis. Then, when plaque rupture occurs in ACI patients, a
large number of inflammatory cells are released, which aggravates
the cerebral ischemic injury, although the inflammatory response is
inhibited and the damaged tissue repair is promoted. Therefore, the
changes in serum inflammatory indexes are important in evaluating
the development and prognosis of disease.
PCT is an inflammatory index with a high sensitivity
and specificity (15,16), whose content can gradually increase
and reach the peak 2–3 h after inflammatory response, so it has a
high value in early diagnosis (17).
The increasing trend is associated with the severity of disease,
suggesting that PCT may be involved in the pathogenesis as the
inflammatory mediator (18). This is
also consistent with the results in this study. It was found that
the PCT level in ACI patients was significantly higher than that in
the normal control group, and it was increased along with the
increased degree of infarction. Kumral et al (19) pointed out that controlling the LDL
level can effectively improve the prognosis of ACI patients, which
is also consistent with our findings. LDL is the main carrier of
cholesterol in the blood, which consists of approximately 1,500
cholesterol ester molecules. It was found that the LDL level in ACI
patients was increased, along with the increased degree of
infarction, suggesting that LDL and ACI are closely correlated.
Therefore, the effective control of the LDL level can improve the
prognosis (20,21).
The linear correlation analysis was used to analyze
the correlations of LDL and PCT levels with prognosis, and the
results showed that the serum LDL and PCT levels were negatively
correlated with the NIHSS score, suggesting that LDL and PCT levels
can be used as a cure index for ACI, and can be used to monitor the
recovery of patients. However, the serum LDL and PCT levels had no
significant correlations with prognosis after the 7th day, possibly
because the LDL and PCT levels gradually returned to normal after
treatment when not in the acute phase. After 1 month, the clinical
efficacy was evaluated; the number of patients in effective group
(n=121, 80.67%) was significantly larger than that in the
non-effective group (n=29, 19.33%), so the disease was slowly
improved. The overall LDL and PCT levels slowly returned to
normal.
There were limitations in the experimental
conditions, such as the small sample base number, short
experimental period and lack of large data support. In order to
achieve the best experimental results, we will increase the base
number of the research object in the future, and carry out longer
follow-up of the patients.
In conclusion, the serum LDL and PCT levels in ACI
patients are positively correlated with the disease degree and
negatively correlated with NIHSS scores. The dynamic monitoring is
helpful in judging the condition and evaluating the prognosis of
the disease.
Acknowledgements
Not applicable.
Funding
No funding was received.
Availability of data and materials
The datasets used and/or analyzed during the present
study are available from the corresponding author on reasonable
request.
Authors' contributions
XM and RW conceived and designed the study, and
drafted the manuscript. XM, RW and XL collected, analyzed and
interpreted the experiment data, and revised the manuscript
critically for important intellectual content. All authors read and
approved the final manuscript.
Ethics approval and consent to
participate
The study was approved by the Ethics Committee of
Binzhou City Center Hospital (Binzhou, China). Signed informed
consents were obtained from the patients or the guardians.
Patient consent for publication
Not applicable.
Competing interests
The authors declare that they have no competing
interests.
References
|
1
|
Camerlingo M, Valente L, Tognozzi M,
Beretta GL, Moschini L and Cesana BM: C-reactive protein levels in
the first three hours after acute cerebral infarction. Int J
Neurosci. 121:65–68. 2011. View Article : Google Scholar : PubMed/NCBI
|
|
2
|
Zhang JY, Liu B, Wang YN, Zhang WN and
Wang FJ: Effect of rosuvastatin on OX40L and PPAR-γ expression in
human umbilical vein endothelial cells and atherosclerotic cerebral
infarction patients. J Mol Neurosci. 52:261–268. 2014. View Article : Google Scholar : PubMed/NCBI
|
|
3
|
Antunes RF, Kaski JC and Dumitriu IE: The
role of costimulatory receptors of the tumour necrosis factor
receptor family in atherosclerosis. J Biomed Biotechnol.
2012:4645322012. View Article : Google Scholar : PubMed/NCBI
|
|
4
|
Kamel H and Iadecola C: Brain-immune
interactions and ischemic stroke: Clinical implications. Arch
Neurol. 69:576–581. 2012. View Article : Google Scholar : PubMed/NCBI
|
|
5
|
Tsai JZ, Peng SJ, Chen YW, Wang KW, Li CH,
Wang JY, Chen CJ, Lin HJ, Smith EE, Wu HK, et al: Automated
segmentation and quantification of white matter hyperintensities in
acute ischemic stroke patients with cerebral infarction. PLoS One.
9:e1040112014. View Article : Google Scholar : PubMed/NCBI
|
|
6
|
Tuttolomondo A, Di Raimondo D, Pecoraro R,
Arnao V, Pinto A and Licata G: Inflammation in ischemic stroke
subtypes. Curr Pharm Des. 18:4289–4310. 2012. View Article : Google Scholar : PubMed/NCBI
|
|
7
|
Lavrentieva A, Papadopoulou S, Kioumis J,
Kaimakamis E and Bitzani M: PCT as a diagnostic and prognostic tool
in burn patients. Whether time course has a role in monitoring
sepsis treatment. Burns. 38:356–363. 2012. View Article : Google Scholar : PubMed/NCBI
|
|
8
|
Williams LS, Ghose SS and Swindle RW:
Depression and other mental health diagnoses increase mortality
risk after ischemic stroke. Am J Psychiatry. 161:1090–1095. 2004.
View Article : Google Scholar : PubMed/NCBI
|
|
9
|
Zhang F, Li X, Dong Q, Wang Y and Zhang H:
Risk of acute cerebral infarction and plasma asymmetrical
dimethylarginine and homocysteine levels: A clinical correlation
analysis of Chinese population. J Stroke Cerebrovasc Dis.
23:2225–2232. 2014. View Article : Google Scholar : PubMed/NCBI
|
|
10
|
Ahmetgjekaj I, Kabashi-Muçaj S, Lascu LC,
Kabashi A, Bondari A, Bondari S, Dedushi-Hoti K, Biçaku A and
Shatri J: Magnetic resonance imaging criteria for thrombolysis in
hyperacute cerebral infarction. Curr Health Sci J. 40:111–115.
2014.PubMed/NCBI
|
|
11
|
Song Y, Li Q, Long L, Zhang N and Liu Y:
Asn563Ser polymorphism of CD31/PECAM-1 is associated with
atherosclerotic cerebral infarction in a southern Han population.
Neuropsychiatr Dis Treat. 11:15–20. 2014.PubMed/NCBI
|
|
12
|
Maida C, Tuttolomondo A, Di Raimondo D,
Daidone M and Pinto A: Management of blood pressure and heart rate
in patients with acute stroke. Curr Pharm Des. 23:4583–4597. 2017.
View Article : Google Scholar : PubMed/NCBI
|
|
13
|
Khan MM, Motto DG, Lentz SR and Chauhan
AK: ADAMTS13 reduces VWF-mediated acute inflammation following
focal cerebral ischemia in mice. J Thromb Haemost. 10:1665–1671.
2012. View Article : Google Scholar : PubMed/NCBI
|
|
14
|
Lambertsen KL, Biber K and Finsen B:
Inflammatory cytokines in experimental and human stroke. J Cereb
Blood Flow Metab. 32:1677–1698. 2012. View Article : Google Scholar : PubMed/NCBI
|
|
15
|
Zu H, Li Q, Huang P and Wang X:
Therapeutic value of blood purification and prognostic utilities of
early serum procalcitonin, C reactive protein, and brain
natriuretic peptide levels in severely burned patients with sepsis.
Cell Biochem Biophys. 72:259–263. 2015. View Article : Google Scholar : PubMed/NCBI
|
|
16
|
Dymicka-Piekarska V and Wasiluk A:
Procalcitonin (PCT), contemporary indicator of infection and
inflammation. Postepy Hig Med Dosw. 69:723–728. 2015.(In Polish).
View Article : Google Scholar
|
|
17
|
Gao L, Liu X, Zhang D, Xu F, Chen Q, Hong
Y, Feng G, Shi Q, Yang B and Xu L: Early diagnosis of bacterial
infection in patients with septicopyemia by laboratory analysis of
PCT, CRP and IL-6. Exp Ther Med. 13:3479–3483. 2017. View Article : Google Scholar : PubMed/NCBI
|
|
18
|
Jiao J, Wang M, Zhang J, Shen K, Liao X
and Zhou X: Procalcitonin as a diagnostic marker of
ventilator-associated pneumonia in cardiac surgery patients. Exp
Ther Med. 9:1051–1057. 2015. View Article : Google Scholar : PubMed/NCBI
|
|
19
|
Kumral E, Evyapan D, Gökçay F, Karaman B
and Orman M: Association of baseline dyslipidemia with stroke
recurrence within five-years after ischemic stroke. Int J Stroke. 9
Suppl A100:119–126. 2014. View Article : Google Scholar : PubMed/NCBI
|
|
20
|
Zhang Z, Ma N, Zheng Y and Zhang L:
Association of serum immunoglobulin-G to Porphyromonas gingivalis
with acute cerebral infarction in the Chinese population. J Indian
Soc Periodontol. 19:628–632. 2015. View Article : Google Scholar : PubMed/NCBI
|
|
21
|
Feng S: Diabetes and hyperglycemia after
cerebral infarction in acute cerebral infarction. Diabetes N World.
19:76–78. 2016.(In Chinese).
|