Introduction
Diabetic nephropathy (DN) is a major chronic
complication of diabetes and leads to end-stage renal disease
(1). DN is characterized by
glomerular hypertrophy, thickening of the basement membrane and
glomerulosclerosis during the early stage, while tubular atrophy or
interstitial fibrosis occur during the late stage, ultimately
leading to a loss of renal function (1,2).
Interstitial fibrosis is an inevitable result of chronic kidney
disease (CKD) (3).
Epithelial-mesenchymal transition (EMT) has been implicated as a
major pathway leading to the generation of renal interstitial
fibrosis in DN (4–7). During EMT, epithelial cells lose
several epithelial characteristics, such as epithelial
(E)-cadherin, and acquire properties typical of mesenchymal cells
such as α-smooth muscle actin (α-SMA) (8). However, the molecular mechanisms
underlying the development of renal interstitial fibrosis have not
been fully elucidated.
It is known that reactive oxygen species (ROS) serve
an important role in the development of diabetic complications
(9). ROS overproduction in the
diabetic microenvironment occurs as a direct consequence of
hyperglycaemia (10). ROS includes
molecular oxygen and its derivatives (11) and are known to function as second
messengers. It has been reported that high glucose (HG)-induced ROS
overexpression is the unifying mechanism of diabetic complications
(11,12). As such, inhibiting ROS production may
be beneficial for the treatment of DN.
Transforming growth factor-β1 (TGF-β1) is a potent
inducer of EMT and there is evidence of TGF-β1-induced EMT in
tubular epithelial cells and kidney tissues (13,14). A
number of studies have investigated the associated signalling
pathways, including mitogen-activated protein kinase (MAPK)
(15), Smad proteins (16) and phosphatidylinositol 3-kinase
(PI3K)/protein kinase B (Akt) (17).
Akt is a subfamily of serine/threonine kinases and serves a role in
a number of signalling circuits (18). Previous studies by our group have
revealed that Akt phosphorylation is increased in rat mesangial
cells under HG conditions, as well as in kidney tissues from db/db
mice (19,20). Mammalian target of rapamycin (mTOR),
a downstream protein of PI3K/Akt, is a new member of the
phosphatidylinositol kinase associated kinase (PIKK) family and
serves an important role in cell proliferation, differentiation,
metastasis and survival (21). mTOR
kinase as two different polyprotein complexes, mTORC1 and mTORC2,
whose subunit composition consists of upstream inputs and
downstream substrates, which function differently (22). Despite the presence of mTOR in both
complexes, only mTORC1 is sensitive to rapamycin inhibition
(23). It has previously been
reported that the mTOR signalling pathway serves a role in the
onset and progression of DN, while mTOR inhibition by rapamycin is
able to prevent DN progression in animals with type 1 and type 2
diabetes mellitus (23).
It is well known that ROS regulates Akt/mTOR
signalling (24,25) and mTOR serves a role in DN and TGF-β1
induced EMT (26–28); however, the association between
HG-induced ROS production and the TGF-β1/PI3K/Akt/mTOR pathway has
not been fully elucidated. It is therefore necessary to further
explore whether the activation of PI3K/Akt/mTOR signalling induced
by ROS under high-glucose conditions affects EMT in DN.
Materials and methods
Cell culture
Normal rat kidney tubular epithelial cell line
(NRK-52E) cells were donated by Mrs Chen Sha from the Nanjing
University of Traditional Chinese Medicine (Nanjing, China). Cells
were cultured in Dulbecco's modified Eagle's medium (DMEM; Gibco;
Thermo Fisher Scientific, Inc., Waltham, MA, USA) at 37°C in a
humidified atmosphere containing 5% CO2 and 95% air. The cells
passaged three times per week. Prior to use, cells were
synchronized for 24 h, followed by treatment with 54.4 mmol/l
mannitol (MA), 20 µmol/l dimethlysulfoxide (DMSO), 60 mmol/l
glucose (also known as HG), 1×10⁻⁵ mol/l H2O2, 10 ng/ml TGF-β1, HG
+ 50 µmol/l antioxidant N-acetylcysteine (NAC), HG + 10 µmol/l
inhibitor of TGF-β1 (SB-431542), HG + 20 µmol/l inhibitor of PI3K
(LY-294002) or HG + 20 nmol/l inhibitor of mTOR (rapamycin; Cell
Signalling Technology, Inc., Danvers, MA, USA). Cells were treated
as indicated for 48 h, the cells were assessed using an inverted
light microscope (magnification, ×200) and then harvested for
analysis. NAC, SB-431542 and LY-294002 were provided by
Sigma-Aldrich (Merck KGaA, Darmstadt, Germany). The normal glucose
(NG), NG+MA, HG and HG+DMSO groups were assessed and micrographs
were captured at 48 h using an inverted light microscope
(magnification, ×400). MA was used as an agent to simulate the
osmotic pressure of a high-glucose condition and DMSO was used as a
solvent.
Animals and study protocol
A total of 20 male Wistar rats at the age of 8
weeks, weighing 200–220 g, were housed in the Experimental Animal
Center of Xuzhou Medical University (Xuzhou, China). Rats were
provided with free access to food and water. The animal room was
maintained at 24±1°C, with relative humidity between 40 and 60% and
a 12-h light/dark cycle. A total of 10 rats were administered with
60 mg/kg streptozocin (STZ; Sigma Aldrich; Merck KGaA) dissolved in
0.01 mol/l citrate buffer (pH 4.5; Beyotime Institute of
Biotechnology) via intraperitoneal injection to induce diabetes
mellitus. At 3 days after STZ administration, fasting blood glucose
levels were measured using blood glucose test strips and the
OneTouch UltraEasy glucose meter (both LifeScan, Inc.;
Johnson & Johnson Services, Inc., New Brunswick, NJ, USA) and a
value of >13.9 mmol/l was considered to indicate diabetes. The
rats that did not receive treatment were placed in the normal
control (N) group, those with fasting blood glucose levels >13.9
mmol/l were place in the diabetes mellitus (DM) group (10
rats/group). After 8 weeks, rats were placed in metabolic cages
(DXL-D; Beijing Jiayuan Industrial Technology Co., Ltd., Beijing,
China) for 24 h of urine collection. Then the rats were sacrificed,
blood was collected from the abdominal aorta and the serum was
separated from the cells by centrifugation of the blood at 3,000 ×
g for 15 min at 20°C. Kidneys were also removed and the kidney
cortexes were isolated. The samples were stored at −80°C for
biochemical analysis. The present study was approved by the Animal
Ethics Committee of Xuzhou Medical University (Xuzhou, China) and
all experiments were performed in accordance with the Guidelines
for Ethical Conduct in the Care and Use of Animals.
Renal function assessment and
antioxidant index
Indicators of renal function were assessed,
including 24-h urine protein, serum creatinine (Cr) and blood urea
nitrogen (BUN). The levels of GSH and T-SOD were measures to
determine the antioxidant index in the renal cortex and serum in
diabetic rats. Cr and BUN assay kits were purchased from Changchun
Huili Biotech Co., Ltd. (Changchun, China). Levels of urine
protein, glutathione (GSH; cat. no. A006-2) and superoxide
dismutase (T-SOD; cat. no. A001-3) were measured using kits
(Nanjing Jiancheng Bioengineering Institute, Nanjing, China).
Periodic acid-Schiff (PAS)
staining
Kidney tissues were fixed in 4% formaldehyde for 48
h at room temperature and embedded in paraffin for histological
analysis. Then, the 3-µm-thick sections were dewaxed and hydrated.
The sections were stained with PAS (cat. no. DG0005; Beijing
Leagene Biotech. Co., Ltd., Beijing, China) for 15
min at room temperature, dehydrated to transparency and mounted
with neutral gum. The sections were examined using a light
microscope (BX43F; Olympus Corporation, Tokyo, Japan;
magnification, ×400). The three most central sections were
analysed. Linear measurements were obtained with an image analysis
system (Image-Pro Plus 4.0; Media Cybernetics, Inc., Rockville, MD,
USA).
Masson staining
Kidneys sections (3-µm-thick) were stained with a
Masson assay kit (cat. no. 16071; Shanghai Yuanye Biotechnology
Co., Ltd., Shanghai, China) according to the manufacturer's
protocol. The sections were examined using a light microscope
(magnification, ×400), and the green zones, which mainly consisted
of collagen, were measured by Image-Pro Plus 4.0 software.
High performance liquid chromatography
(HPLC)
Malondialdehyde (MDA), an indicator of oxidative
stress injury, was measured using HPLC. Kidneys were dissected and
homogenized in pre-chilled 0.9% neutral normal saline. The
resultant homogenate was centrifuged at 4°C at 2,500 × g for 10 min
and the supernatant was kept for further analysis. For alkaline
hydrolysis of protein bound MDA, 20 µl 6 mol/l sodium hydroxide was
added to 100 µl supernatant, and the sample was incubated in a 60°C
water bath for 30 min, and then incubated in ice. The hydrolyzed
sample was acidified with 50 µl 35% perchloric acid. The resulting
suspension was then vortexed for 30 sec and centrifuged at 12,000 ×
g for 10 min at 4°C. The less dense, clear supernatant (150 µl) was
mixed with 15 µl of Brady's reagent (5 mmol/l Brady's reagent and 2
mol/l HCl) and incubated for 30 min at room temperature for
derivatization. Following derivatization, the samples were filtered
through a 0.2 µm filter.
Aliquots of 50 µl were injected into a HPLC system.
MDA levels were measured by reversed-phase (RP)-HPLC with
pre-column derivatization on an Agilent Zorbax SB-C18 column
(4.6×150 mm, 5 µm; Agilent Technologies, Inc., Santa Clara, CA,
USA). The mobile phase consisted of acetonitrile-distilled water
(38:62, v/v) containing 0.2% acetic acid at a flow rate of 1
ml/min. The RP column was set at room temperature and a wavelength
of 310 nm was used for UV detection. The concentration of MDA was
calculated based on a standard curve and expressed as nmol/g
protein. The MDA standard was prepared by dissolving
1,1,3,3-tetraethoxypropane (TEP) in water to give a stock solution
of 1 mmol/l. The working standard was prepared by serial dilution
of the TEP stock solution with 1% sulfuric acid to 20, 10, 5, 2.5,
1.25, 0.625, 0.3125 and 0.15625 µmol/l, yielding a standard curve
for total MDA content determination.
Flow cytometry
To evaluate the intracellular generation of ROS,
cells were cultured for 48 h at 37°C with the indicated treatments.
Cells were seeded (10,000 cells) in 6-well plates and incubated in
serum-free DMEM for 24 h. Cells were then washed with serum-free
DMEM and then incubated with 2′, 7′-dichlorofluorescein diacetate
(DCFH-DA; Beijing Bioleb Technology Co., Ltd., Beijing, China) at
37°C for 20 min. Changes in intracellular ROS levels were then
determined by measuring the oxidative conversion of cell permeable
DCFH-DA to fluorescent dichlorofluorescein (DCF) using a ROS
detection kit (Beyotime Institute of Biotechnology, Haimen, China).
The DCF fluorescence distribution of the cells was detected at
excitation and emission wavelengths of 488 and 525 nm,
respectively, by a MACSQuant VYB flow cytometer (Miltenyi Biotec
GmbH, Bergisch Gladbach, Germany) and quantified by the internal
software.
ELISA
NRK-52E cells were seeded into a 12-well plate at a
density of 1.0×10⁶ cells/well. The cells were then incubated in
serum-free DMEM for 24 h, the medium was discarded and 2 ml of the
treatment was added: 54.4 mmol/l MA, 20 µmol/l DMSO, 60 mmol/l
glucose, 1×10⁻⁵ mol/l H2O2, 10 ng/ml TGF-β1, HG + 50 µmol/l NAC, HG
+ 10 µmol/l SB-431542, HG + 20 µmol/l LY-294002 or HG + 20 nmol/l
rapamycin. After 48 h of continuous culturing, the culture
supernatant was collected and the concentration of TGF-β1 was
measured according to a TGF-β1 ELISA kit (cat. no. T10201-09;
Shanghai Boyun Biotech Co., Ltd., Shanghai, China).
RNA isolation and reverse
transcription-quantitative polymerase chain reaction (RT-qPCR)
cDNA was isolated from NRK-52E cells and kidney
cortices using the TRIzol reagent (Invitrogen; Thermo Fisher
Scientific, Inc.) according to the manufacturer's protocol. An
RT-Rever TraAce qPCR RT kit (Toyobo Life Science, Osaka, Japan),
gene-specific primers and SYBR-Green I Master Mix (Roche
Diagnostics, Basel, Switzerland) were used for PCR. Primers were
purchased from Sangon Biotech Co., Ltd. (Shanghai, China) and are
presented in Table I. The PCR
reactions were performed in a Light Cycle 480 System (Roche Applied
Science, Mannheim, Germany) as previously described (29), using a thermal profile of 10 min at
95°C, followed by 40 cycles of 15 sec at 95°C, 30 sec at 60°C, then
a melting curve of 15 sec at 95°C, 60 sec at 1 min. The samples
were heating to 95°C and cooled for 30 sec at 4°C. The results were
quantified using the 2-∆∆Cq method (30).
 | Table I.Primer sequences and product
lengths. |
Table I.
Primer sequences and product
lengths.
| Gene | Direction | Sequence
(5′-3′) | Length (bp) |
|---|
| Transforming growth
factor-β1 | F |
TGCTTCAGCTCCACAGAGAA | 182 |
|
| R |
TGGTTGTAGAGGGCAAGGAC |
|
| Endothelial
cadherin | F |
CACACTGATGGTGAGGGTACAAGG | 123 |
|
| R |
GGGCTTCAGGAACACATACATGG |
|
| α-smooth muscle
actin | F |
CGGGCTTTGCTGGTGATG | 143 |
|
| R |
GGTCAGGATCCCTCTCTTGCT |
|
| β-actin | F |
CCCATCTATGAGGGTTACGC | 150 |
|
| R |
TTTAATGTCACGCACGATTTC |
|
Western blotting
Cultured NRK-52E cells were harvested in lysis
buffer containing 50 mmol/l Tris (pH 7.6), 150 mmol/l NaCl, 1
mmol/l EDTA, 1% NP-40, 1 mmol/l PMSF, 1 mmol/l
Na3VO4 and 20 mmol/l NaF on ice. Homogenates
from the renal cortexes were prepared using RIPA lysis buffer
containing 50 mmol/l Tris (pH 7.4), 150 mmol/l NaCl, 1%
TritonX-100, 1% sodium deoxycholate, 0.1% SDS, 1 mmol/l PMSF, 1
mmol/l Na3VO4 and 20 mmol/l NaF on ice. The supernatant was
collected after centrifugation at 12,000 × g at 4°C for 15 min.
Protein concentrations were determined using a bicinchoninic acid
protein assay (Thermo Fisher Scientific, Inc.) according to the
manufacturer's protocol. Equal amounts of protein (40 µg of the
in vitro proteins and 80 µg/lane of the in vivo
proteins) were separated by 8% SDS-PAGE and transferred onto
nitrocellulose membranes. The membranes were blocked in
tris-buffered saline with Tween-20 containing 3% bovine serum
albumin (Sigma Aldrich; Merck KGaA) for 1 h at room temperature.
Membranes were subsequently incubated with antibodies against the
following: Akt, phosphorylated-Akt (Ser473; 1:1,000; cat. no.
BS1810), E-cadherin (1:1,000; cat. no. BS1347) and β-actin
(1:1,000; cat. no. AP0060; all Bioworld Technology, Inc., St. Louis
Park, MN, USA), mTOR (1:1,000; cat. no. 2983) and
phosphorylated-mTOR (Ser2448; 1:1,000; cat. no. 5536; Cell
Signalling Technology, Inc.) and α-SMA (1:1,000; cat. no. M0851;
Dako; Agilent Technologies, Inc., Santa Clara, CA, USA) overnight
at 4°C. The primary antibodies were detected using alkaline
phosphatase-conjugated immunoglobulin G antibodies (cat. no.
SA00002-2; Bioworld Technology, Inc.) for 1 h at room temperature.
An immunoblot was generated using the ECL western blotting
detection system (Thermo Fisher Scientific, Inc.). Bands were
quantified using ImageJ software (version 1.3.4.67; National
Institutes of Health, Bethesda, MD, USA).
Wound healing assay
Cell migration behaviour was assessed using a wound
healing assay. Cells were seeded in 6-well plates (1×10⁵
cells/well) and grown to 80% confluence at 37°C. The cell monolayer
was scratched with a pipette tip (Axygen; Corning Incorporated,
Corning, NY, USA) to create a narrow wound-like gap. Shortly after
wounding, the NRK-52E cells were washed with PBS twice and
incubated with the indicated treatments at room temperature. Plates
were assessed and micrographs were captured at 0, 12 and 24 h using
an inverted light microscope (magnification, ×400). The number of
migrated cells was quantified by manual counting and six randomly
chosen fields were analysed for each well.
Cell invasion assays
An invasion assay was performed to evaluate the
effect of HG and ROS on the invasion ability of NRK-52E cells.
Transwell chambers were initially coated with Matrigel (40 µg/100
µl/chamber) at 37°C for 1 h. The cells were suspended in DMEM
(5×10⁵ cells/ml) and seeded in the upper compartment, while DMEM
containing 10% fetal bovine serum (Gibco; Thermo Fisher Scientific,
Inc.) was added in the lower compartment. Chambers were incubated
in an atmosphere containing 5% CO2 at 37°C for 24 h and non-invaded
cells on the upper side of the membrane were removed with a cotton
swab. The invaded cells on the bottom surface were fixed with 100%
methanol for 30 min and stained with haematoxylin and eosin
(Nanjing Sunshine Biotechnology Co., Ltd., Nanjing, China) for 15
min at room temperature. Invaded cells were quantified by manual
counting using an inverted light microscope (magnification, ×400)
and five randomly chosen fields were analysed for each group.
Statistical analysis
All data are presented as the mean ± standard error
of the mean. Statistical analysis was performed using SPSS version
13 (SPSS, Inc., Chicago, IL, USA). Comparisons between groups were
made using one-way analysis of variance followed by the
Student-Newman-Keuls test. P<0.05 was considered to indicate a
statistically significant difference.
Results
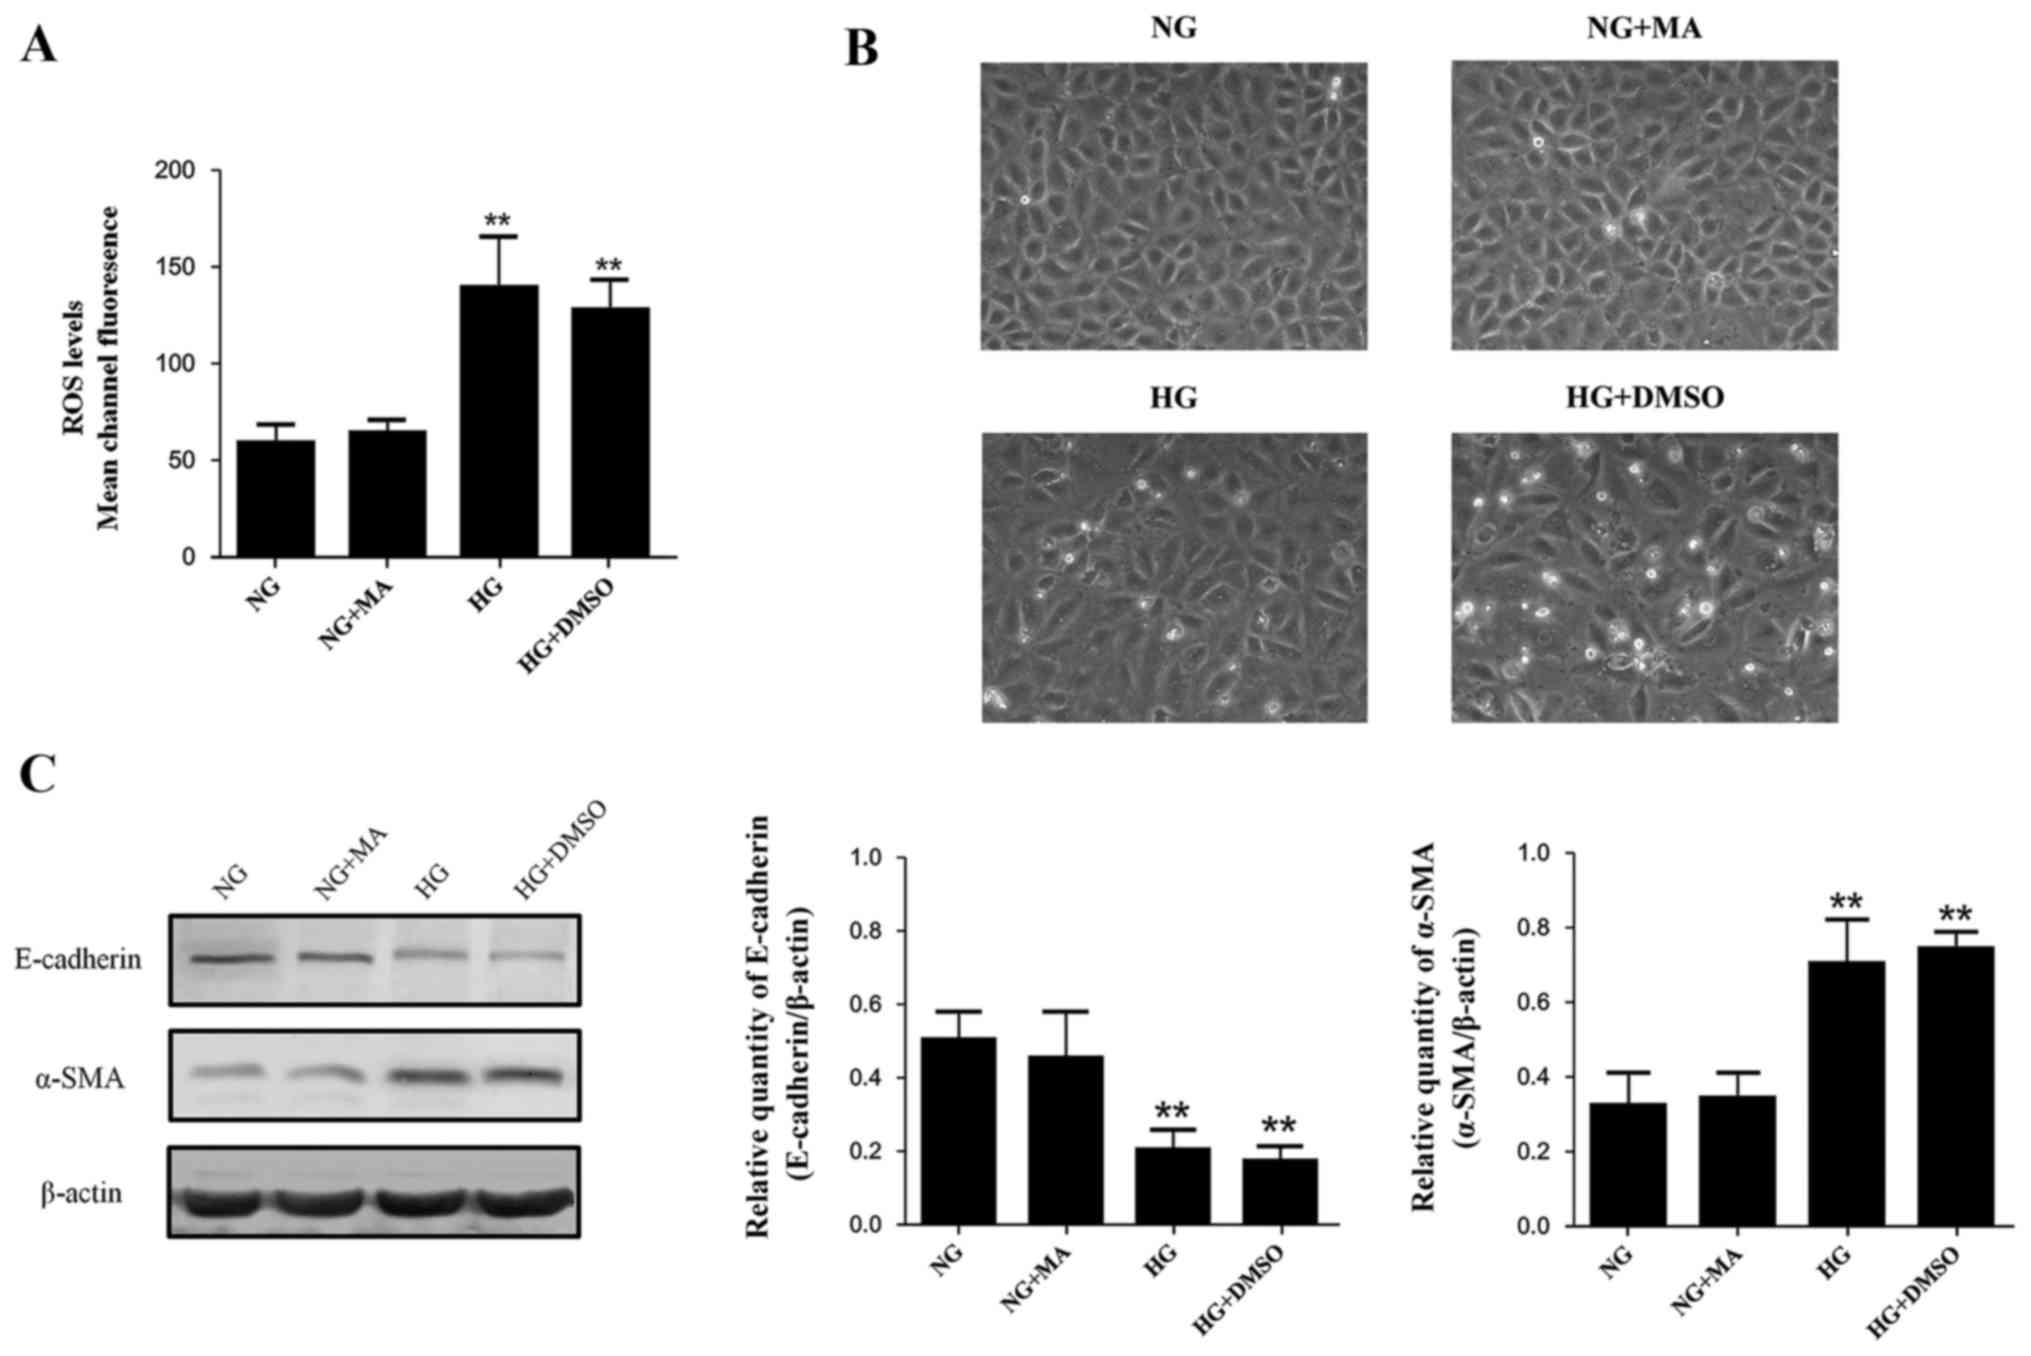
The effects of osmotic pressure and
solvent
The effects of MA and DMSO on the indices
investigated in our study were assessed, including morphologic
changes of NRK-52E cells, intracellular ROS production, E-cadherin
expression and α-SMA expression. The levels of these indices in the
MA group were almost identical to those in the normal standard
group, indicating that the osmotic pressure generated by HG did not
affect any of the indices involved (Fig.
1). All indices in the DMSO group were similar compared with
the HG+DMSO group, indicating that DMSO had no significant effects
on the results (Fig. 1). Based on
these data, the NRK-52E cells in the NG group were incubated in
DMEM with 5.56 mmol/l of glucose and 54.44 mmol/l of MA, while
NRK-52E cells in the HG+DMSO group were incubated in DMEM with 60
mmol/l of glucose and 20 µmol/l of DMSO for subsequent
experiments.
HG induces oxidative stress in NRK-52E
cells
Intracellular ROS generation in NRK-52E cells was
assessed. Sustained HG or H2O2 stimulation for 48 h significantly
increased ROS generation compared with the NG+MA group (Fig. 2A). In cells incubated with the
antioxidant NAC, LY-294002 or rapamycin, intracellular ROS
production was significantly decreased compared with the NG+MA
group (Fig. 2A). These results
suggest that HG stimulation is able to induce ROS production in
NRK-52E cells and that the antioxidant NAC is able to effectively
inhibit the increased ROS generation in HG conditions.
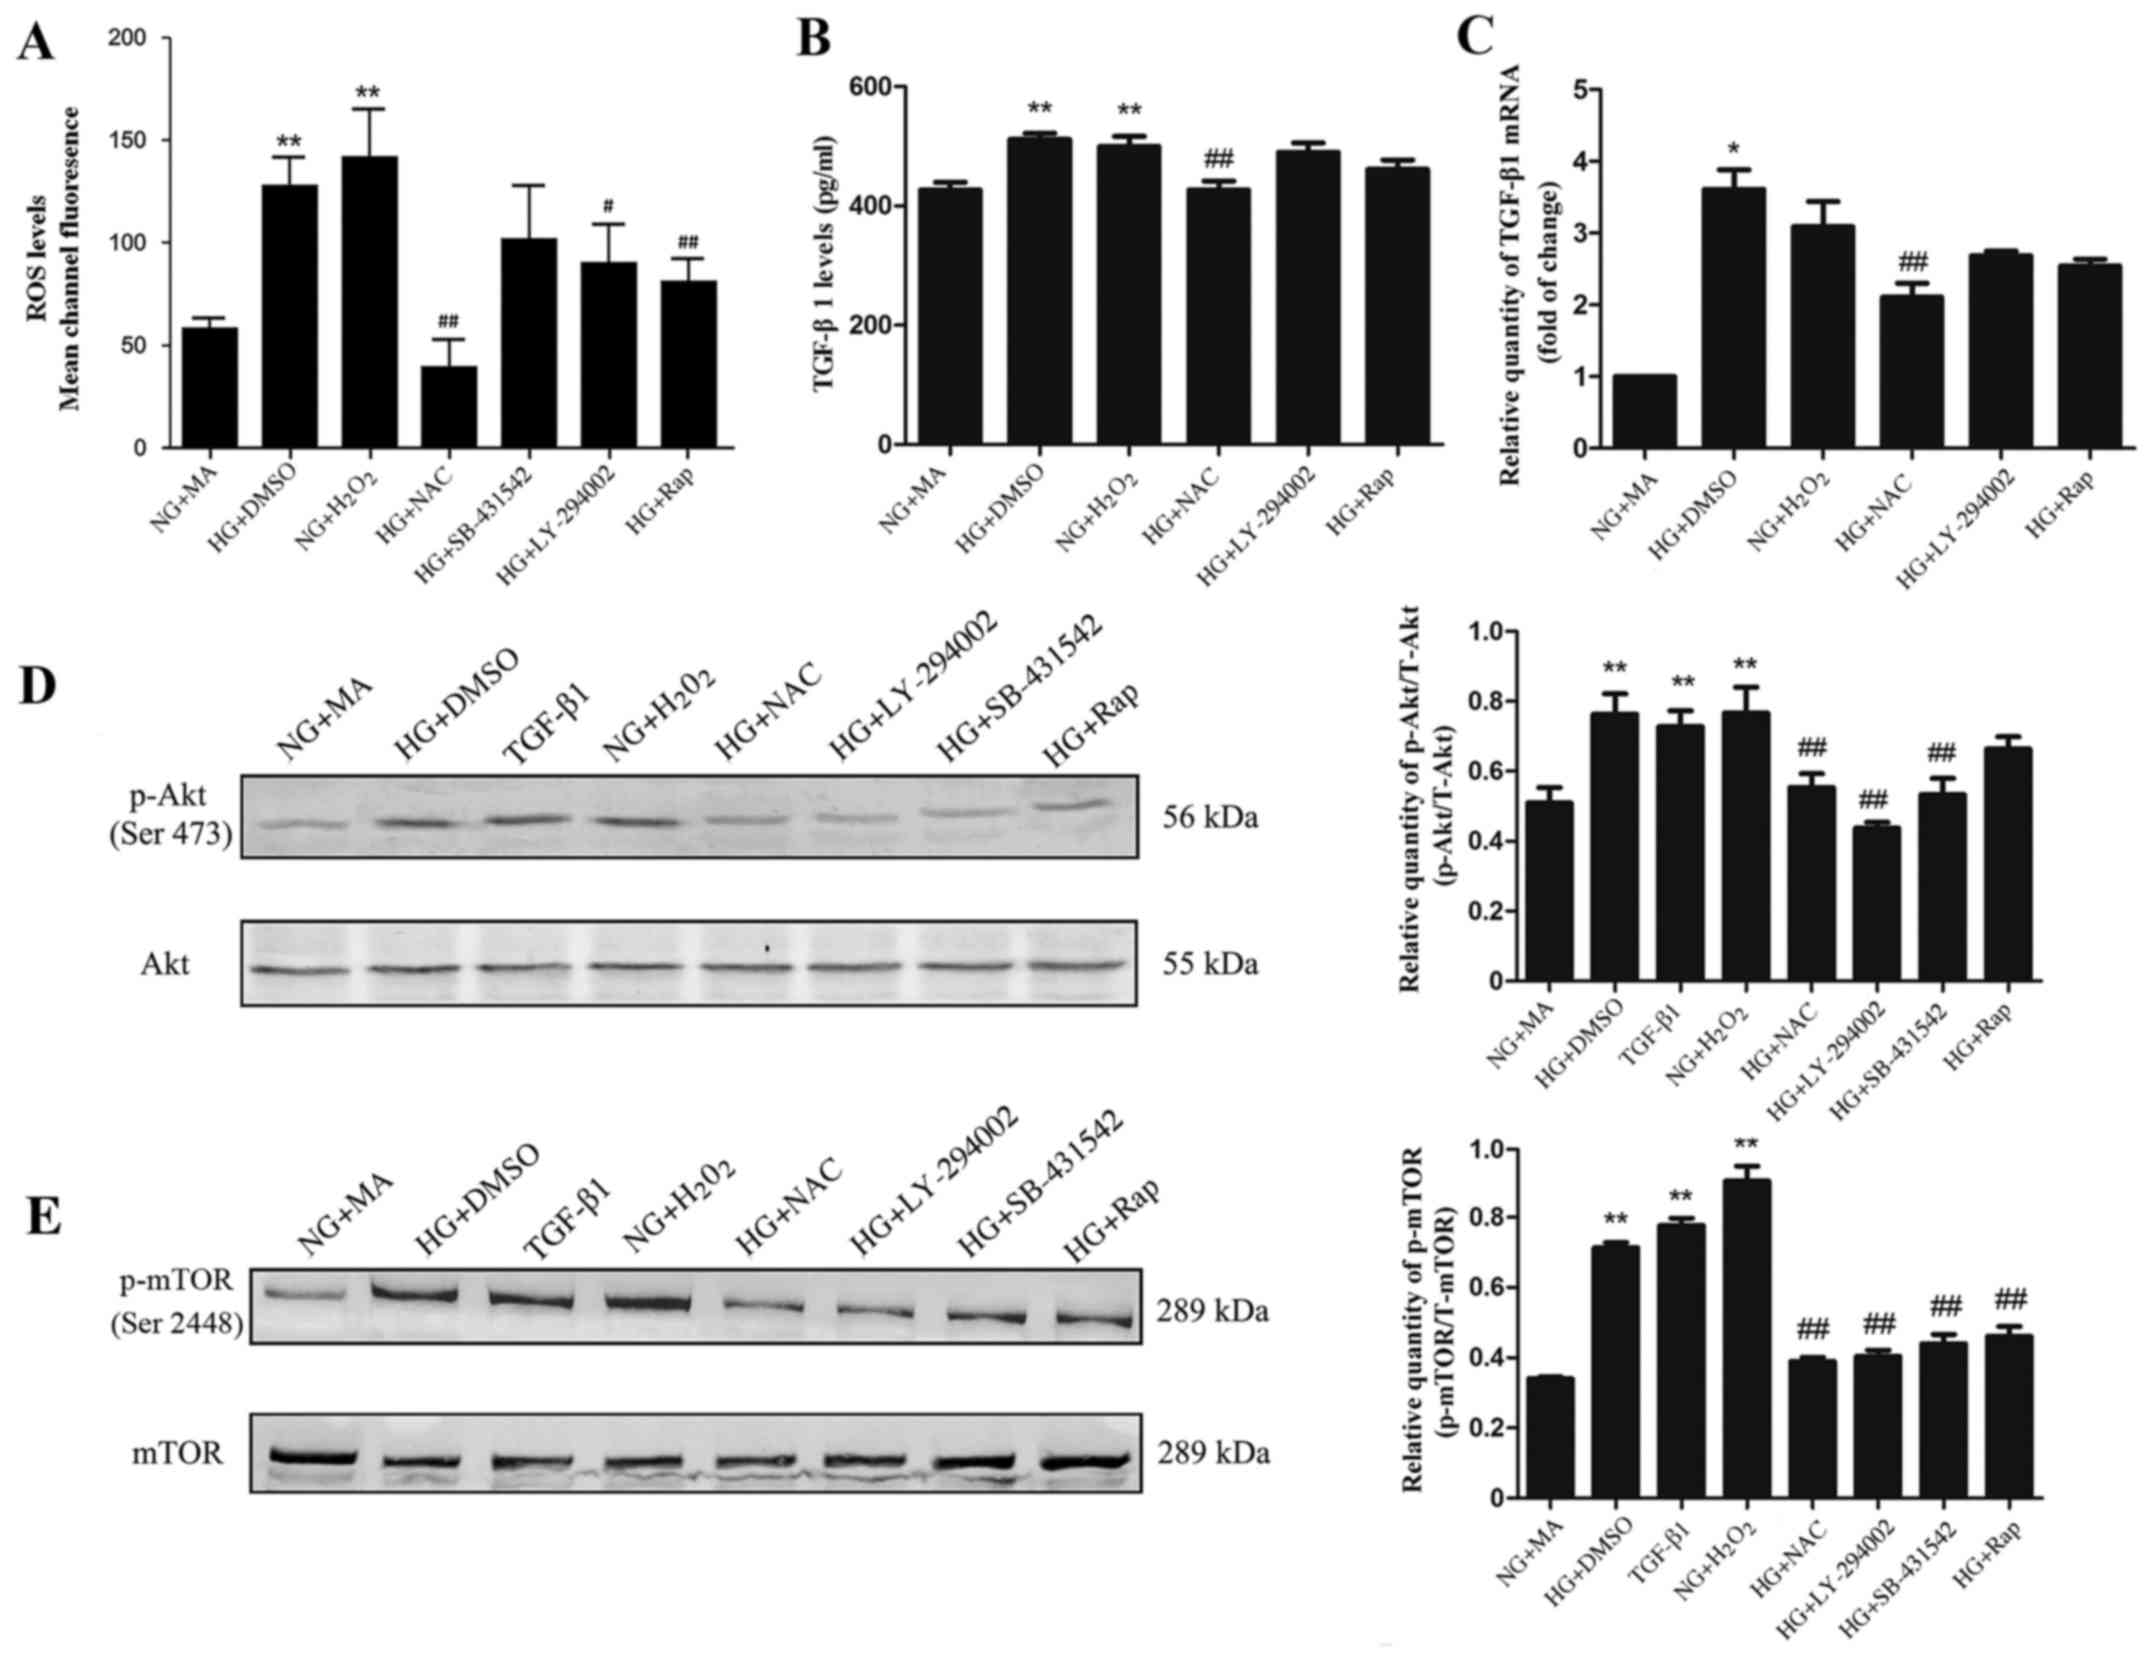 | Figure 2.Effect of HG on (A) ROS, (B) TGF-β1
protein, (C) TGF-β1 mRNA, (D) p-Akt and (E) p-mTOR in NRK-52E
cells. Cells were starved for 24 h and treated as indicated for 48
h. *P<0.05 and **P<0.01 vs. NG+MA; #P<0.05 and ##P<0.01
vs. HG. HG, high glucose (60 mmol/l); ROS, reactive oxygen species;
TGF, transforming growth factor; p, phosphorylated; Akt, protein
kinase B; mTOR, mammalian target of rapamycin; NG, normal glucose
(5.56 mmol/l); MA, mannitol; DMSO, dimethylsulfoxide; NAC,
N-acetylcysteine; Rap, rapamycin. |
HG promotes the expression of TGF-β1
via the overproduction of ROS in NRK-52E cells
H2O2 was used to simulate oxidative stress. The
expression of TGF-β1 protein was measured using ELISA and the
relative quantity of TGF-β1 was assessed using RT-qPCR. The results
revealed that, compared with the NG+MA group, the TGF-β1 protein
(Fig. 2B) and mRNA (Fig. 2C) expression was significantly
increased in the HG+DMSO group and H2O2 groups. In the NAC group,
the levels of TGF-β1 mRNA and protein were significantly decreased
compared with the HG+DMSO group (Fig. 2B
and C); however, treatment with the PI3K inhibitor LY-294002
had no significant effect (Fig. 2B and
C). Taken together, these results suggest that ROS
overproduction stimulates the expression of TGF-β1 in HG
conditions.
HG promotes PI3K/Akt/mTOR signalling
via ROS and TGF-β1 in NRK-52E cells
To evaluate the effect of ROS and TGF-β1 on
PI3K/Akt/mTOR signalling in NRK-52E cells, the phosphorylation
levels of Akt (Ser473) and mTOR (Ser2448) in HG conditions were
detected by western blotting. The expression of phosphorylated Akt
and mTOR were significantly increased in the HG+DMSO, H2O2 and
TGF-β1 groups compared with the NG+MA group (Fig. 2D and E). In contrast, treatment with
SB-431542 (TGF-β1 inhibitor), LY-294002 or NAC resulted in a
significant decrease in phosphorylated Akt and mTOR compared with
the NG+MA group (Fig. 2D and E).
Treatment with rapamycin significantly decreased the
phosphorylation of mTOR and had no significant effect on the
phosphorylation of Akt (Fig. 2D and
E). These results suggest that PI3K/Akt/mTOR signalling may be
induced by ROS and TGF-β1.
HG induces the EMT via an ROS-mediated
mechanism in NRK-52E cells
EMT of tubular epithelial cells is the leading cause
of kidney fibrosis (5). To
investigate whether EMT is induced by ROS, TGF-β1 and the
PI3K/Akt/mTOR signalling pathway, morphological changes of NRK-52E
cells were assessed under a microscope. Cells in the HG+DMSO,
TGF-β1 and H2O2 groups lost their pebbled epithelial appearance and
obtained a spindle-shaped fibrous shape compared with cells in the
NG+MA group (Fig. 3A). Furthermore,
compared with the HG+DMSO group, treatment with antioxidant NAC,
SB-431542, LY-294002 and rapamycin markedly inhibited these
morphological changes (Fig. 3A). To
further evaluate the roles of different factors in renal fibrosis,
the epithelial EMT marker E-cadherin and mesenchymal-type marker
α-SMA were assessed using western blotting and RT-qPCR. Compared
with the NG+MA group, E-cadherin was significantly decreased in the
HG+DMSO, TGF-β1 and H2O2 groups, while α-SMA was significantly
increased (Fig. 3B-E). Furthermore,
treatment with NAC, LY-294002, SB-431542 or rapamycin significantly
increased E-cadherin expression and decreased α-SMA expression
compared with the HG+DMSO group (Fig.
3B-E). These results suggest that EMT may occur due to the
ROS-induced activation of TGF-β1/PI3K/Akt/mTOR signalling under HG
conditions.
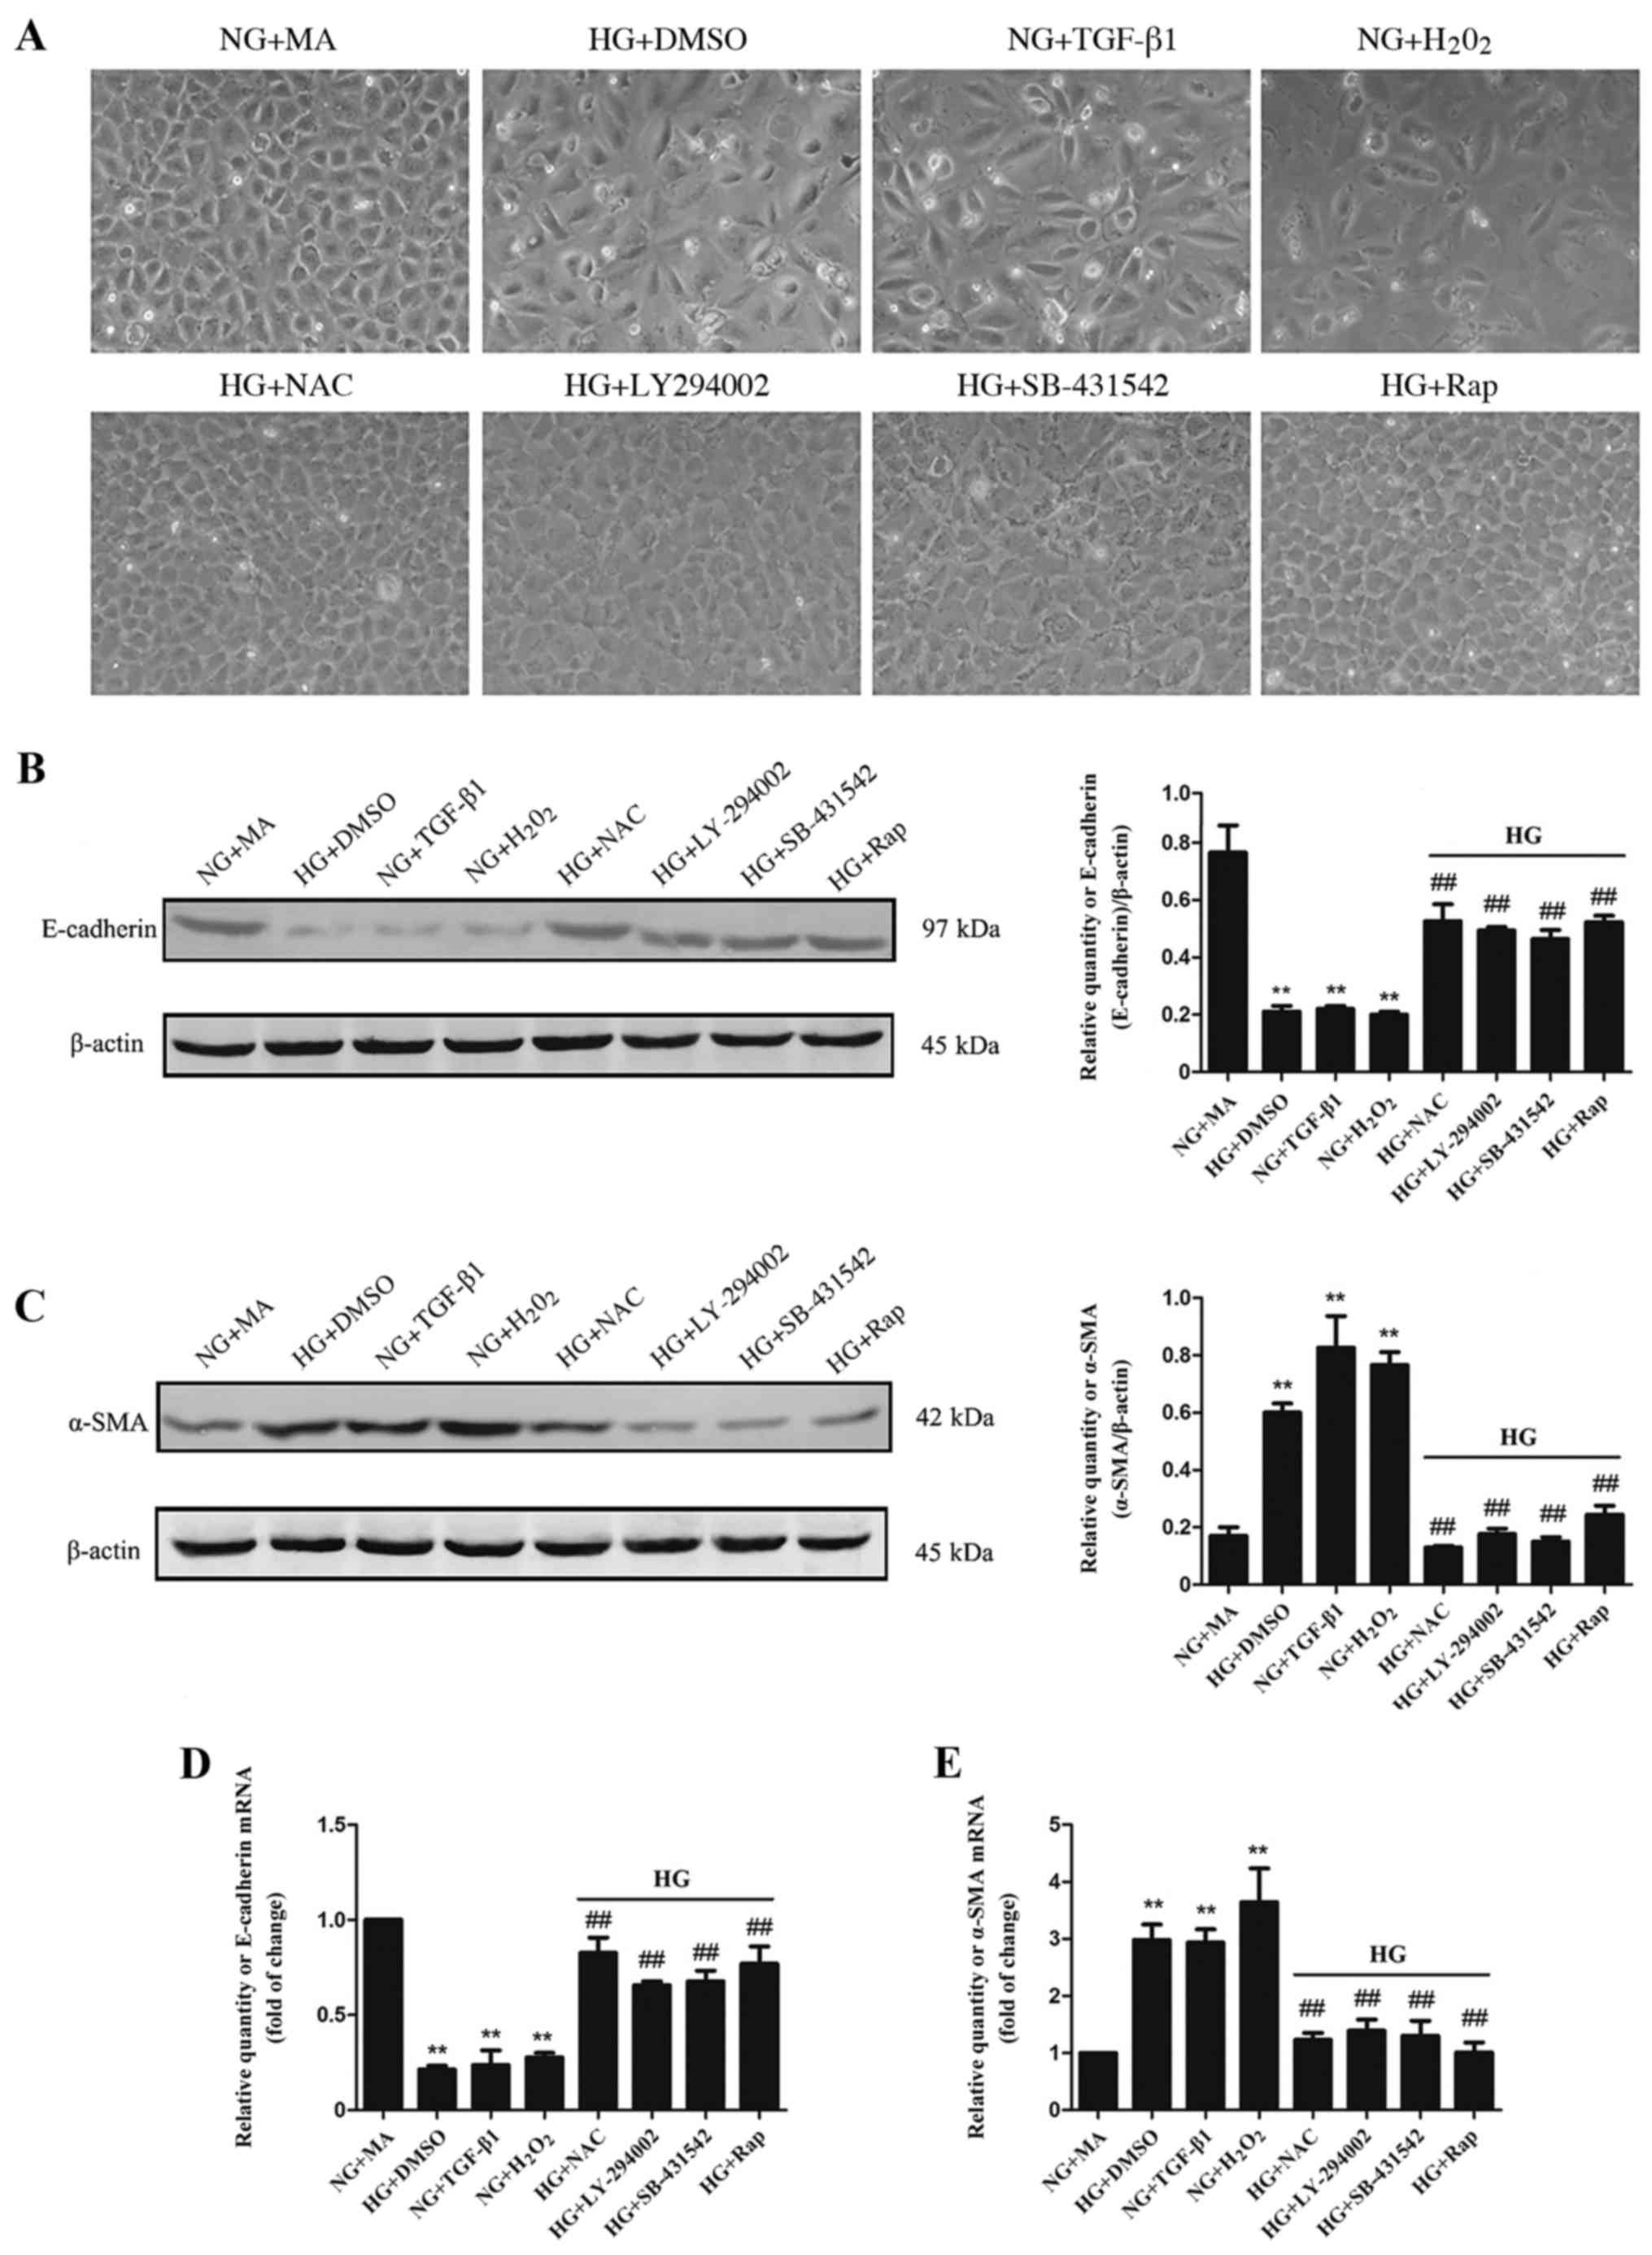 | Figure 3.Effects of HG and different factors
on EMT in NRK-52E cells. (A) Morphological changes, (B) E-cadherin
protein expression, (C) α-SMA protein expression, (D) E-cadherin
mRNA expression and (E) α-SMA mRNA expression in NRK-52E cells.
**P<0.01 vs. NG+MA and ##P<0.01 vs. HG. HG, high glucose (60
mmol/l); EMT, epithelial-mesenchymal transition; E-cadherin,
epithelial cadherin; SMA, smooth muscle actin; NG, normal glucose
(5.56 mmol/l); MA, mannitol; DMSO, dimethylsulfoxide; TGF,
transforming growth factor; NAC, N-acetylcysteine; Rap,
rapamycin. |
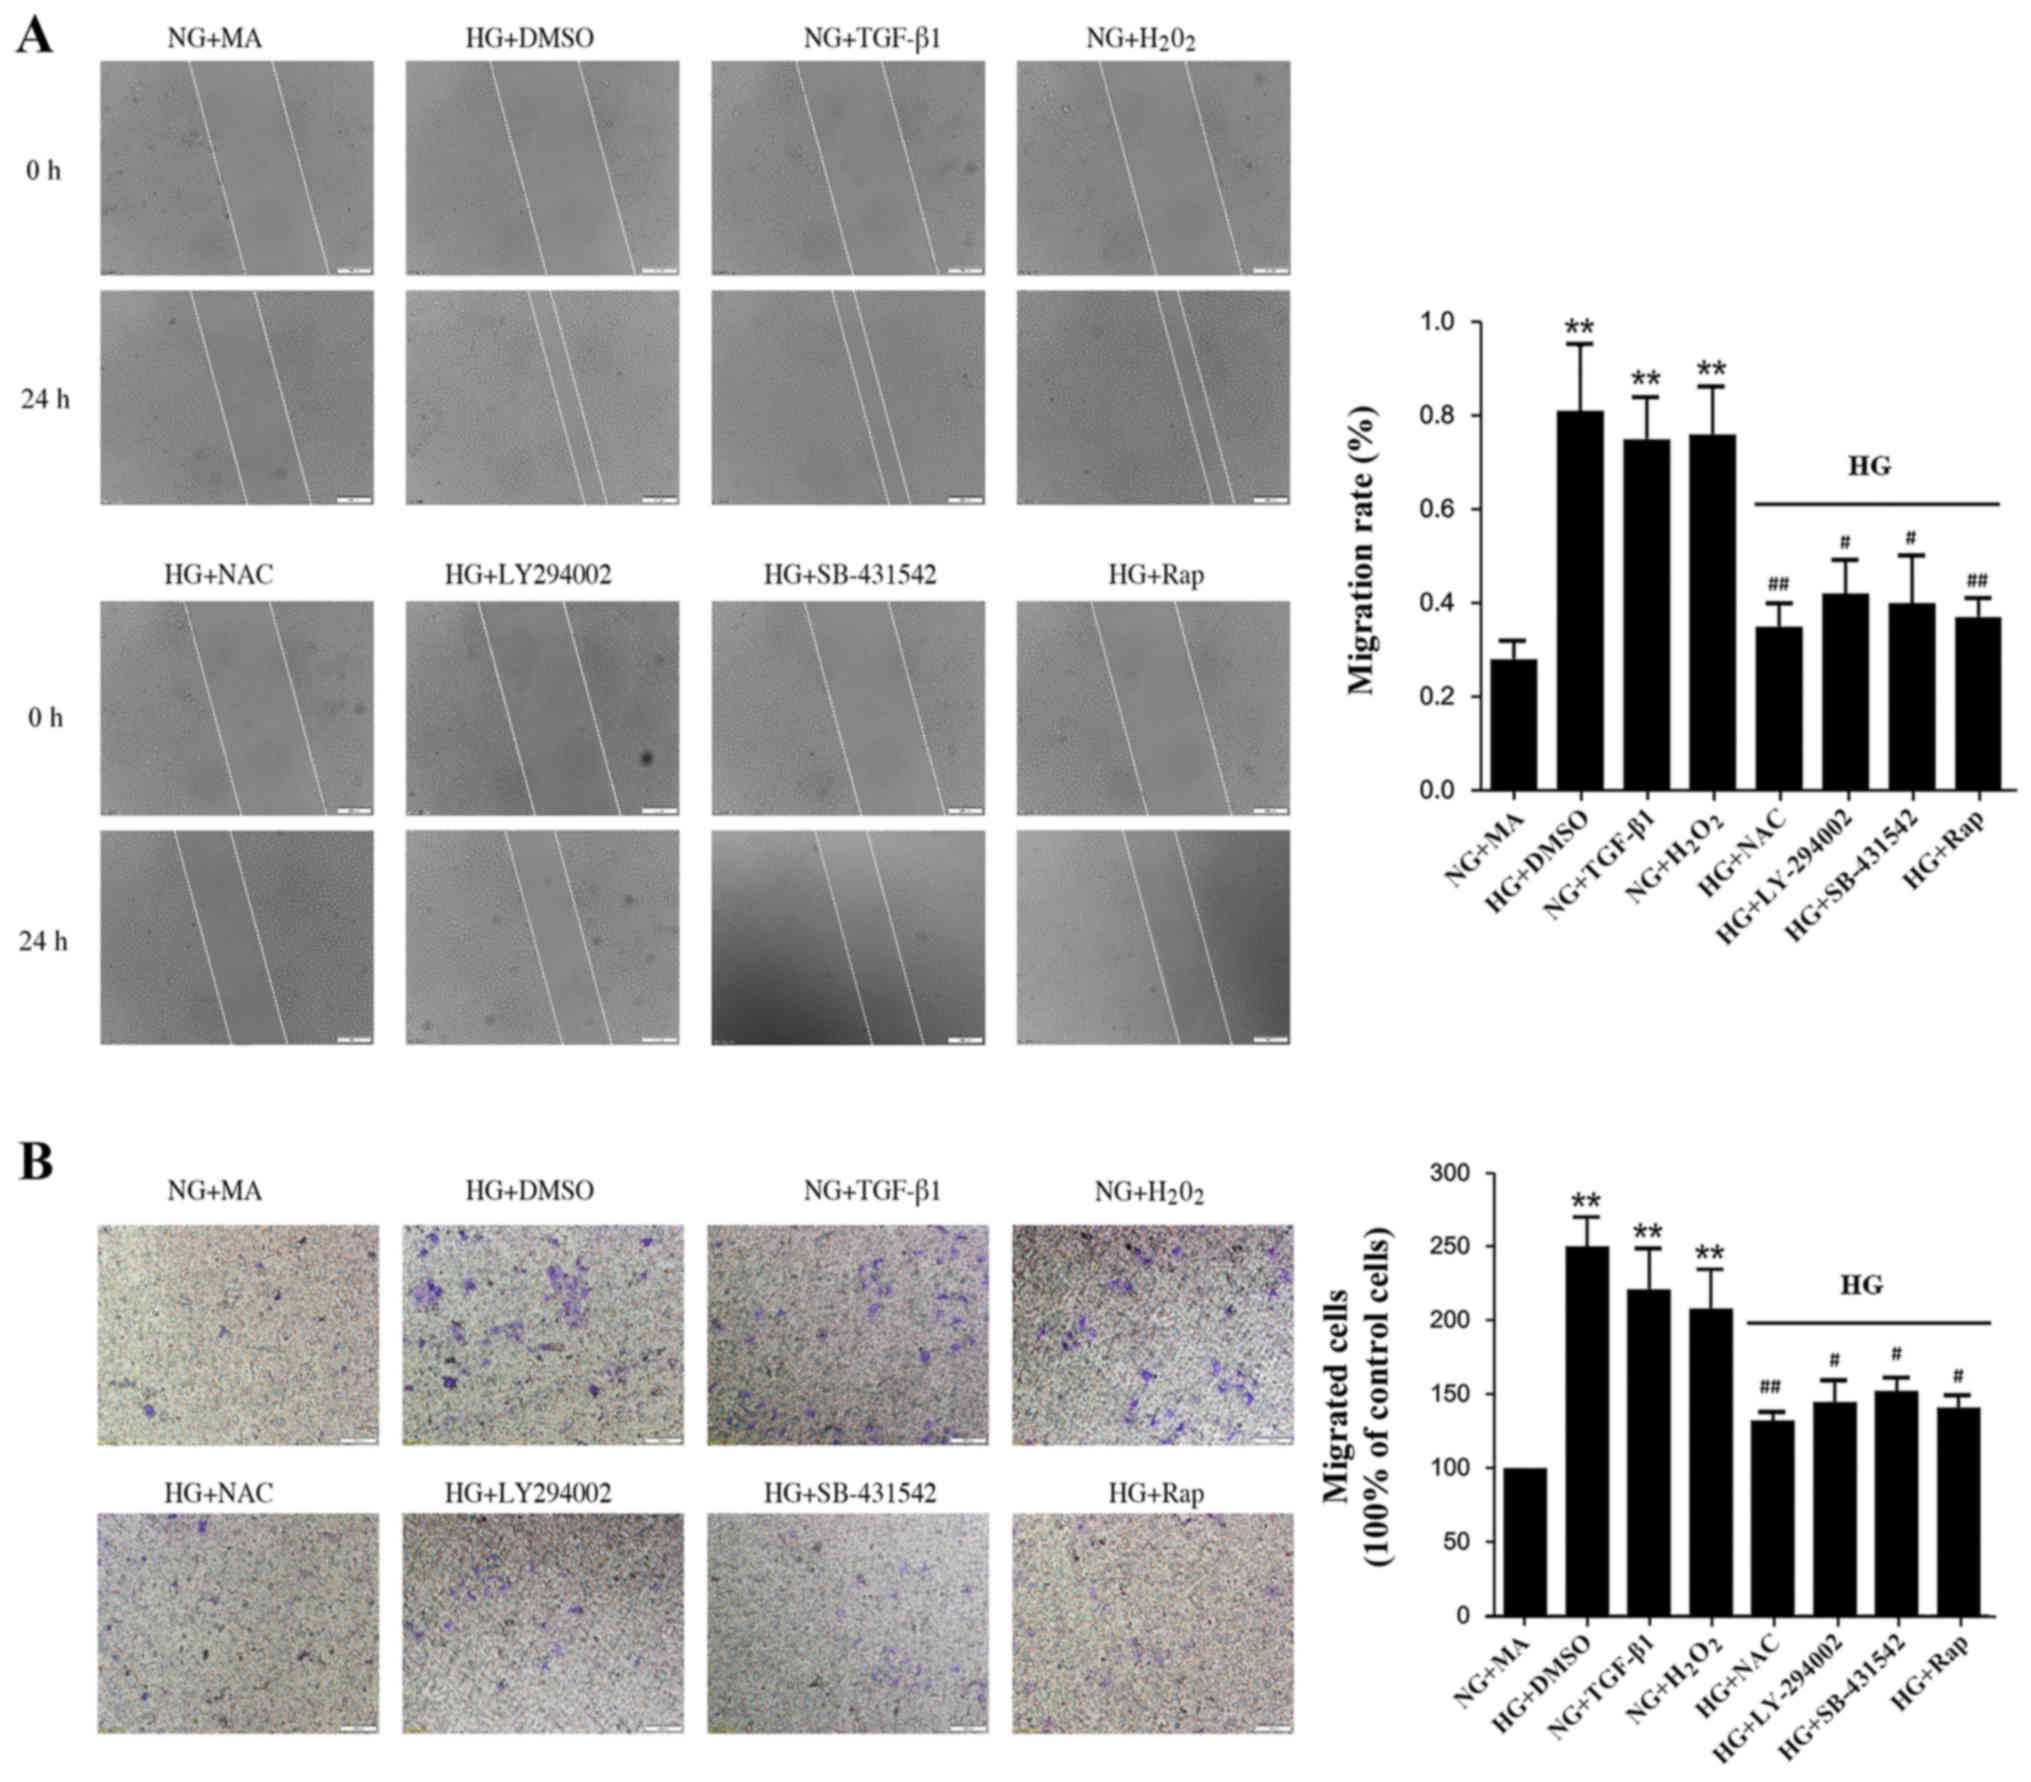
HG induces migration and invasion via
an ROS-mediated mechanism in NRK-52E cells
EMT is associated with enhanced cellular motility,
and so cell migration was assessed in the present study. The wound
closure rate of NRK-52E cells increased significantly in the
HG+DMSO, H2O2, and TGF-β1 groups compared with the NG+MA group
(Fig. 4A). Treatment with
antioxidant NAC, LY-294002, SB-431542 or rapamycin significantly
delayed wound closure (Fig. 4A).
Similarly, treatment with antioxidant NAC, LY-294002, SB-431542 or
rapamycin significantly reduced the migration of NRK-52E cells
across Transwell chambers in HG conditions (Fig. 4B). These results suggest that
inhibition of the ROS-mediated TGF-β1/PI3K/Akt/mTOR pathway results
in a significant reduction in cell migration and invasion.
Blood glucose and renal function in
the DM group
BUN, 24 h urine protein and Cr are important
indicators of renal function. A rat model of diabetes was
constructed using STZ. The results of the present study
demonstrated that blood glucose, Cr, BUN and 24 h urine protein
levels were significantly increased in the DM group compared with
the N group, which suggests that DN was successfully induced
(Table II).
| Table II.Blood glucose and renal function of
diabetic rats. |
Table II.
Blood glucose and renal function of
diabetic rats.
| Group | Fasting blood
glucose (mmol/l) | Creatinine
(µmol/l) | Blood urea nitrogen
(mmol/l) | 24 h urine protein
(mg) |
|---|
| Normal |
7.15±0.82 | 48.36±2.14 |
5.43±0.75 | 11.55±0.60 |
| Diabetic model |
29.74±2.51a |
128.52±11.10a |
18.70±4.72a |
31.65±8.83a |
Oxidative stress indicators are
increased in rats with diabetes
GSH, T-SOD and MDA are important indicators of the
oxidative stress index (31). In the
present study, GSH and T-SOD expression were decreased in the renal
cortex and serum of the DM group compared with the N group, while
MDA levels were significantly increased (Table III).
| Table III.Renal cortex and serum levels of GSH,
T-SOD and MDA. |
Table III.
Renal cortex and serum levels of GSH,
T-SOD and MDA.
|
| GSH (mg/g
protein) | T-SOD (U/mg
protein) | MDA (µmol/g
protein) |
|---|
|
|
|
|
|
|---|
| Group | Renal cortex | Serum | Renal cortex | Serum | Renal cortex | Serum |
|---|
| Normal | 1.98±0.53 | 2.63±0.41 | 78.92±16.31 | 142.29±11.17 | 0.89±0.36 | 1.24±0.27 |
| Diabetic model |
1.42±0.25b |
0.69±0.33b |
55.10±12.69b |
69.32±18.54b | 1.49±0.11b |
2.08±0.63a |
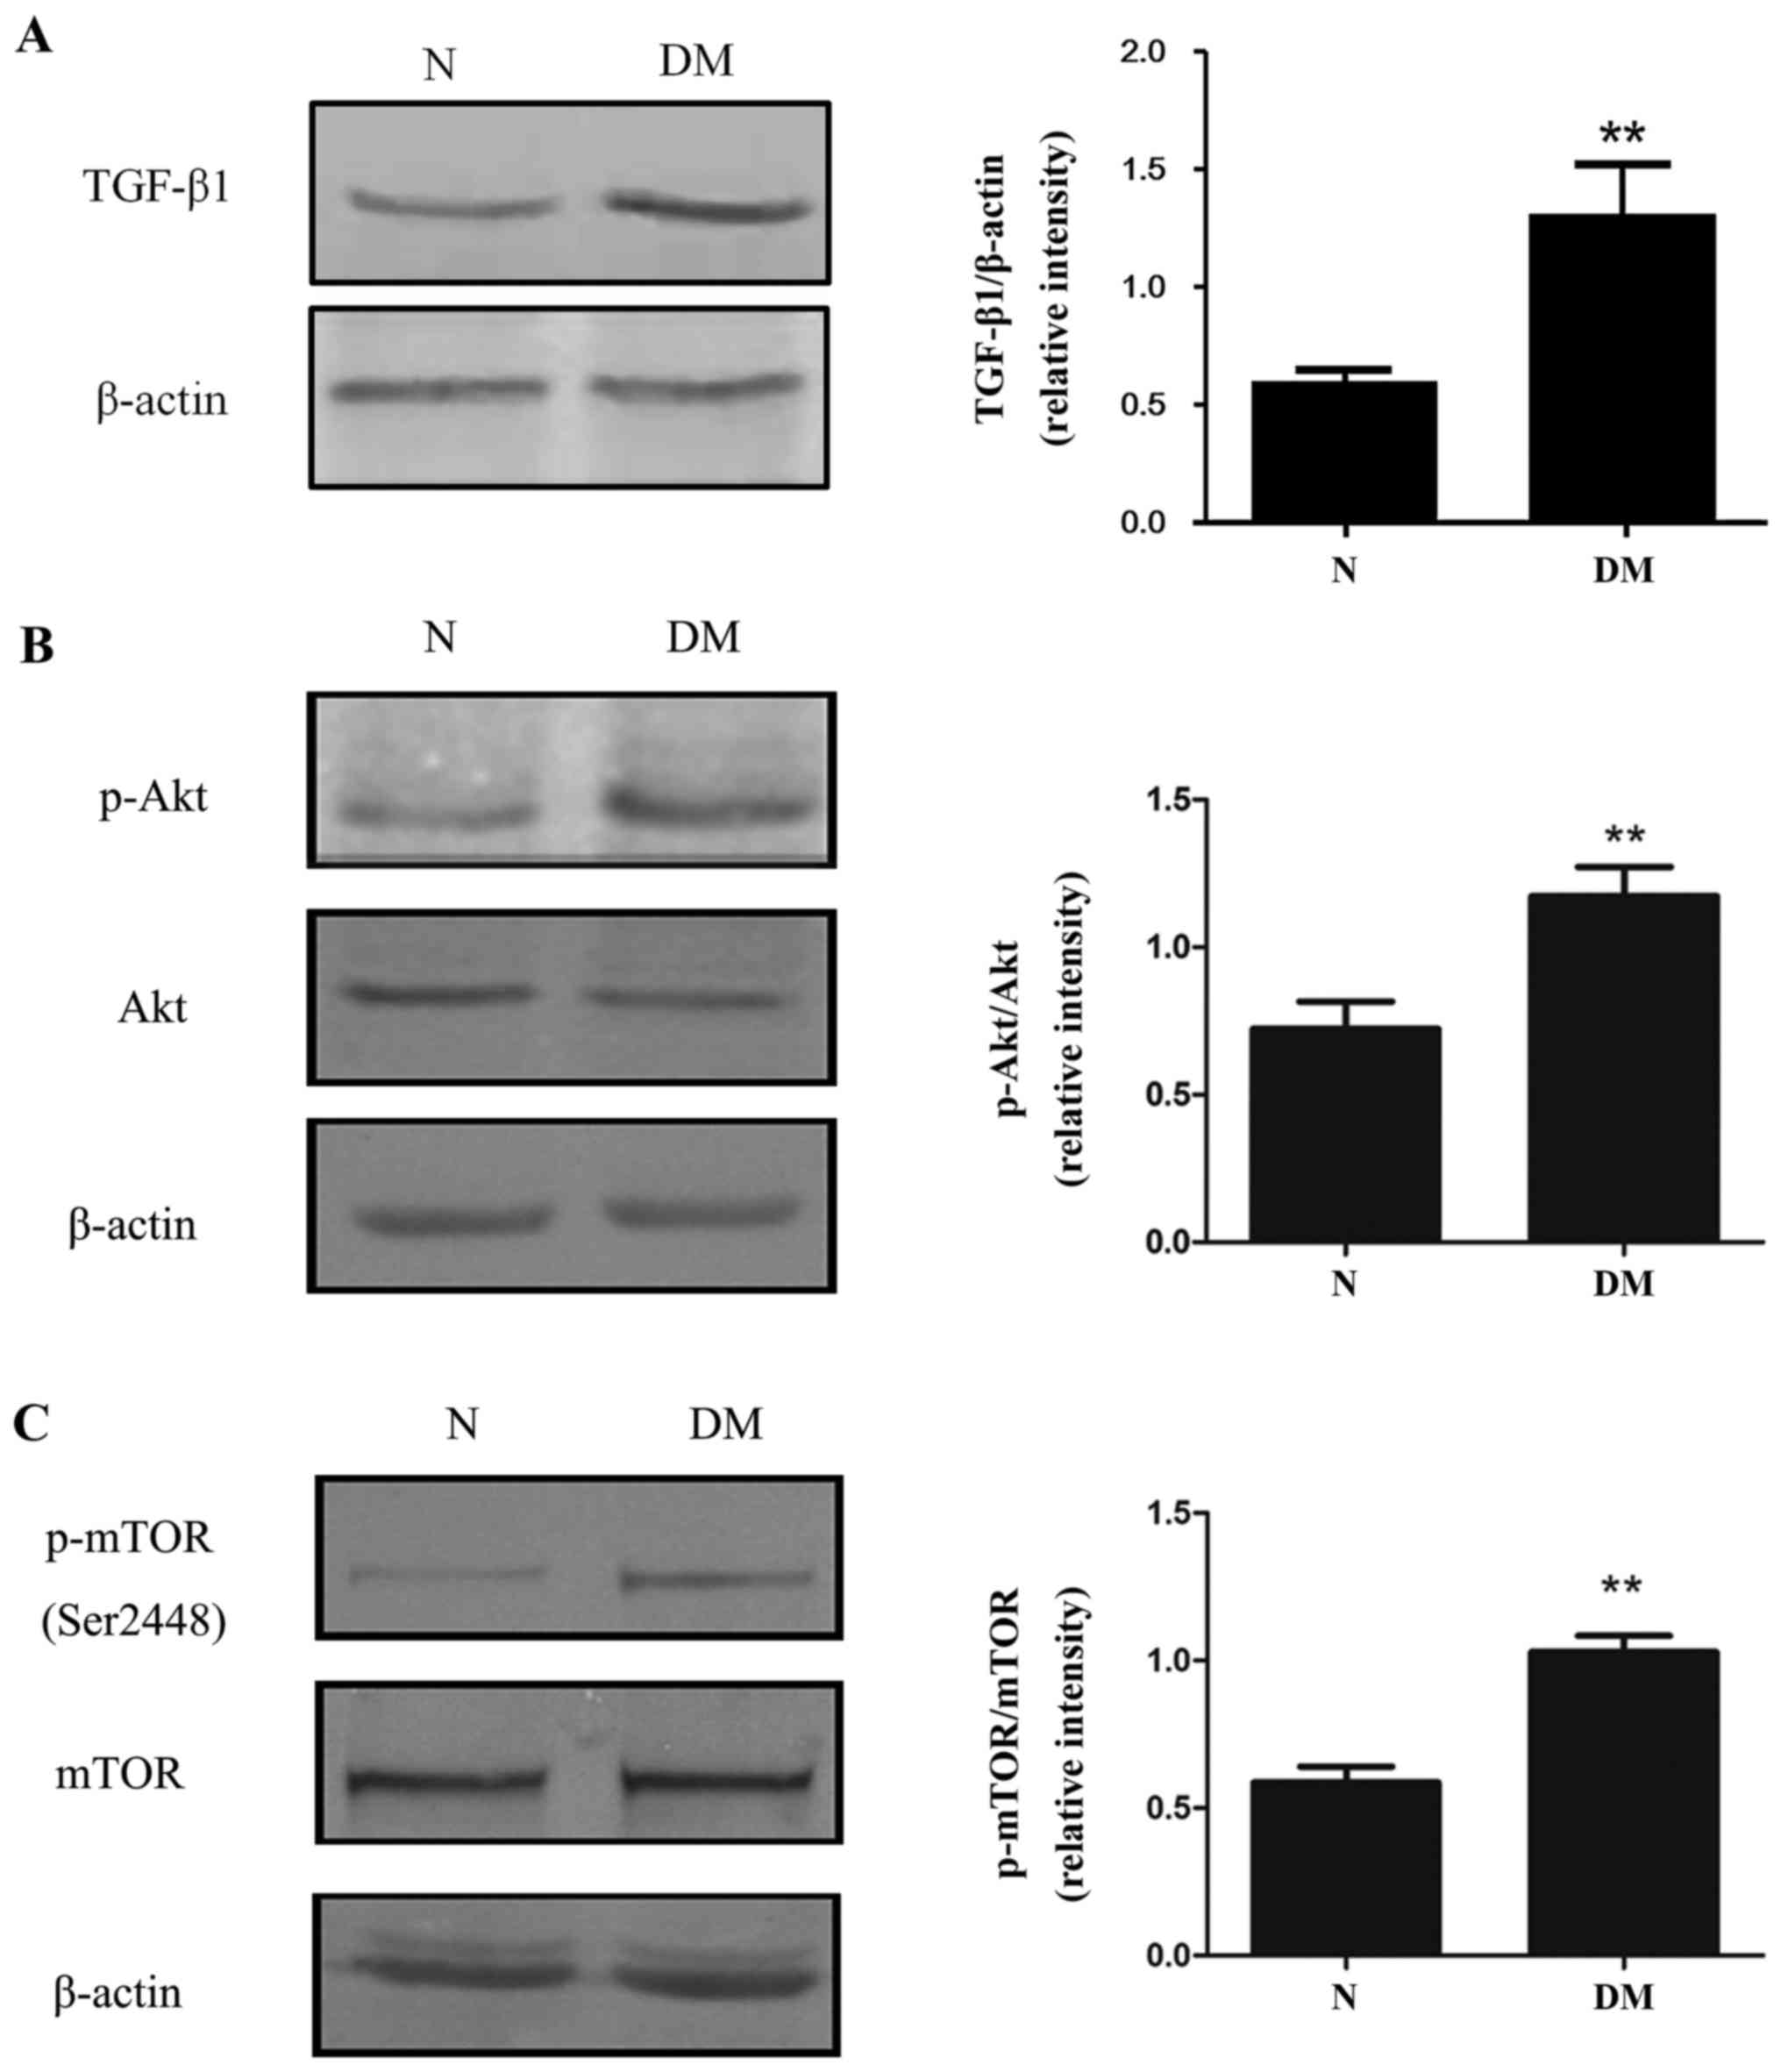
Renal fibrosis is induced by
PI3K/Akt/mTOR signalling in rats with diabetes
The relative expression of TGF-β1 was increased in
the DM group compared with the N group (Fig. 5A). Furthermore, the phosphorylation
of Akt (Ser473) and mTOR (Ser2448) were significantly increased in
the kidneys of diabetic rats (Fig. 5B
and C) compared with rats in the N group. Together, these
results suggest that activation of the PI3K/Akt/mTOR pathway may
induce EMT, leading to kidney fibrosis in diabetic rats.
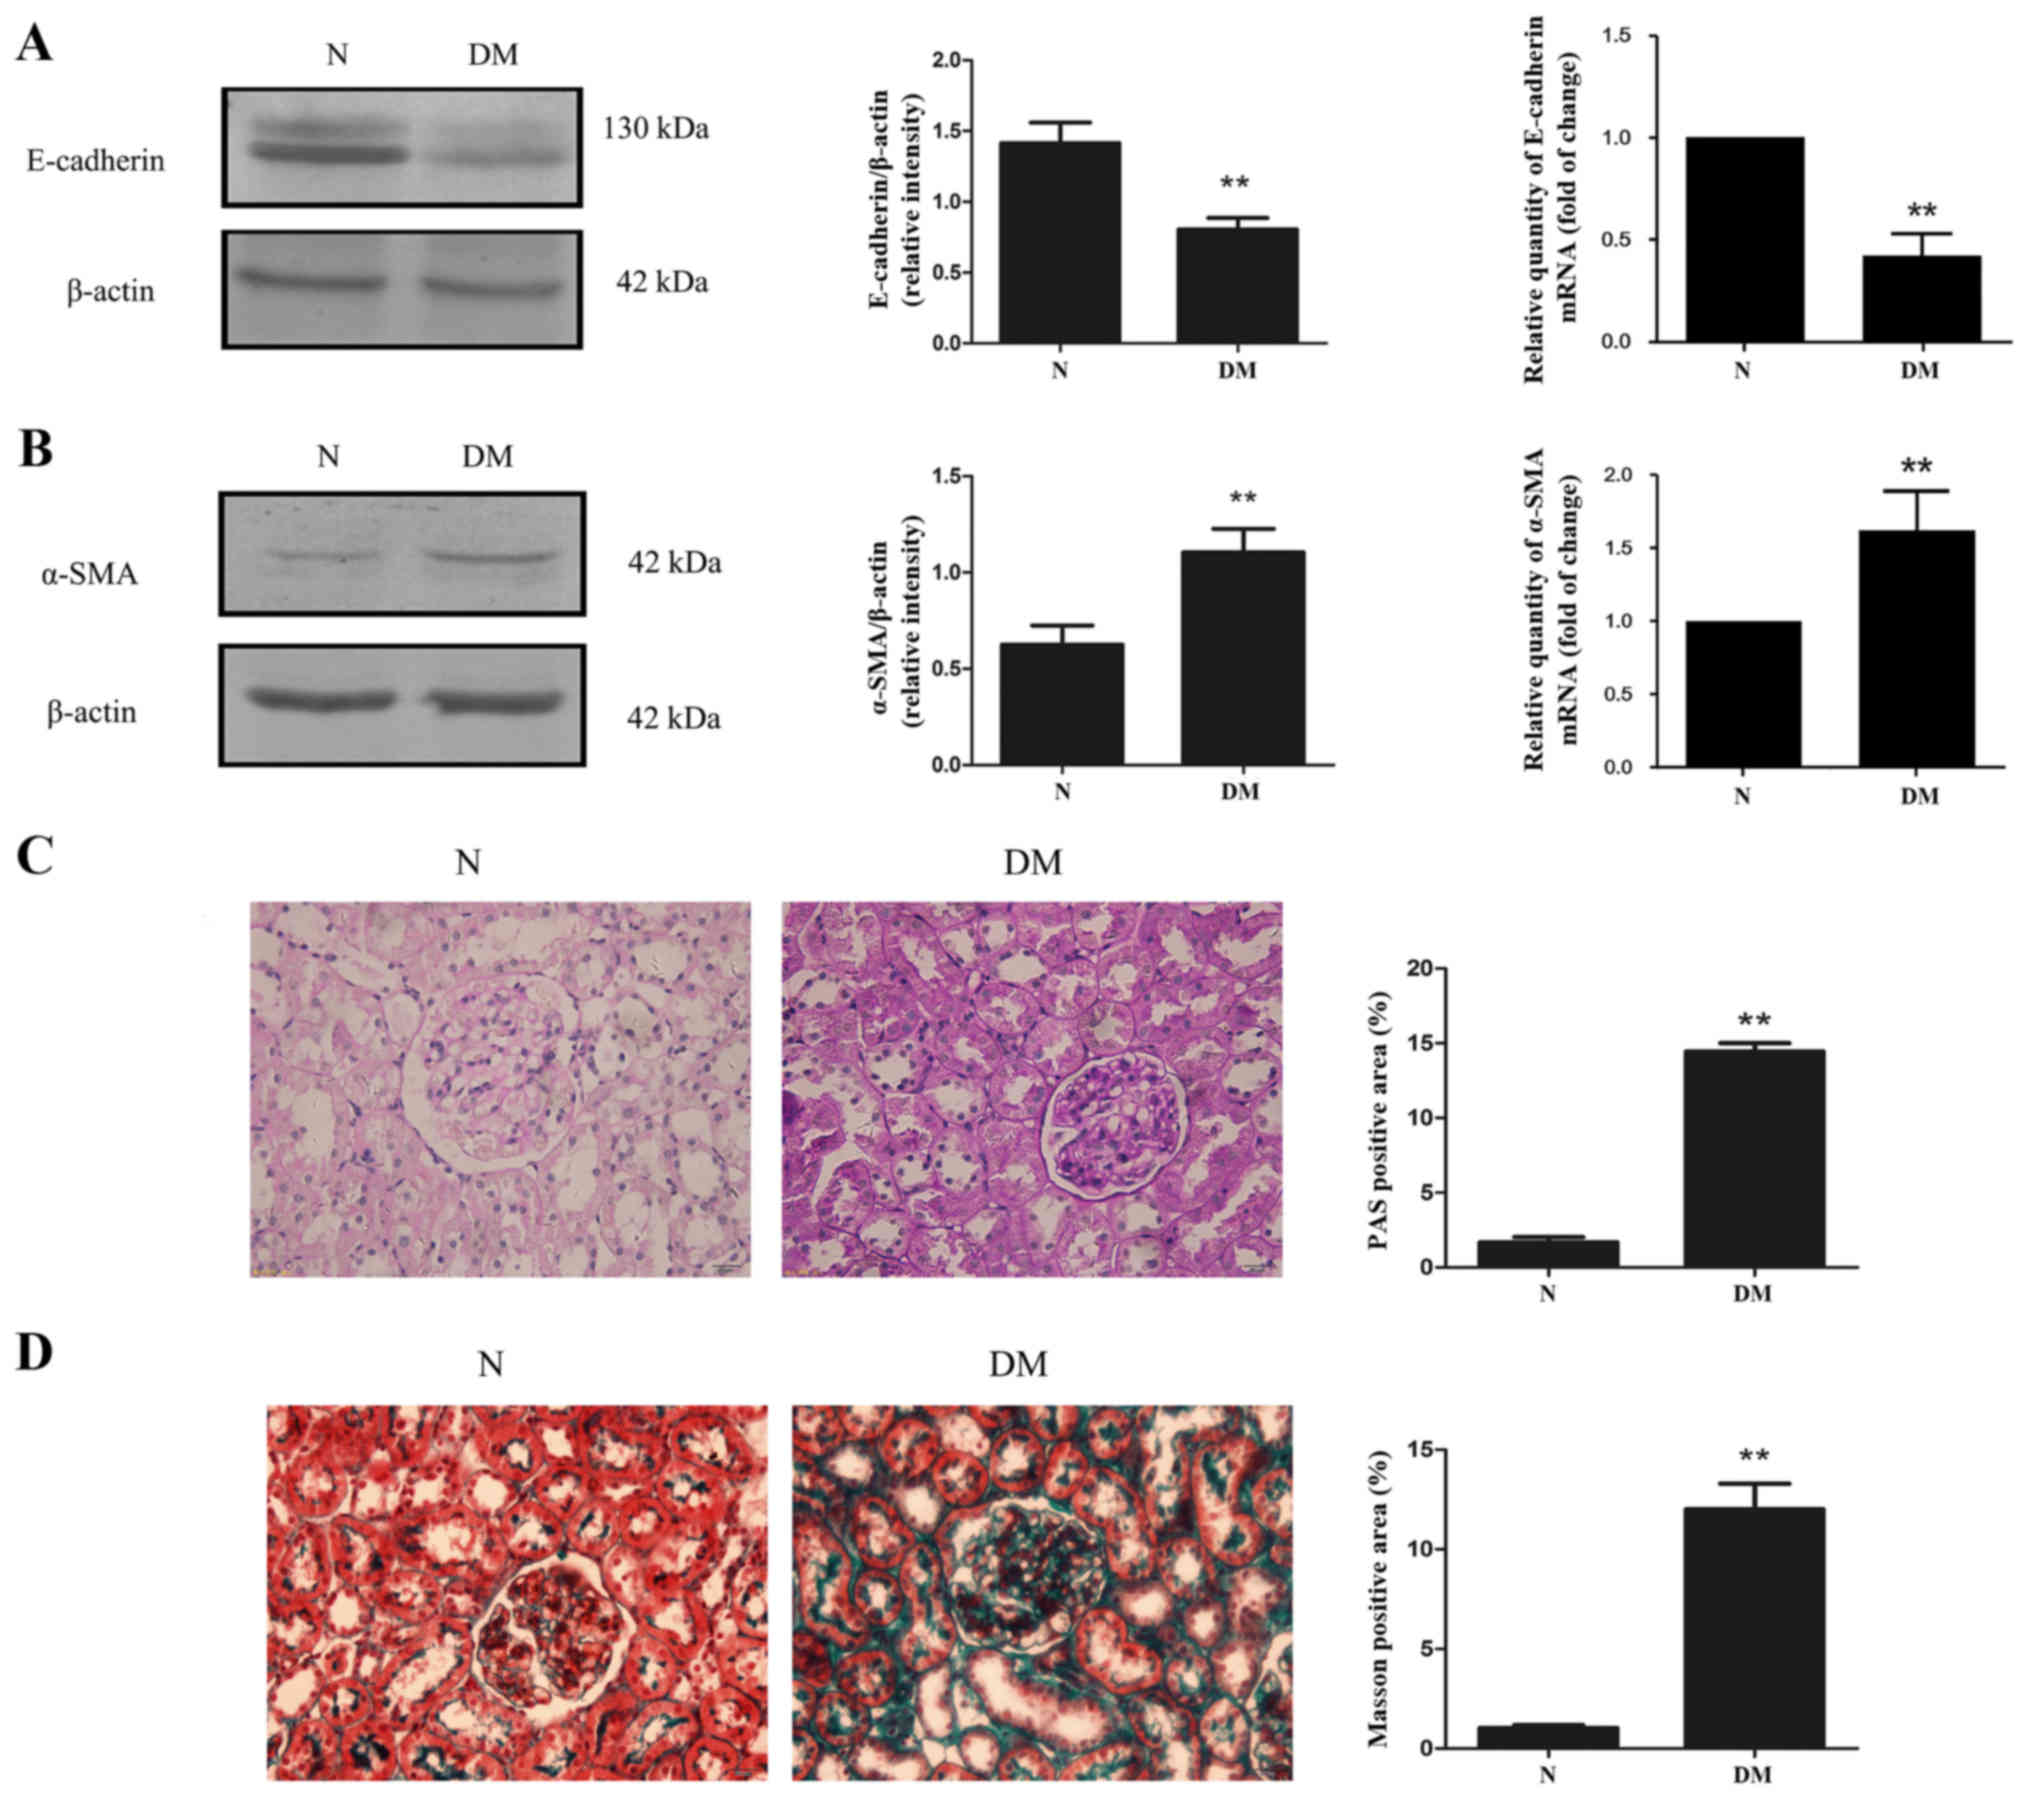
Tubular epithelial cell EMT serves an important role
in renal fibrosis. The levels of E-cadherin and α-SMA mRNA and
protein in the renal cortex of rats were detected. The results
demonstrated that diabetes caused a significant increase in α-SMA
expression, while E-cadherin expression was significantly decreased
compared with rats in the N group (Fig.
6A and B). To further explore kidney fibrosis in diabetes, the
extent of mesangial matrix dilation was examined using periodic
acid Schiff (PAS) staining (Fig.
6C). Positive PAS staining was significantly increased in rats
from the DM group compared with those from the N group (Fig. 6C). Additionally, Masson staining
revealed that kidney fibrosis was exacerbated in rats with diabetes
compare with the N group (Fig.
6D).
Discussion
The excessive deposition of extracellular matrix in
the glomeruli and renal tubules is a typical manifestation of DN,
causing glomerulosclerosis and renal interstitial fibrosis
(32). It has previously been
reported that renal interstitial fibrosis serves an essential role
in all types of progressive CKD (33). In the present study, interstitial
changes to the kidney and the conventional parameters of 24-h urine
protein, BUN and Cr were monitored. In order to observe the extent
of kidney fibrosis, collagen and glycogen deposition were
visualized using Masson and PAS staining. Collagen and glycogen
accumulation was detected in the glomeruli, tubular basement
membrane and kidney interstitial areas of rats with diabetes. These
results suggest that kidney fibrosis is an important pathological
feature of DN.
EMT is considered to be a major mechanism of renal
fibrosis in DN (8). EMT of renal
tubular epithelial cells is characterized by a loss of epithelial
proteins, including E-cadherin, and increased expression of
mesenchymal markers, including α-SMA (34). Changes in the expression of these
proteins are generally accompanied by morphological changes from a
cubic shape to a fibroblastoid appearance, as well as an increase
in cell invasion and migration (4).
A number of previous studies have reported that HG induces EMT via
a number of factors and mechanisms (29,35,36),
which is in agreement with the results of the present study. As
well as the results of in vitro experiments, the present
study demonstrated that E-cadherin expression was decreased and
α-SMA expression was increased in rats with diabetes in
vivo. Furthermore, wound-healing and Transwell chamber assays
confirmed that HG induces migration and invasion in NRK-52E cells.
These results demonstrate that HG conditions promote renal tubular
EMT in diabetic nephropathy.
ROS overproduction under hyperglycaemic conditions
serves a core role in the pathogenesis of diabetic complications
(11,12). ROS can cause DNA, protein and lipid
injuries, as well as acting as signalling molecules in multiple
pathways that cause cellular damage (9,37,38). The
present study demonstrated that HG conditions increase ROS
generation, decrease levels of T-SOD and GSH and increase MDA
content, which suggests that HG aggravates oxidative stress in
NRK-52E cells and rats with diabetes. However, treatment with
antioxidant NAC effectively inhibits ROS generation in an HG
environment. NAC also increased the expression of E-cadherin,
reduced the expression of α-SMA, significantly delayed wound
closure and prevented the migration of NRK-52E cells across the
Transwell chamber. These results suggest that ROS serves a role in
the development of EMT.
ROS is associated with EMT induced by TGF-β1,
aldosterone, albumin or oxidized low-density lipoprotein, which is
consistent with earlier studies (39). The upregulation of TGF-β1 in
vitro and in vivo serves a significant role in the
pathogenesis of DN (15,40) and it was demonstrated that TGF-β1
expression was increased under HG conditions. H2O2, which was used
as an agent to simulate oxidative stress, also increased the
expression of TGF-β1. However, the expression of TGF-β1 was
significantly downregulated with NAC treatment under HG conditions.
Thus, these results suggest that TGF-β1 upregulation in NRK-52E
cells and diabetic rats is due, in part, to the excessive
production of ROS under HG conditions.
It has been confirmed that the classic TGF-β1-Smad
pathway is able to mediate the pathogenesis of fibrosis.
Non-Smad-dependent pathways downstream of TGF-β1 have been reported
to serve important roles in the occurrence and development of EMT,
the P13K/Akt signaling pathway is particularly important (41). The results of the present study
revealed that the expression of phosphorylated-Akt was increased in
HG and diabetic conditions, while treatment with NAC, LY-294002 and
SB-431542 groups decreased the phosphorylation of Akt in
vitro. The results of the present study indicate that the
TGF-β1/PI3K/Akt pathway may be positively activated by excessive
production of ROS in diabetes.
mTOR is a serine/threonine kinase, which belongs to
the family of phosphatidylinositol kinase-related kinase (PIKK)
(23). A number of cell signals are
mediated by mTOR, including nutrients, energy and growth factors,
to regulate transcription, translation, autophagy and ribosome
biogenesis (23–26). Previous animal and clinical studies
have reported that mTOR serves a role in diabetic nephropathy and
that the inhibition of mTORC1 with rapamycin attenuates
morphological and functional disorders in diabetic kidneys
(42,43). Furthermore, mTOR promotes
interstitial fibrosis by enhancing the proliferation of fibroblasts
and affects tubular EMT through profibrotic cytokines (26). In the present study, the effect of
mTOR on HG-induced EMT was assessed and the possible mechanisms
were explored. The results demonstrated that mTOR phosphorylation
was significantly increased, wound closure was accelerated and
migration was increased in the TGF-β1 and H2O2 groups compared with
the NG+MA group. Similarly, the expression of p-mTOR was increased
and kidney fibrosis was exacerbated in rats with diabetes. However,
following treatment with NAC, SB-431542, LY-294002 or rapamycin,
p-mTOR was decreased and cell migration and invasion were delayed,
preventing the progression of EMT in NRK-52E cells. These results
suggest that mTOR regulates EMT in HG conditions via the
TGF-β1/PI3K/Akt signalling pathway. This is in agreement with a
previous study, in which it was demonstrated that PI3K/Akt was
activated during TGF-β1-induced EMT in cancer cells (44).
In summary, the present study demonstrates HG
induces ROS generation, which activates the PI3K/Akt signalling
pathway via TGF-β1 upregulation, leading to mTOR phosphorylation,
EMT and accelerated renal fibrosis in DN.
Acknowledgements
The authors would like to thank Mrs Chen Sha
(Nanjing University of Traditional Chinese Medicine, Nanjing,
China) for the donation of the normal rat kidney tubular epithelial
cell line (NRK-52E).
Funding
The present study was supported by the National
Natural Science Foundation of China (grant nos. 81473257 and
81400741), the Qian Lan Project, the Natural Science Foundation of
Jiangsu Province (grant no. BK20151155), the ‘333’ Foundation of
the Jiangsu Province (grant no. BRA2015329), the Key Natural
Science Foundation of the Jiangsu Higher Education Institutions of
China (grant no. 15KJA310005), Jiangsu Overseas Research and
Training Program for University Prominent Young and Middle-aged
Teachers and Presidents and the Priority Academic Program
Development of Jiangsu Higher Education Institutions (PAPD).
Availability of data and materials
All data generated or analysed during this study are
included in this published article.
Authors' contributions
QL and XXY designed and supervised the study. WWW,
MZZ, ZXM and XRQ performed the experiments and analyzed the data.
MS analyzed the data.
Ethics approval and consent to
participate
The present study was approved by the Animal Ethics
Committee of Xuzhou Medical University (Xuzhou, China) and all
experiments were performed in accordance with the Guidelines for
Ethical Conduct in the Care and Use of Animals.
Consent for publication
Not applicable.
Competing interests
The authors declare that there are no competing
interests.
References
|
1
|
Cooper ME: Pathogenesis, prevention, and
treatment of diabetic nephropathy. Lancet. 352:213–219. 1998.
View Article : Google Scholar : PubMed/NCBI
|
|
2
|
Kanwar YS, Sun L, Xie P, Liu FY and Chen
S: A glimpse of various pathogenetic mechanisms of diabetic
nephropathy. Annu Rev Pathol. 6:395–423. 2011. View Article : Google Scholar : PubMed/NCBI
|
|
3
|
Eddy AA: Molecular basis of renal
fibrosis. Pediatr Nephrol. 15:290–301. 2000. View Article : Google Scholar : PubMed/NCBI
|
|
4
|
Zeisberg M and Neilson EG: Biomarkers for
epithelial-mesenchymal transitions. J Clin Invest. 119:1429–1437.
2009. View
Article : Google Scholar : PubMed/NCBI
|
|
5
|
Hu N, Duan J, Li H, Wang Y, Wang F, Chu J,
Sun J, Liu M, Wang C, Lu C and Wen A: Hydroxysafflor yellow a
ameliorates renal fibrosis by suppressing TGF-β1-induced
epithelial-to-mesenchymal transition. PLoS One. 11:e01534092016.
View Article : Google Scholar : PubMed/NCBI
|
|
6
|
Burns WC and Thomas MC: Angiotensin II and
its role in tubular epithelial to mesenchymal transition associated
with chronic kidney disease. Cells Tissues Organs. 193:74–84. 2011.
View Article : Google Scholar : PubMed/NCBI
|
|
7
|
Yang YL, Ju HZ, Liu SF, Lee TC, Shih YW,
Chuang LY, Guh JY, Yang YY, Liao TN, Hung TJ and Hung MY: BMP-2
suppresses renal interstitial fibrosis by regulating epithelial
mesenchymal transition. J Cell Biochem. 112:2558–2565. 2011.
View Article : Google Scholar : PubMed/NCBI
|
|
8
|
Liu Y: Epithelial to mesenchymal
transition in renal fibrogenesis: Pathologic significance,
molecular mechanism, and therapeutic intervention. J Am Soc
Nephrol. 15:1–12. 2004. View Article : Google Scholar : PubMed/NCBI
|
|
9
|
Rösen P, Nawroth PP, King G, Möller W,
Tritschler HJ and Packer L: The role of oxidative stress in the
onset and progression of diabetes and its complications: A summary
of a congress series sponsored by UNESCO-MCBN, the American
diabetes association and the German diabetes society. Diabetes
Metab Res Rev. 17:189–212. 2001. View
Article : Google Scholar : PubMed/NCBI
|
|
10
|
Giacco F and Brownlee M: Oxidative stress
and diabetic complications. Circ Res. 107:1058–1070. 2010.
View Article : Google Scholar : PubMed/NCBI
|
|
11
|
Kashihara N, Haruna Y, Kondeti VK and
Kanwar YS: Oxidative stress in diabetic nephropathy. Curr Med Chem.
17:4256–4269. 2010. View Article : Google Scholar : PubMed/NCBI
|
|
12
|
Brownlee M: The pathobiology of diabetic
complications: A unifying mechanism. Diabetes. 54:1615–1625. 2005.
View Article : Google Scholar : PubMed/NCBI
|
|
13
|
Smith KA, Zhou B, Avdulov S, Benyumov A,
Peterson M, Liu Y, Okon A, Hergert P, Braziunas J, Wagner CR, et
al: Transforming growth factor-β1 induced epithelial mesenchymal
transition is blocked by a chemical antagonist of translation
factor eIF4E. Sci Rep. 5:182332015. View Article : Google Scholar : PubMed/NCBI
|
|
14
|
Shirakihara T, Horiguchi K, Miyazawa K,
Ehata S, Shibata T, Morita I, Miyazono K and Saitoh M: TGF-β
regulates isoform switching of FGF receptors and
epithelial-mesenchymal transition. EMBO J. 30:783–795. 2011.
View Article : Google Scholar : PubMed/NCBI
|
|
15
|
Hills CE and Squires PE: The role of TGF-β
and epithelial-to mesenchymal transition in diabetic nephropathy.
Cytokine Growth Factor Rev. 22:131–139. 2011.PubMed/NCBI
|
|
16
|
Ji Y, Dou YN, Zhao QW, Zhang JZ, Yang Y,
Wang T, Xia YF, Dai Y and Wei ZF: Paeoniflorin suppresses TGF-β
mediated epithelial-mesenchymal transition in pulmonary fibrosis
through a Smad-dependent pathway. Acta Pharmacol Sin. 37:794–804.
2016. View Article : Google Scholar : PubMed/NCBI
|
|
17
|
Kattla JJ, Carew RW, Heljic M, Godson C
and Brazil DP: Protein kinase B/Akt activity is involved in renal
TGF-beta1-driven epithelial-mesenchymal transition in vitro and in
vivo. Am J Physiol Renal Physiol. 295:F215–F225. 2008. View Article : Google Scholar : PubMed/NCBI
|
|
18
|
Risso G, Blaustein M, Pozzi B, Mammi P and
Srebrow A: Akt/PKB: One kinase, many modifications. Biochem J.
468:203–214. 2015. View Article : Google Scholar : PubMed/NCBI
|
|
19
|
Lu Q, Zhai Y, Cheng Q, Liu Y, Gao X, Zhang
T, Wei Y, Zhang F and Yin X: The Akt-FoxO3a-manganese superoxide
dismutase pathway is involved in the regulation of oxidative stress
in diabetic nephropathy. Exp Physiol. 98:934–945. 2013. View Article : Google Scholar : PubMed/NCBI
|
|
20
|
Lu Q, Zuo WZ, Ji XJ, Zhou YX, Liu YQ, Yao
XQ, Zhou XY, Liu YW, Zhang F and Yin XX: Ethanolic Ginkgo biloba
leaf extract prevents renal fibrosis through Akt/mTOR signaling in
diabetic nephropathy. Phytomedicine. 22:1071–1078. 2015. View Article : Google Scholar : PubMed/NCBI
|
|
21
|
Bai X and Jiang Y: Key factors in mTOR
regulation. Cell Mol Life Sci. 67:239–253. 2010. View Article : Google Scholar : PubMed/NCBI
|
|
22
|
Ma XM and Blenis J: Molecular mechanisms
of mTOR-mediated translational control. Nat Rev Mol Cell Biol.
10:307–318. 2009. View
Article : Google Scholar : PubMed/NCBI
|
|
23
|
Inoki K: Role of TSC-mTOR pathway in
diabetic nephropathy. Diabetes Res Clin Pract. 82 Suppl 1:S59–S62.
2008. View Article : Google Scholar : PubMed/NCBI
|
|
24
|
Lin CJ, Chen TL, Tseng YY, Wu GJ, Hsieh
MH, Lin YW and Chen RW: Honokiol induces autophagic cell death in
malignant glioma through reactive oxygen species-mediated
regulation of the p53/PI3K/Akt/mTOR signaling pathway. Toxicol Appl
Pharmacol. 304:59–69. 2016. View Article : Google Scholar : PubMed/NCBI
|
|
25
|
Yalcin S, Marinkovic D, Mungamuri SK,
Zhang X, Tong W, Sellers R and Ghaffari S: ROS-mediated
amplification of AKT/mTOR signalling pathway leads to
myeloproliferative syndrome in Foxo3(−/-) mice. EMBO J.
29:4118–4131. 2010. View Article : Google Scholar : PubMed/NCBI
|
|
26
|
Fantus D, Rogers NM, Grahammer F, Huber TB
and Thomson AW: Roles of mTOR complexes in the kidney: Implications
for renal disease and transplantation. Nat Rev Nephrol. 12:587–609.
2016. View Article : Google Scholar : PubMed/NCBI
|
|
27
|
Lieberthal W and Levine JS: The role of
the mammalian target of rapamycin (mTOR) in renal disease. J Am Soc
Nephrol. 20:2493–2502. 2009. View Article : Google Scholar : PubMed/NCBI
|
|
28
|
Lamouille S and Derynck R: Emergence of
the phosphoinositide 3-kinase-Akt-mammalian target of rapamycin
axis in transforming growth factor-β-induced epithelial-mesenchymal
transition. Cells Tissues Organs. 193:8–22. 2011. View Article : Google Scholar : PubMed/NCBI
|
|
29
|
Lu Q, Ji XJ, Zhou YX, Yao XQ, Liu YQ,
Zhang F and Yin XX: Quercetin inhibits the mTORC1/p70S6K
signaling-mediated renal tubular epithelial-mesenchymal transition
and renal fibrosis in diabetic nephropathy. Pharmacol Res.
99:237–247. 2015. View Article : Google Scholar : PubMed/NCBI
|
|
30
|
Schmittgen TD and Livak KJ: Analyzing
real-time PCR data by the comparative C(T) method. Nat Protoc.
3:1101–1108. 2008. View Article : Google Scholar : PubMed/NCBI
|
|
31
|
Ha H, Yang Y and Lee HB: Mechanisms of
reactive oxygen species generation in LLC-PKI cells cultured under
high glucose. J Am Sec Nephrol. 13:5312002.
|
|
32
|
Brosius FC, Khoury CC, Buller CL and Chen
S: Abnormalities in signaling pathways in diabetic nephropathy.
Expert Rev Endocrinol Metab. 5:51–64. 2010. View Article : Google Scholar : PubMed/NCBI
|
|
33
|
Simonson MS: Phenotypic transitions and
fibrosis in diabetic nephropathy. Kidney Int. 71:846–854. 2007.
View Article : Google Scholar : PubMed/NCBI
|
|
34
|
Liu Y: New insights into
epithelial-mesenchymal transition in kidney fibrosis. J Am Soc
Nephrol. 21:212–222. 2010. View Article : Google Scholar : PubMed/NCBI
|
|
35
|
Lv ZM, Wang Q, Wan Q, Lin JG, Hu MS, Liu
YX and Wang R: The role of the p38 MAPK signaling pathway in high
glucose-induced epithelial-mesenchymal transition of cultured human
renal tubular epithelial cells. PLoS One. 6:e228062011. View Article : Google Scholar : PubMed/NCBI
|
|
36
|
Liu R, Wang Y, Xiao Y, Shi M, Zhang G and
Guo B: SnoN as a key regulator of the high glucose-induced
epithelial-mesenchymal transition in cells of the proximal tubule.
Kidney Blood Press Res. 35:517–528. 2012. View Article : Google Scholar : PubMed/NCBI
|
|
37
|
Brownlee M: Biochemistry and molecular
cell biology of diabetic complications. Nature. 414:813–820. 2001.
View Article : Google Scholar : PubMed/NCBI
|
|
38
|
Coughlan MT, Mibus AL and Forbes JM:
Oxidative stress and advanced glycation in diabetic nephropathy.
Annals of the New York Academy of Sciences. 1126:190–193. 2008.
View Article : Google Scholar : PubMed/NCBI
|
|
39
|
Wang R, Ding G, Liang W, Chen C and Yang
H: Role of LOX-1 and ROS in oxidized low-density lipoprotein
induced epithelial-mesenchymal transition of NRK52E. Lipids Health
Dis. 9:1202010. View Article : Google Scholar : PubMed/NCBI
|
|
40
|
Tang F, Hao Y, Zhang X and Qin J: Effect
of echinacoside on kidney fibrosis by inhibition of TGF-β1/Smads
signaling pathway in the db/db mice model of diabetic nephropathy.
Drug Des Devel Ther. 11:2813–2826. 2017. View Article : Google Scholar : PubMed/NCBI
|
|
41
|
Suwanabol PA, Seedial SM, Zhang F, Shi X,
Si Y, Liu B and Kent KC: TGF-β and Smad3 modulate PI3K/Akt
signaling pathway in vascular smooth muscle cells. Am J Physiol
Heart Circ Physiol. 302:H2211–H2219. 2012. View Article : Google Scholar : PubMed/NCBI
|
|
42
|
Chen JK, Chen J, Neilson EG and Harris RC:
Role of mammalian target of rapamycin signaling in compensatory
renal hypertrophy. J Am Soc Nephrol. 16:1384–1391. 2005. View Article : Google Scholar : PubMed/NCBI
|
|
43
|
Lee CH, Inoki K and Guan KL: mTOR pathway
as a target in tissue hypertrophy. Annu Rev Pharmacol Toxicol.
47:443–467. 2007. View Article : Google Scholar : PubMed/NCBI
|
|
44
|
Yeh YH, Wang SW, Yeh YC, Hsiao HF and Li
TK: Rhapontigenin inhibits TGF-β-mediated epithelial-mesenchymal
transition via the PI3K/AKT/mTOR pathway and is not associated with
HIF-1α degradation. Oncol Rep. 35:2887–2895. 2016. View Article : Google Scholar : PubMed/NCBI
|