Introduction
Paraquat (PQ), a kind of
1,1′-dimethyl-4,4′-bipyridyl cationic salt, is commonly known as
diguat and gramoxone. It is currently the most widely used organic
heterocyclic contact defoliant and herbicide (1). PQ has an extremely high application
value in agriculture, with a utilization rate of more than 70% in
predominantly agrarian countries (2). However, with the high application rate
of PQ, the subsequent impact is one of the most difficult problems
in clinical practice. PQ is extremely toxic to humans and animals,
and its poisoning route is very extensive, including breathing,
skin contact, esophagus and intravenous injection (3). According to statistics, the number of
PQ poisoning patients was over 650,000 worldwide in 2016 (4). It is increasing year by year comparing
with statistics in previous years (5,6). The
number of PQ poisoning patients is expected to exceed 1 million by
2025 (7). Besides, the mortality of
PQ poisoning is extremely high. According to statistics, its
clinical mortality is up to 60–80% (8). PQ poisoning easily causes multiple
organ failure, which is one of the causes of its high mortality
(9). Clinically, the increasingly
serious problem of PQ poisoning has been the focus of research and
continuous study of the pathogenesis and prevention and treatment
of PQ is ongoing, but no significant breakthrough has been made
yet. With the deepening of researches, studies in recent years have
shown that oxidative stress-induced systemic inflammatory response
syndrome (SIRS) may be the main pathogenic mechanism of PQ
poisoning. Reactive oxygen species (ROS) produced by PQ in the body
cause damage to organs through macrophages (10,11).
Macrophages, a part of innate immune system in the body, play an
important role in inflammatory repair and invasion resistance
(12). Once they are abnormal, the
immune system in the patient's body collapses, resulting in various
damage. Therefore, in this study, different degrees of PQ poisoning
mouse models were established, and the expression of inflammatory
factors interleukin-6 (IL-6) and tumor necrosis factor-α (TNF-α) in
macrophages were analyzed, to explore the effects of PQ on
macrophages, thereby providing effective references and guidance
for the clinical prevention and treatment of PQ poisoning.
Materials and methods
Animal data
Mouse macrophage RAW264.7 was purchased from
Shenzhen Haodi Huatuo Biotechnology Co., Ltd. (HTX1568; Shenzhen,
China), and cultured in cell culture medium and incubator
containing 10% fetal bovine serum (FBS; A3160801; Shanghai Mituo
Biotechnology Co., Ltd., Shanghai, China). PQ was purchased from
Shanghai Future Industrial Co., Ltd. (B3379; Shanghai, China) at
concentrations of 0.01, 0.1, 1 and 10 mmol/l, respectively. All
operations were done on a super clean station. The study was
approved by the Ethics Committee of Hunan Provincial People's
Hospital (Changsha, China). Signed informed consents were obtained
from the patients or the guardians.
Methods
Detection of cell viability
Mouse macrophage RAW264.7 was placed in a 75 cm2
culture flask. When the contact rate of cell growth reached 80%,
cells were separately placed in 15 (25 cm2) culture flasks and
cultured again until the contact rate reached 80%. Then, the
supernatant was aspirated and cell culture medium containing 0.5%
FBS was added, and incubated in a cell incubator for 24 h. The next
day, culture flasks were taken out. Different concentrations of PQ
were separately added to 4 culture flasks as: The micro
concentration (0.01 mmol/l), the low (0.1 mmol/l), the medium (1
mmol/l) and the high concentration groups (10 mmol/l). The
remaining 3 culture flasks were continuously added with the culture
medium without 0.5% FBS as the control group. Then, all the culture
flasks were placed in a cell incubator. One culture flask was taken
out from each group at 1, 4 and 8 h of incubation. The supernatant
was aspirated, centrifuged at 3,000 × g for 5 min at 20°C and
frozen for testing. The trypan blue solution was used for detecting
the cell viability.
Detection of ROS
The cell suspension was added to a 96-well
black-bottomed cell culture plate. When the contact rate of cell
growth reached 80%, the supernatant was aspirated. Then, cell
culture medium containing 0.5% FBS was added, incubated in a cell
incubator for 24 h. The next day, the culture plate was taken out.
Different concentrations of PQ were separately added to 4 cell
culture wells as the micro concentration (0.01 mmol/l), the low
(0.1 mmol/l), the medium (1 mmol/l) and the high concentration
groups (10 mmol/l). The culture medium without 0.5% FBS was added
as the control group. After that, the culture plate was placed in a
cell incubator, which was taken out and washed 3 times with
deionized water at 1, 4 and 8 h of incubation, respectively.
2′,7′-dichlorofluorescein diacetate (DCFH-DA, Sigma-Aldrich; Merck
KGaA, Darmstadt, Germany QN1289-JUI) was added and the plate was
returned to the cell incubator. After 30 min of incubation, the
microplate reader (485 nm excitation wavelength, 525 nm emission
wavelength; Bio-rad, Hercules, CA, USA) was used for detecting the
ROS fluorescence intensity.
Detection of IL-6 and TNF-α
ELISA was used for detecting the expression levels
of IL-6 and TNF-α in the five groups. IL-6 kit was purchased from
American Boao Pike Biological Co., Ltd. (45-IL6HU-E05), TNF-α kit
from Diken Trading Co., Ltd. (BE45471; Shanghai, China). All
operations were done in strict accordance with the kit
instructions.
Outcome measures
The cell viability, the ROS fluorescence intensity
and IL-6 and TNF-α expressions in the micro concentration, the low,
the medium, the high concentration and the control groups at 1, 4
and 8 h, respectively, were evaluated.
Statistical analysis
SPSS 24.0 statistical software (IBM Corp., Armonk,
NY, USA) was used for analyzing and processing the data.
Measurement results were expressed as mean ± standard deviation,
and t-test was used for comparison between the two groups. Count
results were expressed as ratio, and Chi-square test was used for
comparison between the two. The analysis of variance (ANOVA) of
repeated measurements and Fisher's test was used for the comparison
among multiple groups. P<0.05 was considered to indicate a
statistically significant difference.
Results
Cell viability
There was no significant difference in the cell
viability at the 1st hour among the five groups (P>0.050), but
there was a significant difference at 4 and 8 h (P<0.050). At 1
h, there was no significant difference in the cell viability among
the micro concentration, the low concentration and the control
groups (P>0.050), and between the medium and the high
concentration groups (P>0.050). The medium and the high
concentration groups had significantly lower cell viability than
the other three groups (P<0.050). At 4 and 8 h, there was no
significant difference in the cell viability among the micro
concentration, the low concentration and the control groups
(P>0.050). The medium and the high concentration groups had
significantly lower cell viability than the other three groups
(P<0.050). The high concentration group had significantly lower
cell viability than the medium concentration group (P<0.050).
There was no significant difference in the cell viability among 1,
4 and 8 h in the micro concentration, the low concentration and the
control groups (P>0.050). In the medium and the high
concentration group, the cell viability was the highest at 1 h and
the lowest at 8 h, which was lower at 4 h than that at 1 h
(P<0.050; Table I).
 | Table I.Comparison of cell viability (%). |
Table I.
Comparison of cell viability (%).
|
| Groups |
|
|
|---|
|
|
|
|
|
|---|
| Time (h) | Micro
concentration | Low
concentration | Medium
concentration | High
concentration | Control | F | P-value |
|---|
| 1 | 90.43 | 89.14 | 81.04b,c | 79.54a–d | 89.43d,e |
0.247 |
0.167 |
| 4 | 92.64 | 91.33 | 74.16a–c | 53.72a–d | 88.69d,e |
2.721 |
0.032 |
| 8 | 90.27 | 91.28 | 67.25a–c | 19.64a–d | 90.74d,e | 16.652 | <0.001 |
ROS
There was no significant difference in the ROS
fluorescence intensity at 1 h among the five groups (P>0.050),
but there was a significant difference at 4 and 8 h (P<0.001).
At 1, 4 and 8 h, respectively, there was no significant difference
in the ROS fluorescence intensity among the micro concentration,
the low concentration and the control groups (P>0.050). The
medium and the high concentration groups had significantly higher
ROS fluorescence intensity than other three groups (P<0.050).
The high concentration group had significantly higher ROS
fluorescence intensity than the medium concentration group
(P<0.050). There was no significant difference in the ROS
fluorescence intensity among 1, 4 and 8 h in the micro
concentration, the low concentration and the control groups
(P>0.050). In the medium and the high concentration groups, the
ROS fluorescence intensity was the lowest at 1 h and the highest at
8 h, which was higher at 4 h than that at 1 h (P<0.050; Table II).
| Table II.Comparison of ROS fluorescence
intensity. |
Table II.
Comparison of ROS fluorescence
intensity.
|
| Groups |
|
|
|---|
|
|
|
|
|
|---|
| Time (h) | Micro
concentration | Low
concentration | Medium
concentration | High
concentration | Control | F | P-value |
|---|
| 1 | 324.61±117.14 | 315.84±137.62 |
406.51±176.56a–c |
429.64±232.55a–d |
314.56±142.62d,e |
0.333 |
0.117 |
| 4 | 316.27±126.08 | 318.65±127.61 |
436.16±189.65a–c |
467.56±265.99a–d |
309.48±134.34d,e |
5.515 | <0.001 |
| 8 | 314.66±128.64 | 317.16±131.57 |
476.41±207.91a–c |
549.56±307.74a–d |
291.64±135.48d,e | 10.572 | <0.001 |
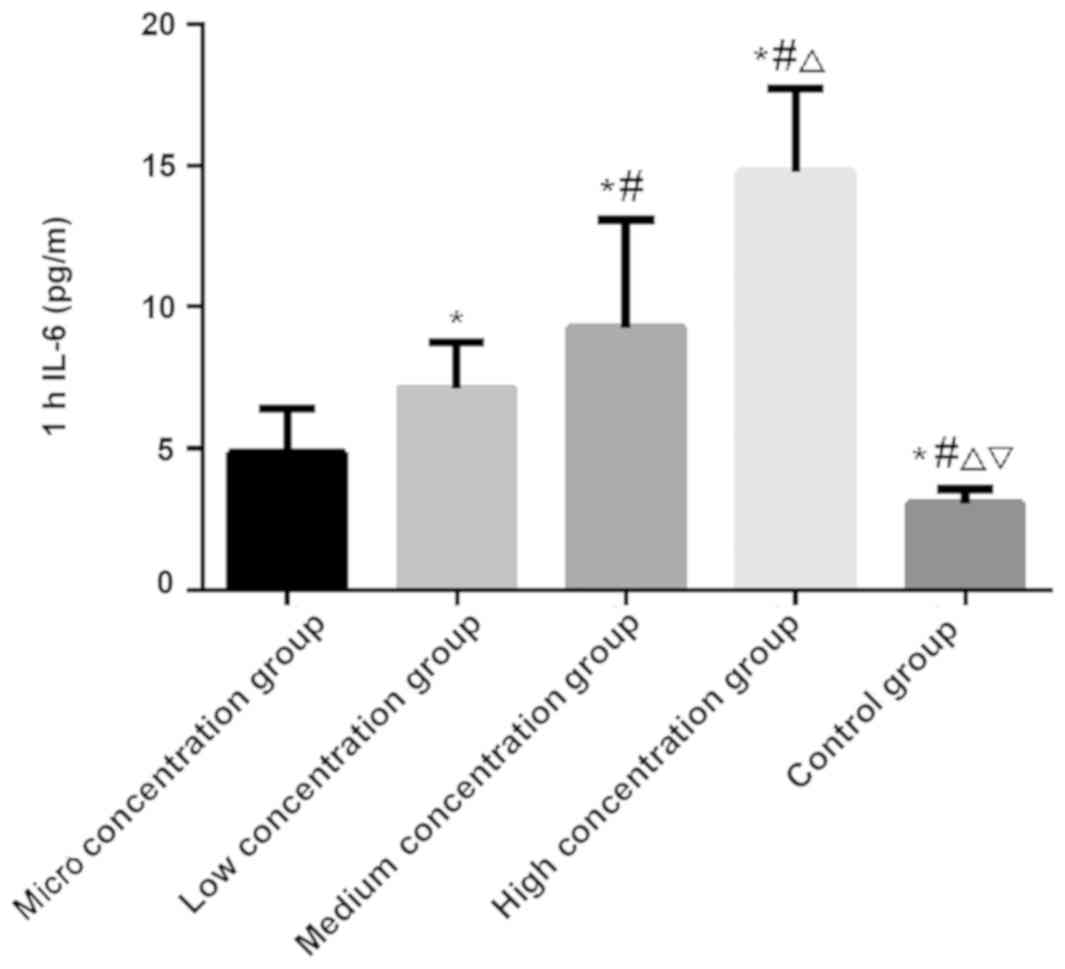
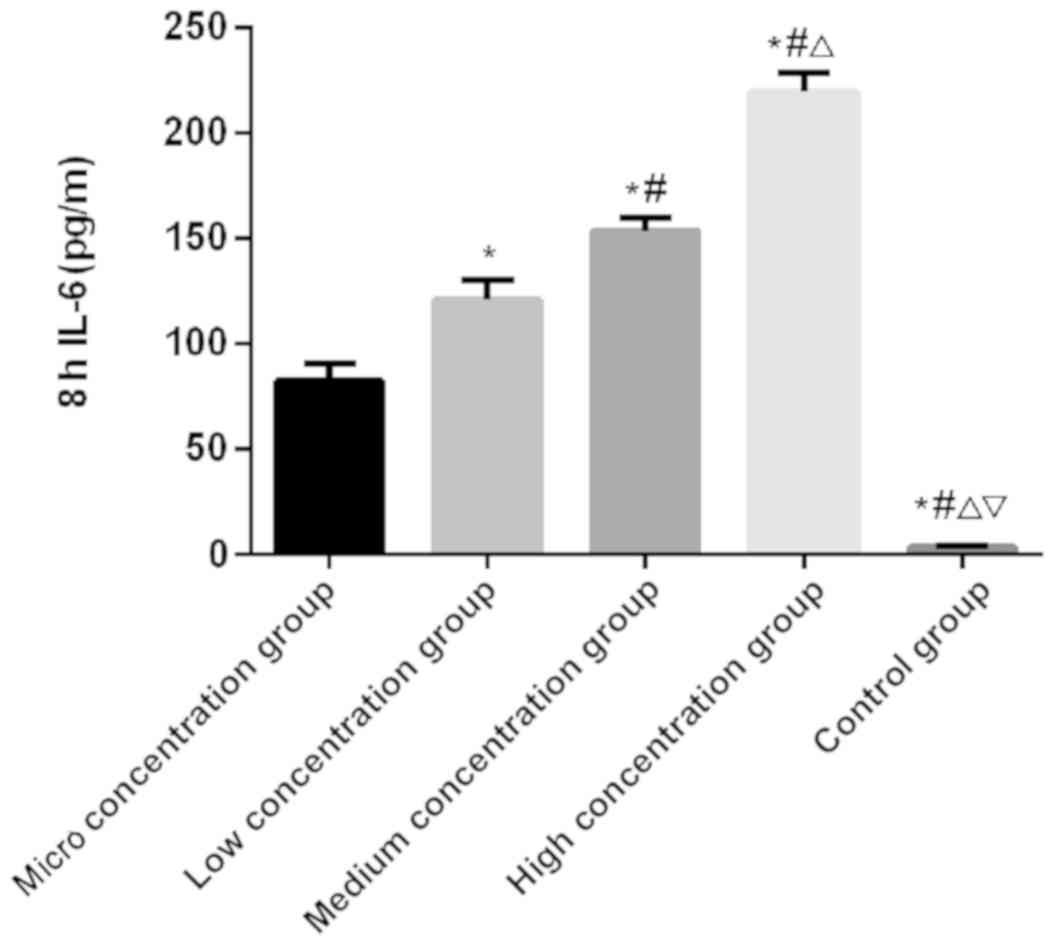
IL-6 and TNF-α
There was a significantly difference in the
expression level of IL-6 at 1, 4 and 8 h among the five groups
(P<0.050). There was no significant difference in the control
group among the 1, 4 and 8 h (P>0.050). In the micro, low,
medium and the high concentration groups, the expression level of
IL-6 was the lowest at 1 h and the highest at 8 h, which was higher
at 4 h than that at 1 h (P<0.050). At 1, 4 and 8 h,
respectively, the expression level of IL-6 was the lowest in the
control group, followed by the micro, low and medium concentration
groups, and the highest in the high concentration group
(P<0.050; Table III and
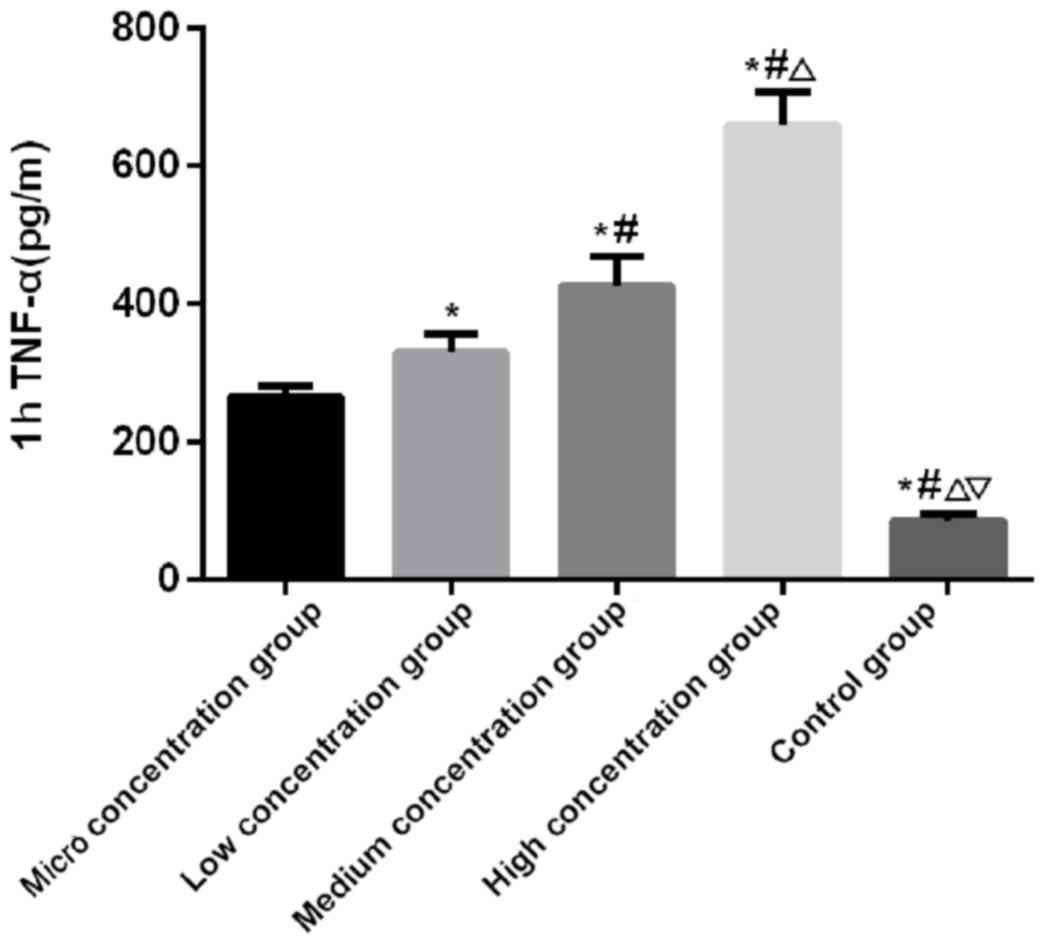
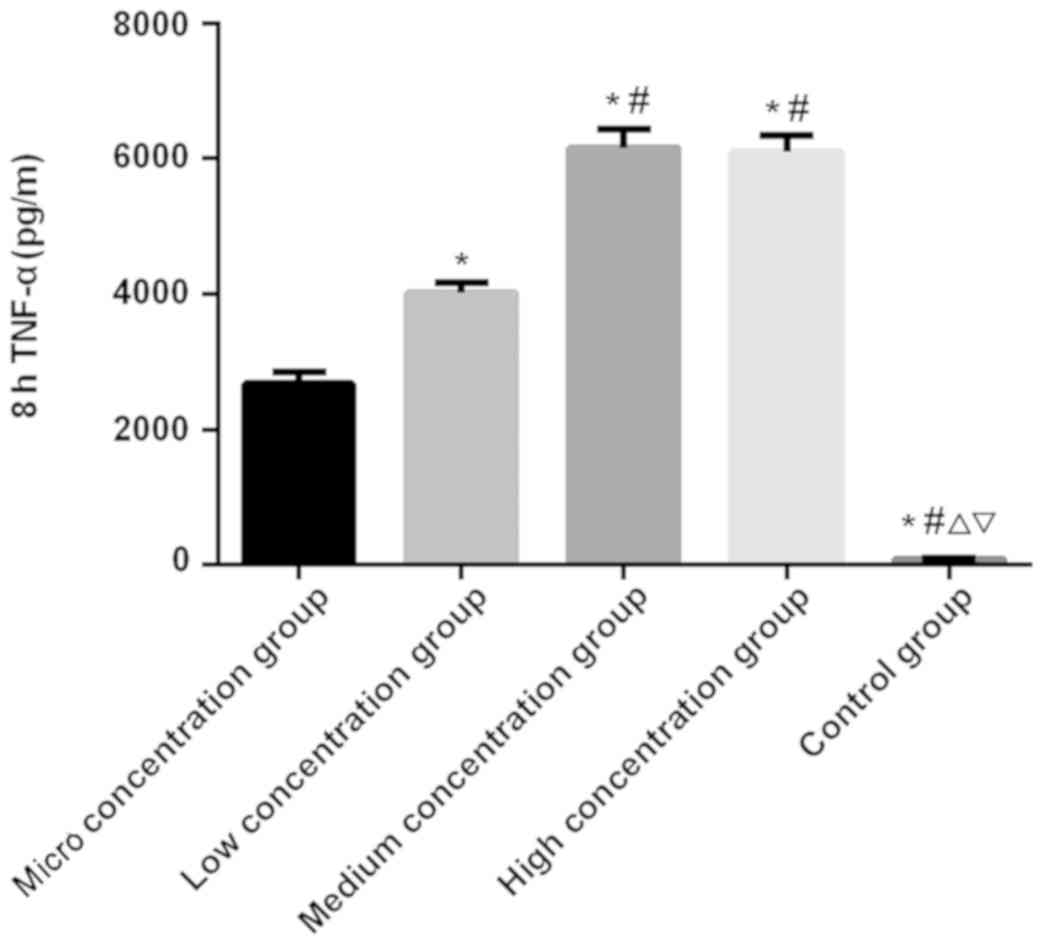
Figs. 1–3). There was a significant difference in
the expression level of TNF-α at 1, 4 and 8 h among the five groups
(P<0.050). There was no significant difference in the control
group among 1, 4 and 8 h (P>0.050). In the micro, low, medium
and the high concentration groups, the expression level of TNF-α
was the lowest at 1 h and the highest at 8 h, which was higher at
the 4 h than that at 1 h (P<0.050). At 1 and 4 h, the expression
level of TNF-α was the lowest in the control group, followed by the
micro, low and the medium concentration groups, and the highest in
the high concentration group (P<0.050). At 8 h, there was no
significant difference in the expression level of TNF-α between the
medium and the high concentration groups (P>0.050), which was
significantly higher than that in the other three groups
(P<0.050). In the other three groups, the expression level of
TNF-α was the lowest in the control group, which was higher in the
micro concentration group than that in the control group, and
higher in the low concentration group than that in the micro
concentration group (P<0.050; Table
IV and Figs. 4–6).
| Table III.Comparison of IL-6. |
Table III.
Comparison of IL-6.
|
| Groups |
|
|
|---|
|
|
|
|
|
|---|
| Time (h) | Micro
concentration | Low
concentration | Medium
concentration | High
concentration | Control | F | P-value |
|---|
| 1 |
4.85±1.54 |
7.12±1.63 |
9.26±3.84 | 14.77±2.96 |
3.04±0.52 |
4.443 |
0.004 |
| 4 |
19.36±3.49a |
26.71±6.27a |
46.34±6.02a |
58.27±8.07a |
3.36±0.60 |
49.143 | <0.001 |
| 8 |
82.63±8.24a,b |
120.76±9.81a,b |
153.69±6.32a,b |
219.55±8.96a,b | 3.49±070 | 341.527 | <0.001 |
| Table IV.Comparison of TNF-α. |
Table IV.
Comparison of TNF-α.
| Groups |
|
|
|---|
|
|
|
|---|
| Time (h) | Micro
concentration | Low
concentration | Medium
concentration | High
concentration | Control | F | P-value |
|---|
| 1 | 264.19±17.24 | 329.62±27.96 | 426.52±42.17 | 659.18±48.37 |
86.37±10.24 | 126.437 | <0.001 |
| 4 |
756.33±24.26a |
868.04±30.58a |
2,019.86±106.40a |
3,632.81±227.06a | 92.33±9.68 | 450.713 | <0.001 |
| 8 |
2,677.68±164.07a,b |
4,022.86±149.81a,b |
6,158.27±269.34a,b |
6,094.56±254.76a,b |
90.72±10.53 | 519.526 | <0.001 |
Discussion
As the most common organic heterocyclic herbicide in
agriculture, PQ is low in price, with high herbicidal efficiency.
It can be quickly degraded in the soil and has no pollution to the
environment, so it is widely used (13). Since the first PQ poisoning death in
the 1960s, PQ poisoning has begun to increase (14). It has many infection routes, with
strong toxicity and rapid poisoning time (15). This is also an important reason for
clinical attention. At present, there is no effective method for
treating acute PQ poisoning, so research on its pathogenesis are
especially important. It is a major research focus and difficulty
in the development of effective treatments through knowing the
mechanism of PQ poisoning. With the deepening of research, more and
more studies have proved that PQ poisoning is mainly related to
various tissue cell injuries in the body caused by inflammatory
cells (16–18).
The anti- and pro-inflammatory effects of the body
maintain a dynamic equilibrium under normal circumstances. The
invasion of PQ causes significant overexpression of
pro-inflammatory mediators, which shows multiple organ dysfunction
and failure, resulting in death in patients (19). During the inflammatory response, IL-6
and TNF-α are two representative inflammatory factors. As a B cell
growth factor, IL-6 is secreted by activated immune cells such as
lymphocytes and macrophages. It accelerates inflammatory injury by
promoting the inflammatory activation and differentiation of cells,
and promotes neutrophil respiratory outbreaks and degranulation to
produce oxygen free radicals, thereby aggravating tissue and organ
injuries (20). TNF-α, an
inflammatory factor secreted by endothelial cells and mononuclear
macrophages, activates nuclear factor-κB (NF-κB) to mediate the
expression of a series of inflammatory factors, thereby promoting
neutrophil degranulation and the release of lysosomes, and
aggravating the damage to patients (21). There are currently few studies on
IL-6 and TNF-α in PQ. Therefore, in the experiment, different
concentrations of PQ poisoning mouse macrophage RAW264.7 models
were established, and the expression of IL-6 and TNF-α was
detected, to explore the mechanism of action of PQ on inflammatory
cells.
The results of this experiment showed that there was
no significant difference in the cell viability among the micro
concentration, the low concentration and the control groups, but
the medium concentration and the high concentration groups had
significantly lower cell viability than the other three groups. It
suggests that PQ at a concentration of 1 mmol/l has an impact on
the environment in the body. It is speculated that PQ can be
reduced by enzymes after entering macrophages, thereby forming
PQ-electrons (22). At this time,
PQ-electrons bind to oxygen ions in macrophages to provide electron
donors for NADPH, thereby accelerating the conversion of oxygen
into active oxygen radicals in the body. As a result, the normal
oxidative phosphorylation process and energy synthesis in the body
are reduced, causing cell failure and metabolic dysfunction. There
were no significant differences in the ROS fluorescence intensity,
IL-6 and TNF-α among the micro concentration, the low concentration
and the control groups, but the medium concentration and the high
concentration groups had significantly higher ROS fluorescence
intensity, IL-6 and TNF-α than the other three groups. It proves
that PQ poisoning has an effect on the body at a concentration of 1
mmol/l. It is speculated that PQ induces macrophages to produce ROS
after entering macrophages, thereby promoting activated macrophages
to synthesize and release a large amount of pro-inflammatory
mediators, proteases and chemokines. At this time, the expression
of ROS in cells is greatly increased. ROS can induce the release,
infiltration and activation of IL-6 and TNF-α through NF-κB, and
accelerate the damage of the environment in the body, finally
leading to organ dysfunction and failure. The findings of He et
al (23) in the study on the
effects of PQ on alveolar epithelial cells are basically consistent
with the results of this experiment, which can support the views of
this experiment.
Macrophage RAW264.7 in mice is different from that
in the human body, and the sample size of this experiment is small.
Therefore, the statistical analysis of big data cannot be
performed. Human experiments will be conducted as soon as possible,
and the sample size will be enlarged to improve the experimental
results.
In summary, PQ at a concentration of 1 mmol/l can
produce toxicity to macrophages, and greatly increase the ROS
fluorescence intensity and the expression levels of IL-6 and TNF-α.
PQ poisoning is expected to be treated through IL-6 and TNF-α in
the future.
Acknowledgements
Not applicable.
Funding
No funding was received.
Availability of data and materials
The datasets used and/or analyzed during the present
study are available from the corresponding author on reasonable
request.
Authors' contributions
JH and NN were responsible for detection of cell
viability and ROS. JH and WZ performed ELISA. All authors read and
approved the final manuscript.
Ethics approval and consent to
participate
The study was approved by the Ethics Committee of
Hunan Provincial People's Hospital (Changsha, China). Signed
informed consents were obtained from the patients or the
guardians.
Patient consent for publication
Not applicable.
Competing interests
The authors declare that they have no competing
interests.
References
|
1
|
Chen T, Wang R, Jiang W, Wang H, Xu A, Lu
G, Ren Y, Xu Y, Song Y, Yong S, et al: Protective effect of
astragaloside IV against paraquat-induced lung injury in mice by
suppressing Rho signaling. Inflammation. 39:483–492. 2016.
View Article : Google Scholar : PubMed/NCBI
|
|
2
|
de Oliveira MR, Ferreira GC and Schuck PF:
Protective effect of carnosic acid against paraquat-induced redox
impairment and mitochondrial dysfunction in SH-SY5Y cells: Role for
PI3K/Akt/Nrf2 pathway. Toxicol In Vitro. 32:41–54. 2016. View Article : Google Scholar : PubMed/NCBI
|
|
3
|
Kumar A, Leinisch F, Kadiiska MB, Corbett
J and Mason RP: Formation and implications of alpha-synuclein
radical in Maneb- and paraquat-induced models of Parkinson's
disease. Mol Neurobiol. 53:2983–2994. 2016. View Article : Google Scholar : PubMed/NCBI
|
|
4
|
Nunes ME, Müller TE, Braga MM, Fontana BD,
Quadros VA, Marins A, Rodrigues C, Menezes C, Rosemberg DB and Loro
VL: Chronic treatment with paraquat induces brain injury, changes
in antioxidant defenses system, and modulates behavioral functions
in zebrafish. Mol Neurobiol. 54:3925–3934. 2017. View Article : Google Scholar : PubMed/NCBI
|
|
5
|
de Oliveira MR, Schuck PF and Bosco SMD:
Tanshinone I induces mitochondrial protection through an
Nrf2-dependent mechanism in paraquat-treated human neuroblastoma
SH-SY5Y cells. Mol Neurobiol. 54:4597–4608. 2017. View Article : Google Scholar : PubMed/NCBI
|
|
6
|
Pang YW, Sun YQ, Sun WJ, Du WH, Hao HS,
Zhao SJ and Zhu HB: Melatonin inhibits paraquat-induced cell death
in bovine preimplantation embryos. J Pineal Res. 60:155–166. 2016.
View Article : Google Scholar : PubMed/NCBI
|
|
7
|
Ding YW, Zhao GJ, Li XL, Hong GL, Li MF,
Qiu QM, Wu B and Lu ZQ: SIRT1 exerts protective effects against
paraquat-induced injury in mouse type II alveolar epithelial cells
by deacetylating NRF2 in vitro. Int J Mol Med. 37:1049–1058.
2016. View Article : Google Scholar : PubMed/NCBI
|
|
8
|
Li S, Zhao G, Chen L, Ding Y, Lian J, Hong
G and Lu Z: Resveratrol protects mice from paraquat-induced lung
injury: The important role of SIRT1 and NRF2 antioxidant pathways.
Mol Med Rep. 13:1833–1838. 2016. View Article : Google Scholar : PubMed/NCBI
|
|
9
|
Xie L, Zhou D, Xiong J, You J, Zeng Y and
Peng L: Paraquat induces pulmonary epithelial-mesenchymal
transition through transforming growth factor-β1-dependent
mechanism. Exp Toxicol Pathol. 68:69–76. 2016. View Article : Google Scholar : PubMed/NCBI
|
|
10
|
Jaroonwitchawan T, Chaicharoenaudomrung N,
Namkaew J and Noisa P: Curcumin attenuates paraquat-induced cell
death in human neuroblastoma cells through modulating oxidative
stress and autophagy. Neurosci Lett. 636:40–47. 2017. View Article : Google Scholar : PubMed/NCBI
|
|
11
|
Pourgholamhossein F, Sharififar F, Rasooli
R, Pourgholi L, Nakhaeipour F, Samareh-Fekri H, Iranpour M and
Mandegary A: Thymoquinone effectively alleviates lung fibrosis
induced by paraquat herbicide through down-regulation of
pro-fibrotic genes and inhibition of oxidative stress. Environ
Toxicol Pharmacol. 45:340–345. 2016. View Article : Google Scholar : PubMed/NCBI
|
|
12
|
Wynn TA and Vannella KM: Macrophages in
tissue repair, regeneration, and fibrosis. Immunity. 44:450–462.
2016. View Article : Google Scholar : PubMed/NCBI
|
|
13
|
Smeyne RJ, Breckenridge CB, Beck M, Jiao
Y, Butt MT, Wolf JC, Zadory D, Minnema DJ, Sturgess NC, Travis KZ,
et al: Assessment of the effects of MPTP and paraquat on
dopaminergic neurons and microglia in the substantia nigra pars
compacta of C57BL/6 mice. PLoS One. 11:e01640942016. View Article : Google Scholar : PubMed/NCBI
|
|
14
|
Amirshahrokhi K and Khalili AR: Carvedilol
attenuates paraquat-induced lung injury by inhibition of
proinflammatory cytokines, chemokine MCP-1, NF-κB activation and
oxidative stress mediators. Cytokine. 88:144–153. 2016. View Article : Google Scholar : PubMed/NCBI
|
|
15
|
Khalighi Z, Rahmani A, Cheraghi J, Ahmadi
MR, Soleimannejad K, Asadollahi R and Asadollahi K: Perfluorocarbon
attenuates inflammatory cytokines, oxidative stress and
histopathologic changes in paraquat-induced acute lung injury in
rats. Environ Toxicol Pharmacol. 42:9–15. 2016. View Article : Google Scholar : PubMed/NCBI
|
|
16
|
Wang Q, Liu S, Hu D, Wang Z, Wang L, Wu T,
Wu Z, Mohan C and Peng A: Identification of apoptosis and
macrophage migration events in paraquat-induced oxidative stress
using a zebrafish model. Life Sci. 157:116–124. 2016. View Article : Google Scholar : PubMed/NCBI
|
|
17
|
Huang CL, Chao CC, Lee YC, Lu MK, Cheng
JJ, Yang YC, Wang VC, Chang WC and Huang NK: Paraquat induces cell
death through impairing mitochondrial membrane permeability. Mol
Neurobiol. 53:2169–2188. 2016. View Article : Google Scholar : PubMed/NCBI
|
|
18
|
Ortiz MS, Forti KM, Suárez Martinez EB,
Muñoz LG, Husain K and Muñiz WH: Effects of antioxidant
N-acetylcysteine against paraquat-induced oxidative stress in vital
tissues of mice. Int J Sci Basic Appl Res. 26:26–46.
2016.PubMed/NCBI
|
|
19
|
Hu L, Yu Y, Huang H, Fan H, Hu L, Yin C,
Li K, Fulton DJ and Chen F: Epigenetic regulation of interleukin 6
by histone acetylation in macrophages and its role in
paraquat-induced pulmonary fibrosis. Front Immunol. 7:6962017.
View Article : Google Scholar : PubMed/NCBI
|
|
20
|
Baumeister D, Akhtar R, Ciufolini S,
Pariante CM and Mondelli V: Childhood trauma and adulthood
inflammation: A meta-analysis of peripheral C-reactive protein,
interleukin-6 and tumour necrosis factor-α. Mol Psychiatry.
21:642–649. 2016. View Article : Google Scholar : PubMed/NCBI
|
|
21
|
Cleynen I, Van Moerkercke W, Billiet T,
Vandecandelaere P, Vande Casteele N, Breynaert C, Ballet V,
Ferrante M, Noman M, Assche GV, et al: Characteristics of skin
lesions associated with anti-tumor necrosis factor therapy in
patients with inflammatory bowel disease: A Cohort Study. Ann
Intern Med. 164:10–22. 2016. View
Article : Google Scholar : PubMed/NCBI
|
|
22
|
Hong GL, Liu JM, Zhao GJ, Tan JP, Wu B, Li
MF, Liang G, Qiu QM and Lu ZQ: Cycloartenyl ferulate inhibits
paraquat-induced apoptosis in HK-2 cells with the involvement of
ABCC1. J Cell Biochem. 117:872–880. 2016. View Article : Google Scholar : PubMed/NCBI
|
|
23
|
He Y, Zou L, Zhou Y, Hu H, Yao R, Jiang Y,
Lau WB, Yuan T, Huang W, Zeng Z, et al: Adiponectin ameliorates the
apoptotic effects of paraquat on alveolar type II cells via
improvements in mitochondrial function. Mol Med Rep. 14:746–752.
2016. View Article : Google Scholar : PubMed/NCBI
|