Introduction
Pneumoconiosis follows the long-term inhalation of
productive dust, which is the primary contributor to pulmonary
fibrosis of systemic disease. It is also a progressive fibrotic
lung disease, which is caused by occupational exposure to mineral
dust and fibers (1). It is one of
the most serious occupational disease hazards in China (2). Currently, occupational hazards exist in
>8,000 enterprises in Xinjiang, China; >1,300,00 individuals
may be contact with occupational hazards and there are >16,000
patients with various occupational diseases. All types of
occupational disease hazard factors are increasing with the process
of western development and, although there are certain protective
measures, there are increasing numbers of patients with silicosis.
According to incomplete current statistics, silicosis not only
causes serious damage, due to silicon dust exposure, to the health
of workers, but also severely reduces the labor force and quality
of life, and causes economic loss to the country (3). According to statistics, the economic
loss caused by occupational diseases each year is over 140 million
RMB. Further investigations on diagnosis are required owing to new
challenges in silicosis (4).
Surface-enhanced laser desorption ionization flight
mass spectrometry (SELDI-TOF-MS) technology was used in the present
study to detect the difference in serum protein between patients
with silicosis fibrosis and normal healthy individuals, which is a
novel effective method for the clinical diagnosis of silicosis by
identifying markers for silicosis.
Materials and methods
Serum sample information
A total of 60 male patients with silicosis were
selected and, according to inclusion criteria and exclusion
criteria, 20 patients with clinical cases of silicosis diagnosed
within one period were screened and determined as the foundation
treatment group, designated as group A. Therefore, of the 60
individuals in total recruited for the study in The Fifth
Affiliated Hospital of Xinjiang Medical University (Urumqi, China),
20 patients with silicosis were included. In addition, 20
age-matched healthy patients attending check-ups at the physical
examination department in the Fifth Affiliated Clinical Medical
College of Xinjiang Medical University were selected as a normal
healthy group, designated as group C. The mean age of the three
groups were 75.7±4.32 years (group A), 76.1±5.62 years (group B)
and 74.8±4.31 years (group C). All samples were collected between
June 2014 and July 2015. Groups A and B were patients with
silicosis, but the treatment options were different. The treatment
of patients in Group A (basic treatment) was as follows: Oxygen
therapy, coughing, and expectorant, anti-asthmatic and
anti-inflammatory therapy. The treatment of patients in Group B was
as follows: basic treatment + 2 ml Deworming Vernonia Injection
(repellent spotted chrysanthemum injection; Anhui Golden Sun
Biochemical Pharmaceutical Co., Ltd., Fuyang, China) in 10 ml of
0.9% physiological saline for nebulization. Venous blood (5 ml) was
centrifuged at 900 × g for 10 min at 4°C; the serum was removed and
stored in a freezer at −80°C. Fasting morning venous blood samples
were obtained from the normal group (group C), the pre-foundation
treatment group (A-Q) and the post-foundation treatment group
(A-H). There were a total of 60 samples from the three groups, as
each group had 20 biological repeats. SELDI-TOF-MS detection
analysis was performed on the samples. The foundation treatment for
silicosis comprised chemotherapy using poly 2-vinyl pyridine
nitroxide (5). Patients with
silicosis can be rapidly detected by detecting the plasma levels of
tumor necrosis factor-α and matrix metalloproteinase 9 (6). The changes in the expression levels of
numerous proteins following foundation treatment occur in the same
patient and correlate with disease status. The inclusion criteria
were as follows: History of dust exposure; early symptoms or signs;
X-ray examination as the main basis for the diagnosis of silicosis;
laboratory tests for the examination of early diagnostic
indicators; pulmonary function tests showing pulmonary ventilation
disorders. The exclusion criteria comprised patients who did not
meet the inclusion criteria, did not attend follow-up or did not
sign the informed consent forms.
Equipment and instrument
The Ciphergen® SELDI-TOF-MS mass
spectrometer (protein fingerprint device) was used in the present
study (Ciphergen Biosystems, Inc., Fremont, CA, USA). In order to
identify the biomarkers, the Protein Chip SELDI system was used,
which can rapidly produce a protein molecular weight map from a
large number of complex biological samples. Using surface enhanced
laser desorption ion technology, it is able to capture, detect and
measure the molecular weight of peptides and proteins in complex
biological samples (4).
SELDI protein chip
The covalent coupling of selected proteins or other
target molecules can be implemented on the surface of a chip. A
particular subgroup of complex protein samples can be captured by
the chip through simple chemistry or protein interaction.
Following incubation, protein that was not combined
with other ingredients from the chip surface was cleared. Only
those specifically binding proteins were retained for further
analysis. Following the elution step, the organic solution of
energy absorption molecules was added. The chip in the SELDI
reading machine was analyzed, which involved a type of time of
flight mass spectrometry. Once in a gaseous state, charged protein
molecules under the effect of a separation voltage show rapid
movement, termed ‘flight’. The separation voltage for all the
molecules in the sample has the same effect, with differences in
time of flight according to the different molecular weight. The
SELDI reading machine recorded the time of flight, and converted
this to a molecular weight.
Contrast strategy and analysis of the
content
A total of three comparative analyses with the
following comparisons, respectively, were performed, and data was
obtained for further bioinformatics analysis: C, vs. A-Q; C, vs.
A-H; and A-Q, vs. A-H. The data analysis process included data
preprocessing, differences in peak screening, hierarchical cluster
analysis, Principal Component Analysis (PCA), construction of a
decision tree model, and protein prediction based on differences
between the peak corresponding to proteins.
Statistical analysis
SPSS 17.0 software (SPSS, Inc., Chicago, IL, USA)
was used for the quantitative data, with two sets of equal
variances, using a Student's t-test. Two sets of heterogeneity of
variance, with rank and inspection, disordered classification data
were analyzed using the χ2 test. The Wilcoxon sum rank
test was used with a capacity of <10. The specific steps of the
test were as follows: Firstly, data of two samples were mixed and
ranked from the smallest to the largest (the smallest data order is
1 and the largest data order is n1 + n2). Secondly, the ranks of
data in the smaller capacity sample are add, that is, the rank sum,
denoted by Ť. Thirdly, the T value was compared with the critical
value at a certain level of significance in the rank sum test
table. If T1<T<T2, the difference between the two samples is
insignificant; T<T1 or T≥T2 indicates that the two samples are
significantly different. The Wilcoxon rank sum test was used in the
present study to obtain P-values. The difference in protein peaks
was determined by calculating the P-value to determine the
significance of differences of each protein peak. The permutation
tests were performed with statistical tools in SIMCA 14.0 software
(Umetrics AB, Umea, Sweden). P<0.05 was considered to indicate a
statistically significant difference.
Results
Data preprocessing
Raw data analyses were performed using Ciphergen
Protein Chip software correction processing to obtain the peak
data. A mass-to-charge ratio <1,000 of the peak was considered
the substrate peak, and the subsequent data was filtered based on
the peak.
Difference in peak filtering
The peak between two groups was compared using the
Wilcoxon sum rank test, using the peak P-value to judge whether
there were significant differences between the two groups. By
selecting different peaks, differences between peaks were compared
and the screening results for C, vs. A-Q (Table I), C, vs. A-H (Table II), and A-Q, vs. S A-H (Table III) were obtained. As shown in
Table I, the normal group and
pre-foundation treatment group had statistically significant
differences between peaks. As shown in Table II, the normal group and
post-foundation treatment group had statistically significant
differences between peaks. As shown in Table III, between the pre- and
post-foundation treatment group, there were statistically
significant differences in peaks.
 | Table I.C, vs. A-Q group differences in peak
filtering. |
Table I.
C, vs. A-Q group differences in peak
filtering.
| SAMP_GRP | P-value | q-value | VIP | C average | A-Q average |
|---|
| M1004_63 |
2.9018×10⁻¹¹ |
4.38×10⁻⁹ | 2.8325 | 9.337262319 | 20.59812918 |
| M1009_81 |
2.884×10⁻⁶ |
1.4043×10⁻⁵ | 1.18109 | 31.51986384 | 40.84034414 |
| M1019_45 |
4.3527×10⁻¹⁰ |
1.5438×10⁻⁸ | 2.63561 | 4.718782081 | 12.56350599 |
| M1031_99 |
6.529×10⁻¹⁰ |
1.6425×10⁻⁸ | 3.48656 | 7.811703062 | 21.54302217 |
| M1083_37 |
4.9091×10⁻⁶ |
2.0583×10⁻⁵ | 1.12792 | 0.294565816 | 2.199163708 |
| M1098_33 |
1.3412×10⁻⁷ |
1.1292×10⁻⁶ | 1.67063 | 0.38657576 | 3.615140978 |
| M1101_43 |
9.9241×10⁻⁹ |
1.07×10⁻⁷ | 2.14677 | 0.927844358 | 5.631289799 |
| M1103_90 |
2.0167×10⁻⁹ |
3.3824×10⁻⁸ | 1.64852 | 0.479273296 | 3.302777091 |
| M1114_98 |
4.0713×10⁻⁷ |
2.6719×10⁻⁶ | 1.5397 | 0.418107229 | 3.207923021 |
| M1123_40 |
3.028×10⁻⁸ |
2.8566×10⁻⁷ | 1.64771 | 0.54015768 | 3.571119791 |
| M1127_55 |
1.3276×10⁻⁸ |
1.3359×10⁻⁷ | 1.91652 | 0.784175155 | 4.616498053 |
| M1138_12 |
9.6475×10⁻⁶ |
3.6341×10⁻⁵ | 1.25759 | 0.461889022 | 2.446496536 |
| M1144_16 |
2.0167×10⁻⁹ |
3.3824×10⁻⁸ | 2.7147 | 1.740541284 | 9.570840078 |
| M1146_35 |
6.529×10⁻¹⁰ |
1.6425×10⁻⁸ | 2.77186 | 2.612216217 | 10.34906681 |
| M1150_36 |
3.9464×10⁻⁹ |
5.4153×10⁻⁸ | 1.87836 | 1.903402107 | 6.508579836 |
| M1163_78 | 0.00010426 | 0.00029951 | 1.28628 | 0.268622126 | 2.446015217 |
| M1190_81 |
2.8978×10⁻⁵ |
9.678×10⁻⁵ | 1.21026 | 0.31970599 | 2.341884927 |
| M1207_98 |
6.529×10⁻¹⁰ |
1.6425×10⁻⁸ | 2.49502 | 0.550691748 | 6.396113855 |
| M1216_31 |
2.7567×10⁻¹° |
1.3978×10⁻⁸ | 2.92377 | 2.903470782 | 11.45476404 |
| M1230_37 |
4.9091×10⁻⁶ |
2.0583×10⁻⁵ | 1.5803 | 0.390190586 | 3.294667162 |
| M1234_44 |
1.5646×10⁻⁵ |
5.4923×10⁻⁵ | 1.72882 | 1.132329262 | 5.002732013 |
| M1259_38 |
4.0713×10⁻⁷ |
2.6719×10⁻⁶ | 1.72134 | 0.668984452 | 3.864822477 |
| M1324_75 |
4.1219×10⁻⁶ |
1.8269×10⁻⁵ | 1.32713 | 0.326495903 | 2.353783547 |
| M1351_32 | 0.00025797 | 0.0006279 | 1.07649 | 0.222331714 | 1.765712861 |
| M1368_84 |
2.0167×10⁻⁹ |
3.3824×10⁻⁸ | 2.00209 | 0.614290076 | 4.832761142 |
| M1435_91 |
2.4028×10⁻⁶ |
1.2236×10⁻⁵ | 1.64372 | 0.304051349 | 3.099785952 |
| M1454_17 |
9.9241×10⁻⁹ |
1.07×10⁻⁷ | 2.09005 | 0.237729927 | 4.569096508 |
| M1475_93 | 0.00015512 | 0.0004181 | 1.1731 | 0.172207775 | 2.014840182 |
| M1505_23 |
4.5102×10⁻⁵ | 0.00014227 | 1.27917 | 0.903329951 | 3.306640883 |
| M1625_88 |
1.6891×10⁻⁷ |
1.3726×10⁻⁶ | 1.48823 | 0.535477091 | 3.408169271 |
| M1700_90 |
2.1171×10⁻⁷ |
1.6498×10⁻⁶ | 1.37375 | 0.23234938 | 2.32507649 |
| M1948_00 | 0.00015512 | 0.0004181 | 1.18882 | 0.126504245 | 1.85957764 |
| M2017_02 |
2.8292×10⁻⁹ |
4.2705×10⁻⁸ | 2.28118 | 3.299510237 | 10.03986804 |
| M2879_56 | 0.00022766 | 0.00057042 | 1.78224 | 6.897042594 | 14.34943243 |
| M2959_08 |
7.5712×10⁻⁷ |
4.5713×10⁻⁶ | 2.03316 | 0.916531467 | 5.060081501 |
| M3224_97 | 0.00093342 | 0.00185385 | 1.06247 | 2.49928245 | 1.090001717 |
| M3246_10 |
2.4028×10⁻⁶ |
1.2236×10⁻⁵ | 1.87892 | 0.396642163 | 4.2861341 |
| M3322_38 | 0.04595423 | 0.04441369 | 1.54968 | 7.748435198 | 4.898142987 |
| M3825_21 | 0.00074741 | 0.00154007 | 1.08572 | 2.514007357 | 0.827869797 |
| M3900_31 | 0.00022766 | 0.00057042 | 1.24374 | 2.663706342 | 0.890604754 |
| M4421_61 |
5.2082×10⁻⁵ | 0.00016044 | 1.69686 | 4.732555028 | 1.951991338 |
| M4478_27 |
3.2864×10⁻⁷ |
2.3028×10⁻⁶ | 1.54532 | 2.864591283 | 0.276282046 |
| M4715_56 |
3.8989×10⁻⁵ | 0.00012563 | 1.51004 | 3.657925544 | 1.239881596 |
| Table II.C, vs. A-H group differences in peak
filtering. |
Table II.
C, vs. A-H group differences in peak
filtering.
| SAMP_GRP | P-value | q-value | VIP | C average | A-H average |
|---|
| M1004_63 |
1.06×10⁻⁷ | 8.18
×10−6 | 2.75206 | 9.337262319 | 18.36057094 |
| M1009_81 |
6.91×10⁻⁵ | 0.000491 | 1.4842 | 31.51986384 | 40.48819307 |
| M1019_45 |
3.45×10⁻⁶ |
6.65×10⁻⁵ | 1.97222 | 4.718782081 | 9.320910566 |
| M1031_99 |
6.53×10⁻⁸ |
8.18×10⁻⁶ | 3.3601 | 7.811703062 | 18.49940089 |
| M1083_37 | 0.00033 | 0.001496 | 1.01317 | 0.294565816 | 1.699066783 |
| M1098_33 | 0.000595 | 0.002364 | 1.56859 | 0.38657576 | 2.544233659 |
| M1101_43 |
6×10⁻⁵ | 0.000455 | 2.06365 | 0.927844358 | 4.239463466 |
| M1103_90 |
1.14×10⁻⁵ | 0.000135 | 1.32065 | 0.479273296 | 2.349881329 |
| M1114_98 |
6×10⁻⁵ | 0.000455 | 1.58215 | 0.418107229 | 2.796677459 |
| M1123_40 | 0.010314 | 0.020685 | 1.14424 | 0.54015768 | 2.276438971 |
| M1127_55 | 0.001767 | 0.005778 | 1.68324 | 0.784175155 | 3.442394353 |
| M1138_12 | 0.010314 | 0.020685 | 1.29039 | 0.461889022 | 2.551331219 |
| M1144_16 |
9.1×10⁻⁵ | 0.000562 | 2.53058 | 1.740541284 | 6.707315793 |
| M1146_35 | 0.000258 | 0.001265 | 2.35356 | 2.612216217 | 7.147118481 |
| M1150_36 | 0.000228 | 0.001156 | 1.31248 | 1.903402107 | 4.223835486 |
| M1190_81 | 0.006145 | 0.015189 | 1.18846 | 0.31970599 | 1.670230569 |
| M1207_98 |
6.91×10⁻⁶ |
9.69×10⁻⁵ | 1.95582 | 0.550691748 | 3.644110346 |
| M1216_31 |
1.65×10⁻⁶ |
4.25×10⁻⁵ | 2.35906 | 2.903470782 | 8.011714226 |
| M1225_21 | 0.008712 | 0.018838 | 1.15032 | 0.055092064 | 1.468164449 |
| M1230_37 |
9.1×10⁻⁵ | 0.000562 | 1.47151 | 0.390190586 | 2.300611105 |
| M1234_44 | 0.000136 | 0.000774 | 1.93723 | 1.132329262 | 5.024199001 |
| M1351_32 | 0.014297 | 0.025343 | 1.11582 | 0.222331714 | 1.538636715 |
| M1368_84 |
3.36×10⁻⁵ | 0.000317 | 1.76946 | 0.614290076 | 3.075023606 |
| M1454_17 |
6.91×10⁻⁵ | 0.000491 | 1.6592 | 0.237729927 | 2.389504296 |
| M1625_88 |
2.88×10⁻⁶ |
6.04×10⁻⁵ | 1.7615 | 0.535477091 | 4.070970461 |
| M2017_02 | 0.001291 | 0.004424 | 1.25703 | 3.299510237 | 6.380801455 |
| M2879_56 | 0.002643 | 0.008118 | 1.43552 | 6.897042594 | 11.9477084 |
| M2959_08 | 0.001435 | 0.004811 | 1.52917 | 0.916531467 | 2.90088487 |
| M3224_97 | 0.035011 | 0.049694 | 1.06234 | 2.49928245 | 1.509255098 |
| M3246_10 |
1.13×10⁻⁶ |
3.47×10⁻⁵ | 1.83767 | 0.396642163 | 3.275699253 |
| M3322_38 | 0.004681 | 0.0126 | 1.88645 | 7.748435198 | 4.837010977 |
| M3825_21 | 0.011207 | 0.021603 | 1.16951 | 2.514007357 | 1.159904936 |
| M3900_31 | 0.011207 | 0.021603 | 1.09896 | 2.663706342 | 1.345515395 |
| M4412_23 | 0.012166 | 0.022765 | 1.03269 | 2.483203325 | 1.25835564 |
| M4421_61 | 0.003211 | 0.00949 | 1.89073 | 4.732555028 | 2.263517789 |
| M4715_56 |
9.65×10⁻⁶ | 0.000122 | 1.86603 | 3.657925544 | 0.858452439 |
| M4770_22 | 0.009484 | 0.019762 | 1.05903 | 1.036151502 | 0.130670044 |
| M4797_31 | 0.022719 | 0.03575 | 1.37116 | 4.054278147 | 1.971892733 |
| M4825_09 | 0.014297 | 0.025343 | 1.30691 | 3.330875754 | 2.065185447 |
| M4832_49 | 0.000372 | 0.00164 | 1.29409 | 2.046751735 | 0.412735635 |
| M5254_17 | 0.000201 | 0.001052 | 1.5746 | 1.256545457 | 4.629496349 |
| M5341_27 |
2.64×10⁻⁷ |
1.36×10⁻⁵ | 4.89611 | 9.675443865 | 26.47358094 |
| M5775_96 | 0.037519 | 0.052238 | 1.1959 | 2.1058316 | 0.742538154 |
| Table III.A-Q, vs. A-H group differences in
peak filtering. |
Table III.
A-Q, vs. A-H group differences in
peak filtering.
| SAMP_GRP | P-value | q-value | VIP | A-Q average | A-H average |
|---|
| M1004_63 | 0.039989 | 0.415819 | 1.16467 | 20.59813 | 18.36057 |
| M1019_45 | 0.002325 | 0.220852 | 2.23625 | 12.56351 | 9.320911 |
| M1123_40 | 0.044054 | 0.427081 | 1.27539 | 3.57112 | 2.276439 |
| M1146_35 | 0.036234 | 0.403855 | 2.52543 | 10.34907 | 7.147118 |
| M1150_36 | 0.000708 | 0.220852 | 1.73778 | 6.50858 | 4.223835 |
| M1207_98 | 0.013617 | 0.299041 | 2.71017 | 6.396114 | 3.64411 |
| M1216_31 | 0.00639 | 0.247157 | 2.00268 | 11.45476 | 8.011714 |
| M1245_23 | 0.036234 | 0.403855 | 2.37039 | −0.30271 | 0.870859 |
| M1259_38 | 0.048441 | 0.437643 | 1.91349 | 3.864822 | 2.087152 |
| M1324_75 | 0.021484 | 0.333673 | 1.45305 | 2.353784 | 1.244105 |
| M1368_84 | 0.044054 | 0.427081 | 2.00074 | 4.832761 | 3.075024 |
| M1435_91 | 0.013617 | 0.299041 | 1.76205 | 3.099786 | 1.304288 |
| M1475_93 | 0.048441 | 0.437643 | 1.73211 | 2.01484 | 0.937137 |
| M1505_23 | 0.026642 | 0.363733 | 1.35806 | 3.306641 | 2.081841 |
| M1661_24 | 0.019234 | 0.317797 | 2.17012 | 1.212314 | 0.238766 |
| M1694_85 | 0.004221 | 0.220852 | 1.66347 | 1.245148 | 0.288131 |
| M1700_90 | 0.019234 | 0.317797 | 2.19981 | 2.325076 | 1.021293 |
| M2001_69 | 0.013617 | 0.299041 | 1.81131 | 2.097512 | 0.993857 |
| M2017_02 | 0.002712 | 0.220852 | 2.50106 | 10.03987 | 6.380801 |
| M4144_81 | 0.003654 | 0.220852 | 1.30244 | −0.13272 | 0.656736 |
| M4478_27 | 0.003654 | 0.220852 | 2.15012 | 0.276282 | 2.172395 |
| M4861_39 | 0.048441 | 0.437643 | 1.32359 | 0.092989 | 0.802765 |
| M5642_48 | 0.007296 | 0.254484 | 1.30207 | 0.955681 | 0.245088 |
| M7564_68 | 0.012079 | 0.291543 | 1.54656 | 0.551073 | 1.201719 |
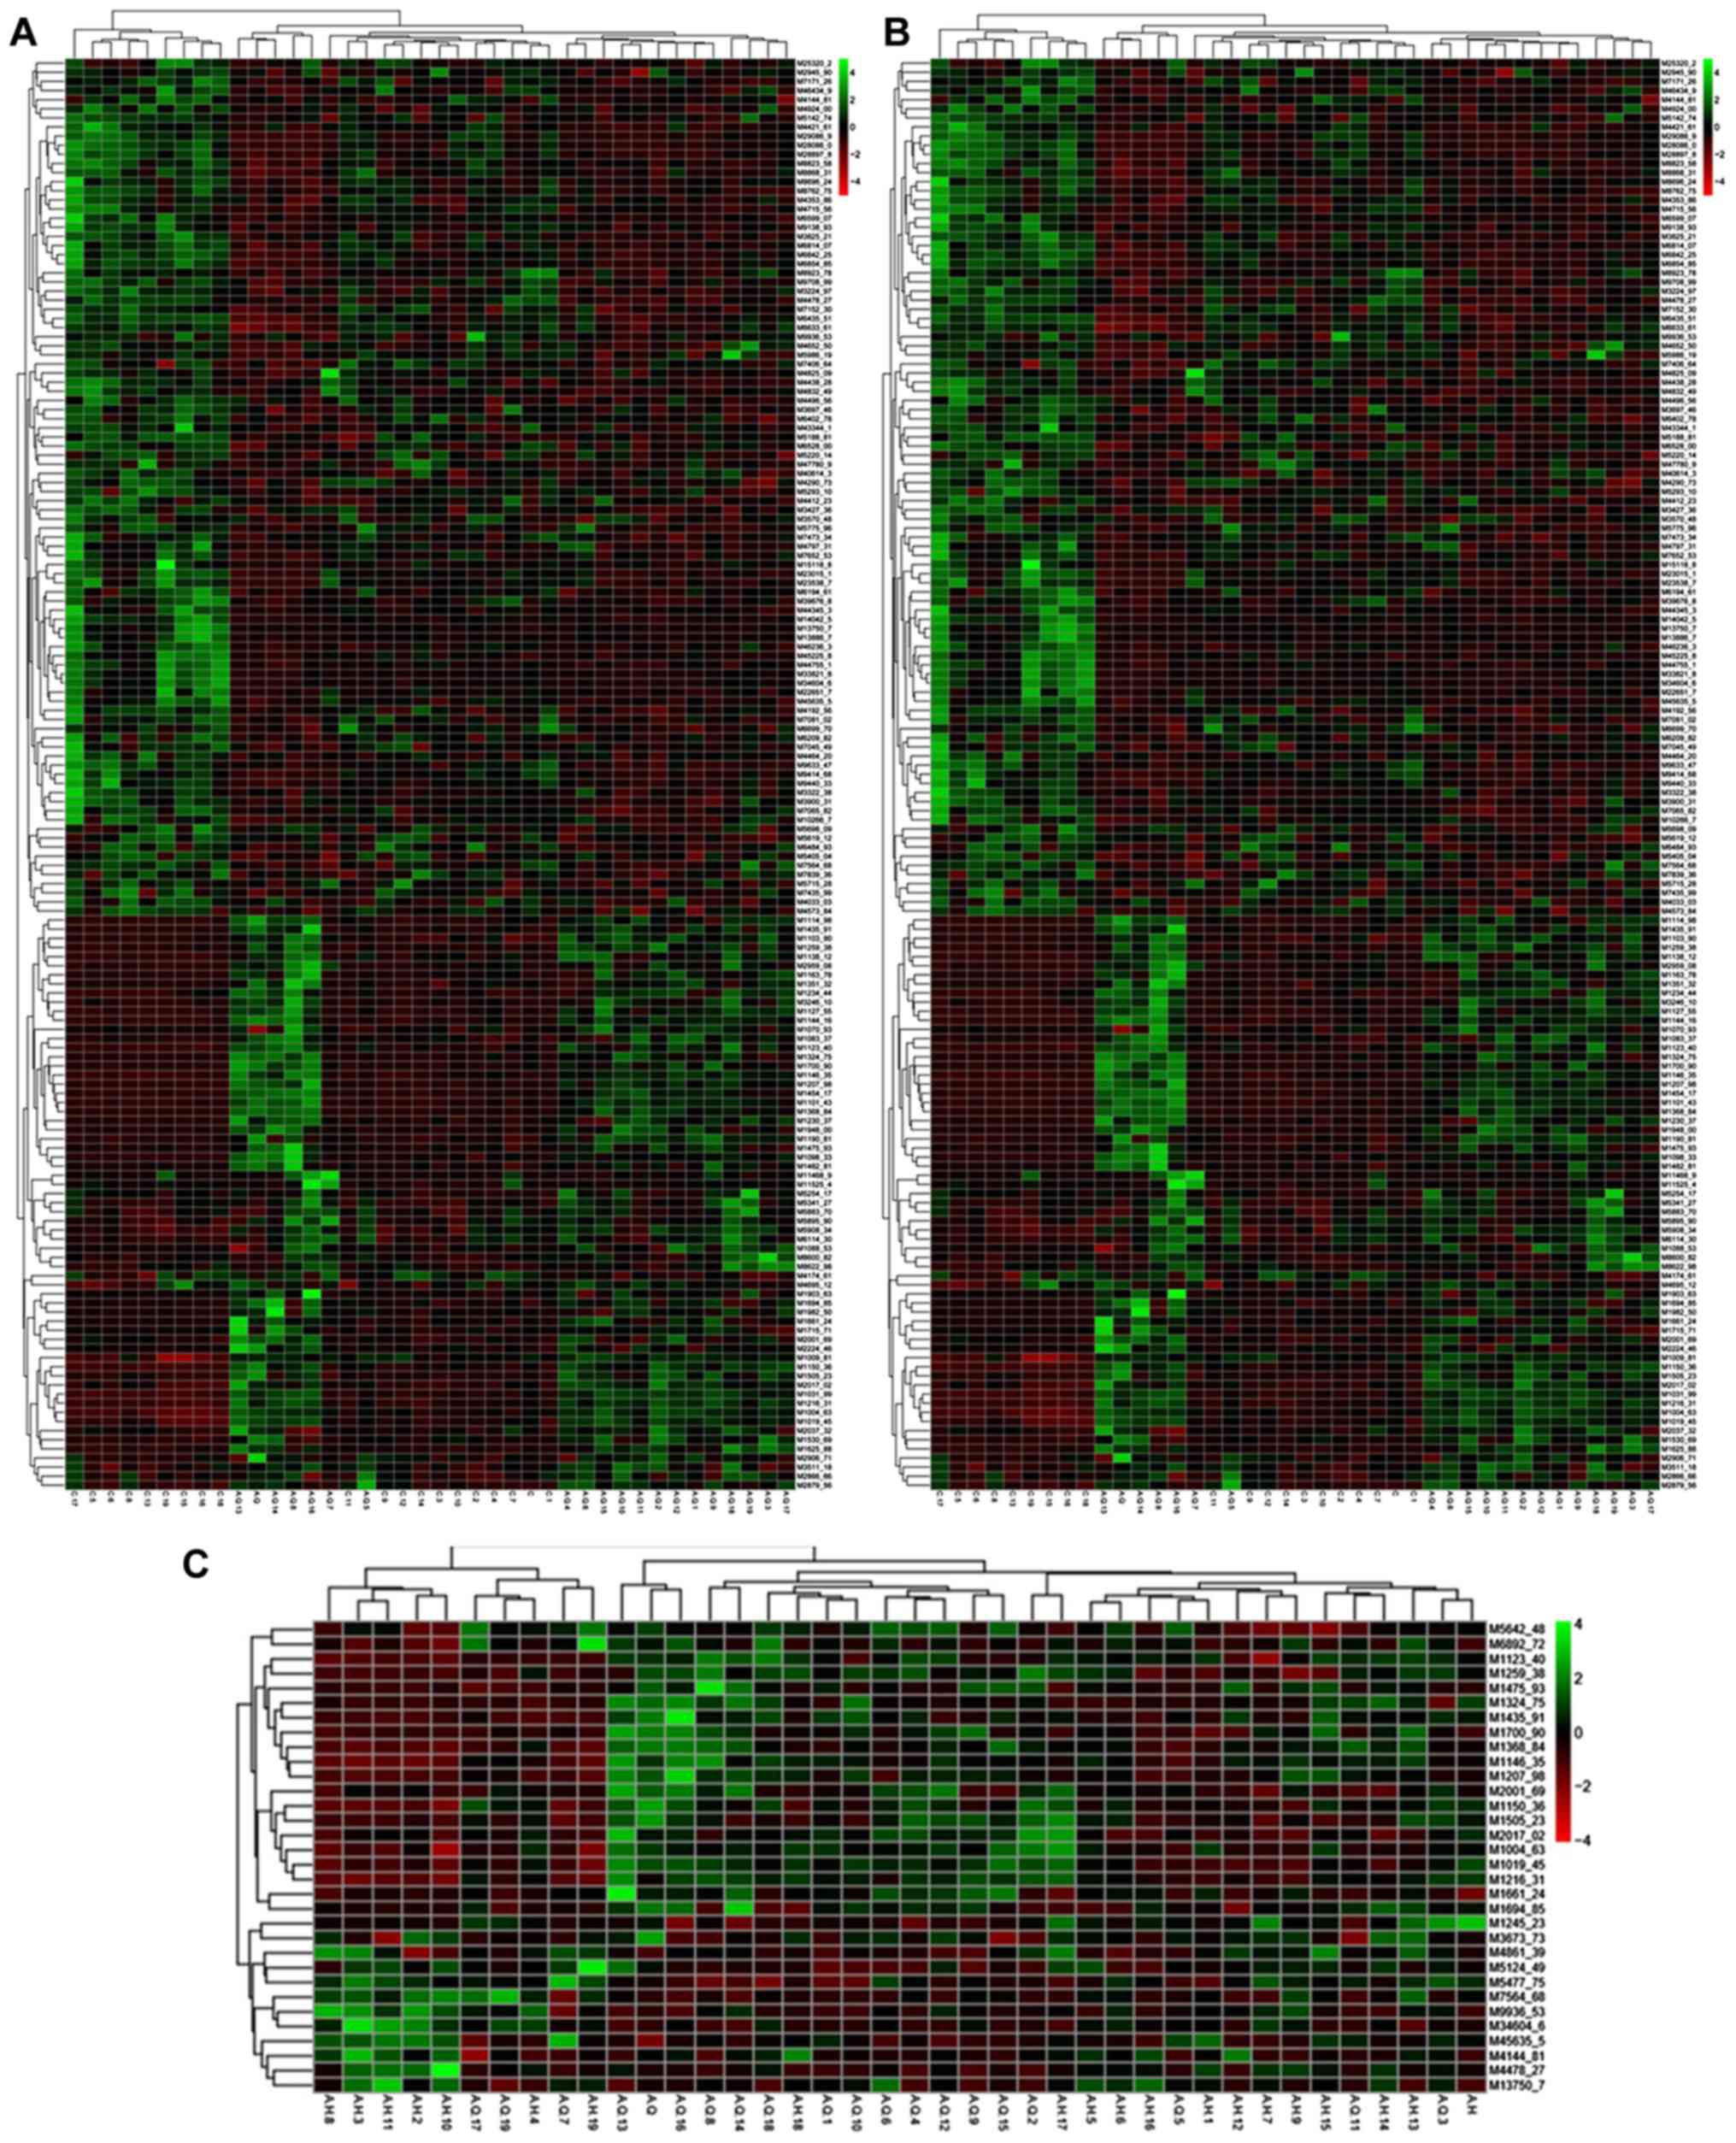
Hierarchical clustering analysis
The hierarchical cluster analysis was performed on
the differences in peaks, with a clustering diagram showing the
association between the samples. Each line represents a peak in the
diagram (Fig. 1), and each column
represents a sample. The red and green colors represent sample
testing content is higher and lower, respectively. The comparison
results for each group are shown in heat maps: C, vs. A-Q (Fig. 1A), C, vs. A-H (Fig. 1B), and A-Q, vs. A-H (Fig. 1C). Shown in Fig. 1A is the association between the
normal group and pre-foundation treatment group of samples, with
red indicating sample testing content was higher and green
indicating the sample testing content was lower. In Fig. 1B, the association between the normal
group and post-foundation treatment group of samples is shown. In
Fig. 1C, the association between
pre- and post-foundation treatment group samples is shown.
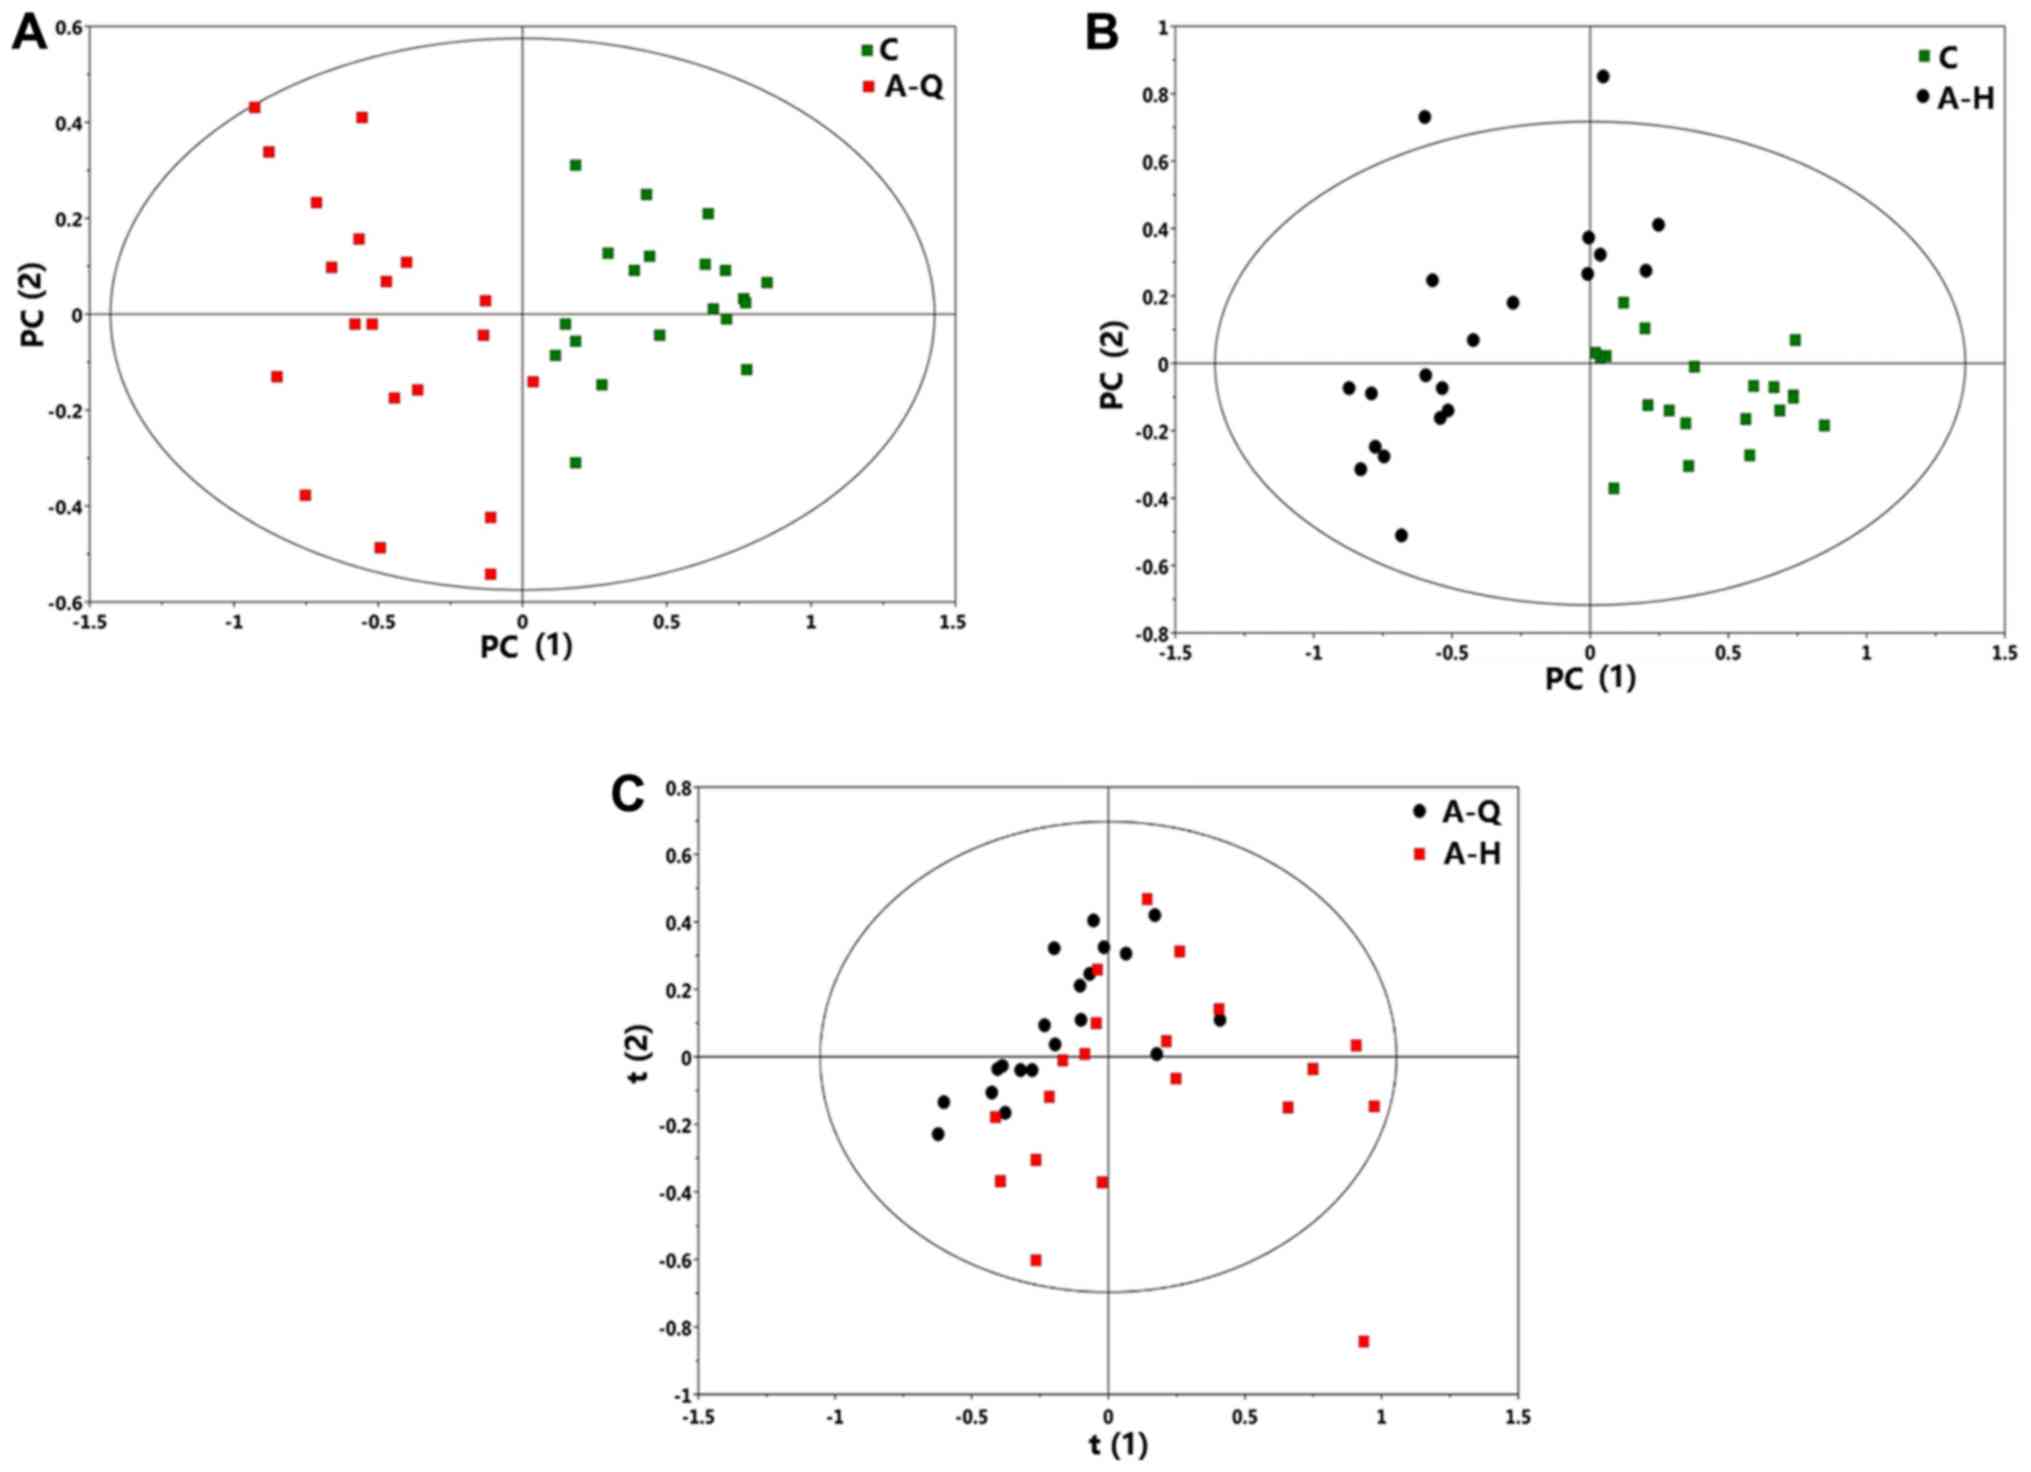
PCA analysis
Using SIMCA software (version 14), the PCA analysis
results were obtained. The scoring results for the total and the
comparisons in each group are shown. As shown in Fig. 2A, the normal group and pre-foundation
treatment group were distinguished. As shown in Fig. 2B, the normal group and
post-foundation treatment group were distinguished.
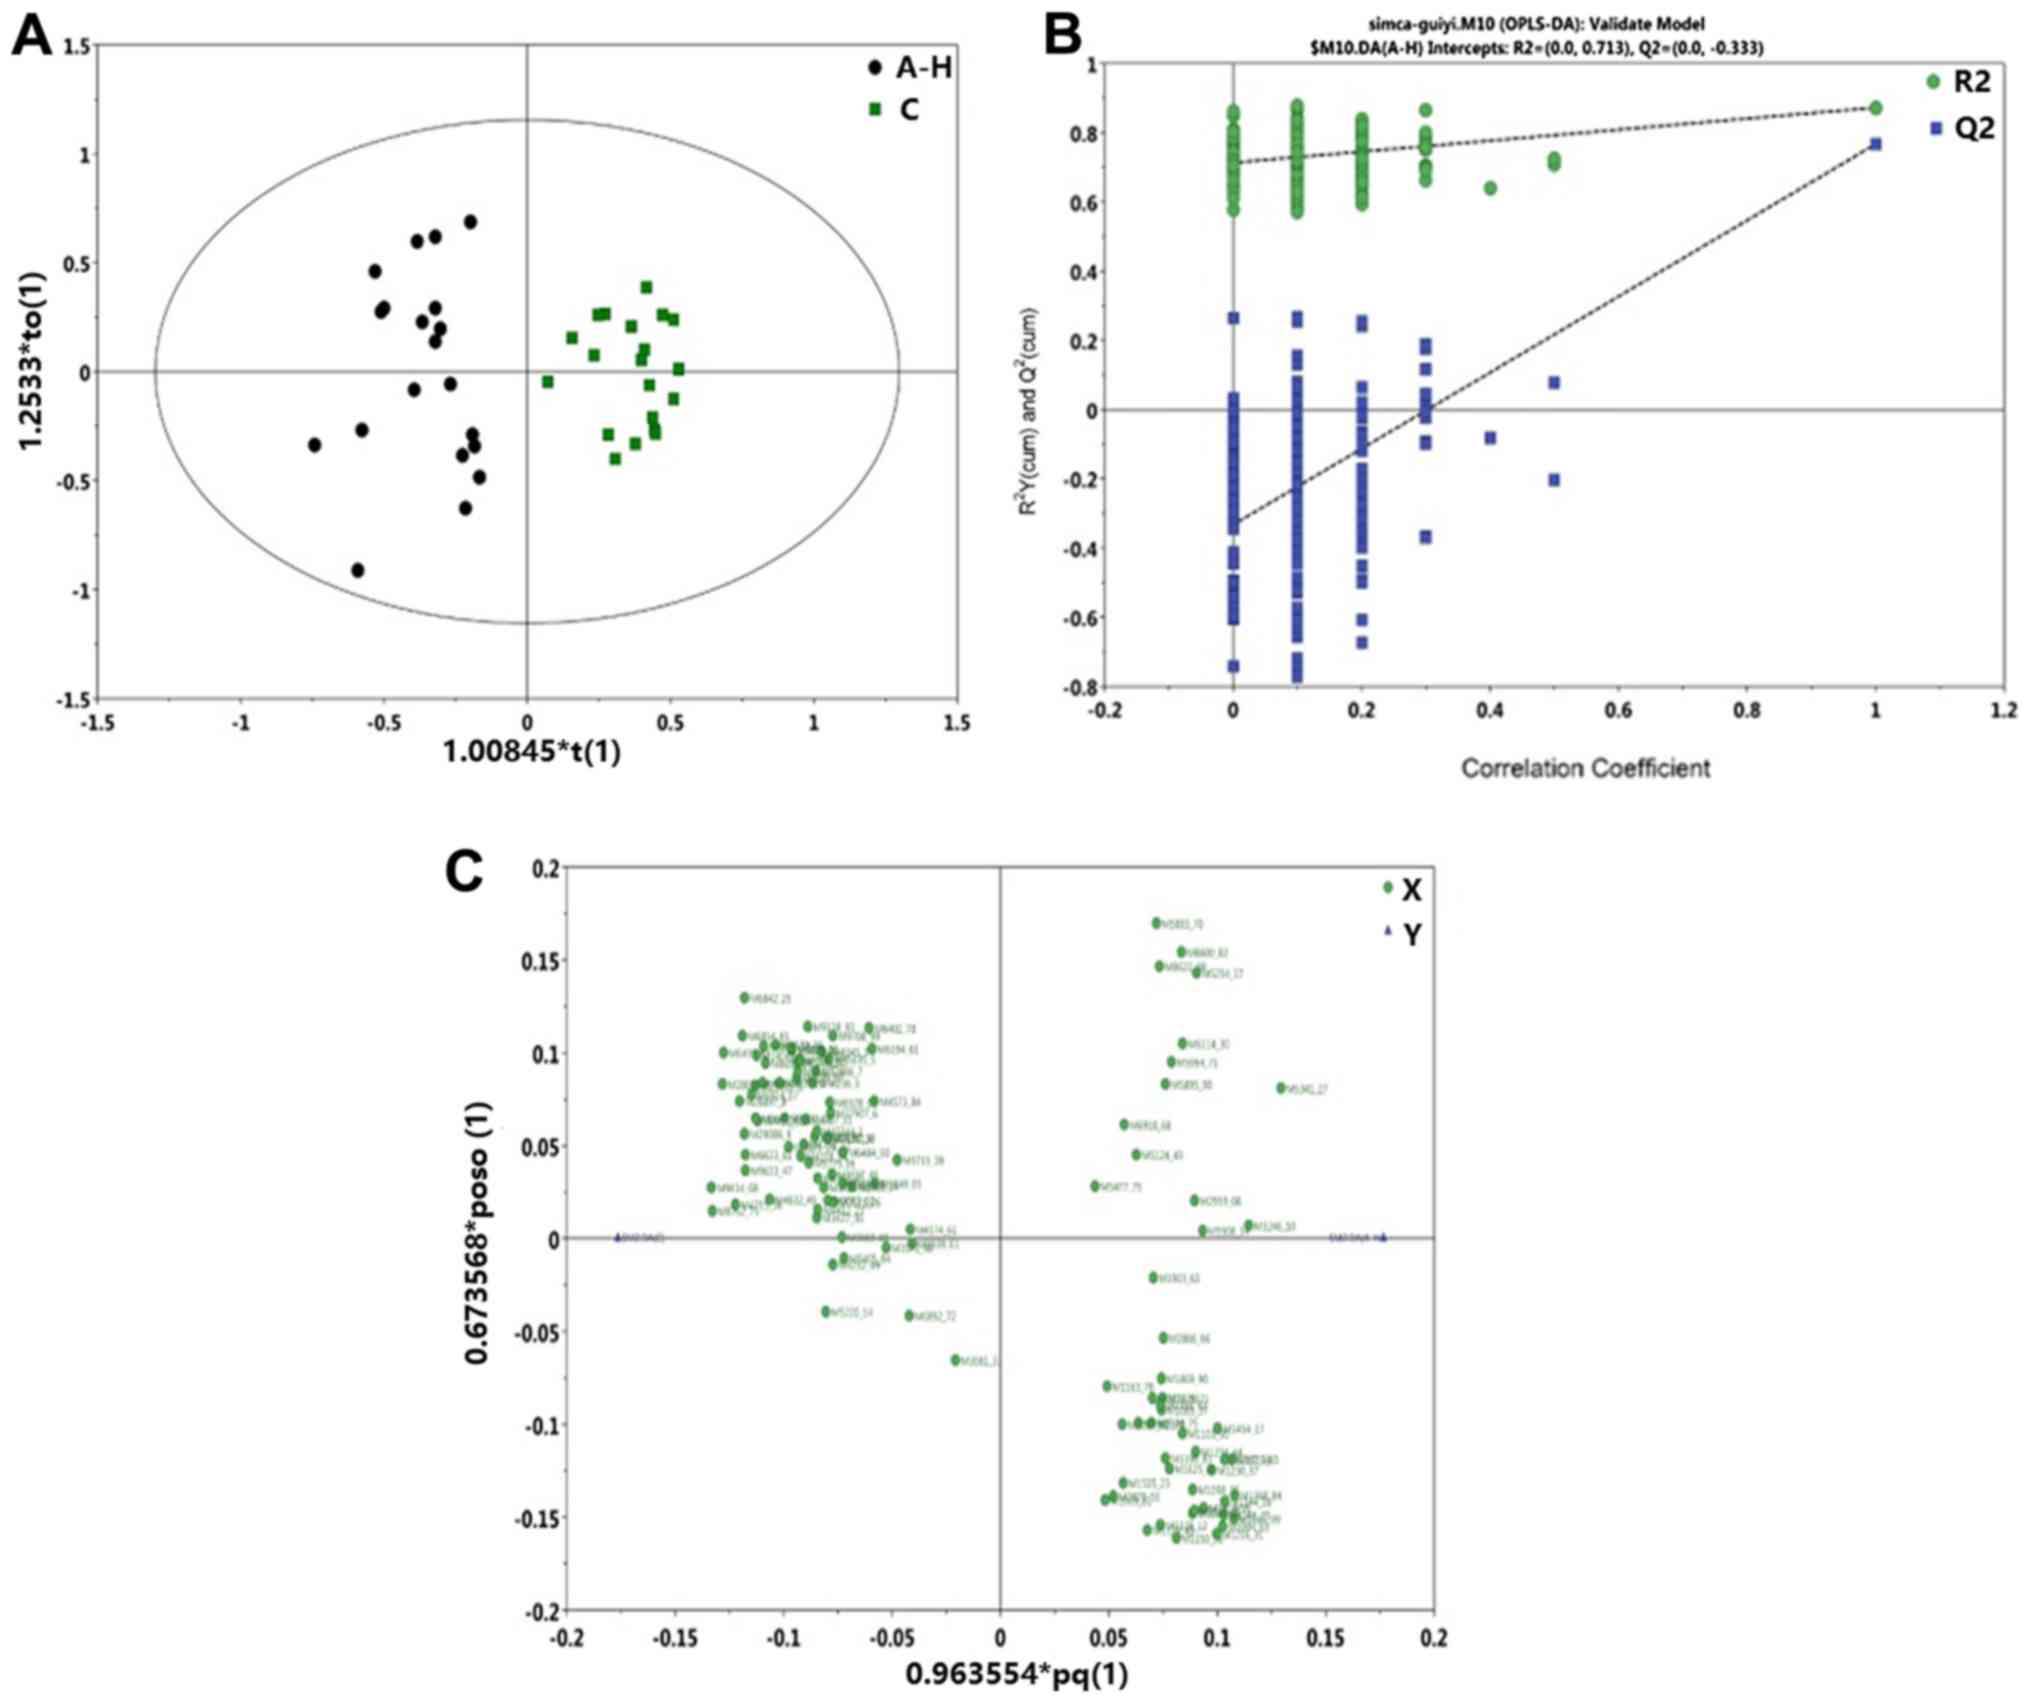
Orthogonal Projections to Latent
Structures Discriminant Analysis (OPLS-DA) model construction
The C, vs. A-Q group OPLS-DA scoring chart is shown
in Fig. 3A, the displacement test
(permutation test) diagram is shown in Fig. 3B, and the OPLS-DA load diagram is
shown in Fig. 3C. It was shown that
there was a significant difference in the protein level between the
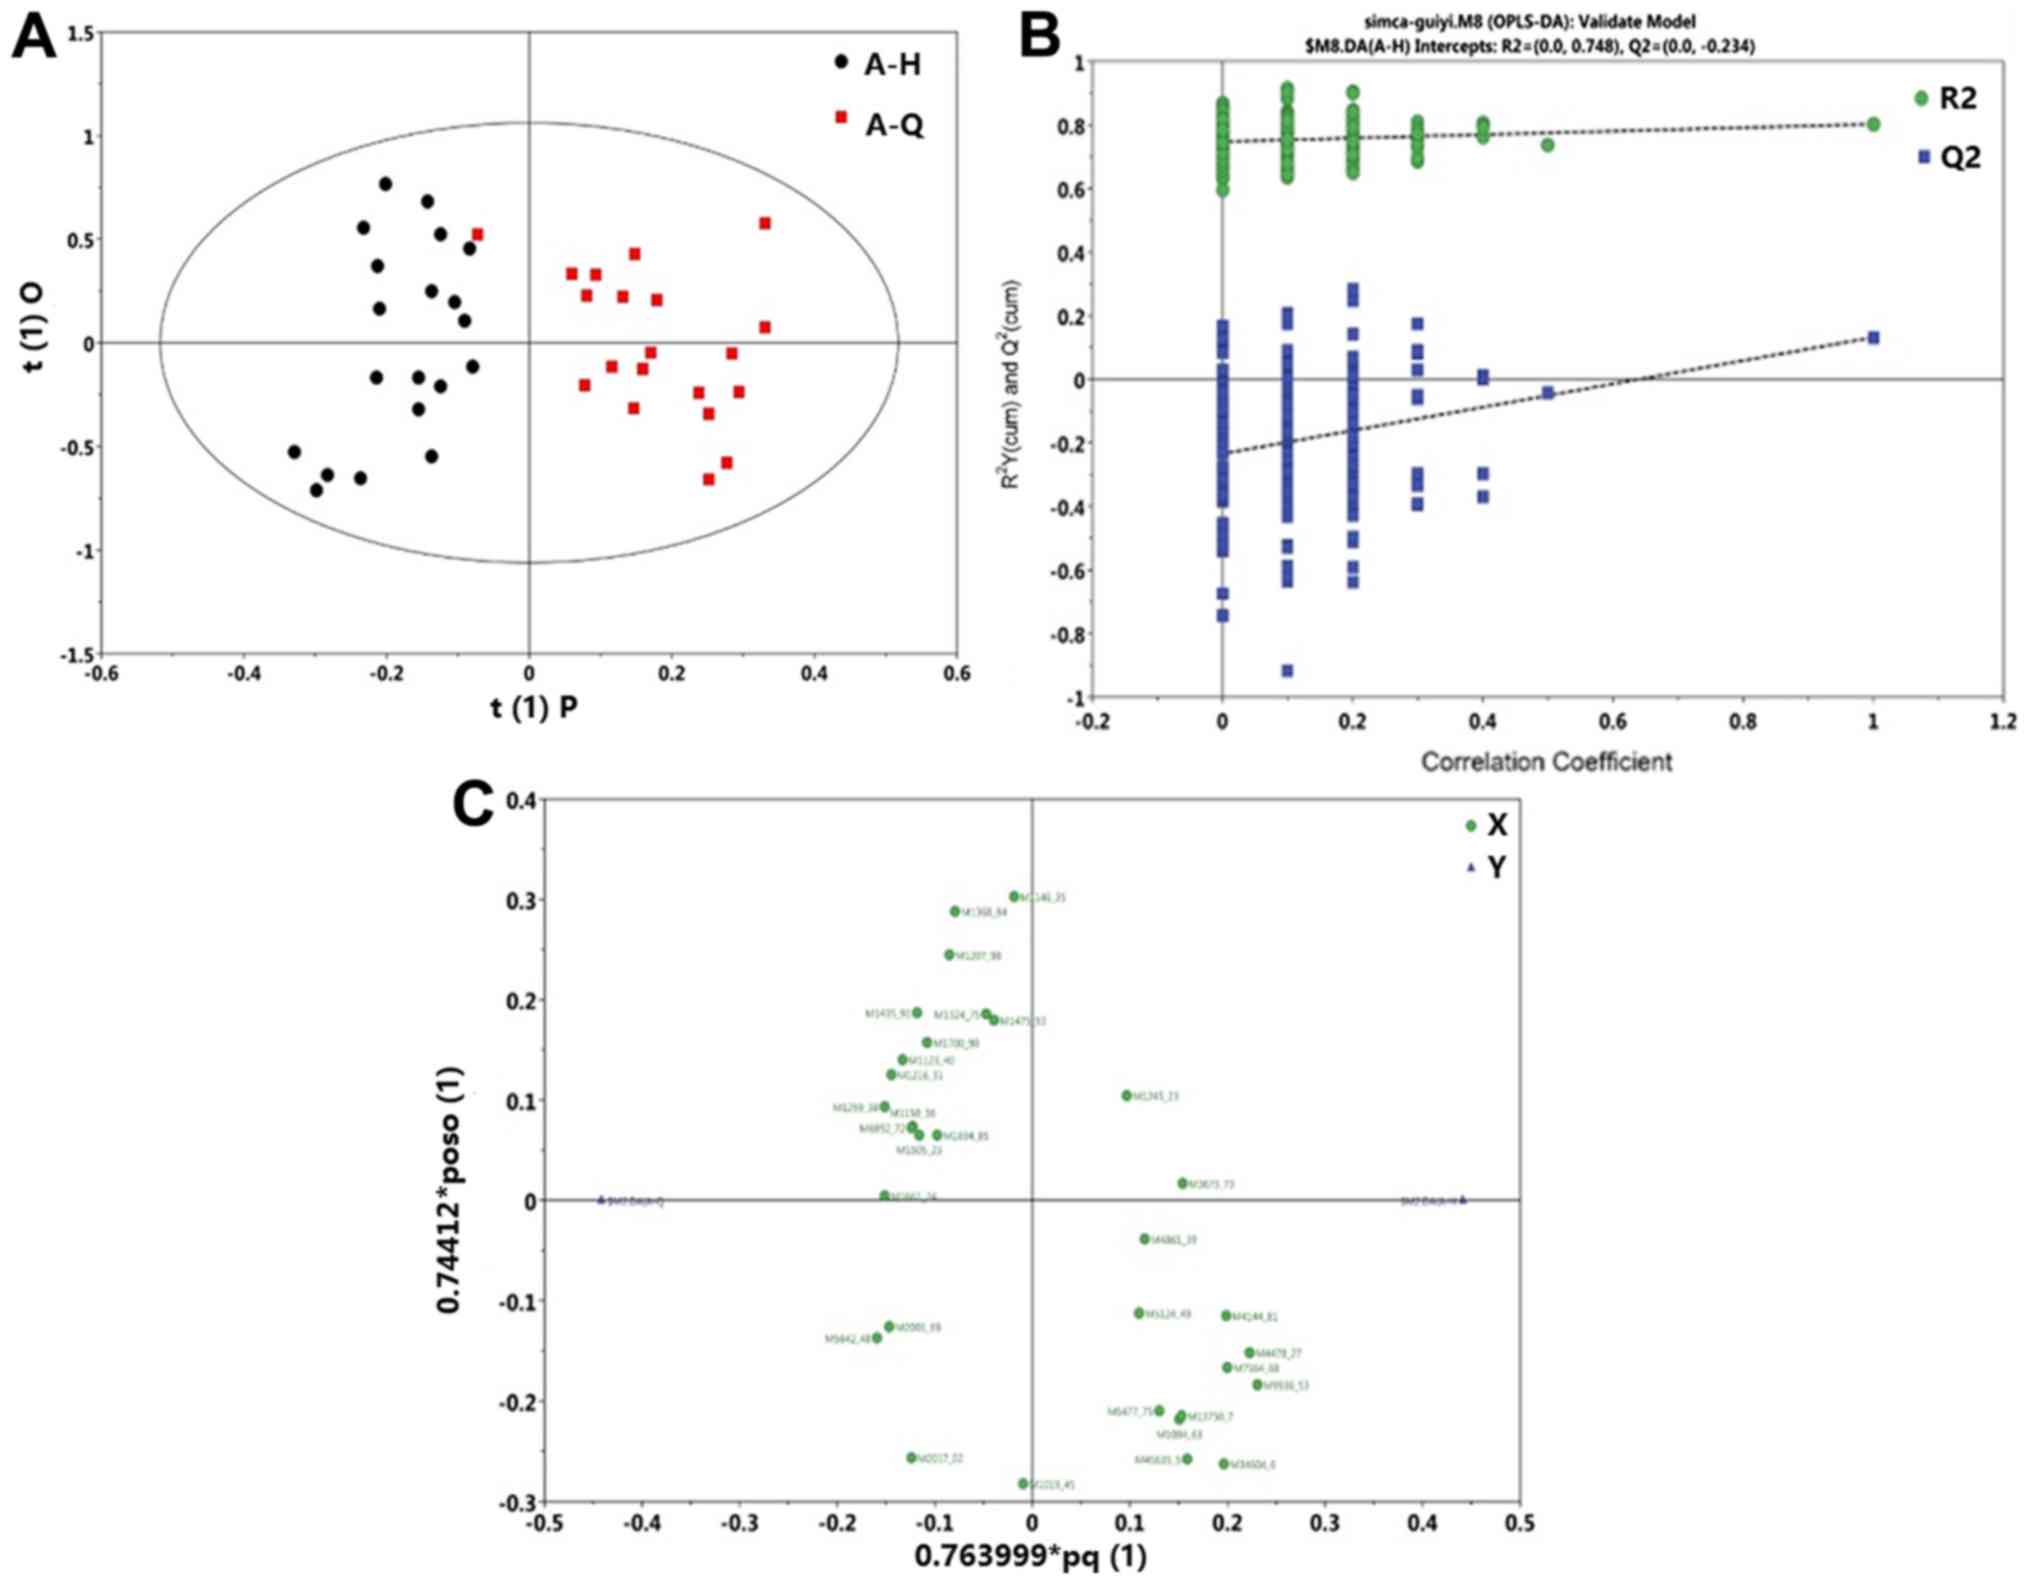
normal group and pre-foundation treatment group. The C, vs. A-H
group OPLS-DA scoring diagram is shown in Fig. 4A, the displacement test (permutation
test) diagram is shown in Fig. 4B,
and the OPLS-DA load diagram is shown in Fig. 4C. The protein level was significantly
different between the normal group and post-foundation treatment
group. The A-Q, vs. A-H group OPLS-DA scoring chart is shown in
Fig. 5A, the displacement test
(permutation test) diagram is shown in Fig. 5B and the OPLS-DA load diagram is
shown in Fig. 5C. A-Q and A-H were
markedly different (Fig. 5A). The
displacement test of the OPLS-DA model demonstrated that the
intercept of Q2 was less than 0.05, therefore the models were
robust (Fig. 5B). Each point
represents a protein that was expressed higher in the sample
compared with another (Fig. 5C).
Proteins on the left side of the axis were highly expressed in the
A-H group and proteins on the right side of the axis were highly
expressed in the A-Q group. These results demonstrate that proteins
level were markedly different between the normal group and the
post-foundation treatment group.
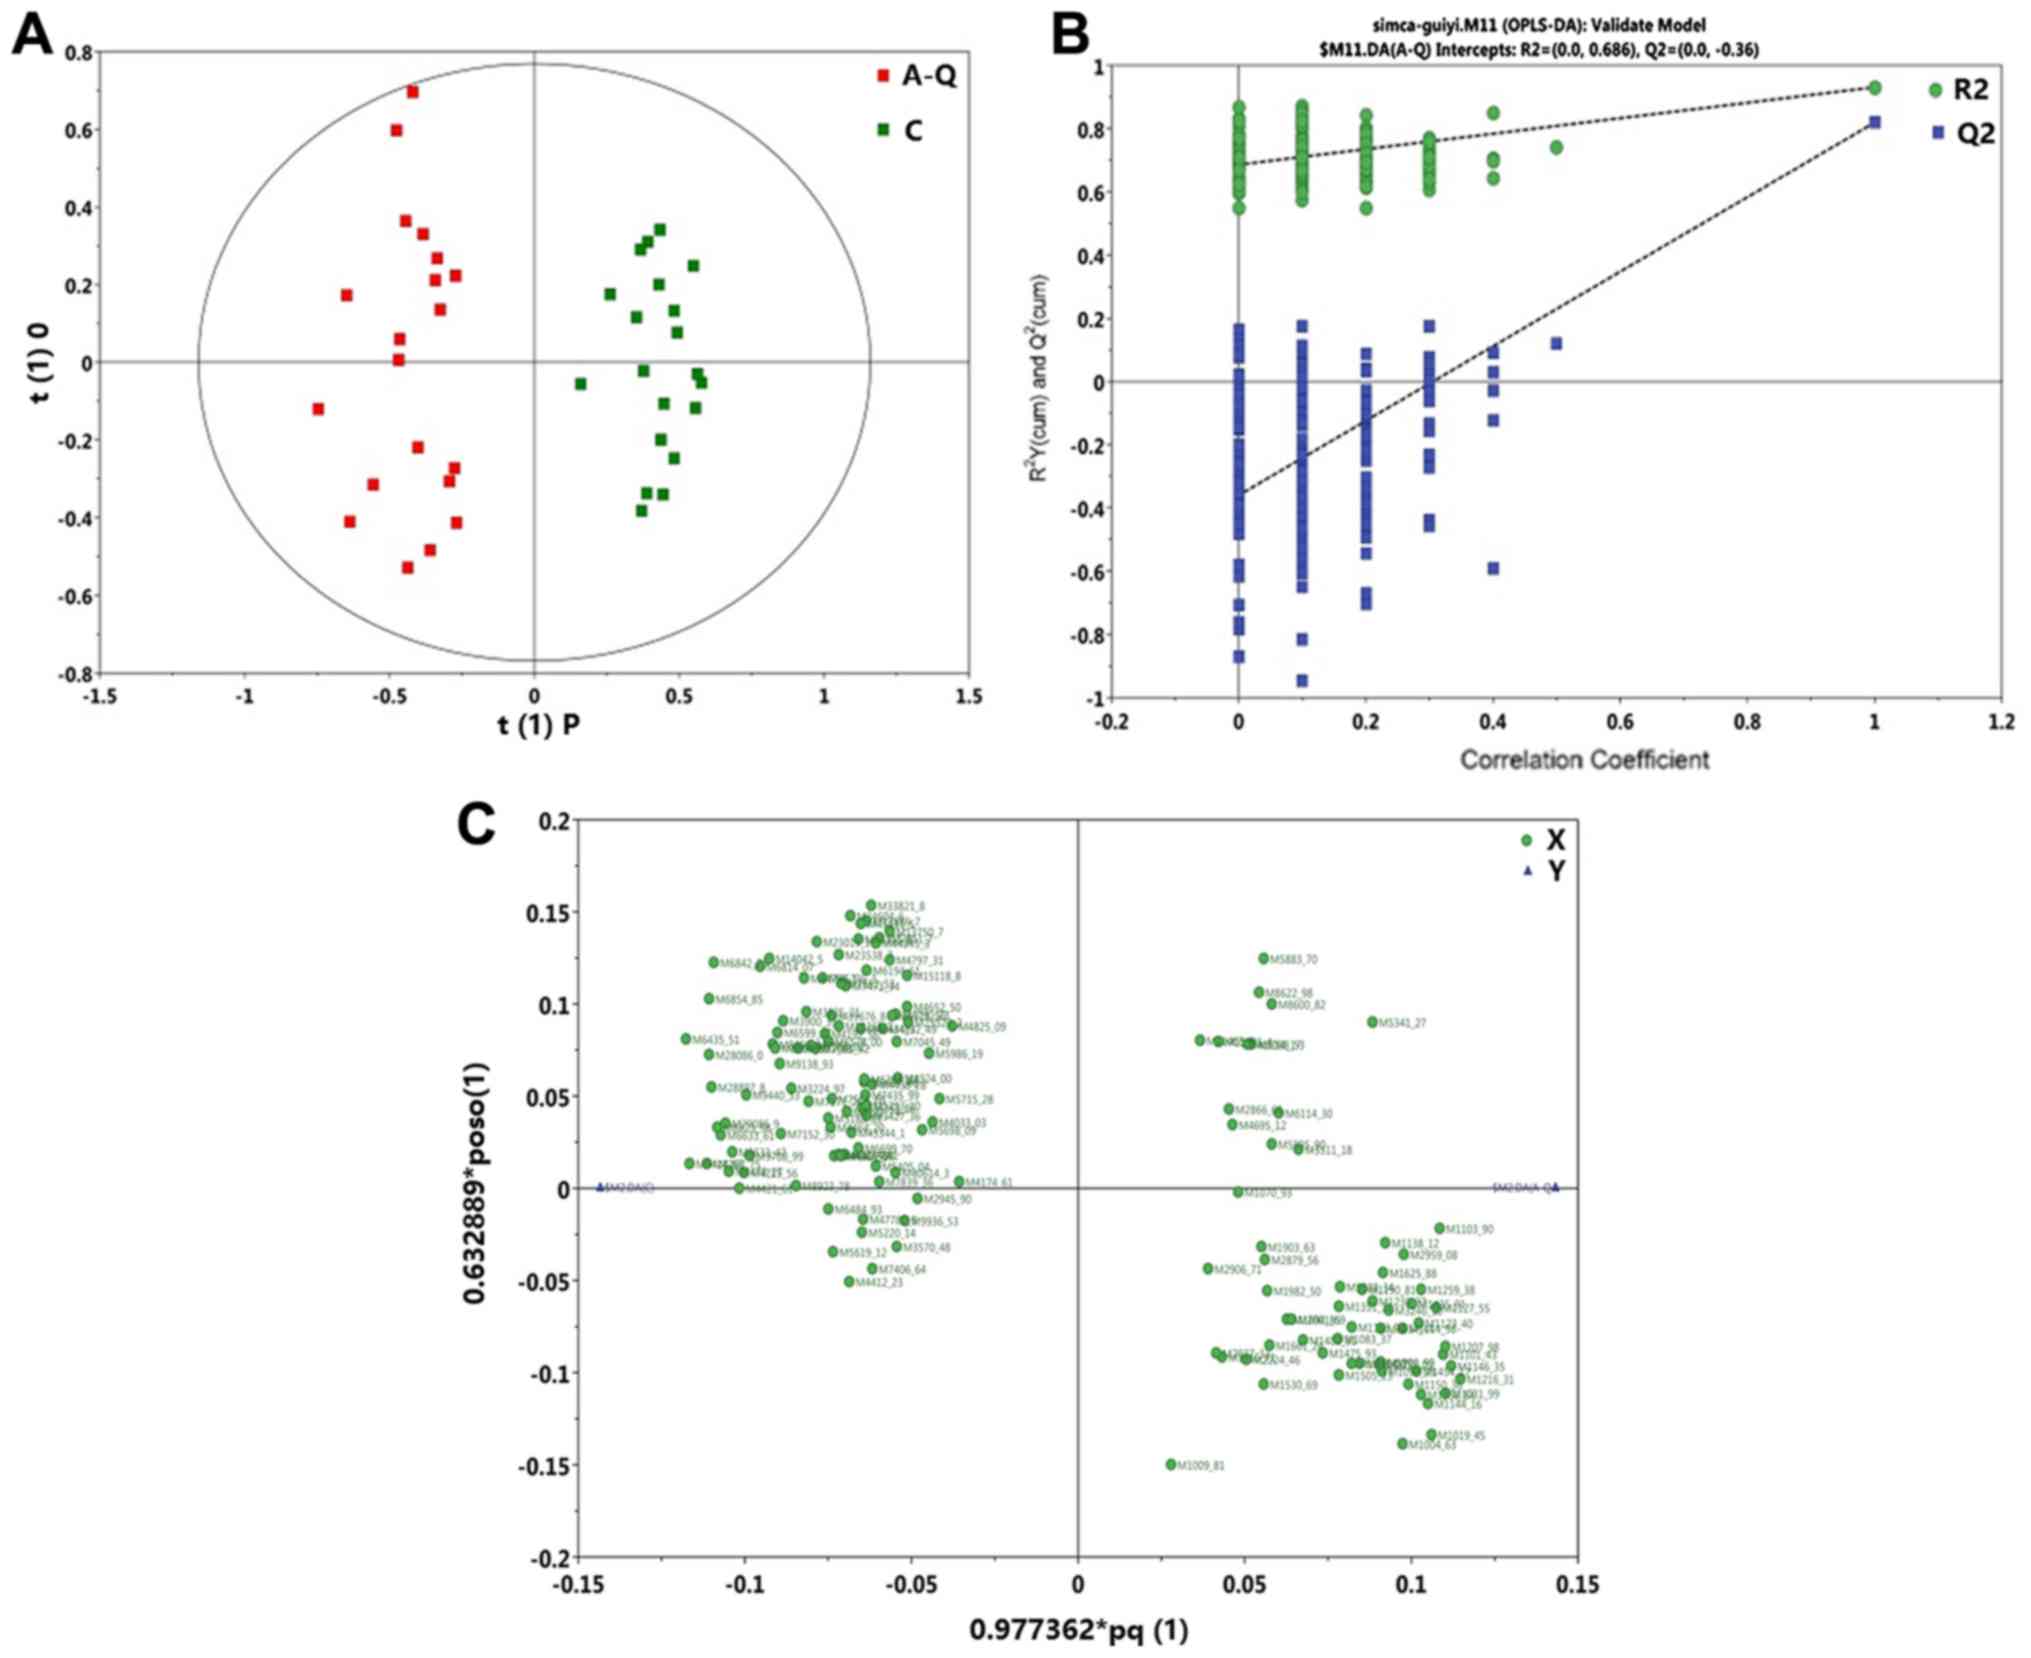 | Figure 3.C, vs. A-Q group OPLS-DA model. (A) C,
vs. A-Q group OPLS-DA scoring diagram shows the score plot of the
OPLS-DA model obtained from the C and A-Q groups. (B) C, vs. A-Q
group permutation test chart. A total of 200 permutations were
performed, and the resulting R2 and Q2 values are plotted. Green
circle, R2; blue square, Q2. The green line represents the
regression line for R2 and the blue line for Q2. (C) C, vs. A-Q
group OPLS-DA load diagram of the loading plot of the OPLS-DA model
obtained from the C and A-Q groups. OPLS-DA, Orthogonal Projections
to Latent Structures Discriminant Analysis; C, normal group; A-Q,
pre-foundation treatment group; A-H, post-foundation treatment
group. |
Differential protein prediction
Using Swiss-Prot (2017–10 release; https://www.uniprot.org/uniprot/?query=*&fil=organism%3A%22Homo+sapiens+%28Human%29+%5B9606%5D%22+AND+reviewed%3Ayes)
as the standard protein data in the database, self-owned coding
texted software was used to compare this with the amino acid
molecular weight of protein, and the most similar was found as the
result of the prediction of the protein. The self-owned coding
texted software performed peak-to-protein mapping using in-house
MATLAB (version 7.5; The MathWorks, Inc., Natick, MA, USA) scripts.
Briefly, the amino acid sequence for each protein in the human
genome was obtained from UniProt Knowledge Base (KB)/Swiss-Prot
(2017–10 release) (7). Potential
amino acid sequence segmentation was identified in Empirical
Proteomic Ontology-KB (7). Peaks
were mapped to the amino acid sequences based on the molecular
weight; a 5% deviation in molecular weight was allowed. Eventually,
a list of mapped proteins was compiled into an Excel table. The
differences in predicted proteins between C, vs. A-Q (Table IV), C, vs. A-H (Table V), and A-Q, vs. A-H (Table VI) were determined. From Table IV, it was possible to estimate the
differences in serum protein between the normal group and
pre-foundation treatment group of patients with silicosis. From
Table V, differences in serum
protein were estimated between the normal group and post-foundation
treatment group of patients with silicosis. From Table VI, it was possible to estimate the
differences in serum protein between the patients with silicosis
pre-foundation treatment and post-foundation treatment,
respectively. These results demonstrate that complement c3 frag,
amyloid βa4 protein, hepcidin, fibrinogen α-chain frags, plasma
protease c1 inhibitor frag and SERPING1 are markers for
silicosis.
| Table IV.C, vs. A-Q group differences protein
prediction results. |
Table IV.
C, vs. A-Q group differences protein
prediction results.
| SAMP_GRP | P-value | q-value | VIP | ID | MZ_SELDI | Predicted
protein | Theoretical MZ | Gene name |
|---|
| M1948_00 | 0.000155115 | 0.000418099 | 1.18882 | M1948_00 | 1,948 | Complement c3
frag | 1,865.12 | C3 |
| M2017_02 |
2.83×10⁻⁹ |
4.27×10⁻⁸ | 2.28E+00 | M2017_02 | 2,017.02 | Amyloid βa4
protein | 1,953.10 | APP |
| M2879_56 | 0.000227661 | 0.000570423 | 1.78224 | M2879_56 | 2,879.56 | Hepcidin | 2,797.41 | HAMP |
| M3224_97 | 0.000933418 | 0.001853851 | 1.06247 | M3224_97 | 3,224.97 | Fibrinogen α-chain
frag | 3,262.47 | FGA |
| M3246_10 |
2.40×10⁻⁶ |
1.22×10⁻⁵ | 1.88E+00 | M3246_10 | 3,246.1 | Fibrinogen α-chain
frag | 3,262.47 | FGA |
| M3322_38 | 0.04595423 | 0.044413687 | 1.54968 | M3322_38 | 3,322.38 | Fibrinogen α-chain
frag | 3,262.47 | FGA |
| M3825_21 | 0.000747408 | 0.001540074 | 1.08572 | M3825_21 | 3,825.21 | Neurosecretory
protein vgf frag | 3,688.03 | VGF |
| M3900_31 | 0.000227661 | 0.000570423 | 1.24374 | M3900_31 | 3,900.31 | Amyloid βa4
protein | 4,074.54 | APP |
| M4421_61 |
5.2×10⁻⁵ | 0.000160437 | 1.69686 | M4421_61 | 4,421.61 |
α-1-antichymotrypsin, α-1-antichymotrypsin
frag | 4,343.65 | SERPINA3 |
| M4478_27 |
3.29×10⁻⁷ |
2.30×10⁻⁶ | 1.55E+00 | M4478_27 | 4,478.27 |
α-1-antichymotrypsin, α-1-antichymotrypsin
frag | 4,343.65 | SERPINA3 |
| M4715_56 |
3.90×10⁻⁵ | 0.000125632 | 1.51004 | M4715_56 | 4,715.56 | Neurosecretory
protein vgf frag | 4,823.50 | VGF |
| M4797_31 | 0.005617767 | 0.008299276 | 1.0441 | M4797_31 | 4,797.31 | Neurosecretory
protein vgf frag | 4,823.50 | VGF |
| M5895_90 | 0.003210931 | 0.005373126 | 1.36332 | M5895_90 | 5,895.9 | Fibrinogen a-chain
frag | 5,904.22 | FGA |
| M5908_34 |
5.83×10⁻⁶ |
2.32×10⁻⁵ | 3.48E+00 | M5908_34 | 5,908.34 | Fibrinogen achain
frag | 5,904.22 | FGA |
| M6114_30 | 0.007330817 | 0.010059399 | 1.62262 | M6114_30 | 6,114.3 | Apolipoprotein
c-i | 6,432.35 | APOC1 |
| M6435_51 |
5.83×10⁻⁶ |
2.32×10⁻⁵ | 4.57E+00 | M6435_51 | 6,435.51 | Apolipoprotein
c-i | 6,630.58 | APOC1 |
| M6599_07 |
4.91×10⁻⁶ |
2.06×10⁻⁵ | 1.55E+00 | M6599_07 | 6,599.07 | Transthyretin | 6,880.00 | TTR |
| M6633_61 | 0.000835766 | 0.001682037 | 4.08017 | M6633_61 | 6,633.61 | Transthyretin | 6,880.00 | TTR |
| M6814_07 | 5.21
×10−5 | 0.000160437 | 1.25676 | M6814_07 | 6,814.07 | Transthyretin | 6,880.00 | TTR |
| M6842_25 |
4.91×10⁻⁶ |
2.06×10⁻⁵ | 3.20E+00 | M6842_25 | 6,842.25 | Transthyretin | 6,880.00 | TTR |
| M6854_85 |
3.29×10⁻⁷ |
2.30×10⁻⁶ | 2.41E+00 | M6854_85 | 6,854.85 | Transthyretin | 6,880.00 | TTR |
| M7152_30 | 0.000530525 | 0.001161127 | 1.07687 | M7152_30 | 7,152.3 | Transthyretin | 6,880.00 | TTR |
| M8600_82 | 0.018093579 | 0.02061882 | 1.40868 | M8600_82 | 8,600.82 | Apolipoprotein
c-iii | 8,764.67 | APOC3 |
| M8696_24 | 0.006144956 | 0.008869015 | 2.30513 | M8696_24 | 8,696.24 | Apolipoprotein
c-iii | 8,764.67 | APOC3 |
| M8762_75 |
1.65×10⁻⁶ |
9.07×10⁻⁶ | 2.50E+00 | M8762_75 | 8,762.75 | Apolipoprotein
c-iii | 8,764.67 | APOC3 |
| M8823_58 | 0.00011921 | 0.000335954 | 3.04231 | M8823_58 | 8,823.58 | Apolipoprotein
c-iii | 8,764.67 | APOC3 |
| M8868_31 | 0.000667562 | 0.001405836 | 1.71114 | M8868_31 | 8,868.31 | Apolipoprotein
a-ii | 9,303.65 | APOA2 |
| M8923_78 | 0.000530525 | 0.001161127 | 2.0589 | M8923_78 | 8,923.78 | Apolipoprotein
a-ii | 9,303.65 | APOA2 |
| M9138_93 | 0.00011921 | 0.000335954 | 1.16089 | M9138_93 | 9,138.93 | Apolipoprotein
a-ii | 9,303.65 | APOA2 |
| M9414_68 |
7.37×10⁻⁹ |
8.75×10⁻⁸ | 2.70E+00 | M9414_68 | 9,414.68 | Apolipoprotein
a-ii | 9,303.65 | APOA2 |
| M9440_33 |
1.56×10⁻⁵ |
5.49×10⁻⁵ | 1.62E+00 | M9440_33 | 9,440.33 | Apolipoprotein
a-ii | 9,303.65 | APOA2 |
| M9633_47 |
2.88×10⁻⁶ |
1.40×10⁻⁵ | 1.10E+00 | M9633_47 | 9,633.47 | Apolipoprotein
a-ii | 9,303.65 | APOA2 |
| M9708_99 | 0.000291908 | 0.000688459 | 1.01733 | M9708_99 | 9,708.99 | Apolipoprotein
a-ii | 9,303.65 | APOA2 |
| M13886_7 | 0.000329848 | 0.000765972 | 1.03751 | M13886_7 | 13,886.7 | Cystatin-c | 13,347.14 | CST3 |
| M14042_5 |
2.40×10⁻⁶ |
1.22×10⁻⁵ | 1.19E+00 | M14042_5 | 14,042.5 | Transthyretin | 13,761.41 | TTR |
| Table V.C, vs. A-H group differences protein
prediction results. |
Table V.
C, vs. A-H group differences protein
prediction results.
| SAMP_GRP | P-value | q-value | VIP | ID | MZ_SELDI | Predicted
protein | Theoretical MZ | Gene name |
|---|
| M2017_02 | 0.001290971 | 0.004424107 | 1.25703 | M2017_02 | 2,017.02 | Amyloid βa4
protein | 1,953.10 | APP |
| M2879_56 | 0.002642631 | 0.008117783 | 1.43552 | M2879_56 | 2,879.56 | Hepcidin | 2,797.41 | HAMP |
| M2959_08 | 0.001434955 | 0.004810632 | 1.52917 | M2959_08 | 2,959.08 | No protein
matched. |
|
|
| M3224_97 | 0.03501066 | 0.049693616 | 1.06234 | M3224_97 | 3,224.97 | Fibrinogen α-chain
frag | 3,262.47 | FGA |
| M3246_10 |
1.13×10⁻⁶ |
3.47×10⁻⁵ | 1.84E+00 | M3246_10 | 3,246.1 | Fibrinogen α-chain
frag | 3,262.47 | FGA |
| M3322_38 | 0.004681199 | 0.012599765 | 1.88645 | M3322_38 | 3,322.38 | Fibrinogen α-chain
frag | 3,262.47 | FGA |
| M3825_21 | 0.011206767 | 0.021602908 | 1.16951 | M3825_21 | 3,825.21 | Neurosecretory
protein vgf frag | 3,688.03 | VGF |
| M3900_31 | 0.011206767 | 0.021602908 | 1.09896 | M3900_31 | 3,900.31 | Amyloid βa4
protein | 4,074.54 | APP |
| M4412_23 | 0.012165581 | 0.022764829 | 1.03269 | M4412_23 | 4,412.23 |
α-1-antichymotrypsin,
alpha-1-antichymotrypsin frag | 4,343.65 | SERPINA3 |
| M4421_61 | 0.003210931 | 0.00948974 | 1.89073 | M4421_61 | 4,421.61 |
α-1-antichymotrypsin, α-1-antichymotrypsin
frag | 4,343.65 | SERPINA3 |
| M4715_56 | 9.65
×10−6 | 0.00012165 | 1.86603 | M4715_56 | 4,715.56 | Neurosecretory
protein vgf frag | 4,823.50 | VGF |
| M4770_22 | 0.009483607 | 0.019762305 | 1.05903 | M4770_22 | 4,770.22 | Neurosecretory
protein vgf frag | 4,823.50 | VGF |
| M4797_31 | 0.022718728 | 0.035750307 | 1.37116 | M4797_31 | 4,797.31 | Neurosecretory
protein vgf frag | 4,823.50 | VGF |
| M4825_09 | 0.014297273 | 0.02534287 | 1.30691 | M4825_09 | 4,825.09 | Neurosecretory
protein vgf frag | 4,823.50 | VGF |
| M4832_49 | 0.000372206 | 0.001639974 | 1.29409 | M4832_49 | 4,832.49 | Neurosecretory
protein vgf frag | 4,823.50 | VGF |
| M5775_96 | 0.037519175 | 0.052237795 | 1.1959 | M5775_96 | 5,775.96 | Fibrinogen α-chain
frag | 5,904.22 | FGA |
| M5883_70 | 0.049090325 | 0.06313916 | 1.07377 | M5883_70 | 5,883.7 | Fibrinogen α-chain
frag | 5,904.22 | FGA |
| M5895_90 | 0.04595423 | 0.060326782 | 1.2068 | M5895_90 | 5,895.9 | Fibrinogen α-chain
frag | 5,904.22 | FGA |
| M5908_34 | 0.000530525 | 0.002164918 | 3.30565 | M5908_34 | 5,908.34 | Fibrinogen α-chain
frag | 5,904.22 | FGA |
| M5954_71 | 0.018093579 | 0.030305345 | 1.20553 | M5954_71 | 5,954.71 | Fibrinogen α-chain
frag | 5,904.22 | FGA |
| M6114_30 | 0.012165581 | 0.022764829 | 1.64383 | M6114_30 | 6,114.3 | Apolipoprotein
c-i | 6,432.35 | APOC1 |
| M6435_51 | 0.000667562 | 0.002573673 | 4.89498 | M6435_51 | 6,435.51 | Apolipoprotein
c-i | 6,630.58 | APOC1 |
| M6484_93 | 0.019536762 | 0.032051368 | 1.05576 | M6484_93 | 6,484.93 | Apolipoprotein
c-i | 6,630.58 | APOC1 |
| M6599_07 | 0.001041218 | 0.003734178 | 1.48867 | M6599_07 | 6,599.07 | Transthyretin | 6,880.00 | TTR |
| M6633_61 | 0.006144956 | 0.015189373 | 4.32524 | M6633_61 | 6,633.61 | Transthyretin | 6,880.00 | TTR |
| M6814_07 | 0.000104264 | 0.000618417 | 1.4876 | M6814_07 | 6,814.07 | Transthyretin | 6,880.00 | TTR |
| M6842_25 | 0.000419438 | 0.001796749 | 3.26991 | M6842_25 | 6,842.25 | Transthyretin | 6,880.00 | TTR |
| M6854_85 | 0.000667562 | 0.002573673 | 2.37706 | M6854_85 | 6,854.85 | Transthyretin | 6,880.00 | TTR |
| M7065_82 | 0.011206767 | 0.021602908 | 1.08096 | M7065_82 | 7,065.82 | Transthyretin | 6,880.00 | TTR |
| M7652_53 | 0.006144956 | 0.015189373 | 1.08712 | M7652_53 | 7,652.53 | Osteopontin
frag | 7,658.19 | SPP1 |
| M8600_82 | 0.013194383 | 0.023938228 | 2.21464 | M8600_82 | 8,600.82 | Apolipoprotein
c-iii | 8,764.67 | APOC3 |
| M8622_98 | 0.005617767 | 0.014306888 | 1.24828 | M8622_98 | 8,622.98 | Apolipoprotein
c-iii | 8,764.67 | APOC3 |
| M8696_24 | 0.006715009 | 0.016087017 | 2.86633 | M8696_24 | 8,696.24 | Apolipoprotein
c-iii | 8,764.67 | APOC3 |
| M8762_75 |
5.83×10⁻⁶ |
8.94×10⁻⁵ | 2.75E+00 | M8762_75 | 8,762.75 | Apolipoprotein
c-iii | 8,764.67 | APOC3 |
| M8823_58 | 0.003885006 | 0.01098804 | 3.27878 | M8823_58 | 8,823.58 | Apolipoprotein
c-iii | 8,764.67 | APOC3 |
| M8868_31 | 0.008711881 | 0.018837648 | 1.78778 | M8868_31 | 8,868.31 | Apolipoprotein
a-ii | 9,303.65 | APOA2 |
| M9138_93 | 0.011206767 | 0.021602908 | 1.00803 | M9138_93 | 9,138.93 | Apolipoprotein
a-ii | 9,303.65 | APOA2 |
| M9414_68 |
6.18×10⁻⁷ |
2.38×10⁻⁵ | 3.03E+00 | M9414_68 | 9,414.68 | Apolipoprotein
a-ii | 9,303.65 | APOA2 |
| M9440_33 | 0.000329848 | 0.001496086 | 1.70483 | M9440_33 | 9,440.33 | Apolipoprotein
a-ii | 9,303.65 | APOA2 |
| M9633_47 | 7.94
×10−5 | 0.000526668 | 1.14282 | M9633_47 | 9,633.47 | Apolipoprotein
a-ii | 9,303.65 | APOA2 |
| M13886_7 | 0.003533771 | 0.010223786 | 1.13858 | M13886_7 | 13,886.7 | Cystatin-c | 13,347.14 | CST3 |
| M14042_5 | 9.10
×10−5 | 0.000561632 | 1.26247 | M14042_5 | 14,042.5 | Transthyretin | 13,761.41 | TTR |
| Table VI.A-Q, vs. A-H group differences
protein prediction results. |
Table VI.
A-Q, vs. A-H group differences
protein prediction results.
| SAMP_GRP | P-value | q-value | VIP | ID | MZ_SELDI | Predicted
protein | Theoretical MZ | Gene name |
|---|
| M2001_69 | 0.013616562 | 0.299041303 | 1.81131 | M2001_69 | 2001.69 | Amyloid βa4
protein | 1,953.10 | APP |
| M2017_02 | 0.00271225 | 0.220851981 | 2.50106 | M2017_02 | 2017.02 | Amyloid βa4
protein | 1,953.10 | APP |
| M4144_81 | 0.00365448 | 0.220851981 | 1.30244 | M4144_81 | 4144.81 | Plasma protease c1
inhibitor frag | 4,152.87 | SERPING1 |
| M4478_27 | 0.00365448 | 0.220851981 | 2.15012 | M4478_27 | 4478.27 |
α-1-antichymotrypsin, α-1-antichymotrypsin
frag | 4,343.65 | SERPINA3 |
| M4861_39 | 0.048440933 | 0.437642642 | 1.32359 | M4861_39 | 4861.39 | Neurosecretory
protein vgf frag | 4,823.50 | VGF |
| M5642_48 | 0.007295609 | 0.254483755 | 1.30207 | M5642_48 | 5642.48 | Fibrinogen α-chain
frag | 5,904.22 | FGA |
| M7564_68 | 0.012079239 | 0.29154291 | 1.54656 | M7564_68 | 7564.68 | Osteopontin
frag | 7,658.19 | SPP1 |
Discussion
According to previous studies, the pathological
changes of silicosis are the main contributor to pulmonary fibrosis
(7–11). The exact pathogenesis of silicosis
remains to be fully elucidated, however, substantial evidence shows
the involvement of alveolar macrophages, cytokines, Clara cells,
oxidative stress, the immune system of the body, and
SiO2 can lead to the occurrence and development of
silicosis and be important in silicosis (12–17). The
proteins that are differentially expressed in the serum of patients
with silicosis are associated with silicosis (18,19).
There have been no studies reporting on a correlation between
protein expression differences and silicosis-associated
mortality.
SELDI-TOF-MS, through chemical or biological
treatment on the surface of the protein chip, laser desorption
ionization mass spectrometry equipment and artificial intelligence
data analysis processing software comprised of three parts, is a
type of ultramicro, high flux, fully automatic protein screening
technology for blood serum, urine, cell extracts or other samples
directly added for identification (20). The present study used SELDI-TOF-MS to
obtain original data and perform detailed analysis; the main
analytical steps included the following: Data pre-processing,
differences in peak screening, hierarchical cluster analysis, PCA
analysis, construction of a decision tree model, and prediction
based on differences in peaks corresponding to proteins. The
advantages of this method over current diagnostic methods are the
accuracy, speed and low cost of the application clinically
(21).
The small number of patients is a limitation of the
present study, and further investigations are required to
corroborate the preliminary results. In particular, for patients
with similar infectious diseases, it is possible that similar
diseases have a similar pattern of proteins, which should be
included in future investigations. A study demonstrated that there
is no correlation between protein expression differences and
silicosis-associated mortality (22). From the above results, the group of
patients with silicosis pre- and post-foundation treatment and the
normal group showed differences in proteins in serum. Therefore,
patients with silicosis fibrosis and normal healthy individuals
have differences in serum protein expression; in order to further
understand these proteins and improve a simple and feasible method
for the diagnosis of patients with silicosis fibrosis, further
investigations are to be performed for the identification of these
differences in proteins. The aim of the present study was to offer
occupational doctors a novel and alternative diagnostic test. The
novel method, compared with present diagnostic strategies, of the
proposed protein chip requires proper equipment, staff training and
money. In conclusion, the present study identified complement c3
frag, amyloid βa4 protein, hepcidin, fibrinogen α-chain frags,
plasma protease c1 inhibitor frag and SERPING1 are markers for
silicosis.
Acknowledgements
Not applicable.
Funding
The present study was supported by the National
Natural Science Funds (grant no. 81360416).
Availability of data and materials
The datasets used and/or analysis in the present
study are available from the corresponding author on reasonable
request.
Authors' contributions
GL contributed to the conception and design of
the study, literature research and analysis, and manuscript
preparation and review. JU contributed to the design of the study.
CL contributed to the experimental and clinical studies, data
acquisition and analysis, statistical analysis, manuscript
preparation and manuscript review. XZ contributed to the
experimental studies and clinical studies, data acquisition and
analysis, statistical analysis and manuscript preparation. LN
contributed to the experimental and clinical studies and data
acquisition. YW, WWa, XW and WWe contributed to the experimental
studies. YZ, NN and PH contributed to the clinical studies. XL
contributed to the conception of the study, literature research and
manuscript editing and review, and is a guarantor of integrity of
the entire study.
Ethics approval and consent to
participate
This study is approved by the Ethics Committee in
the Fifth Affiliated Clinical Medical College of Xinjiang Medical
University. Signed informed consent was obtained from all
patients.
Patient consent for publication
Not applicable.
Competing interests
The authors declare that they have no competing
interests.
References
|
1
|
Jp NA, Imanaka M and Suganuma N: Japanese
workplace health management in pneumoconiosis prevention. J Occup
Health. 59:91–103. 2017. View Article : Google Scholar : PubMed/NCBI
|
|
2
|
Liu H, Tang Z, Yang Y, Weng D, Sun G, Duan
Z and Chen J: Identification and classification of high risk groups
for coal workers' Pneumoconiosis using an artificial neural network
based on occupational histories: A retrospective cohort study. BMC
Public Health. 9:3662009. View Article : Google Scholar : PubMed/NCBI
|
|
3
|
Fichtner-Feigl S, Fuss IJ, Young CA,
Watanabe T, Geissler EK, Schlitt HJ, Kitani A and Strober W:
Induction of IL-13 triggers TGF-beta1-dependent tissue fibrosis in
chronic 2,4,6-trinitrobenzene sulfonic acid colitis. J Immunol.
178:5859–5870. 2007. View Article : Google Scholar : PubMed/NCBI
|
|
4
|
Mandal AK, Zhang Z, Ray R, Choi MS,
Chowdhury B, Pattabiraman N and Mukherjee AB: Uteroglobin represses
allergen-induced inflammatory response by blockingPGD2
receptor-mediated functions. J Exp Med. 199:1317–1330. 2004.
View Article : Google Scholar : PubMed/NCBI
|
|
5
|
Ernst H, Rittinghausen S, Bartsch W,
Creutzenberg O, Dasenbrock C, Görlitz BD, Hecht M, Kairies U, Muhle
H, Müller M, et al: Pulmonary inflammation in rats after
intratracheal instillation of quartz, amorphous SiO2, carbon black,
and coal dust and the influence of poly-2-vinylpyridine-N-oxide
(PVNO). Exp Toxicol Pathol. 54:109–126. 2002. View Article : Google Scholar : PubMed/NCBI
|
|
6
|
Jiang PR, Cao Z, Qiu ZL, Pan JW, Zhang N
and Wu YF: Plasma levels of TNF-α and MMP-9 in patients with
silicosis. Eur Rev Med Pharmacol Sci. 19:1716–1720. 2015.PubMed/NCBI
|
|
7
|
Lustgarten JL, Kimmel C, Ryberg H and
Hogan W: EPO-KB: A searchable knowledge base of biomarker to
protein links. Bioinformatics. 24:1418–1419. 2008. View Article : Google Scholar : PubMed/NCBI
|
|
8
|
Mahavadi P, Korfei M, Henneke I, Liebisch
G, Schmitz G, Gochuico BR, Markart P, Bellusci S, Seeger W, Ruppert
C and Guenther A: Epithelial stress and apoptosis underlie
Hermansky-Pudlak syndrome-associated interstitial pneumonia. Am J
Respir Crit Care Med. 182:207–219. 2010. View Article : Google Scholar : PubMed/NCBI
|
|
9
|
Carneiro PJ, Clevelario AL, Padilha GA,
Silva JD, Kitoko JZ, Olsen PC, Capelozzi VL, Rocco PR and Cruz FF:
Cruz bosutinib therapy ameliorates lung inflammation and fibrosis
in experimental silicosis. Front Physiol. 8:1592017. View Article : Google Scholar : PubMed/NCBI
|
|
10
|
Liu H, Cheng Y, Yang J, Wang W, Fang S,
Zhang W, Han B, Zhou Z, Yao H, Chao J and Liao H: BBC3 in
macrophages promoted pulmonary fibrosis development through
inducing autophagy during silicosis. Cell Death Dis. 8:e26572017.
View Article : Google Scholar : PubMed/NCBI
|
|
11
|
Chen Y, Li C, Lu Y, Zhuang H, Gu W, Liu B,
Liu F, Sun J, Yan B, Weng D and Chen J: IL-10-Producing CD1d hi
CD5+ regulatory B cells may play a critical role in modulating
immune homeostasis in silicosis patients. Front Immunol. 8:1102017.
View Article : Google Scholar : PubMed/NCBI
|
|
12
|
Bhattacharya S, Dey A, Pal A, Kar S and
Saha S: Silicosis in the form of progressive massive fibrosis: A
diagnostic challenge. Indian J Occup Environ Med. 20:114–117. 2016.
View Article : Google Scholar : PubMed/NCBI
|
|
13
|
Rosengarten D, Fox BD, Fireman E, Blanc
PD, Rusanov V, Fruchter O, Raviv Y, Shtraichman O, Saute M and
Kramer MR: Survival following lung transplantation for artificial
stone silicosis relative to idiopathic pulmonary fibrosis. Am J Ind
Med. 60:248–254. 2017. View Article : Google Scholar : PubMed/NCBI
|
|
14
|
Mouratis MA and Aidinis V: Modeling
pulmonary fibrosis with bleomycin. Curr Opin Pulm Med. 17:355–361.
2011. View Article : Google Scholar : PubMed/NCBI
|
|
15
|
Chiba Y, Kurotani R, Kusakabe T, Miura T,
Link BW, Misawa M and Kimura S: Uteroglobin-related protein 1
expression suppresses allergic airway inflammation in mice. Am J
Respir Crit Care Med. 173:958–964. 2006. View Article : Google Scholar : PubMed/NCBI
|
|
16
|
Liu P, Wang SX, Chen L, Wei MT, Liang XC,
Wang YF and Tu ZG: Changes of Clara cell protein and surfactant
protein-D in serum of patients with silicosis. Zhonghua Lao Dong
Wei Sheng Zhi Ye Bing Za Zhi. 25:18–21. 2007.(In Chinese).
PubMed/NCBI
|
|
17
|
Anlar HG, Bacanli M, İritaş S, Bal C, Kurt
T, Tutkun E, Hinc Yilmaz O and Basaran N: Effects of occupational
silica exposure on OXIDATIVE stress and immune system parameters in
ceramic workers in TURKEY. J Toxicol Environ Health A. 80:688–696.
2017. View Article : Google Scholar : PubMed/NCBI
|
|
18
|
Zhu Z, Yang G, Wang Y, Yang J, Gao A, Niu
P and Tian L: Suppression of thioredoxin system contributes to
silica-induced oxidative stress and pulmonary fibrogenesis in rats.
Toxicol Lett. 222:289–294. 2013. View Article : Google Scholar : PubMed/NCBI
|
|
19
|
Liu H, Fang S, Wang W, Cheng Y, Zhang Y,
Liao H, Yao H and Chao J: Macrophage-derived MCPIP1 mediates
silica-induced pulmonary fibrosis via autophagy. Part Fibre
Toxicol. 13:552016. View Article : Google Scholar : PubMed/NCBI
|
|
20
|
Fang SC, Zhang HT, Wang CY and Zhang YM:
Serum CA125 and NSE: Biomarkers of disease severity in patients
with silicosis. Clin Chim Acta. 433:123–127. 2014. View Article : Google Scholar : PubMed/NCBI
|
|
21
|
Lü GC, Yao JM and Zhang JW: Significance
of detection of serum oxidant function in patients with silicosis.
Zhonghua Lao Dong Wei Sheng Zhi Ye Bing Za Zhi. 28:52–53. 2010.(In
Chinese). PubMed/NCBI
|
|
22
|
Idec-Sadkowska I, Andrzejak R,
Antonowicz-Juchniewicz J and Kaczmarek-Wdowiak B: Trials of casual
treatment of silicosis. Med Pr. 57:271–280. 2006.(In Polish).
PubMed/NCBI
|