Introduction
Staphylococcus aureus, the most common type
of Gram-positive coccus, is an important pathogenic bacterium. It
is widely distributed in the environment and has strong
pathogenicity; it is able to cause a number of common or complex
infectious diseases, including pneumonia, arthritis, urinary tract
infections, osteomyelitis and meningitis. Methicillin-resistant
S. aureus (MRSA) accounts for >55% of all S.
aureus infections in communal and health care-associated
settings (1). With the prevalence of
MRSA infections increasing, its morbidity, mortality and cost of
medical care are increased (2).
Vancomycin, a glycopeptide antibiotic, is the
first-line agent in the treatment of S. aureus strains that
produce penicillinase, particularly for patients infected with MRSA
(3–5). However, vancomycin is almost
exclusively eliminated by the kidneys; therefore, a potentially
serious adverse effect of vancomycin is nephrotoxicity (6,7).
Optimization of vancomycin therapy with therapeutic drug monitoring
(TDM) may improve the treatment efficacy, and avoid nephrotoxicity
and drug resistance (8,9). It has been determined that the superior
effect of vancomycin is highly correlated with the area under the
concentration-time curve (AUC) and the minimum inhibitory
concentration (MIC). However, it is difficult to obtain the AUC in
the clinical setting. Thus, vancomycin serum trough concentrations
may be used as a substitute for AUCs (10). A consensus review published by the
Infectious Diseases Society of America (IDSA) provides
recommendations that serum vancomycin trough concentrations should
always be maintained at >10 mg/l in order to avoid the
development of vancomycin resistance in adult patients, and a
vancomycin serum trough concentration of 15–20 mg/l is recommended
for complicated infections (3).
However, certain studies have indicated that higher vancomycin
trough concentrations (≥15 mg/l) are associated with higher rates
of nephrotoxicity. Furthermore, the results of studies on
vancomycin TDM in China indicate that the dosage of vancomycin is
generally low (11,12). Therefore, there is controversy
regarding the optimal target concentration of vancomycin.
The present study performed a retrospective analysis
in order to investigate the predictive value of vancomycin serum
concentrations regarding the efficacy and nephrotoxicity in
patients in China and to determine a relatively safe optimal target
concentration during vancomycin therapy.
Patients and methods
Study design and patients
Hospitalized patients who received a course of
vancomycin therapy between March 2013 and March 2018 at the
Department of Respiratory Medicine of Shanghai 10th People's
Hospital Affiliated to the Tongji University (Shanghai, China) were
retrospectively reviewed. The inclusion criteria were as follows:
i) Vancomycin therapy for at least 3 days; ii) requirement of TDM
of vancomycin to assess efficacy and toxicity and iii) written
informed consent. The exclusion criteria were as follows: i)
Treatment with vancomycin within 72 h prior to the monitoring
phase; ii) pregnant or breastfeeding women; iii) no availability of
the laboratory data; iv) patients with diseases affecting the
metabolism of vancomycin.
Data collection
The investigators observed the patients daily during
vancomycin therapy until it was discontinued or the patient was
discharged from the hospital, depending on which happened first.
During the observation period, the following demographic
information was collected: Gender, age, weight, height, diagnosis,
the site of the Gram-positive cocci culture, length of
hospitalization and whether the patient had undergone surgery, been
implanted with medical devices or admitted to an intensive care
unit (ICU). The vancomycin trough and peak concentrations were
recorded. Trough concentrations were obtained just prior to the
subsequent dose under steady-state conditions (approximately after
the fourth dose). Peak concentration monitoring was performed 0.5–1
h after the end of the fifth dose. Laboratory values, medical
history and comorbidities, concomitant medications (carbapenems,
cephalosporins, aminoglycosides and quinolones), microbiologic data
and details regarding vancomycin treatment (date, time, dosing
regimen, initial dosing frequency and duration) were noted on a
daily basis.
Definitions
The definition of comprehensive efficacy included
the results of clinical efficacy evaluation and bacteriological
efficacy evaluation as follows: The clinical symptoms and signs, as
well as the radiologic and laboratory tests (including
bacteriology) returned to normal or pre-infection status; and
vancomycin was not required within 7 days after discontinuation of
the drug. In the primary analysis, three definitions of
nephrotoxicity were used: i) An increase in serum creatinine (SCr)
to ≥0.5 mg/dl (44.2 mmol/l); and ii) a 50% increase in SCr; or iii)
a 25% reduction in estimated creatinine clearance (CrCl) from the
baseline level for ≥2 days. Collection of SCr values commenced
prior to the start of vancomycin treatment and continued until 72 h
after the treatment was completed. The CrCl value was estimated
using the Cockcroft-Gault formula (13).
Statistical analysis
Data analysis was performed using SPSS Statistics
software, version 20.0 (IBM Corp., Armonk, NY, USA). For the
univariate analysis, Pearson's Chi-square test or Fisher's exact
test were used to compare categorical variables, and Student's
t-test or the Mann-Whitney U-test were used to compare continuous
variables. Logistic regression analyses were used to identify
predictors of efficacy and nephrotoxicity. Receiver operating
characteristic (ROC) curve analysis was used to determine the
thresholds of the vancomycin trough and peak concentrations for
efficacy and nephrotoxicity, respectively. Values are expressed as
the mean ± standard deviation. For all analyses, P≤0.05 was
considered to indicate a statistically significant difference and
all tests were two-tailed.
Selection of variables for
analysis
In order to select variables for the regression
model with the intent of minimizing multicollinearity, factor
analysis was further performed on all continuous variables to
reduce interaction between variables with orthogonal varimax
rotation (14). Scree plots were
used to describe the importance of the factors, and the number of
components retained in the rotated structure was based on
Jolliffe's criterion that eigenvalues should be >0.70 (15). The results are presented as rotated
factor loadings, and the variables were sorted by factor according
to the highest loading.
Results
Patient characteristics
The patients treated at Shanghai 10th People's
Hospital (Shanghai, China) between March 2013 and March 2018 who
met the inclusion criteria but not the exclusion criteria (n=65)
were retrospectively enrolled in the present study. Among them, 38
were male and 27 were female, and the mean age was 61.9±20.1 years.
Of these patients, 40 were admitted to the ICU. The primary site of
infection was the lungs (80.0%) and the bloodstream (15.0%), while
others accounted for 7.1%. Cardiovascular diseases (53.8%) and
diabetes (24.6%) accounted for a large proportion of the underlying
diseases. The mean vancomycin serum trough concentration and peak
concentration were 13.7±9.1 and 28.2±8.7 mg/l, respectively. The
mean total dosage of vancomycin was 19.5±12.2 g. The demographics
and clinicopathological characteristics of the patients are
presented in Table I.
 | Table I.Demographics and clinicopathological
characteristics of patients in the effective and ineffective
treatment groups. |
Table I.
Demographics and clinicopathological
characteristics of patients in the effective and ineffective
treatment groups.
|
Characteristic/parameter | Total (n=65) | Effective group
(n=43) | Ineffective group
(n=22) | P-value |
|---|
| Males | 38 (58.5) | 26 (60.5) | 12 (54.5) | 0.647 |
| Age (years) | 61.9±20.1 | 60.7±20.1 | 64.2±20.2 | 0.509 |
| BMI
(kg/m2) | 22.5±4.0 | 23.4±3.6 | 20.7±4.2 | 0.010 |
| Baseline laboratory
parameters |
|
|
|
|
| BUN
(mmol/l) | 8.0±5.1 | 6.8±3.5 | 10.3±6.8 | 0.009 |
| Scr
(µmol/l) | 75.2±41.6 | 76.0±40.2 | 74.0±45.2 | 0.854 |
| CrCl
(ml/min) | 96.2±50.8 | 95.6±41.9 | 97.4±66.1 | 0.892 |
| ALT
(U/l) | 34.0±38.4 | 27.8±15.0 | 46.2±61.7 | 0.066 |
| AST
(U/l) | 40.3±35.5 | 33.6±26.0 | 53.7±47.0 | 0.030 |
| WBC
(109/l) | 10.8±5.6 | 10.7±5.7 | 11.0±5.7 | 0.808 |
|
Neutrophils (% in
WBCs) | 80.0±11.1 | 79.7±12.1 | 80.7±9.0 | 0.854 |
|
Lymphocytes (% in
WBCs) | 15.8±9.4 | 16.0±10.0 | 15.5±8.2 | 0.733 |
| Albumin
(g/l) | 30.2±6.3 | 31.7±6.0 | 27.4±6.2 | 0.009 |
| Baseline body
temperature (°C) | 38.0±1.0 | 38.0±1.0 | 38.0±0.9 | 0.856 |
| ICU patients | 40 (61.5) | 23 (53.5) | 17 (77.3) | 0.062 |
| Primary site of
infection |
|
|
| 0.732 |
|
Respiratory tract | 16 (80.0) | 34 (75.6) |
|
|
|
Bloodstream | 3 (15.0) | 6 (13.3) |
|
|
|
Others | 1 (5) | 5 (11.1) |
|
|
| Underlying
disease |
|
|
|
|
|
Cardiovascular | 35 (53.8) | 26 (60.5) | 9 (40.9) | 0.109 |
|
Diabetes | 16 (24.6) | 13 (30.2) | 3 (13.6) | 0.224 |
| Vancomycin
concentration (mg/l) |
|
|
|
|
|
Trough | 13.9±7.1 | 16.3±6.3 | 9.0±6.2 | <0.001 |
| Trough
≤15 | 32 (49.2) | 14 (32.6) | 18 (81.8) | <0.001 |
| Trough
>15 | 33 (50.8) | 29 (67.4) | 4 (18.2) |
|
|
Peak | 28.2±8.7 | 30.4±7.8 | 23.8±8.8 | 0.003 |
| Total vancomycin
dose (g) | 19.7±12.1 | 20.8±12.8 | 17.6±10.3 | 0.313 |
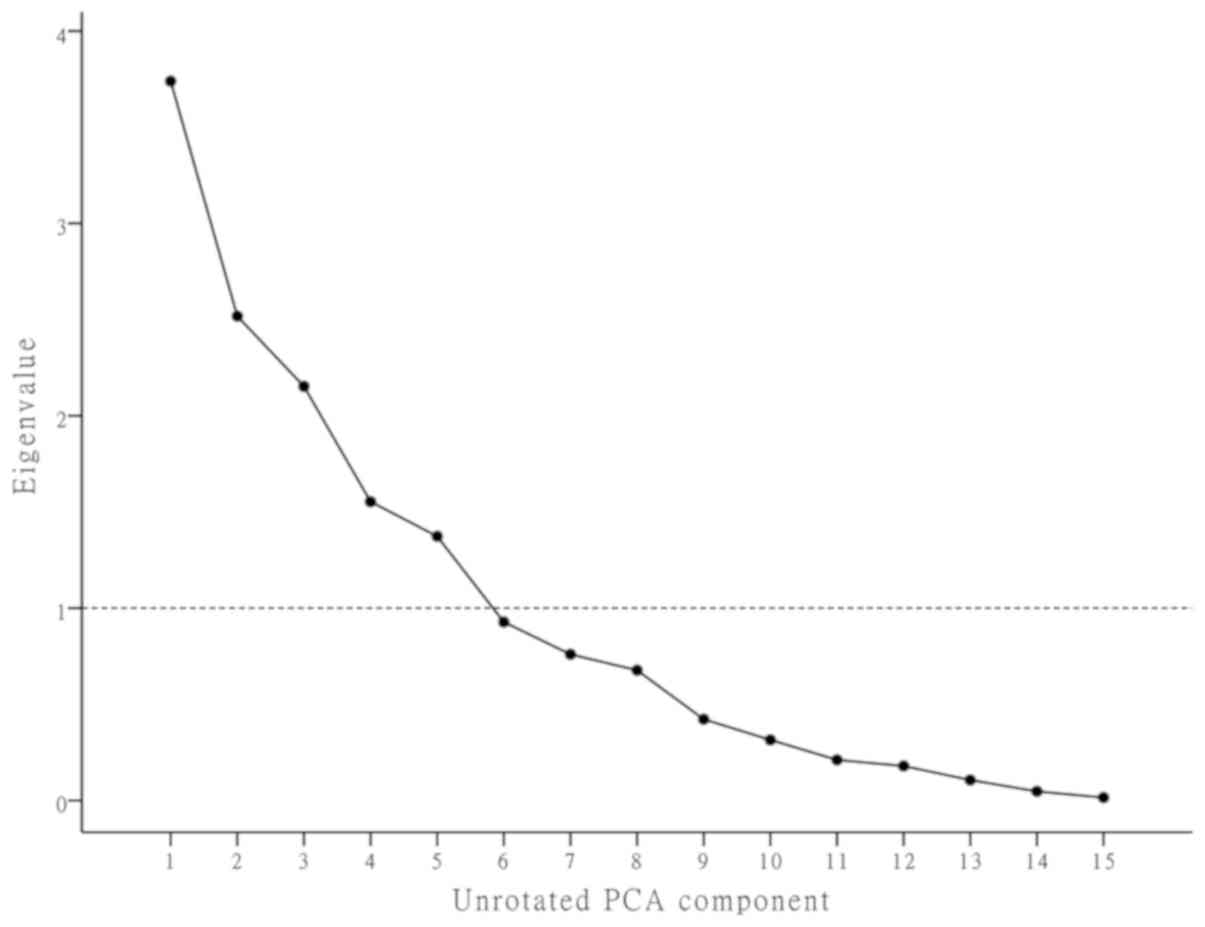
Factor analysis
The first five comprehensive indicators representing
15 continuous variables were loaded by factor analysis with
orthogonal varimax rotation, accounting for 75.7% of the total
information (Table II). The
importance of the factors was determined using scree plots and
sorting of variables according to the largest absolute loading
(Fig. 1). The rotated component
matrix is presented in Table III
and the results were as follows: Factor 1 was associated with
inflammation (the percentage of neutrophils and lymphocytes);
factor 2 was highly associated with the renal function [baseline
blood urea neutrogen (BUN), SCr and CrCl]; factor 3 was mainly
associated with the liver function [baseline alanine
aminotransferase and aspartate transaminase (AST)]; factor 4 was
mainly determined by the vancomycin trough and peak concentrations;
and factor 5 was mostly associated with the nutritional status
[body mass index (BMI) and baseline albumin].
| Table II.Demographics and characteristics
loaded over five factors explaining 75.7% of the information. |
Table II.
Demographics and characteristics
loaded over five factors explaining 75.7% of the information.
| Factor | Variance explained
(%)a | Factors |
|---|
| 1 | 24.9 | Baseline
neutrophils, lymphocytes |
| 2 | 16.8 | Baseline BUN, Scr,
CrCl |
| 3 | 14.4 | Baseline ALT,
AST |
| 4 | 10.4 | Vancomycin trough
concentration, peak concentration |
| 5 | 9.2 | BMI, baseline
albumin |
| Table III.Factor loadings in the total
patients. |
Table III.
Factor loadings in the total
patients.
| Variable | Factor 1 | Factor 2 | Factor 3 | Factor 4 | Factor 5 |
|---|
| Age | −0.546 | 0.058 | −0.512 | 0.262 | −0.289 |
| Vancomycin trough
concentration | −0.041 | 0.093 | −0.051 | 0.893 | 0.121 |
| Vancomycin peak
concentration | 0.065 | −0.005 | −0.200 | 0.869 | −0.013 |
| Baseline BUN | −0.054 | 0.806 | −0.136 | −0.15 | −0.079 |
| Baseline Scr | 0.237 | 0.895 | −0.023 | 0.156 | 0.183 |
| Baseline CrCl | 0.319 | −0.758 | 0.269 | −0.261 | 0.141 |
| BMI | 0.245 | −0.214 | 0.068 | 0.193 | 0.832 |
| Total vancomycin
dose | 0.273 | −0.559 | −0.365 | 0.115 | 0.466 |
| Baseline WBC | −0.162 | 0.285 | −0.142 | −0.337 | 0.557 |
| Baseline
neutrophils | −0.976 | 0.036 | −0.042 | −0.071 | −0.048 |
| Baseline
lymphocytes | 0.956 | −0.047 | 0.015 | 0.028 | 0.085 |
| Baseline ALT | 0.214 | −0.025 | 0.830 | −0.052 | −0.017 |
| Baseline AST | 0.045 | −0.058 | 0.667 | −0.100 | 0.172 |
| Baseline
albumin | 0.109 | −0.001 | 0.519 | 0.120 | 0.700 |
| Baseline body
temperature | −0.263 | −0.220 | 0.593 | −0.094 | −0.159 |
Parameters influencing the efficacy of
vancomycin
Of the 65 eligible patients, vancomycin treatment
was rated to be effective in 43 patients and ineffective in 22
patients. Overall, the effective group and the ineffective group
were similar regarding the majority or clinicopathological and
demographic parameters, but the BMI (P=0.010), baseline BUN
(P=0.009), baseline AST (P=0.030), baseline albumin (P=0.009),
vancomycin trough concentration (P<0.001) and vancomycin peak
concentration (P=0.003) were significantly different between the
effective group and the ineffective group. Stratification of the
patients according to high and low trough concentration indicated
that the frequency of ineffective treatment in the low (trough
concentration, ≤15 mg/l) group (81.8%) was markedly higher than
that in the high (trough concentration, >15 mg/l) group (18.2%).
Analysis with the Chi-squared test indicated a high association
between efficacy and a trough concentration of >15 mg/l
(P<0.001; Table I).
Logistic regression analysis for
efficacy
Logistic regression analysis was performed using the
dimensional data reduced by factor analysis. The results confirmed
that factor 4 [odds ratio (OR)=5.480; 95% confidence interval (CI):
1.734–17.325; P=0.004] and factor 5 (OR=3.164; 95% CI: 1.002–9.987;
P=0.037) were independent influencing factors regarding efficacy.
The other factors were not significantly associated with the
efficacy and were therefore not included in the final model. Hence,
the BMI, baseline albumin, and vancomycin trough and peak
concentrations of the patients were associated with the efficacy of
vancomycin (Table IV).
| Table IV.Logistic regression analyses of
independent influencing factors for efficacy in all subjects
(n=65). |
Table IV.
Logistic regression analyses of
independent influencing factors for efficacy in all subjects
(n=65).
| Factor | OR for
efficacy | 95% CI | P-value |
|---|
| 1 | 1.703 | 0.566–5.127 | 0.344 |
| 2 | 0.566 | 0.253–1.266 | 0.166 |
| 3 | 0.953 | 0.509–1.783 | 0.879 |
| 4 | 5.480 | 1.734–17.325 | 0.004 |
| 5 | 3.164 | 1.002–9.987 | 0.037 |
Parameters influencing the
nephrotoxicity of vancomycin
Among the 65 patients, 20 met the criteria for
nephrotoxicity. The baseline body temperature (P=0.014), total
vancomycin dose (P=0.041), trough concentration (P<0.001) and
peak concentration (P=0.020) exhibited significant differences
between the groups of patients with and without nephrotoxicity. A
significant difference in nephrotoxicity was also noted between the
low and high trough concentration groups (P<0.001). The
incidence of nephrotoxicity was only 15.0% in the low trough
concentration group but 85.0% in the high trough concentration
group (Table V).
| Table V.Comparison of characteristics between
patients with and without nephrotoxicity (total n=65). |
Table V.
Comparison of characteristics between
patients with and without nephrotoxicity (total n=65).
| Characteristic | Nephrotoxicity
group (n=20) | Non-nephrotoxicity
group (n=45) | P-value |
|---|
| Males | 14 (70.0) | 24 (53.3) | 0.208 |
| Age (years) | 66.7±18.1 | 59.8±20.7 | 0.207 |
| BMI
(kg/m2) | 23.0±3.96 | 22.3±4.0 | 0.497 |
| Baseline laboratory
parameters |
|
|
|
| BUN
(mmol/l) | 7.5±3.5 | 8.2±5.7 | 0.607 |
| Scr
(µmol/l) | 80.6±44.8 | 72.9±40.4 | 0.492 |
| CrCl
(ml/min) | 87.5±43.1 | 100.0±53.9 | 0.368 |
| ALT
(U/l) | 36.5±26.7 | 32.9±42.8 | 0.732 |
| AST
(U/l) | 45.4±42.8 | 38.1±32.0 | 0.451 |
| WBC
(109/l) | 12.3±5.0 | 10.1±5.7 | 0.141 |
|
Neutrophils (% in
WBCs) | 80.9±11.6 | 79.6±11.0 | 0.661 |
|
Lymphocytes (% in
WBCs) | 15.5±9.6 | 16.0±9.4 | 0.822 |
| Albumin
(g/l) | 29.8±6.6 | 30.4±6.3 | 0.687 |
| Baseline body
temperature (°C) | 37.6±0.6 | 38.2±1.0 | 0.014 |
| ICU patients | 12 (60.0) | 28 (62.2) | 0.865 |
| Primary site of
infection |
|
| 0.732 |
|
Respiratory tract | 16 (80.0) | 34 (75.6) |
|
|
Bloodstream | 3 (15.0) | 6 (13.3) |
|
|
Others | 1 (5.0) | 5 (11.1) |
|
| Initial
anti-infective treatment |
|
|
|
|
Carbapenems | 8 (40.0) | 10 (22.2) | 0.139 |
|
Cephalosporins | 3 (15.0) | 11 (24.4) | 0.393 |
| Underlying
disease |
|
|
|
|
Cardiovascular | 14 (70.0) | 21 (46.7) | 0.082 |
|
Diabetes | 9 (45.0) | 7 (15.6) | 0.011 |
| Vancomycin
concentration (mg/l) |
|
|
|
|
Trough | 18.2±7.0 | 12.0±6.3 | 0.001 |
| Trough
≤15 | 3 (15.0) | 29 (64.4) | <0.001 |
| Trough
>15 | 17 (85.0) | 16 (35.6) |
|
|
Peak | 32.0±8.8 | 26.6±8.3 | 0.020 |
| Total vancomycin
dose (g) | 24.3±14.1 | 17.7±10.6 | 0.041 |
Logistic regression analysis for
nephrotoxicity
Logistic regression analysis for nephrotoxicity
identified a significant association between nephrotoxicity and
factor 4 (OR=2.388; 95% CI: 1.164–4.899; Table VI). Hence, higher initial trough and
peak concentrations during vancomycin therapy bear a higher risk
regarding the incidence of nephrotoxicity.
| Table VI.Logistic regression analyses of
independent risk factors for nephrotoxicity in the cohort
(n=65). |
Table VI.
Logistic regression analyses of
independent risk factors for nephrotoxicity in the cohort
(n=65).
| Factor | OR for
nephrotoxicity | 95% CI | P-value |
|---|
| 1 | 0.836 | 0.446–1.567 | 0.577 |
| 2 | 0.902 | 0.428–1.902 | 0.787 |
| 3 | 0.290 | 0.088–0.102 | 0.051 |
| 4 | 2.388 | 1.164–4.899 | 0.018 |
| 5 | 1.759 | 0.863–3.582 | 0.120 |
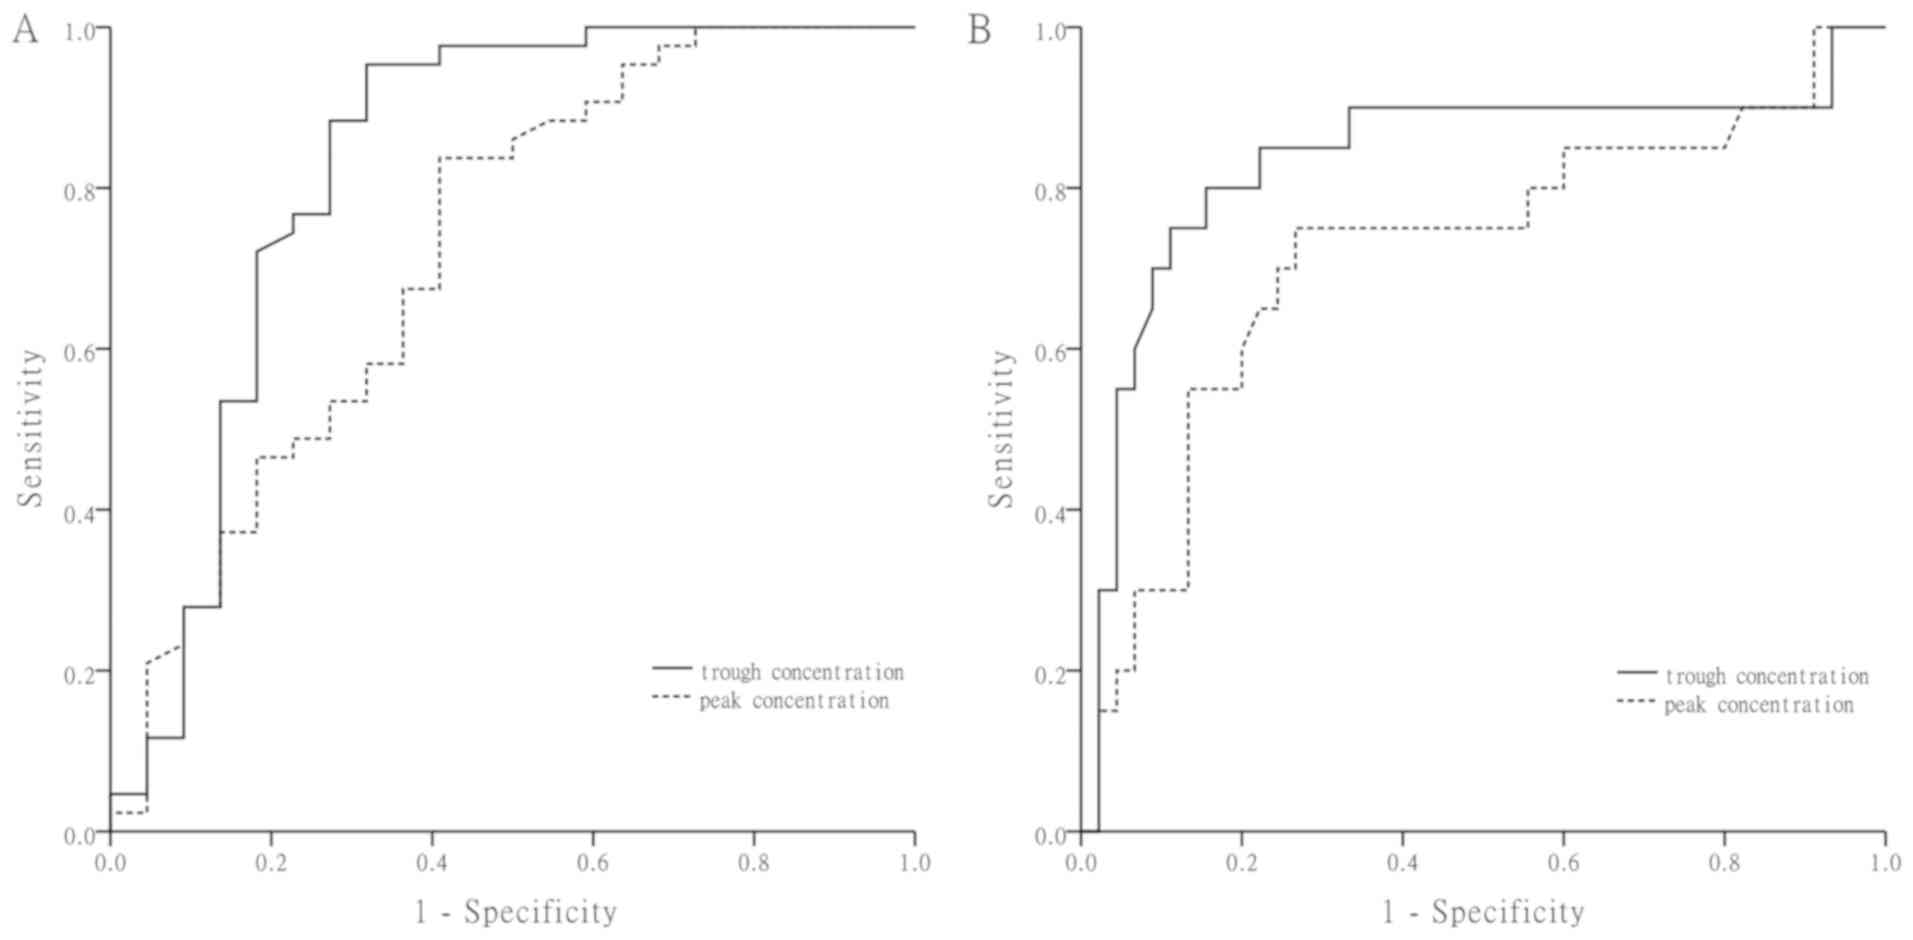
Prediction of the thresholds of
vancomycin concentrations for efficacy
Fig. 2A presents ROC
curves in which the vancomycin trough and peak concentrations were
used as variables to predict the efficacy. The AUCs of the trough
concentration and the peak concentration were 0.83 and 0.72,
respectively. The critical values of the trough concentration and
peak concentration were 9.02 mg/l (95.3% sensitivity and 68.2%
specificity) and 23.62 mg/l (83.7% sensitivity and 59.1%
specificity), respectively.
Prediction of the thresholds of
vancomycin concentrations for nephrotoxicity
Fig. 2B presents the
ROC curves for nephrotoxicity associated with the vancomycin trough
and peak concentrations. The AUCs were 0.83 and 0.71 for the trough
and peak concentration, respectively. The threshold vancomycin
trough and peak concentrations for the development of
nephrotoxicity were 16.08 mg/l (77.8% sensitivity and 84.2%
specificity) and 30.42 mg/l (72.2% sensitivity and 76.3%
specificity), respectively.
Based on the above results, a trough concentration
between 9.02 and 16.08 mg/l and a peak concentration between 23.62
and 30.42 mg/l may be considered relatively safe, as these
concentrations are not only effective but are also unlikely to
induce nephrotoxicity.
Discussion
The present study investigated the predictive value
of vancomycin serum concentrations regarding the drug's efficacy
and nephrotoxicity. The results demonstrated that the differences
in the trough concentration and peak concentration were
statistically significant between the effective and ineffective
groups, as well as between the nephrotoxicity and the
non-nephrotoxicity groups. Furthermore, the critical values for the
vancomycin serum concentration to achieve acceptable rates of
efficacy and nephrotoxicity were identified.
Vancomycin was developed and approved in the 1950s
for the treatment of infections with Gram-positive bacteria
(16). Regarding the
pharmacokinetics, >90% of vancomycin is eliminated by the
kidneys, and only 5–8.5% of vancomycin may be metabolized through
hepatic conjugation (17). Renal
elimination of vancomycin mostly occurs through glomerular
filtration and to a certain extent through active tubular secretion
(18). Dieterich et al
(19) reported that vancomycin
accumulates in proximal tubular cells, leading to cell necrosis as
a mechanism of nephrotoxicity. Nishino et al (20) and Oktem et al (21) suggested that oxidative stress and
mitochondrial damage may contribute to vancomycin-associated renal
injury. In addition to tubulointerstitial nephritis, severe
vancomycin-induced nephrotoxicity may histologically manifest as
granulomas in certain cases (22).
The incidence of nephrotoxicity exhibits a wide variation and
ranges from 5 to >35% among various studies (23,24).
Therefore, the IDSA recommends that TDM is necessary to increase
the rate of clinical efficacy and reduce the rate of nephrotoxicity
during vancomycin therapy (3).
The bactericidal activity of vancomycin is thought
to be time-dependent; therefore, it does not appear necessary to
monitor peak concentrations. Suzuki et al (25) reported that it is not necessary to
use peak concentrations of vancomycin in TDM, as the trough
concentration/MIC and trough concentration ratio is sufficient to
predict the efficacy and safety of vancomycin. However, there is
support for a degree of concentration-dependent mortality
associated with vancomycin (2).
Iwamoto et al (26) indicated
that monitoring of the peak concentration is essential for
achieving an optimum clinical efficacy during vancomycin therapy,
and a peak concentration of >25 mg/ml may be more effective than
peak concentrations ≤25 mg/ml. In order to further elucidate the
matter, the present study combined peak and trough concentrations
during TDM to evaluate the efficacy and nephrotoxicity of
vancomycin.
At present, the target vancomycin trough
concentration for the optimum efficacy remains controversial. Chen
et al (12) identified that
the cut-off values of the first trough concentration were 7.9 mg/l
for clinical efficacy and 21.1 mg/l for nephrotoxicity in Chinese
patients. However, the IDSA provides recommendations that
vancomycin trough concentrations should be maintained between 10
and 20 mg/l in order to avoid resistance and nephrotoxicity
(3). In the present study, 80
samples from 65 patients were analyzed and only 58.0% were within
the aforementioned range. The critical values for the trough
concentration and peak concentration regarding efficacy were 9.02
and 23.62 mg/l, respectively. The results demonstrate that the
trough concentration together with the peak concentration provides
a better assessment of the clinical efficacy of vancomycin than a
trough concentration alone. In addition, it was identified that the
BMI and albumin levels of the patients were associated with
efficacy. Patients with poor nutrition may have serious infections,
and normal doses of vancomycin may therefore not be effective.
It is well known that vancomycin has a significant
nephrotoxicity; however, it remains elusive to what extent the
vancomycin serum concentration is associated with nephrotoxicity.
It has been demonstrated that an initial trough concentration of
vancomycin of ≥15 mg/l and a duration of therapy of ≥14 days are
independent risk factors associated with higher rates of
nephrotoxicity (27–29). A retrospective study including 1,269
cases reported that trough concentrations of >12.1 mg/l were a
major risk factor for vancomycin-induced nephrotoxicity (30). In the present study, the threshold
vancomycin trough and peak concentrations for nephrotoxicity were
determined to be 16.08 and 30.42 mg/l, respectively. This result is
slightly higher, but similar with that of previous studies, in
terms of vancomycin trough concentrations increasing the efficacy
and increasing the risk of nephrotoxicity.
Of note, the present study has a number of
limitations. First, it was a single-center retrospective study with
a small sample size. Furthermore, the patients treated with
vancomycin generally had a variety of underlying conditions, but
there was no homogeneity. In addition, the possibility of data
observation bias cannot be excluded. In the future, studies using a
larger sample and with more detailed stratification are required in
order to identify the associations between serum vancomycin
concentrations, efficacy and nephrotoxicity.
In conclusion, the present study provides evidence
that vancomycin trough and peak concentrations are associated with
the efficacy and incidence of nephrotoxicity of patients receiving
vancomycin therapy. A trough concentration between 9.02 and 16.08
mg/l is relatively safe, and the relatively safe range for the peak
concentration was from 23.62–30.42 mg/l. These results may provide
useful information to guide the development of individualized
vancomycin therapy.
Acknowledgements
The authors would like to thank Mr Zhang and Mr Tan
at the Department of Respiratory Medicine of Shanghai 10th People's
Hospital (Shanghai, China). The authors would also like to
recognize and Mr Yuan at the Department of Laboratory Medicine of
Shanghai 10th People's Hospital (Shanghai, China) who participated
in the data collection for their cooperation and support. The
authors are also grateful to Mr Liang at the Institute of
Antibiotics of Huashan Hospital, Fudan University (Shanghai, China)
for providing technical support.
Funding
This work was supported by the National Natural
Science Foundation of China (grant no. 81472180). The funders had
no role in the study design, data collection and analysis, decision
to publish or preparation of the manuscript.
Availability of data and materials
The datasets used and/or analyzed during the present
study are available from the corresponding author on reasonable
request.
Authors' contributions
CHW and XLS conceived and designed the study, and
critically revised the manuscript. LPW analyzed the data,
interpreted the results and wrote the first draft of the
manuscript. QY collected the clinical and laboratory data. MT and
SSX were responsible for analysis of data and interpretation of
results, as well as critical revision of the manuscript for
important intellectual content. MT and SSX also approved the
publication of the final manuscript. JFW was involved in detecting
the vancomycin trough and peak concentrations. All authors read and
approved the final manuscript.
Ethics approval and consent to
participate
The study was approved by the Institutional Ethics
Committee of the Shanghai Tenth People's Hospital of Tongji
University.
Patient consent for publication
All the enrolled subjects gave informed consent for
the present study.
Competing interests
The authors have declare that they have no competing
interests.
References
|
1
|
National Nosocomial Infections
Surveillance System: National Nosocomial Infections Surveillance
(NNIS) System report, data summary from January 1992 through June
2004, issued October 2004. Am J Infect Control. 32:470–485. 2004.
View Article : Google Scholar : PubMed/NCBI
|
|
2
|
Haque NZ, Zuniga LC, Peyrani P, Reyes K,
Lamerato L, Moore CL, Patel S, Allen M, Peterson E, Wiemken T, et
al: Relationship of vancomycin minimum inhibitory concentration to
mortality in patients with methicillin-resistant Staphylococcus
aureus hospital-acquired, ventilator-associated, or
health-care-associated pneumonia. Chest. 138:1356–1362. 2010.
View Article : Google Scholar : PubMed/NCBI
|
|
3
|
Martin JH, Norris R, Barras M, Roberts J,
Morris R, Doogue M and Jones RD G: Therapeutic monitoring of
vancomycinin adult patients: A consensus review of the American
society of health-system pharmacists, the infectious diseases
society of America, and the society of infectious diseases
pharmacists. Clin Biochem Rev. 31:21–24. 2010.PubMed/NCBI
|
|
4
|
Moellering RC Jr: Vancomycin: A 50-year
reassessment. Clin Infect Dis. 42 Suppl 1:S3–S4. 2006. View Article : Google Scholar : PubMed/NCBI
|
|
5
|
Stevens DL: The role of vancomycin in the
treatment paradigm. Clin Infect Dis. 42 Suppl 1:S51–S57. 2006.
View Article : Google Scholar : PubMed/NCBI
|
|
6
|
Shah-Khan F, Scheetz MH and Ghossein C:
Biopsy-proven acute tubular necrosis due to vancomycin toxicity.
Int J Nephrol. 2011:4368562001.
|
|
7
|
Htike NL, Santoro J, Gilbert B, Elfenbein
IB and Teehan G: Biopsy-proven vancomycin-associated interstitial
nephritis and acute tubular necrosis. Clin Exp Nephrol. 16:320–324.
2012. View Article : Google Scholar : PubMed/NCBI
|
|
8
|
Matsumoto K, Takesue Y, Ohmagari N,
Mochizuki T, Mikamo H, Seki M, Takakura S, Tokimatsu I, Takahashi
Y, Kasahara K, et al: Practice guidelines for therapeutic drug
monitoring of vancomycin: A consensus review of the Japanese
society of chemotherapy and the Japanese society of therapeutic
drug monitoring. J Infect Chemother. 19:365–380. 2013. View Article : Google Scholar : PubMed/NCBI
|
|
9
|
Rybak M, Lomaestro B, Rotschafer JC,
Moellering R Jr, Craig W, Billeter M, Dalovisio JR and Levine DP:
Therapeutic monitoring of vancomycin in adult patients: A consensus
review of the American society of health-system pharmacists, the
infectious diseases society of America, and the society of
infectious diseases pharmacists. Am J Health Syst Pharm. 66:82–98.
2009. View Article : Google Scholar : PubMed/NCBI
|
|
10
|
Sakoulas G, Moise-Broder PA, Schentag J,
Forrest A, Moellering RC Jr and Eliopoulos GM: Relationship of MIC
and bactericidal activity to efficacy of vancomycin for treatment
of methicillin-resistant Staphylococcus aureus bacteremia. J Clin
Microbiol. 42:2398–2402. 2004. View Article : Google Scholar : PubMed/NCBI
|
|
11
|
Xin HW, Tong HY, Dong QR, Li Q, Wu XC, Yu
AR, Xiong L and Li WL: Monitoring of blood concentration and
individualized administration of vancomycin and norvancomycin in
207 cases. Chin J Pharmacoepidemiol. 21:166–169. 2012.(In
Chinese).
|
|
12
|
Chen CY, Zhu SY, Zhou KT, Zhao YY and Xu
P: Retrospective analysis of nephrotoxicity and efficacy of
vancomycin trough concentrations in patients with severe pneumonia.
Chin J Mod Appl Pharm Pharm Mod Appl Pharm. 33:1188–1194. 2016.(In
Chinese).
|
|
13
|
Cockcroft DW and Gault MH: Prediction of
creatinine clearance from serum creatinine. Nephron. 16:31–41.
1976. View Article : Google Scholar : PubMed/NCBI
|
|
14
|
Galbraith JI, Moustaki I, Bartholomew DJ
and Steele F: The analysis and interpretation of multivariate data
for social scientists. Chapman and Hall/CRC. 56:2802002.
|
|
15
|
Jolliffe IT: Principal Component Analysis.
Springer. (New York, NY). 1986. View Article : Google Scholar
|
|
16
|
Levine DP: Vancomycin: A history. Clin
Infect Dis. 42 Suppl 1:S5–S12. 2006. View
Article : Google Scholar : PubMed/NCBI
|
|
17
|
Matzke GR, Zhanel GG and Guay DR: Clinical
pharmacokinetics of vancomycin. Clin Pharmacokinet. 11:257–282.
1986. View Article : Google Scholar : PubMed/NCBI
|
|
18
|
Nakamura T, Takano M, Yasuhara M and Inui
K: In-vivo clearance study of vancomycin in rats. J Pharm
Pharmacol. 48:1197–1200. 1996. View Article : Google Scholar : PubMed/NCBI
|
|
19
|
Dieterich C, Puey A, Lin S, Swezey R,
Furimsky A, Fairchild D, Mirsalis JC and Ng HH: Gene expression
analysis reveals new possible mechanisms of vancomycin-induced
nephrotoxicity and identifies gene markers candidates. Toxicol Sci.
107:258–269. 2009. View Article : Google Scholar : PubMed/NCBI
|
|
20
|
Nishino Y, Takemura S, Minamiyama Y,
Hirohashi K, Ogino T, Inoue M, Okada S and Kinoshita H: Targeting
superoxide dismutase to renal proximal tubule cells attenuates
vancomycin-induced nephrotoxicity in rats. Free Radic Res.
37:373–379. 2003. View Article : Google Scholar : PubMed/NCBI
|
|
21
|
Oktem F, Arslan MK, Ozguner F, Candir O,
Yilmaz HR, Ciris M and Uz E: In vivo evidences suggesting the role
of oxidative stress in pathogenesis of vancomycin-induced
nephrotoxicity: Protection by erdosteine. Toxicology. 215:227–233.
2005. View Article : Google Scholar : PubMed/NCBI
|
|
22
|
Hong S, Valderrama E, Mattana J, Shah HH,
Wagner JD, Esposito M and Singhal PC: Vancomycin-induced acute
granulomatous interstitial nephritis: Therapeutic options. Am J Med
Sci. 334:296–300. 2007. View Article : Google Scholar : PubMed/NCBI
|
|
23
|
Lodise TP, Patel N, Lomaestro BM, Rodvold
KA and Drusano GL: Relationship between initial vancomycin
concentration-time profile and nephrotoxicity among hospitalized
patients. Clin Infect Dis. 49:507–514. 2009. View Article : Google Scholar : PubMed/NCBI
|
|
24
|
Wong-Beringer A, Joo J, Tse E and Beringer
P: Vancomycin-associated nephrotoxicity: A critical appraisal of
risk with high-dose therapy. Int J Antimicrob Agents. 37:95–101.
2011. View Article : Google Scholar : PubMed/NCBI
|
|
25
|
Suzuki Y, Kawasaki K, Sato Y, Tokimatsu I,
Itoh H, Hiramatsu K, Takeyama M and Kadota J: Is peak concentration
needed in therapeutic drug monitoring of vancomycin? A
pharmacokinetic-pharmacodynamic analysis in patients with
methicillin-resistant staphylococcus aureus pneumonia.
Chemotherapy. 58:308–312. 2012. View Article : Google Scholar : PubMed/NCBI
|
|
26
|
Iwamoto T, Kagawa Y and Kojima M: Clinical
efficacy of therapeutic drug monitoring in patients receiving
vancomycin. Biol Pharm Bull. 26:876–879. 2003. View Article : Google Scholar : PubMed/NCBI
|
|
27
|
Jeffres MN, Isakow W, Doherty JA, Micek ST
and Kollef MH: A retrospective analysis of possible renal toxicity
associated with vancomycin in patients with health care-associated
methicillin-resistant Staphylococcus aureus pneumonia. Clin Ther.
29:1107–1115. 2007. View Article : Google Scholar : PubMed/NCBI
|
|
28
|
Bosso JA, Nappi J, Rudisill C, Wellein M,
Bookstaver PB, Swindler J and Mauldin PD: Relationship between
vancomycin trough concentrations and nephrotoxicity: A prospective
multicenter trial. Antimicrob Agents Chemother. 55:5475–5479. 2011.
View Article : Google Scholar : PubMed/NCBI
|
|
29
|
Liu Y, Yin Y, Liu XZ, Yao HJ, Li LX, Chen
JH, Chen T, Lu XT, Bu SH and Zhang J: Retrospective analysis of
vancomycin nephrotoxicity in elderly chinese patients.
Pharmacology. 95:279–284. 2015. View Article : Google Scholar : PubMed/NCBI
|
|
30
|
Han HK, An H, Shin KH, Shin D, Lee SH, Kim
JH, Cho SH, Kang HR, Jang IJ, Yu KS and Lim KS: Trough
concentration over 12.1 mg/l is a major risk factor of
vancomycin-related nephrotoxicity in patients with therapeutic drug
monitoring. Ther Drug Monit. 36:606–611. 2014. View Article : Google Scholar : PubMed/NCBI
|