Introduction
At present, bariatric surgery is the only method
available to treat obesity and associated comorbidities with
lasting efficacy (1). Compared with
non-surgical interventions, bariatric surgery achieves a greater
improvement with regard to weight loss outcomes and
obesity-associated comorbidities, including type 2 diabetes
mellitus (T2DM), hypertension and hyperlipemia (2). Sleeve gastrectomy (SG) and Roux-en-Y
gastric bypass (RYGB) are the two most common procedures used to
treat obesity worldwide (3). SG is a
restrictive and technically less complex procedure than RYGB, which
is a procedure that involves a restrictive and malabsorptive
mechanism (4). The potential
mechanisms underlying the excellent outcomes of bariatric surgery
include the following: Restriction of dietary intake and
nutritional supply (5), modulation
of gut hormones (6) and alterations
of inflammatory factors (7).
Disorders of gut microbiota are associated with
numerous diseases (8–10). Indeed, studies have demonstrated
different patterns of gut microbiota among healthy volunteers,
obese patients and T2DM patients (11,12). In
recent years, modulation of gut microbiota has been deemed another
important mechanism underlying the exceptional outcomes of
bariatric surgery (13). Tremaroli
et al (14) separately
colonized germ-free mice with stool from patients after bariatric
surgery and obese controls. They observed a 26–43% elevation of fat
deposition of mice colonized with stools from obese controls 9.4
years following bariatric surgery, and they concluded that the
changes in the gut microbiota may be one of the factors responsible
for the excellent outcomes of bariatric surgery (14). Few studies have explored the
alterations of the gut microbiota after bariatric surgery, and the
populations used in these studies were too small, and the results
contained high heterogeneity (14–16). For
this reason, the present study performed a similar analysis of the
effect of bariatric surgery on the gut microbiota with the aim of
complementing the previously reported data.
Patients and methods
Patient inclusion and exclusion
A total of 20 healthy volunteers and 26 obese
patients with or without T2DM [19 patients receiving SG and 7
patients receiving RYGB] were recruited for the present study from
August 2017 to May 2018 at Beijing Tiantan Hospital. The healthy
volunteers were age and sex matched with the obese patients
intending to receive SG. At three months after bariatric surgery, a
follow-up examination was performed and the stool was collected
from 8 patients receiving SG and 3 patients receiving RYGB. All
patients and healthy volunteers provided written informed consent
and the present study was approved by the ethics committee of
Bejing Tiantan Hospital (Beijing, China). The patient selection
criteria for RYGB were as follows: i) Patients were adults, with an
age ranging from 18 to 65 years; ii) patients had relatively severe
T2DM (duration of T2DM, ≥2 years and T2DM requiring insulin
treatment); and iii) the patient's desire to receive RYGB. The
inclusion criteria for SG were as follows: i) Patients were adults,
with the age ranging from 18 to 65 years; ii) patients had
relatively minor T2DM (duration of T2DM, <2 years or T2DM
requiring anti-diabetic or dietary therapy); and iii) patients had
a body mass index (BMI) of >28 kg/m2. For the healthy
volunteers, the inclusion criteria were as follows: i) Volunteers
were adults, with the age ranging from 18 to 65 years; ii) a BMI
ranging from 18 to 24 kg/m2; iii) no T2DM. The following
exclusion criteria were applied to all patients and healthy
volunteers: i) Antibiotic use within the previous 3 months; ii)
pregnancy or the intention of conceiving; iii) previous
gastrointestinal surgery; iv) serious mental disease; v) diarrhea
within the previous month; vi) use of proton pump inhibitors within
the previous month; vii) alcohol use of >25 g/day; viii) special
dietary habits.
Surgical procedures
RYGB
First, the gastric pouch was created with a volume
of ~20 ml and the jejunum was then transected 100 cm below the
ligament of Treitz. Subsequently, 100 cm of the Roux limb was
anastomosed to the gastric pouch (antecolic gastrojejunostomy), and
100 cm of the biliopancreatic limb was subsequently anastomosed in
an end-to-side fashion to the distal Roux limb.
SG. A 36Fr orogastric bougie was passed through the
anterior wall of the stomach and then cut. The lesser curvature was
closed 5–6 cm away from the pylorus towards the cardia with a
linear cut stapler.
Stool sample collection and
grouping
In total, 57 stool samples were collected from the
20 healthy volunteers and 26 patients at 3 days pre-operatively,
and from 11 patients at 3 months post-operatively. The 57 samples
were divided into 5 groups as follows: Control group (CO, n=20),
patients prior to SG (SG0, n=19), patients prior to RYGB (RYGB0,
n=7), patients after SG (SG3, n=8) and patients after RYGB (RYGB3,
n=3). These patients who were lost to follow up following bariatric
surgery could not be paired prior to and following surgery, while
those patients who were followed up successfully could be. This
meant that patients were not strictly paired between SG0 and SG3 or
between RYGB0 and RYGB3. The stool samples were self-collected in
sterile stool containers and within 2 h, they were stored at −80°C
until DNA extraction.
Sequencing
Extraction of genomic DNA
Total genomic DNA was extracted from the samples
using the cetyl trimethylammonium bromide method (17). DNA concentration and purity were
assessed on 1% agarose gels. According to the concentration in the
extract, the DNA was diluted to 1 ng/µl using sterile water.
Amplicon generation
Distinct regions of 16S ribosomal RNA gene (16S V4)
were amplified using a specific primer pair (515 forward,
5′-GTGCCAGCMGCCGCGGTAA-3′; 806 reverse, 5′-GGACTACHVGGGTWTCTAAT-3′;
M, H and V represent degenerate bases) with the barcode. All PCRs
were performed with Phusion® High-Fidelity PCR Master
Mix (New England BioLabs, Inc., Ipswich, MA, USA) according to the
manufacturer's protocol. The Bio-rad T100 PCR apparatus was
utilized (Bio-Rad Laboratories, Inc., Hercules, CA, USA).
PCR product mixing and
purification
The PCR products were mixed with the same volume of
1X loading buffer (Thermo Fisher Scientific, Inc., Waltham, MA,
USA; containing SYBR green) and subjected to electrophoresis in a
2% agarose gel for detection. PCR products from various samples
were mixed at equal amounts to ensure the evenness of products
between samples. Subsequently, the mixtures of PCR products were
purified with a GeneJETTM Gel Extraction kit (Thermo Fisher
Scientific, Inc.).
Library preparation and
sequencing
Sequencing libraries were generated using an Ion
Plus Fragment Library kit 48 rxns (Thermo Fisher Scientific, Inc.)
according to the manufacturer's protocols. The library quality was
assessed using a Qubit® 2.0 Fluorometer (Thermo Fisher
Scientific, Inc.). Finally, the library was sequenced on the Ion
S5™ XL platform (Thermo Fisher Scientific, Inc.) and 400/600-bp
single-end reads were generated.
Data analysis
Quality control of single-end
reads
Single-end reads were assigned to samples based on
their unique barcode and were truncated by removing the barcode and
primer sequences. Quality filtering on raw reads was performed
under specific filtering conditions to obtain high-quality clean
reads according to the Cutadapt quality control process (18). The reads were compared with a
reference database (19) using the
UCHIME algorithm (20) to detect
chimeric sequences, which were then removed (21). Ultimately, clean reads were
obtained.
Operational taxonomic units (OTU)
cluster and species annotation
Sequence analyses were performed using Uparse
software (Version 7.0.1001) (22).
Sequences with ≥97% similarity were considered to be identical OTUs
and deemed to be of one certain species. Representative sequences
for each OTU were screened for further annotations. For each
representative sequence, the Silva Database (19) was used based on the Mothur algorithm
to annotate taxonomic information. To explore the phylogenetic
association of different OTUs, as well as the differences in the
dominant species in different samples (groups), multiple sequence
alignments were performed using MUSCLE software version 3.8.31
(23). The abundance information of
the OTUs was normalized according to a standard sequence number
corresponding to the sample with the fewest sequences. Subsequent
analyses of α diversity and β diversity were all performed based on
this output normalized data.
α diversity
α diversity is applied when analyzing the complexity
of species diversity for a sample through 6 indices, including
Observed-species (http://scikit-bio.org/docs/latest/generated/generated/skbio.diversity.alpha.observed_otus.html?highlight=observed#skbio.diversity.alpha.observed_otus),
Chao1 (http://www.mothur.org/wiki/Chao), Shannon (http://www.mothur.org/wiki/Shannon),
abundance-based coverage estimator (ACE) (http://www.mothur.org/wiki/Ace), Good-coverage
(https://en.wikipedia.org/wiki/Coverage_(genetics)) and
phylogenetic diversity (PD)_whole_tree (http://scikit-bio.org/docs/latest/generated/generated/skbio.diversity.alpha.faith_pd.html?highlight=pd#skbio.diversity.alpha.faith_pd).
All indices in the present samples were calculated with QIIME
(version 1.7.0; http://qiime.org/) and displayed with R
software (version 2.15.3). The rarefaction curves were generated by
using the ggplot2 package for R.
Characteristics of each of the indices
used
Observed-species is a common index reflecting the
variety of species in one sample. Chao1 includes the low-abundance
species in the formula, so this index is able to better reflect the
existence of low-abundance species. Shannon's diversity index not
only reflects the variety of species but also takes into account
the abundance of each species. The ACE index not only reflects the
variety of species but also considers the probability that one
species exists in one certain sample. The PD_whole_tree index
reflects the genetic similarity between species, and further
genetic associations between species in a sample indicate a higher
PD_whole_tree index. In other words, the evolutionary distance
between species in a sample is further and the PD_whole_tree index
is higher.
β diversity
β diversity, on weighted and unweighted unifrac, was
calculated with QIIME software (version 1.7.0). The β diversity
reflects the compositional difference between samples in one
certain group. Weighted unifrac includes abundance and variety of
species in the process of calculation, while unweighted unifrac
includes only variety. Non-metric multidimensional scaling (NMDS)
analysis was performed using the vegan package for R. The linear
discriminant analysis effect size (LEfSe) with default parameters
was used to identify species with significant differences between
groups (24). The statistical method
applied using LEfSe software (version 1.0 http://huttenhower.sph.harvard.edu/galaxy/) was the
Kruskal-Wallis test. In order to identify those microbes with
beneficial or harmful effects on surgical outcomes, a spearman
correlation analysis was performed between species and clinical
indexes by using the psych package for R. Spearman correlation
analysis was used in all experimental groups (SG0, SG3, RYGB0 and
RYGB3). The control group was not included in spearman correlation
analysis due to the absence of clinical data, including GHb and
Glu. P<0.05 was considered to indicate statistical
significance.
Data analysis of clinical
characteristics
The data analysis of clinical characteristics was
performed using SPSS 24.0 software (IBM Corp., Armonk, NY, USA).
Continuous data was compared using an unpaired t-test (2 groups) or
one-way ANOVA (multiple groups) followed by an LSD post-hoc test.
Categorical data was compared using a Fischer's exact test.
Results
Clinical characteristics of the study
population
The clinical characteristics of the 5 groups are
presented in Table I. The results
indicated favorable BMI reduction and T2DM remission of SG and
RYGB. The results revealed a markedly lower BMI, T2DM rate and GHb
in the SG3 group compared with the SG0 group (P<0.05). However,
due to the small sample size, no statistically significant
differences were observed in BMI, T2DM rate, GHb and Glu between
the RYGB0 group and the RYGB3 group. In the SG0 group, 14 of the 19
patients included had T2DM. At 3 months following SG, only 8
patients were available for follow-up, 4 of which exhibited
pre-operative T2DM, with all of them achieving complete T2DM
remission (complete remission rate, 100%). In the RYGB0 group, 7
patients had T2DM. At 3 months following RYGB, only 3 patients were
available for follow-up, and of these, 1 achieved complete T2DM
remission, while the other 2 patients achieved partial T2DM
remission (complete remission rate, 33%). In general, obese
patients with a lower BMI, an older age and a more severe T2DM tend
to be selected to perform RYGB. As for SG, obese patients with a
higher BMI, younger age and relatively less severe T2DM tended to
be selected. The relatively lower BMI, older age and more severe
T2DM in the RYGB0 group compared with the SG0 group is indicated in
Table I. The indexes for determining
the severity of T2DM were not the results of glucose and insulin
tests, but the duration of T2DM and mode of treatment; in addition,
the insulin test is not a routine examination during post-operative
follow-up at our institution. For this reason, T2DM was not graded
according to glucose and insulin test results. It may be observed
from Table I that the female gender
ratios in the CO, SG0, RYGB0, SG3 and RYGB3 groups were 70, 74, 57,
100 and 100%, respectively.
 | Table I.Clinical characteristics of the study
population. |
Table I.
Clinical characteristics of the study
population.
| Parameter | CO (n=20) | SG0 (n=19) | RYGB0 (n=7) | SG3 (n=8) | RYGB3 (n=3) | P<0.05
comparisons |
|---|
| Age (years) | 31.5±10.3 | 32.9±7.1 | 45.7±9.4 | 33.3±6.5 | 40.3±6.8 | CO vs. RYGB0; SG0
vs. RYGB0; |
| Females | 14 (70%) | 16 (84%) | 4 (57%) | 8 (100%) | 3 (100%) |
|
| T2DM |
| 14 (74%) | 7 (100%) | 0 (0%) | 2 (67%) | SG0 vs. SG3 |
| BMI
(kg/m2) | 22.4±1.4 | 41±5.6 | 30±4.7 | 30.6±3.8 | 26.2±2 | CO vs. SG0; CO vs.
RYGB0; |
|
|
|
|
|
|
| SG0 vs. SG3 |
| GHb (%) |
| 7.4±2 | 7.8±1.6 | 5.6±0.4 | 7.4±1.4 | SG0 vs. SG3; |
| Glu (mmol/l) |
| 5.7±2.2 | 7.4±3.4 | 4.9±0.9 | 9.3±2.3 |
|
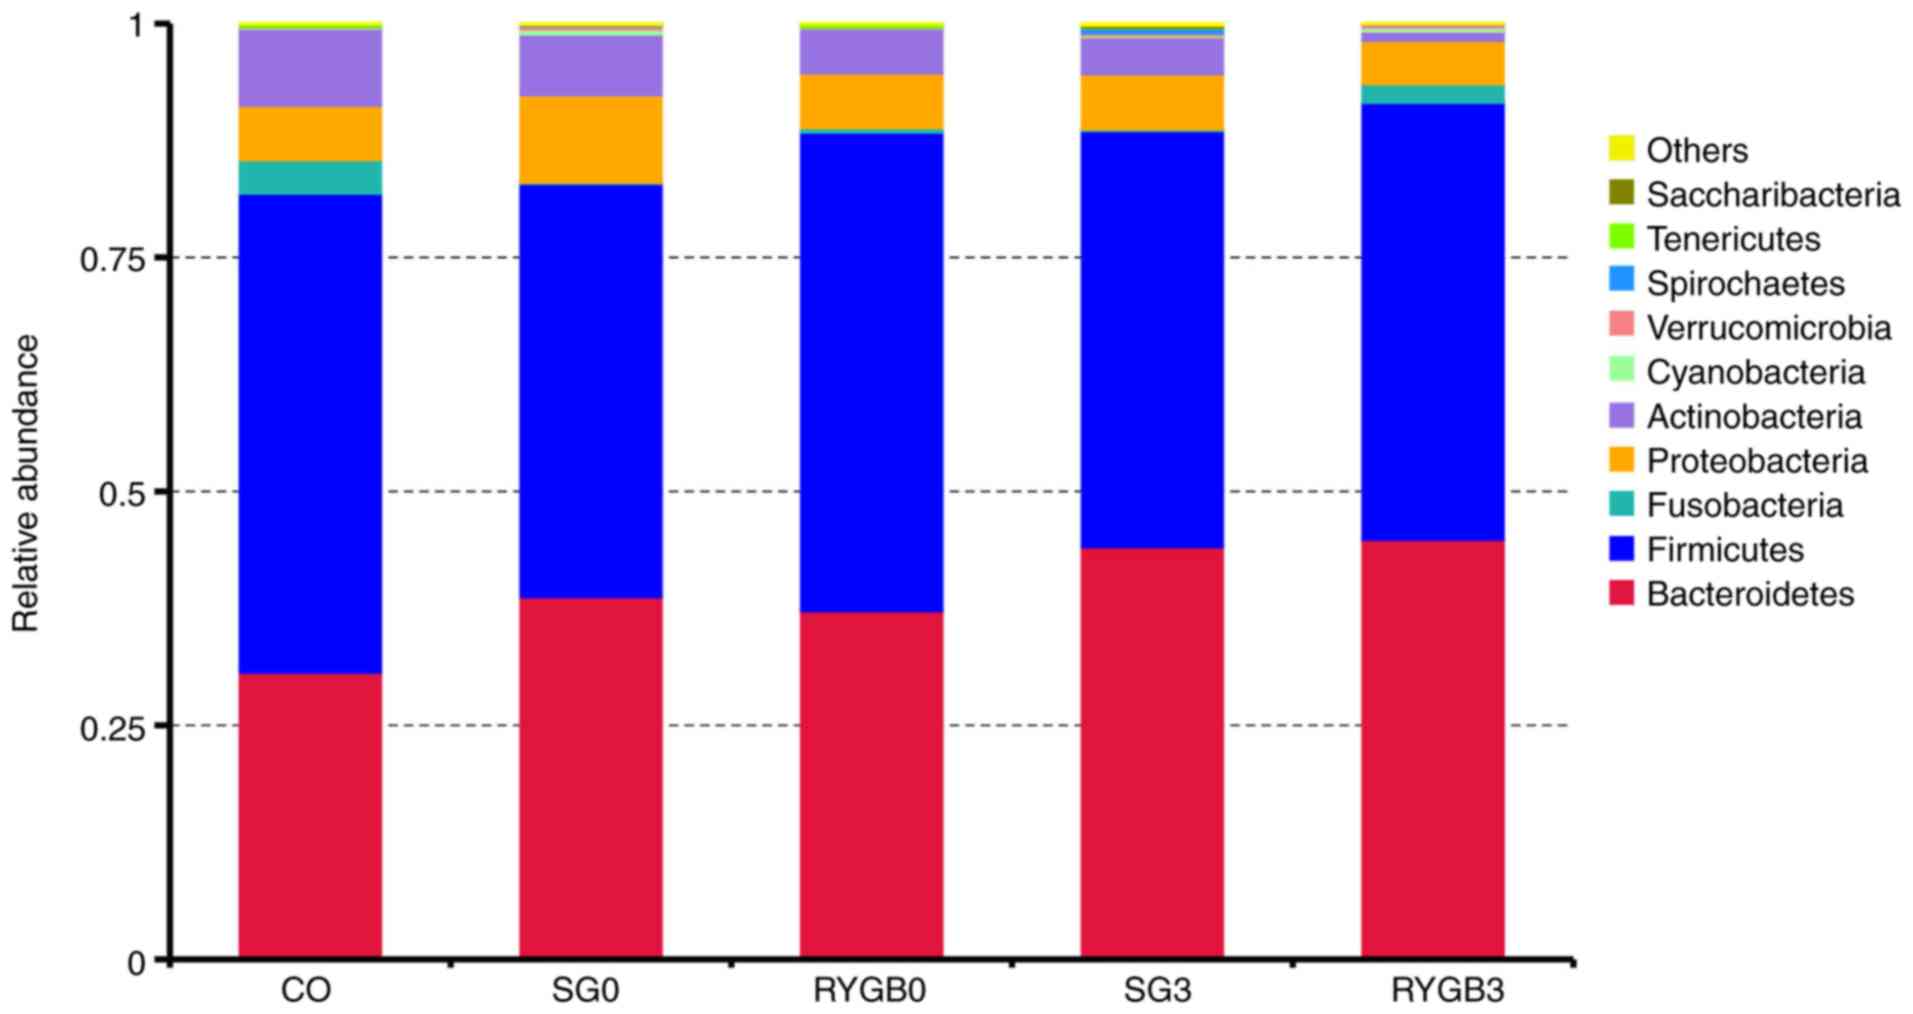
Relative abundance
On the basis of the results of the species
annotation, the distribution among the 5 groups at the phylogenetic
level was determined. As displayed in the bar graph in Fig. 1, the top 5 phyla were
Bacteroidetes, Firmicutes, Fusobacteria, Proteobacteria and
Actinobacteria. The detailed proportions of the top 10 phyla
in the 5 groups are listed in Table
II. In the horizontal comparison, a slightly lower proportion
of Bacteroidetes and a slightly higher proportion of
Fusobacteria were identified in the CO group compared with
those in the SG0 group (P=0.28 for Bacteroidetes and P=0.32
for Fusobacteria) and the RYGB0 group (P=0.48 for
Bacteroidetes and P=0.37 for Fusobacteria). In the
longitudinal comparison, a slightly higher proportion of
Bacteroidetes was identified in the SG3 group (P=0.49) and
the RYGB3 group (P=0.53) compared with that in the SG0 group and
the RYGB0 group, respectively.
| Table II.Detailed proportion of the top 10
phyla in the 5 groups. |
Table II.
Detailed proportion of the top 10
phyla in the 5 groups.
| Taxonomy | CO | SG0 | RYGB0 | SG3 | RYGB3 |
|---|
|
Bacteroidetes | 0.306591 | 0.387295 | 0.372221 | 0.440632 | 0.448629 |
|
Firmicutes | 0.512184 | 0.441977 | 0.511654 | 0.444814 | 0.467192 |
|
Fusobacteria | 0.035732 | 0.000883 | 0.004699 | 0.001771 | 0.019554 |
|
Proteobacteria | 0.058096 | 0.093562 | 0.058359 | 0.058849 | 0.046483 |
|
Actinobacteria | 0.082309 | 0.064907 | 0.047962 | 0.039593 | 0.010045 |
|
Cyanobacteria | 0.000983 | 0.005560 | 0.000256 | 0.001785 | 0.004170 |
|
Verrucomicrobia | 0.000976 | 0.003613 | 0.000915 | 0.002588 | 0.003688 |
|
Spirochaetes | 0.000051 | 0.000820 | 0.000107 | 0.005384 | 0.000018 |
|
Tenericutes | 0.002878 | 0.000035 | 0.003570 | 0.000318 | 0.000089 |
|
Saccharibacteria | 0.000096 | 0.000355 | 0.000084 | 0.002578 | 0.000054 |
| Others | 0.000103 | 0.000992 | 0.000172 | 0.001688 | 0.000080 |
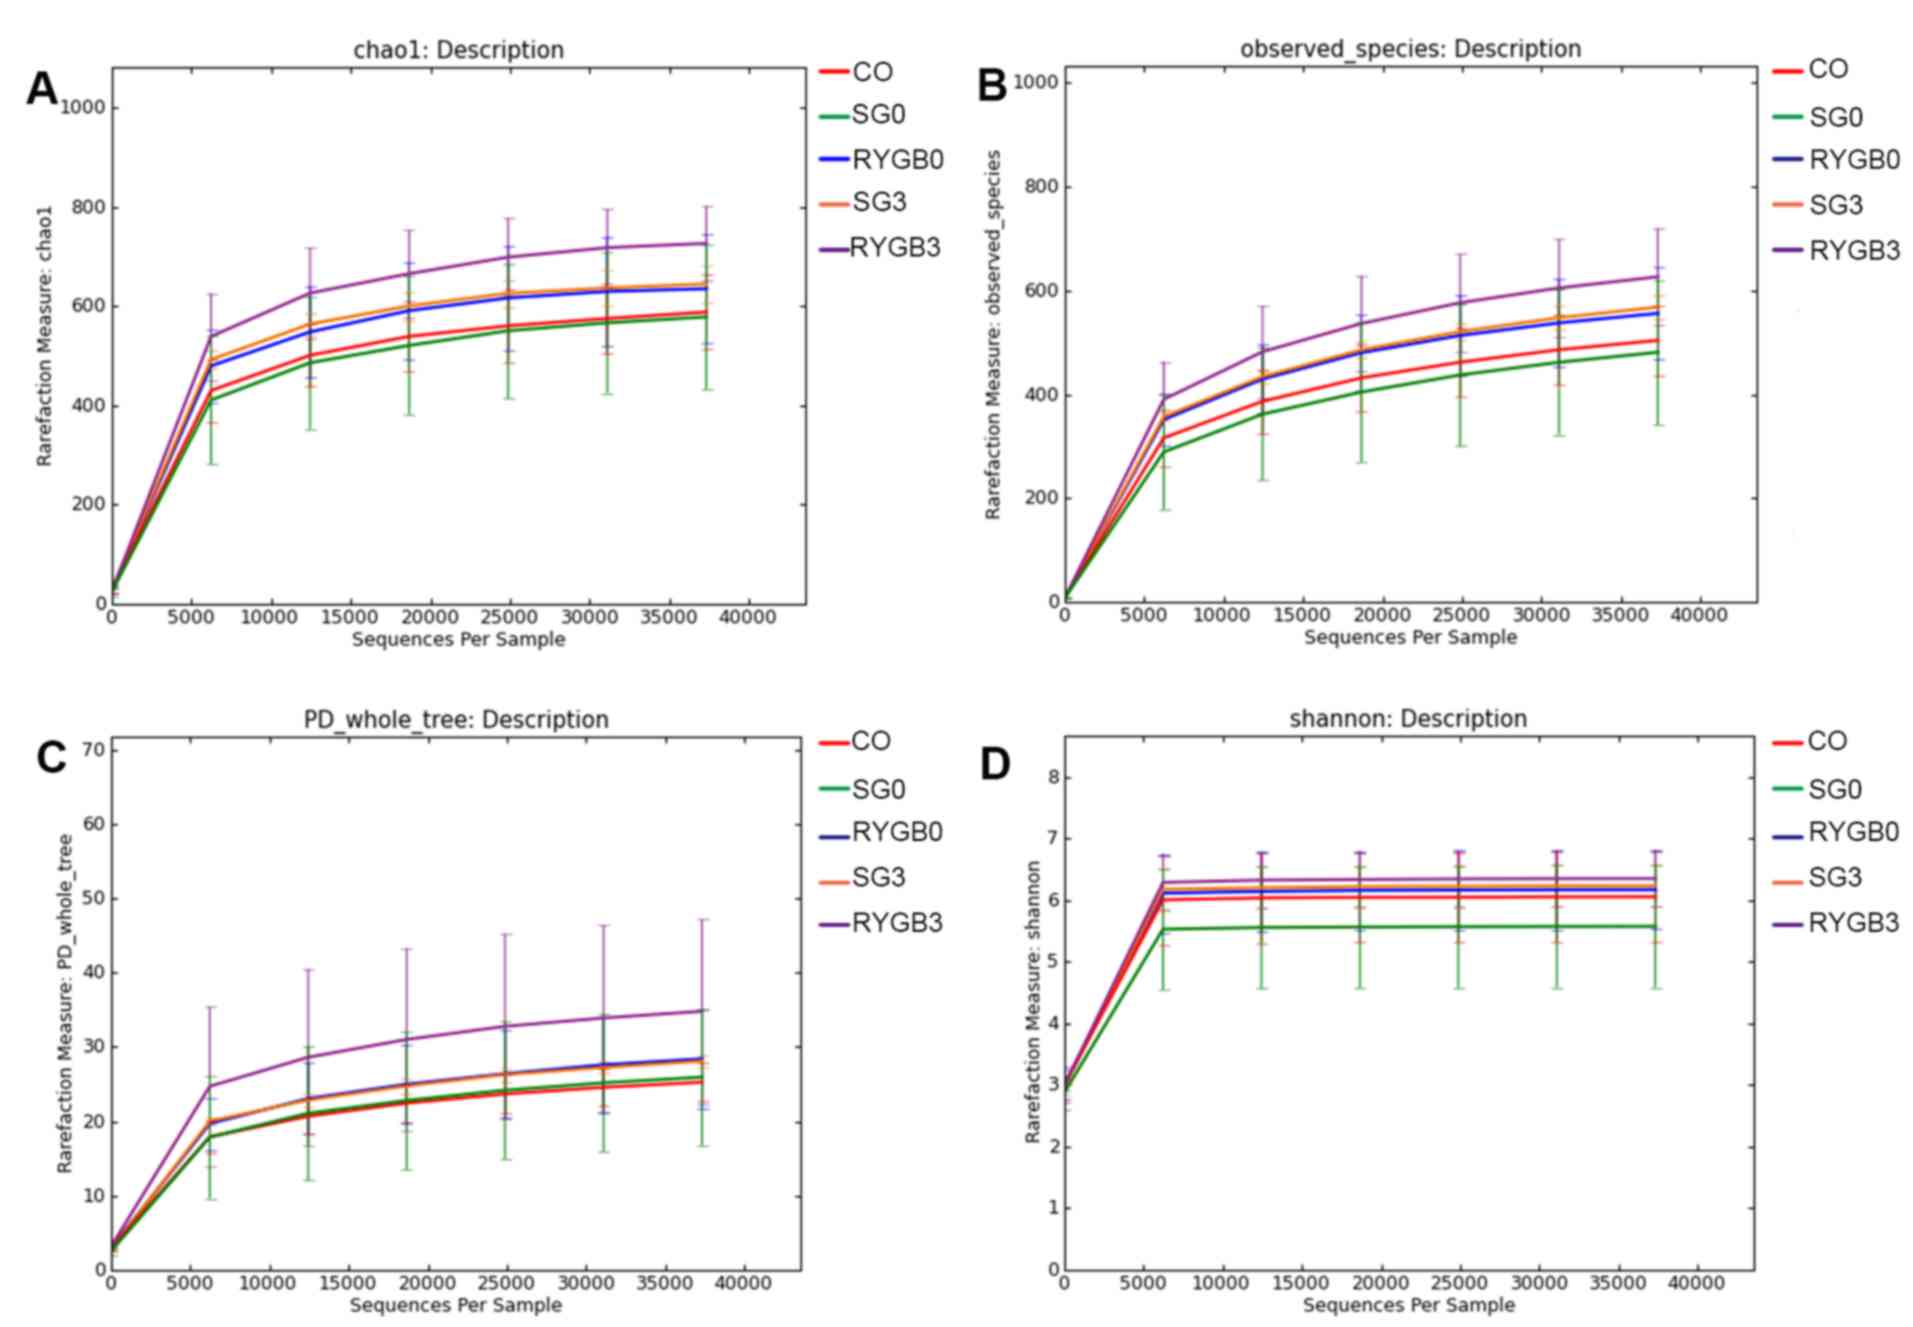
α diversity
The α diversity of the 5 groups was calculated in 6
different algorithms, including ACE (Fig. 2A), Chao1 (Fig. 2B), Goods_coverage, Observed_species
(Fig. 2C), Shannon (Fig. 2D) and PD_whole_tree (Fig. 2E). No statistically significant
differences regarding the α diversity were identified among the CO,
SG0 and RYGB0 groups. Of note, a significantly higher α diversity
was revealed in the SG3 group compared with that in the SG0 group
(Fig. 2). Rarefaction curves were
generated according to Chao1 (Fig.
3A), Observed_species (Fig. 3B),
PD_whole_tree (Fig. 3C) and Shannon
(Fig. 3D). The rarefaction curves
were obtained from multiple samplings of the same individuals and
with a variation in the depth of the sequencing; this was used to
visually demonstrate the reasonability of the amount of sequencing
data. The x-axis of the rarefaction curves represented the amount
of sequencing data extracted from one sample and the y-axis
represented the number of species. In Fig. 3, the 5 lines of the 5 groups
gradually became flat, which indicated that the amount of
sequencing data was appropriate. In other words, if the amount of
sequencing data had been further increased, no new species would
have been found. The rarefaction curves also reflected the α
diversity, and the results were consistent with those in Fig. 2.
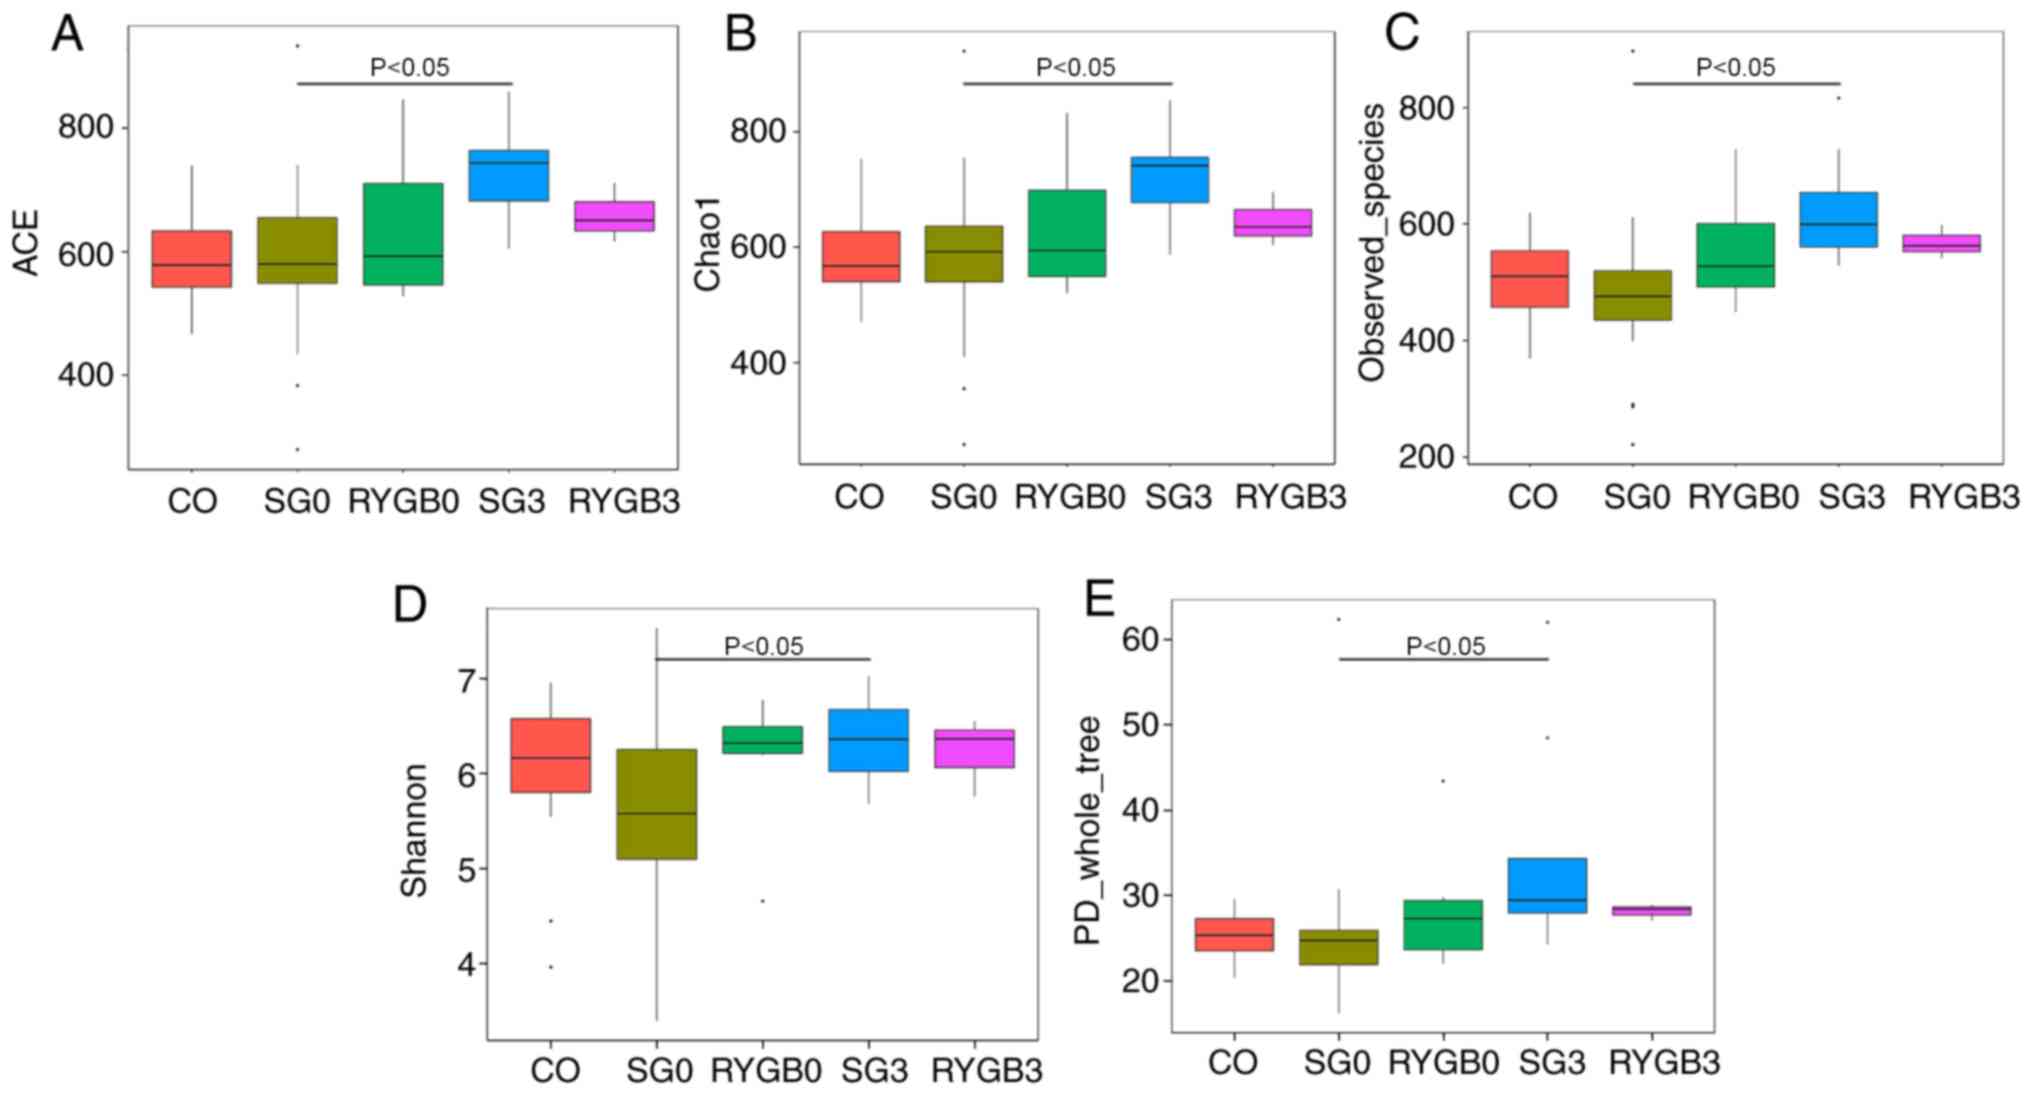 | Figure 2.α diversity in 5 groups determined by
6 different algorithms. (A) ACE; (B) chao1; (C) observed_species;
(D) Shannon; (E) PD_whole_tree. No significant difference was
identified in α diversity among the CO group, SG0 group and RYGB0
group. An obviously higher α diversity was obtained in the SG3
group compared with that in the SG0 group (P<0.05). A tendency
of higher α diversity may be distinguished in the RYGB3 group
compared with that in the RYGB0 group from A-C. The horizontal
lines inside the boxes indicate the median, whereas the lower lines
and upper lines of the boxes indicate the 25th and the 75th
percentiles, respectively. The upper and lower ends of the vertical
lines represent the maximum and minimum points of data,
respectively. The dots outside the boxes indicate the outliers (an
observation point whose distance from mean value is greater than
double standard deviations). CO, control group; SG, sleeve
gastrectomy; RYGB, Roux-en-Y gastric bypass; SG0/3, group prior
to/3 months after SG; ACE, abundance-based coverage estimator; PD,
phylogenetic diversity. |
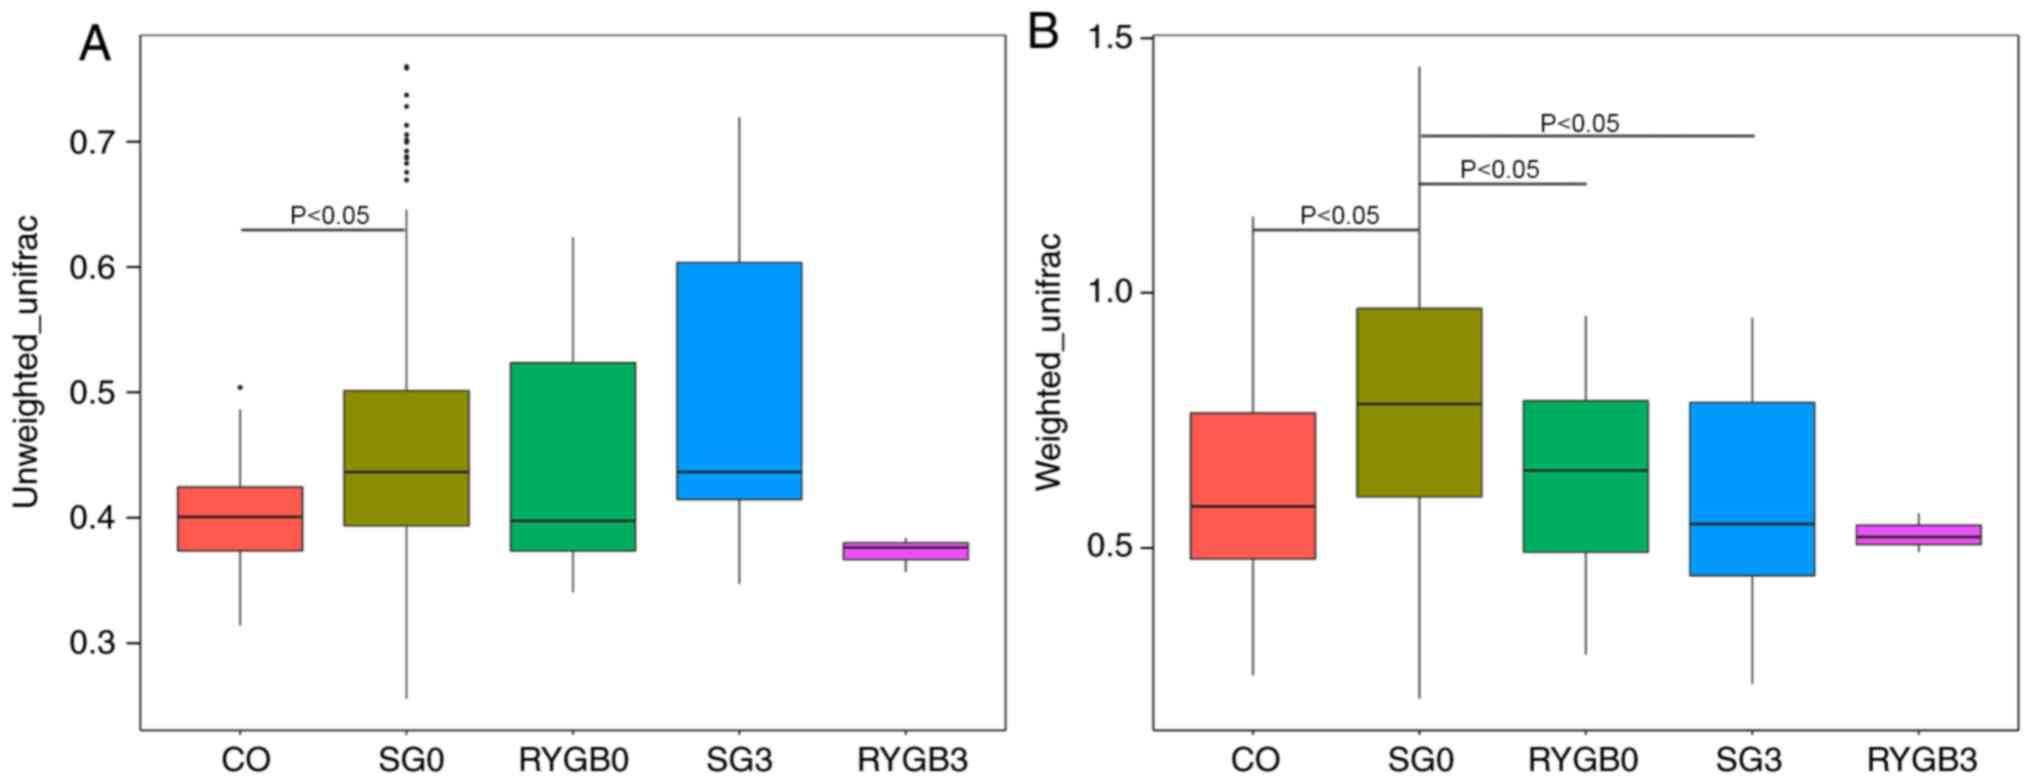
β diversity
The β diversity of the 5 groups was calculated using
the ANOSIM algorithm. Analysis using unweighted_unifrac revealed an
obviously higher β diversity in the SG0 group compared with that in
the CO group (P<0.05; Fig. 4A).
Furthermore, analysis with weighted_unifrac indicated a
significantly higher β diversity in the SG0 group and the RYGB0
group compared with that in the CO group (P<0.05), as well as an
obviously lower β diversity in the SG3 group compared with that in
the SG0 group (P<0.05; Fig. 4B).
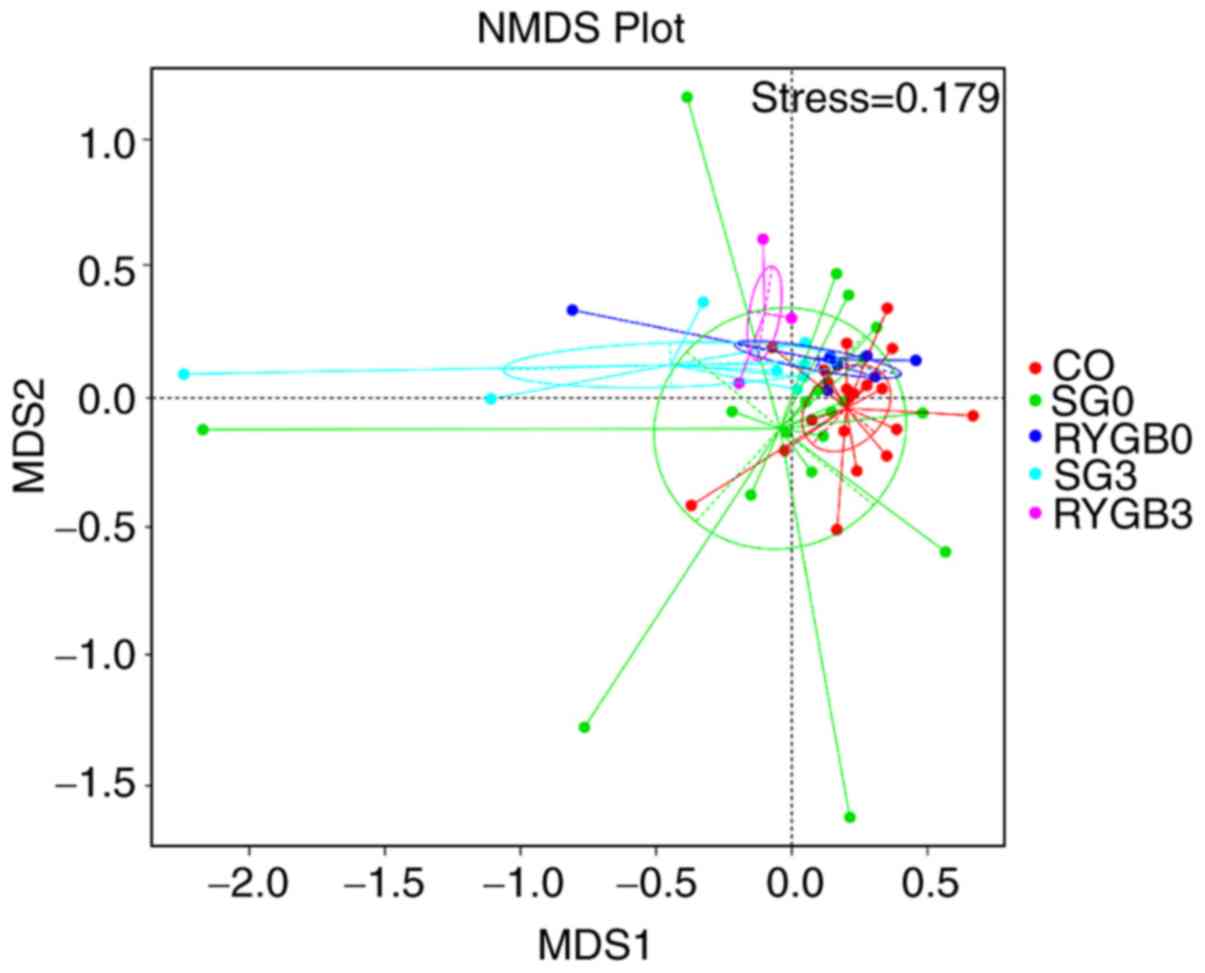
The heterogeneity in the community composition of the 5 groups was
presented in a two-dimensional way using an NMDS reduced-dimension
graph. The community composition of the SG3 group and the RYGB3
group deviated from that of the CO group, SG0 group and RYGB0
group. The plot of the SG3 group exhibited a converged tendency
compared with that of the SG0 group (Fig. 5).
Species with statistically significant
differences between groups
To identify the species with significant differences
between groups at the phylogenetic level, the Kruskal-Wallis test
was applied using LEfSe software. The species with statistically
significant differences are provided in Table III. The quantitative data with
error bars are available in Fig.
S1A-D.
| Table III.Taxonomies with statistically
significant differences between the groups. |
Table III.
Taxonomies with statistically
significant differences between the groups.
| Comparison | Class | Order | Family | Genus | Species |
|---|
| CO vs. SG0 |
Clostridia↓ | Clostridiales↓ |
Ruminococcaceae↓ |
|
Fusobacterium_mortiferum↓ |
|
|
|
|
Peptostreptococcaceae↓ |
|
|
| CO vs. RYGB0 |
Unidentified_Actinobacteria↓ |
Bifidobacteriales↓ |
Bifidobacteriaceae↓ |
Bifidobacterium↓ |
|
|
|
|
|
Peptostreptococcaceae↓ |
Megasphaera↓ |
|
| SG0 vs. SG3 |
Bacilli↑ |
Lactobacillales↑ |
Streptococcaceae↑ |
Alistipes↑ |
Streptococcus_salivarius_subsp_thermophilus↑ |
|
|
|
|
Rikenellaceae↑ |
Streptococcus↑ |
|
|
|
|
|
Porphyromonadaceae↑ |
|
Alitipes_finegoldii↑ |
| RYGB0 vs.
RYGB3 |
Bacilli↑ |
Lactobacillales↑ |
Streptococcaceae↑ |
Streptococcus↑ |
Streptococcus_salivarius_subsp_thermophilus↑ |
|
|
Negativicutes↓ |
Selenomonadales↓ |
|
Ruminococcaceae_ |
|
|
|
|
|
|
NK4A214_group↑ |
|
|
|
|
|
|
Faecalibacterium↓ |
|
Spearman correlation test
The Spearman correlation between the abundance of
certain microbe and the BMI, as well as GHb and Glu were determined
in all experimental groups (SG0, SG3, RYGB0 and RYGB3). The
Spearman correlation analysis revealed that there were certain
microbes whose abundance were positively or negatively correlated
with BMI, GHb and Glu, indicating a counterproductive or beneficial
effect, respectively, on surgical outcomes. The microbes with
statistically significant differences are provided in Table IV. The correlation coefficients for
each species are included in Table
IV, Fig. S2 (phylum), Fig. S3 (class), Fig. S4 (order), Fig. S5 (family), Fig. S6 (genus) and Fig. S7 (species).
| Table IV.Spearman correlation between microbes
and the BMI, GHb and Glu at different phylogenetic levels. |
Table IV.
Spearman correlation between microbes
and the BMI, GHb and Glu at different phylogenetic levels.
|
| BMI | Glu | GHb |
|---|
|
|
|
|
|
|---|
| Category | Positive | Negative | Positive | Negative | Positive | Negative |
|---|
| Phylum |
|
Bacteroidetes (−0.33) |
|
Actinobacteria (−0.56) |
|
|
| Class |
Negativicutes (0.43) |
Alphaproteobacteria (−0.44) |
|
Unidentified_ |
| Clostridia
(−0.35) |
|
|
Unidentified_ |
Sphingobacteria (−0.33) |
|
Actinobacteria (−0.56) |
|
|
|
|
Actinobacteria (0.33) |
|
|
|
|
|
| Order |
Selenomonadales (0.43) |
|
|
Bifidobacteriales (−0.56) |
|
Clostridiales (−0.36) |
|
|
Bifidobacteriales (0.47) |
|
|
|
|
|
| Family |
Vellonellaceae (0.42) |
Rikenellaceae (−0.4) |
|
Bifidobacteriaceae (−0.56) |
|
Rikenellaceae (−0.48) |
|
|
Bifidobacteriaceae (0.47) |
Streptococcaceae (−0.43) |
|
Alcaligenaceae (−0.34) |
|
Ruminococcaceae (−0.33) |
|
|
|
Porphyromonadaceae (−0.42) |
|
Acidaminococcaceae (−0.33) |
|
Lachnospiraceae(−0.33) |
|
|
|
Phyllobacteriaceae (−0.36) |
|
|
|
Porphyromonadaceae (−0.37) |
|
|
|
|
|
|
|
Peptostreptococcaceae (−0.35) |
| Genus | Megasphaera
(0.35) | Alistipes
(−0.33) |
X.Eubacterium._ | Megasphaera
(−0.42) |
| Alistipes
(−0.44) |
|
|
Bifidobacterium (0.47) |
Streptococcus (−0.43) |
ruminantium_group |
Bifidobacterium (−0.57) |
|
Parabacteroides (−0.34) |
|
|
|
Parabacteroides (−0.4) | (0.44) |
|
| Blautia
(−0.3) |
|
|
|
Phyllobacterium (−0.36) | Prevotella
_9 (0.39) |
|
|
|
|
|
|
Coprococcus_2 (−0.35) | Akkermansia
(0.33) |
|
|
|
|
|
| A214_group
(−0.5) |
|
|
|
|
|
|
|
Ruminococcaceae._ |
|
|
|
|
|
|
| NK4
(−0.5) |
|
|
|
|
|
|
|
Ruminococcaceae_ |
|
|
|
|
|
|
| UCG.002
(−0.37) |
|
|
|
|
|
|
|
X.Eubacterium._ |
|
|
|
|
|
|
|
ruminantium_group |
|
|
|
|
|
|
| (−0.46) |
|
|
|
|
| Species |
Megasphaera_elsdenii |
Streptococcus_salivarius_ |
Akkermansia_ |
Megasphaera_ | Lactobacillus_ |
Bacteroides_plebeius (−0.35) |
|
| (0.33) |
subsp_thermophilus (−0.42) | muciniphila
(0.34) | elsdenii
(−0.37) | mucosae (0.33) | Bacteroide_
dorei (−0.36) |
|
|
|
Parabacteroides_merdae |
Bacterium_OL.1 |
Bacteroides_ |
|
Ruminococcus_sp_5_1_ |
|
|
| (−0.35) | (−0.37) | coprocola
(−0.43) |
| 39BFAA
(−0.38) |
|
|
|
Bacteroides_caccae (−0.35) |
|
|
| 39BFAA
(−0.38) |
|
|
|
|
|
|
|
Blautia_obeum (−0.33) |
|
|
|
|
|
|
|
Bacteroides_nordii (−0.36) |
Discussion
The most effective therapy for treating morbid
obesity and T2DM is bariatric surgery, and SG and RYGB are the most
popular types of bariatric surgery procedures (25,26). In
the present study, patients receiving SG or RYGB achieved BMI
reduction and T2DM remission; however, the mechanisms responsible
for these outcomes in bariatric surgery remain to be fully
elucidated. A recently published study suggested that the
modulation of gut microbiota may be a possible factor (27).
α diversity is an index reflecting the variety of
microbial species in stool samples. A higher α diversity indicates
more species in one sample (7). In
the present study, most of the α diversity results were consistent
between the different algorithms applied, even though a small
variation existed. Due to the different formulas and
characteristics of the different algorithms, a small discrepancy
was unavoidable (28). The present
results indicated a similar α diversity between healthy volunteers
and obese patients, which was consistent with the results of
several cross-sectional studies (29,30).
Most previously published studies have observed a higher α
diversity in healthy volunteers, but these studies did not provide
any underlying causes of the alteration (7,12,31). The
current study did not stratify the T2DM patients into a separate
group and as a result, it was impossible to assess the differences
between T2DM patients and non-T2DM patients. The differences in gut
microbiota between T2DM patients and non-T2DM patients should
therefore be investigated in a future stuidies using a larger
cohort. The present results indicated an increased α diversity
after SG and RYGB, even though no statistical significance was
obtained in the RYGB group (P>0.05). The increase in α diversity
after bariatric surgery was also observed by several similar
studies (7,15,28,32,33).
While the mechanisms underlying the increase in α diversity after
bariatric surgery remains elusive, it may be speculated that
decreased gastric acid secretion and increased dissolved oxygen in
the colon are a potential mechanism.
β diversity is an index reflecting the heterogeneity
of gut microbiota between samples in each group. A higher β
diversity is indicative of larger compositional differences in the
gut microbiota between samples in a certain group (7). In the present study, a higher β
diversity was observed in obese patients compared with that in
healthy volunteers, and after SG, the β diversity decreased towards
the level in the heathy volunteers. The results indicated that the
heterogeneity of gut microbiota in obese patients is higher than
that in heathy volunteers and decreased after bariatric surgery. In
line with this, Liu et al (7)
also determined a higher heterogeneity of the gut microbiota in
obese patients compared with that in heathy volunteers by using the
metagenome method. Only few studies have reported alterations in β
diversity after bariatric surgery. Medina et al (34) reported a decreased β diversity after
SG, but Guo et al (28)
reported an unchanged β diversity after SG in animal experiments.
The community composition after bariatric surgery tended to deviate
from that of patients without bariatric surgery, which indicated
that bariatric surgery had a considerable influence on gut
microbiota.
Previous studies on species with significant
differences between healthy volunteers and obese patients with or
without T2DM had a high heterogeneity. In the present study,
significant differences in certain species at the phylogenetic
level between healthy volunteers and obese patients with or without
T2DM were identified. Most of these species belonged to the class
of Clostridia. Of note, a reduction in Clostridia in
the gut microbiota has been proven to be associated with obesity
(35,36). Certain species of Clostridia
produce butyrate, the primary energy source of enterocytes
(37). Furthermore, a reduction in
butyrate production increases the permeability of enterocytes,
leading to an increase in low-grade inflammation (38). The species producing butyrate may
also cause satiety, thereby reducing dietary intake (39). Fusobacterium mortiferum is a
species belonging to the Fusobacteria. In the present study,
the decreased abundance of Fusobacterium mortiferum in obese
patients was reported for the first time, to the best of our
knowledge. Certain previous studies have reported an increased
abundance of Fusobacteria after bariatric surgery (15,28,40). In
light of this, Fusobacteria may potentially be beneficial to
obese patients. A decreased amount of actinobacteria was
observed in obese patients compared with normal subjects in the
present study. Bifidobacteriales is one of the
representative orders among the actinobacteria. Several
studies have reported a decrease in Bifidobacteriales in
obese patients and T2DM patients (41,42).
Bifidobacteriales is also a butyrate producer (43) with the function of anti-endotoxaemia
(44), which has been deemed one of
the mechanisms of obesity.
Previous studies focusing on alteration of gut
microbiota after bariatric surgery were highly heterogeneous. The
present study observed a decrease in Negativicutes in the
gut microbiota at 3 months after RYGB. Previously published studies
have reported an increase in Negativicutes caused by a
western high-fat diet in mice (45).
To the best of our konwledge, the present study was the first to
report a decrease in Selenomonadales after RYGB and an
increase in Rikenellaceae after SG. A previous study has
observed a reduced proportion of Rikenellaceae in patients
with non-alcoholic fatty liver (46), which was, to a certain degree,
consistent with the present results. An increase in the
Ruminococcaceae NK4A214 group after bariatric surgery was
also reported in the present study, results consistent with this
(15) and opposite to this (11) have been reported, and the discrepancy
between the different studies may be associated with differences in
the surgical procedures applied. Previous studies reported a
decrease in Faecalibacterium after RYGB (15,40),
which is consistent with the present results, but Furet et
al (47) obtained an opposite
result, i.e. a negative correlation between Faecalibacterium
and low-grade inflammation. Streptococcus is part of the
normal flora of the oral cavity, which may explain for the
increases in Streptococcaceae, Streptococcus and
Streptococcus salivarius subspecies thermophilus after RYGB
or SG (48). Increases in
Bacilli and Lactobacillales after bariatric surgery
were observed in the present study; however, the detailed mechanism
remains elusive.
The Spearman correlation between species and BMI,
GHb and Glu in the experimental groups (SG0, RYGB0, SG3 and RYGB3)
was assessed. The results suggested that the abundance of certain
microbes at the phylogenetic level were positively correlated with
the BMI, GHb or Glu, and that they appeared to have
counterproductive effects on the outcomes of bariatric surgery. By
contrast, the species whose abundance was negatively correlated
with the BMI, GHb or Glu appeared to have beneficial effects on the
outcomes of bariatric surgery. Of note, although no significant
alterations of Akkermansia muciniphila were identified after
bariatric surgery, a positive correlation between Akkermansia
muciniphila and Glu was determined. Previous studies reported
the beneficial effects of Akkermansia muciniphila on T2DM
and obesity (49,50). The increase in Akkermansia
muciniphila after bariatric surgery was deemed an important
mechanism of the excellent outcomes of bariatric surgery (40,51,52). The
role of Akkermansia muciniphila requires to be explored as
part of a rigorously designed study with a large sample size. The
correlation coefficients ranged from 0.3 to 0.6, which indicated a
weak or moderate correlation between the abundance of species and
the BMI, as well as GHb and Glu. No species with a high correlation
were identified in the Spearman correlation analysis of the present
study, and therefore, the present results should be interpreted
with caution. Further studies are required to identify the
correlation between the abundance of species and the BMI, GHb and
Glu.
The following limitations of the study should be
considered: i) The small sample size may have impaired the
reliability of the results. ii) The healthy volunteers refused
invasive testing; hence, it is not known whether any of them may
have had undetected T2DM. However, this limitation influenced the
results only to a small degree: The most important differential
feature between the CO and the experimental group is not T2DM, but
the BMI, and the volunteers in the CO group were all of normal
weight. iii) The patients were not strictly paired between SG0 and
SG3 or between RYGB0 and RYGB3 as certain patients were lost to
follow up following bariatric surgery, which amplified the
influence of individual microbial differences on the results. iv)
The follow-up time was short (3 months after bariatric surgery) and
the gut microbiota may have been unstable at that time. v) The
inter-group differences in age and sex were important confounding
factors that have affected the results of the current study and
will need to be assessed in further research.
Bariatric surgery may cause obvious alterations in
gut microbiota. Compared with healthy volunteers and obese patients
without receiving bariatric surgery, the microbiota composition of
post-bariatric surgery patients had unique characteristics.
However, studies with a larger cohort and a longer follow-up may be
required to confirm these results.
Supplementary Material
Supporting Data
Acknowledgements
Not applicable.
Funding
This study was supported by the Beijing Municipal
Commission of Science and Technology (grant nos.
Z161100000116068).
Availability of data and materials
The data sets generated and analyzed during the
study are available from the corresponding author upon reasonable
request.
Authors' contributions
FGW collected the stools and the patient data. FGW,
RXB, MY and WMY performed the next-generation 16s ribosomal DNA
amplicon sequencing and statistical analysis. FGW was a major
contributor in writing the manuscript. MMS and LYD conceived the
study and revised the manuscript. All authors read and approved the
final manuscript.
Ethics approval and consent to
participate
All patients and healthy volunteers provided written
informed consent, and the present study was approved by the ethics
committee of Bejing Tiantan Hospital (Beijing, China).
Patient consent for publication
Not applicable.
Competing interests
The authors declare that they have no competing
interests.
Glossary
Abbreviations
Abbreviations:
|
SG
|
sleeve gastrectomy
|
|
RYGB
|
Roux-en-Y gastric bypass
|
|
T2DM
|
type 2 diabetes mellitus
|
|
Glu
|
fast blood glucose
|
|
GHb
|
glycosylated haemoglobin
|
References
|
1
|
Schauer PR, Bhatt DL, Kirwan JP, Wolski K,
Brethauer SA, Navaneethan SD, Aminian A, Pothier CE, Kim ES, Nissen
SE, et al: Bariatric surgery versus intensive medical therapy for
diabetes-3-year outcomes. N Engl J Med. 370:2002–2013. 2014.
View Article : Google Scholar : PubMed/NCBI
|
|
2
|
Colquitt JL, Pickett K, Loveman E and
Frampton GK: Surgery for weight loss in adults. Cochrane Database
Syst Rev. Cd0036412014.PubMed/NCBI
|
|
3
|
Hayoz C, Hermann T, Raptis DA, Brönnimann
A, Peterli R and Zuber M: Comparison of metabolic outcomes in
patients undergoing laparoscopic roux-en-Y gastric bypass versus
sleeve gastrectomy-a systematic review and meta-analysis of
randomised controlled trials. Swiss Med Wkly.
148:w146332018.PubMed/NCBI
|
|
4
|
Liaskos C, Koliaki C, Alexiadou K,
Argyrakopoulou G, Tentolouris N, Diamantis T, Alexandrou A,
Katsilambros N and Kokkinos A: Roux-en-Y gastric bypass is more
effective than sleeve gastrectomy in improving postprandial
glycaemia and lipaemia in non-diabetic morbidly obese patients: A
short-term follow-up analysis. Obes Surg. 28:3997–4005. 2018.
View Article : Google Scholar : PubMed/NCBI
|
|
5
|
Behary P and Miras AD: Food preferences
and underlying mechanisms after bariatric surgery. Proc Nutr Soc.
74:419–425. 2015. View Article : Google Scholar : PubMed/NCBI
|
|
6
|
Thaler JP and Cummings DE: Minireview:
Hormonal and metabolic mechanisms of diabetes remission after
gastrointestinal surgery. Endocrinology. 150:2518–2525. 2009.
View Article : Google Scholar : PubMed/NCBI
|
|
7
|
Liu R, Hong J, Xu X, Feng Q, Zhang D, Gu
Y, Shi J, Zhao S, Liu W, Wang X, et al: Gut microbiome and serum
metabolome alterations in obesity and after weight-loss
intervention. Nat Med. 23:859–868. 2017. View Article : Google Scholar : PubMed/NCBI
|
|
8
|
Carlson AL, Xia K, Azcarate-Peril MA,
Goldman BD, Ahn M, Styner MA, Thompson AL, Geng X, Gilmore JH and
Knickmeyer RC: Infant gut microbiome associated with cognitive
development. Biol Psychiatry. 83:148–159. 2018. View Article : Google Scholar : PubMed/NCBI
|
|
9
|
Kitai T and Tang WHW: Gut microbiota in
cardiovascular disease and heart failure. Clin Sci (Lond).
132:85–91. 2018. View Article : Google Scholar : PubMed/NCBI
|
|
10
|
Tang R, Jiang Y, Tan A, Ye J, Xian X, Xie
Y, Wang Q, Yao Z and Mo Z: 16S rRNA gene sequencing reveals altered
composition of gut microbiota in individuals with kidney stones.
Urolithiasis. 46:503–514. 2018. View Article : Google Scholar : PubMed/NCBI
|
|
11
|
Kasai C, Sugimoto K, Moritani I, Tanaka J,
Oya Y, Inoue H, Tameda M, Shiraki K, Ito M, Takei Y and Takase K:
Comparison of the gut microbiota composition between obese and
non-obese individuals in a Japanese population, as analyzed by
terminal restriction fragment length polymorphism and
next-generation sequencing. BMC Gastroenterol. 15:1002015.
View Article : Google Scholar : PubMed/NCBI
|
|
12
|
Turnbaugh PJ, Hamady M, Yatsunenko T,
Cantarel BL, Duncan A, Ley RE, Sogin ML, Jones WJ, Roe BA,
Affourtit JP, et al: A core gut microbiome in obese and lean twins.
Nature. 457:480–484. 2009. View Article : Google Scholar : PubMed/NCBI
|
|
13
|
Zhang H, DiBaise JK, Zuccolo A, Kudrna D,
Braidotti M, Yu Y, Parameswaran P, Crowell MD, Wing R, Rittmann BE
and Krajmalnik-Brown R: Human gut microbiota in obesity and after
gastric bypass. Proc Natl Acad Sci USA. 106:2365–2370. 2009.
View Article : Google Scholar : PubMed/NCBI
|
|
14
|
Tremaroli V, Karlsson F, Werling M,
Ståhlman M, Kovatcheva-Datchary P, Olbers T, Fändriks L, le Roux
CW, Nielsen J and Bäckhed F: Roux-en-Y gastric bypass and vertical
banded gastroplasty induce long-term changes on the human gut
microbiome contributing to fat mass regulation. Cell Metab.
22:228–238. 2015. View Article : Google Scholar : PubMed/NCBI
|
|
15
|
Palleja A, Kashani A, Allin KH, Nielsen T,
Zhang C, Li Y, Brach T, Liang S, Feng Q, Jørgensen NB, et al:
Roux-en-Y gastric bypass surgery of morbidly obese patients induces
swift and persistent changes of the individual gut microbiota.
Genome Med. 8:672016. View Article : Google Scholar : PubMed/NCBI
|
|
16
|
Sanmiguel CP, Jacobs J, Gupta A, Ju T,
Stains J, Coveleskie K, Lagishetty V, Balioukova A, Chen Y, Dutson
E, et al: Surgically induced changes in gut microbiome and hedonic
eating as related to weight loss: Preliminary findings in obese
women undergoing bariatric surgery. Psychosom Med. 79:880–887.
2017. View Article : Google Scholar : PubMed/NCBI
|
|
17
|
Griffith GW, Ozkose E, Theodorou MK and
Davies DR: Diversity of anaerobic fungal populations in cattle
revealed by selective enrichment culture using different carbon
sources. Fungal Ecol. 2:87–97. 2009. View Article : Google Scholar
|
|
18
|
Martin M: Cutadapt removes adapter
sequences from high-throughput sequencing reads. Embnet J. 17:2011,
https://doi.org/10.14806/ej.17.1.200 View Article : Google Scholar
|
|
19
|
Quast C, Pruesse E, Yilmaz P, Gerken J,
Schweer T, Yarza P, Peplies J and Glöckner FO: The SILVA ribosomal
RNA gene database project: Improved data processing and web-based
tools. Nucleic Acids Res. 41:(Database Issue). D590–D596. 2013.
View Article : Google Scholar : PubMed/NCBI
|
|
20
|
Edgar RC, Haas BJ, Clemente JC, Quince C
and Knight R: UCHIME improves sensitivity and speed of chimera
detection. Bioinformatics. 27:2194–2200. 2011. View Article : Google Scholar : PubMed/NCBI
|
|
21
|
Haas BJ, Gevers D, Earl AM, Feldgarden M,
Ward DV, Giannoukos G, Ciulla D, Tabbaa D, Highlander SK, Sodergren
E, et al: Chimeric 16S rRNA sequence formation and detection in
Sanger and 454-pyrosequenced PCR amplicons. Genome Res. 21:494–504.
2011. View Article : Google Scholar : PubMed/NCBI
|
|
22
|
Edgar RC: UPARSE: Highly accurate OTU
sequences from microbial amplicon reads. Nat Methods. 10:996–998.
2013. View Article : Google Scholar : PubMed/NCBI
|
|
23
|
Edgar RC: MUSCLE: Multiple sequence
alignment with high accuracy and high throughput. Nucleic Acids
Res. 32:1792–1797. 2004. View Article : Google Scholar : PubMed/NCBI
|
|
24
|
Segata N, Izard J, Waldron L, Gevers D,
Miropolsky L, Garrett WS and Huttenhower C: Metagenomic biomarker
discovery and explanation. Genome Biol. 12:R602011. View Article : Google Scholar : PubMed/NCBI
|
|
25
|
Buchwald H, Avidor Y, Braunwald E, Jensen
MD, Pories W, Fahrbach K and Schoelles K: Bariatric surgery: A
systematic review and meta-analysis. JAMA. 292:1724–1737. 2004.
View Article : Google Scholar : PubMed/NCBI
|
|
26
|
Maggard MA, Shugarman LR, Suttorp M,
Maglione M, Sugerman HJ, Livingston EH, Nguyen NT, Li Z, Mojica WA,
Hilton L, et al: Meta-analysis: Surgical treatment of obesity. Ann
Intern Med. 142:547–559. 2005. View Article : Google Scholar : PubMed/NCBI
|
|
27
|
Peck BCE and Seeley RJ: How does
‘metabolic surgery’ work its magic? New evidence for gut
microbiota. Curr Opin Endocrinol Diabetes Obes. 25:81–86.
2018.PubMed/NCBI
|
|
28
|
Guo Y, Liu CQ, Shan CX, Chen Y, Li HH,
Huang ZP and Zou DJ: Gut microbiota after Roux-en-Y gastric bypass
and sleeve gastrectomy in a diabetic rat model: Increased diversity
and associations of discriminant genera with metabolic changes.
Diabetes Metab Res Rev. 33:2017.doi: 10.1002/dmrr.2857. View Article : Google Scholar : PubMed/NCBI
|
|
29
|
López-Contreras BE, Morán-Ramos S,
Villarruel-Vázquez R, Macías-Kauffer L, Villamil-Ramírez H,
León-Mimila P, Vega-Badillo J, Sánchez-Muñoz F, Llanos-Moreno LE,
Canizalez-Román A, et al: Composition of gut microbiota in obese
and normal-weight Mexican school-age children and its association
with metabolic traits. Pediatr Obes. 13:381–388. 2018. View Article : Google Scholar : PubMed/NCBI
|
|
30
|
Hakkak R, Korourian S, Foley SL and
Erickson BD: Assessment of gut microbiota populations in lean and
obese Zucker rats. PLoS One. 12:e01814512017. View Article : Google Scholar : PubMed/NCBI
|
|
31
|
Yun Y, Kim HN, Kim SE, Heo SG, Chang Y,
Ryu S, Shin H and Kim HL: Comparative analysis of gut microbiota
associated with body mass index in a large Korean cohort. BMC
Microbiol. 17:1512017. View Article : Google Scholar : PubMed/NCBI
|
|
32
|
Jahansouz C, Staley C, Bernlohr DA,
Sadowsky MJ, Khoruts A and Ikramuddin S: Sleeve gastrectomy drives
persistent shifts in the gut microbiome. Surg Obes Relat Dis.
13:916–924. 2017. View Article : Google Scholar : PubMed/NCBI
|
|
33
|
Kong LC, Tap J, Aron-Wisnewsky J, Pelloux
V, Basdevant A, Bouillot JL, Zucker JD, Doré J and Clément K: Gut
microbiota after gastric bypass in human obesity: increased
richness and associations of bacterial genera with adipose tissue
genes. Am J Clin Nutr. 98:16–24. 2013. View Article : Google Scholar : PubMed/NCBI
|
|
34
|
Medina DA, Pedreros JP, Turiel D, Quezada
N, Pimentel F, Escalona A and Garrido D: Distinct patterns in the
gut microbiota after surgical or medical therapy in obese patients.
PeerJ. 5:e34432017. View Article : Google Scholar : PubMed/NCBI
|
|
35
|
Menni C, Jackson MA, Pallister T, Steves
CJ, Spector TD and Valdes AM: Gut microbiome diversity and
high-fibre intake are related to lower long-term weight gain. Int J
Obes (Lond). 41:1099–1105. 2017. View Article : Google Scholar : PubMed/NCBI
|
|
36
|
Nadal I, Santacruz A, Marcos A, Warnberg
J, Garagorri JM, Moreno LA, Martin-Matillas M, Campoy C, Martí A,
Moleres A, et al: Shifts in clostridia, bacteroides and
immunoglobulin-coating fecal bacteria associated with weight loss
in obese adolescents. Int J Obes (Lond). 33:758–767. 2009.
View Article : Google Scholar : PubMed/NCBI
|
|
37
|
Flint HJ, Duncan SH, Scott KP and Louis P:
Interactions and competition within the microbial community of the
human colon: Links between diet and health. Environ Microbiol.
9:1101–1111. 2007. View Article : Google Scholar : PubMed/NCBI
|
|
38
|
Baothman OA, Zamzami MA, Taher I, Abubaker
J and Abu-Farha M: The role of gut microbiota in the development of
obesity and diabetes. Lipids Health Dis. 15:1082016. View Article : Google Scholar : PubMed/NCBI
|
|
39
|
Xu J, Bjursell MK, Himrod J, Deng S,
Carmichael LK, Chiang HC, Hooper LV and Gordon JI: A genomic view
of the human-bacteroides thetaiotaomicron symbiosis. Science.
299:2074–2076. 2003. View Article : Google Scholar : PubMed/NCBI
|
|
40
|
Graessler J, Qin Y, Zhong H, Zhang J,
Licinio J, Wong ML, Xu A, Chavakis T, Bornstein AB,
Ehrhart-Bornstein M, et al: Metagenomic sequencing of the human gut
microbiome before and after bariatric surgery in obese patients
with type 2 diabetes: Correlation with inflammatory and metabolic
parameters. Pharmacogenomics J. 13:514–522. 2013. View Article : Google Scholar : PubMed/NCBI
|
|
41
|
Santacruz A, Collado MC, García-Valdés L,
Segura MT, Martín-Lagos JA, Anjos T, Martí-Romero M, Lopez RM,
Florido J, Campoy C and Sanz Y: Gut microbiota composition is
associated with body weight, weight gain and biochemical parameters
in pregnant women. Br J Nutr. 104:83–92. 2010. View Article : Google Scholar : PubMed/NCBI
|
|
42
|
Schwiertz A, Taras D, Schäfer K, Beijer S,
Bos NA, Donus C and Hardt PD: Microbiota and SCFA in lean and
overweight healthy subjects. Obesity (Silver Spring). 18:190–195.
2010. View Article : Google Scholar : PubMed/NCBI
|
|
43
|
Duncan SH, Belenguer A, Holtrop G,
Johnstone AM, Flint HJ and Lobley GE: Reduced dietary intake of
carbohydrates by obese subjects results in decreased concentrations
of butyrate and butyrate-producing bacteria in feces. Appl Environ
Microbiol. 73:1073–1078. 2007. View Article : Google Scholar : PubMed/NCBI
|
|
44
|
Cani PD, Neyrinck AM, Fava F, Knauf C,
Burcelin RG, Tuohy KM, Gibson GR and Delzenne NM: Selective
increases of bifidobacteria in gut microflora improve
high-fat-diet-induced diabetes in mice through a mechanism
associated with endotoxaemia. Diabetologia. 50:2374–2383. 2007.
View Article : Google Scholar : PubMed/NCBI
|
|
45
|
Kim MS and Bae JW: Spatial disturbances in
altered mucosal and luminal gut viromes of diet-induced obese mice.
Environ Microbiol. 18:1498–1510. 2016. View Article : Google Scholar : PubMed/NCBI
|
|
46
|
Del Chierico F, Nobili V, Vernocchi P,
Russo A, Stefanis C, Gnani D, Furlanello C, Zandonà A, Paci P,
Capuani G, et al: Gut microbiota profiling of pediatric
nonalcoholic fatty liver disease and obese patients unveiled by an
integrated meta-omics-based approach. Hepatology. 65:451–464. 2017.
View Article : Google Scholar : PubMed/NCBI
|
|
47
|
Furet JP, Kong LC, Tap J, Poitou C,
Basdevant A, Bouillot JL, Mariat D, Corthier G, Doré J, Henegar C,
et al: Differential adaptation of human gut microbiota to bariatric
surgery-induced weight loss: Links with metabolic and low-grade
inflammation markers. Diabetes. 59:3049–3057. 2010. View Article : Google Scholar : PubMed/NCBI
|
|
48
|
Wang K, Lu W, Tu Q, Ge Y, He J, Zhou Y,
Gou Y, Van Nostrand JD, Qin Y, Li J, et al: Preliminary analysis of
salivary microbiome and their potential roles in oral lichen
planus. Sci Rep. 6:229432016. View Article : Google Scholar : PubMed/NCBI
|
|
49
|
Everard A, Belzer C, Geurts L, Ouwerkerk
JP, Druart C, Bindels LB, Guiot Y, Derrien M, Muccioli GG, Delzenne
NM, et al: Cross-talk between Akkermansia muciniphila and
intestinal epithelium controls diet-induced obesity. Proc Natl Acad
Sci USA. 110:9066–9071. 2013. View Article : Google Scholar : PubMed/NCBI
|
|
50
|
Shin NR, Lee JC, Lee HY, Kim MS, Whon TW,
Lee MS and Bae JW: An increase in the Akkermansia spp.
population induced by metformin treatment improves glucose
homeostasis in diet-induced obese mice. Gut. 63:727–735. 2014.
View Article : Google Scholar : PubMed/NCBI
|
|
51
|
Liou AP, Paziuk M, Luevano JM Jr,
Machineni S, Turnbaugh PJ and Kaplan LM: Conserved shifts in the
gut microbiota due to gastric bypass reduce host weight and
adiposity. Sci Transl Med. 5:178ra142013. View Article : Google Scholar
|
|
52
|
Yan M, Song MM, Bai RX, Cheng S and Yan
WM: Effect of Roux-en-Y gastric bypass surgery on intestinal
Akkermansia muciniphila. World J Gastrointest Surg.
8:301–307. 2016. View Article : Google Scholar : PubMed/NCBI
|