Introduction
Pancreatic cancer is one of the most prevalent and
lethal malignancies worldwide (1).
Although substantial progress has been made in adjuvant and
neo-adjuvant chemotherapies during previous decades, pancreatectomy
remains the most effective treatment, notably for early stage
pancreatic cancer cases. Despite this, a previous study
demonstrated that only 20% of patients present with localized and
non-metastatic disease, and are therefore suitable for initial
resection (2). Due to its specific
tumor biology, pancreatic cancer is characterized with early
recurrence and metastasis and resistance to chemotherapy and
radiotherapy. The 5-year overall survival rate is <5% (3). Therefore, an improved understanding of
the underlying mechanism of pancreatic cancer is required for the
development of effective therapy and the improvement of patient
survival.
Previously, the development of high throughout
sequencing has resulted in the production of numerous gene
expression profiles of neoplasms that are freely available via the
Gene Expression Omnibus (GEO) database (4). Based on these data, the different
aspects of the mechanism of pancreatic neoplasm development and the
resistance to chemotherapy may be investigated. However, only a
small part of these data has been used, and the majority of them
have only been deposited. Using a bioinformatic analysis, these
data may be re-analysed and used to provide valuable information
for subsequent investigation. During the re-analysis process,
differentially expressed genes (DEGs) are initially identified, and
subsequently the functions and pathways of the genes involved are
investigated. Several studies performed in pancreatic cancer have
been performed previously (5,6).
Although the majority of these studies only focused on the
identification of the most significant genes, the tumor and normal
tissues were not paired in those analyses. Therefore, in the
present study, three GEO datasets were selected, which contained
paired tumor tissues and corresponding normal tissues, and the
microarray data was analysed. The analysis led to the
identification of the DEGs, and Gene Ontology (GO) and pathway
enrichment analysis were subsequently performed to explore the
biological functions and pathways of these genes. Furthermore, a
protein-protein interaction (PPI) network was constructed and a
module analysis was performed to explore the hub genes in
pancreatic cancer. The present study may provide novel insights
into the understanding of the mechanism of pancreatic cancer
formation and its corresponding hub genes, and the pathways
involved may serve as potential targets for the treatment of this
cancer type.
Materials and methods
Data source
The microarray data for the investigation of
pancreatic cancer were downloaded from the GEO datasets (www.ncbi.nlm.nih.gov/geo) as follows: GSE15471,
GSE16515 and GSE28735. The gene expression profiles of GSE15471 and
GSE16515 were obtained using the GPL570 platform, and GSE28735 was
obtained using the GPL6244 platform. GSE15471 and GSE28735 included
36 and 45 pairs of tumor and corresponding normal tissues,
respectively. GSE16515 consisted of 36 tumor and 16 normal tissues.
A total of 16 pairs of tissues were selected for subsequent
analysis.
DEG identification
DEGs between tumor and normal tissue samples were
identified using the online analysis tool GEO2R (www.ncbi.nlm.nih.gov/geo/geo2r), and the
results were saved as a .txt format. The cut-off criteria for DEG
identification were defined as adjusted P<0.05 and |log fold
change (FC)|>1. Subsequently, the DEGs of the three GEO datasets
were processed to generate a Venn diagram using an online resource
(bioinformatics.psb.ugent.be/webtools/Venn).
Gene Ontology (GO) and pathway
enrichment analysis
To explore the primary functions and pathways of the
DEGs involved, the Database for Annotation, Visualization and
Integrated Discovery (DAVID; version 6.8; david.ncifcrf.gov) and the Panther (www.pantherdb.org) databases were employed to perform
GO analysis. The Kyoto Encyclopedia of Genes and Genomes (7), and the Reactome pathway enrichment
analysis were used for the pathway enrichment analysis (8–10).
P<0.05 and a DEG count ≥2 were set as criteria.
PPI network construction and module
analysis
The Search Tool for the Retrieval of Interacting
Genes (STRING; string-db.org) was used to build a
PPI network, and subsequently the network was visualized using
Cytoscape v3.6.1 software (11). The
cut-off criterion for the PPI network was a combined score >0.4,
and the hub genes were defined by a node degree >10. The modules
of the PPI network were calculated using the Molecular Complex
Detection (MCODE) plug-in of Cytoscape with default parameters.
Subsequently, the hub genes in high-scored modules (degree
cut-off=2, node score cut-off=0.2) were selected for additional GO
and pathway enrichment analyses.
Results
Identification of DEGs in pancreatic
cancer
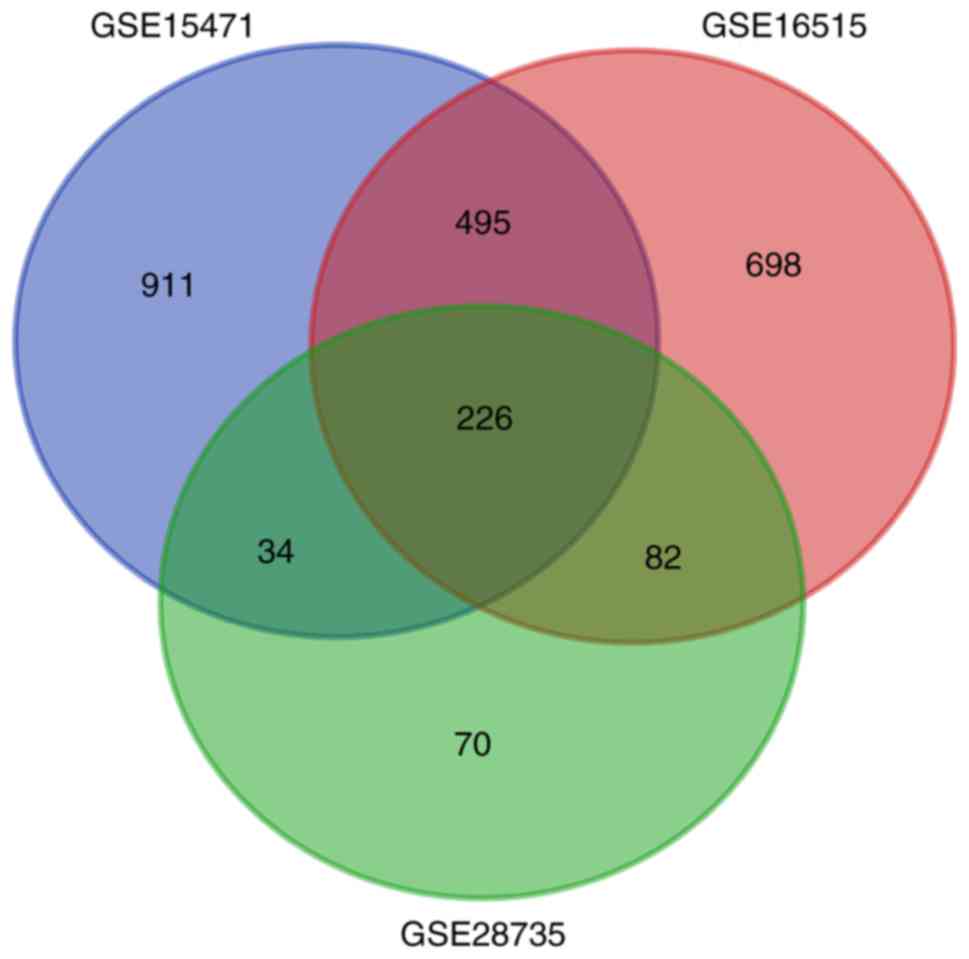
Gene expression profiles from three pancreatic
cancer GEO datasets were analysed. Based on the cut-off criteria,
1,666, 1,501 and 412 DEGs were extracted from the GSE15471,
GSE16515 and GSE28735 datasets, respectively. Subsequently, 226
DEGs were identified (Fig. 1) by
integrated bioinformatics analysis, including 179 upregulated and
47 downregulated DEGs (Table I).
 | Table I.Identification of DEGs. A total of 226
DEGs were identified, including 179 upregulated genes and 47
downregulated genes. |
Table I.
Identification of DEGs. A total of 226
DEGs were identified, including 179 upregulated genes and 47
downregulated genes.
| DEGs | Gene names |
|---|
| Upregulated | ABHD17C, ACSL5,
ADAM28, ADAM9, ADAMTS12, ADGRF1, AEBP1, AGR2, AHNAK2, AK4, ANKRD22,
ANLN, ANO1, ANTXR1, ANXA10, ANXA3, ANXA8, APOL1, AREG, ARNTL2,
ASAP2, ASPM, BGN, CAPG, CCL18, CCL20, CD109, CDH11, CDH3, CEACAM1,
CEACAM5, CEACAM6, CEMIP, CLDN18, COL10A1, COL11A1, COL12A1, COL1A1,
COL1A2, COL3A1, COL5A2, COL8A1, COMP, CORIN, CP, CST1, CST2,
CTHRC1, CTSE, CXCL5, DDX60, DGKH, DHRS9, DKK1, DPCR1, DPYSL3, ECT2,
EDIL3, EDNRA, EFNA5, EFNB2, ENO2, EPHA4, EPYC, ERO1A, ESM1, ETV1,
FAP, FBXO32, FERMT1, FGD6, FN1, FOXQ1, FXYD3, GABRP, GALNT5, GCNT3,
GJB2, GPRC5A, GPX2, GPX8, GREM1, HEPH, HK2, IFI27, IFI44L, IGF2BP3,
IGFBP5, IL1R2, INHBA, INPP4B, ITGA2, ITGA3, ITGB4, KCNN4, KRT19,
KRT7, KYNU, LAMA3, LAMB3, LAMC2, LCN2, LEF1, LOXL2, LRRN1, MALL,
MATN3, MBOAT2, MELK, MET, MICAL2, MLPH, MMP1, MMP11, MMP12, MMP14,
MMP7, MMP9, MTMR11, MXRA5, MYOF, NMU, NOX4, NPR3, NQO1, NRP2, NT5E,
NTM, OAS1, OAS2, OLR1, OSBPL3, PCDH7, PGM2L1, PKM, PLA2R1, PLAC8,
PLAT, PLAU, PLPP4, PLS1, POSTN, RAI14, RHBDL2, RUNX2, S100A16,
S100P, SCEL, SCNN1A, SDR16C5, SERPINB3, SERPINB5, SLC22A3, SLC2A1,
SLC44A4, SLC6A14, SLC6A6, SLPI, SRPX2, ST6GALNAC1, STYK1, SULF1,
SULF2, SULT1C2, SYTL2, TCN1, TFF1, TGFBI, THBS2, TMC5, TMEM45B,
TMPRSS4, TNFAIP6, TOP2A, TRIM29, TSPAN1, TSPAN8, VCAN, VSIG1 |
| Downregulated | ABAT, ACADL, ADAMTS6,
ALB, ANPEP, AOX1, BACE1, BNIP3, BTG2, C5, CHRM3, CTNND2, DPP10,
EGF, EPB41L4B, EPHX2, ERO1B, F11, F8, FAM129A, FAM150B, FGL1, GATM,
GNMT, GP2, GSTA1, HOMER2, IAPP, KIAA1324, LIFR, MCOLN3, MT1G,
NR5A2, NUCB2, PAIP2B, PDK4, PNLIPRP1, RBPJL, RGN, SERPINI2,
SLC16A10, SLC1A2, SLC39A5, SLC43A1, SLC4A4, TMED6, TRHDE |
GO analysis of DEGs in pancreatic
cancer
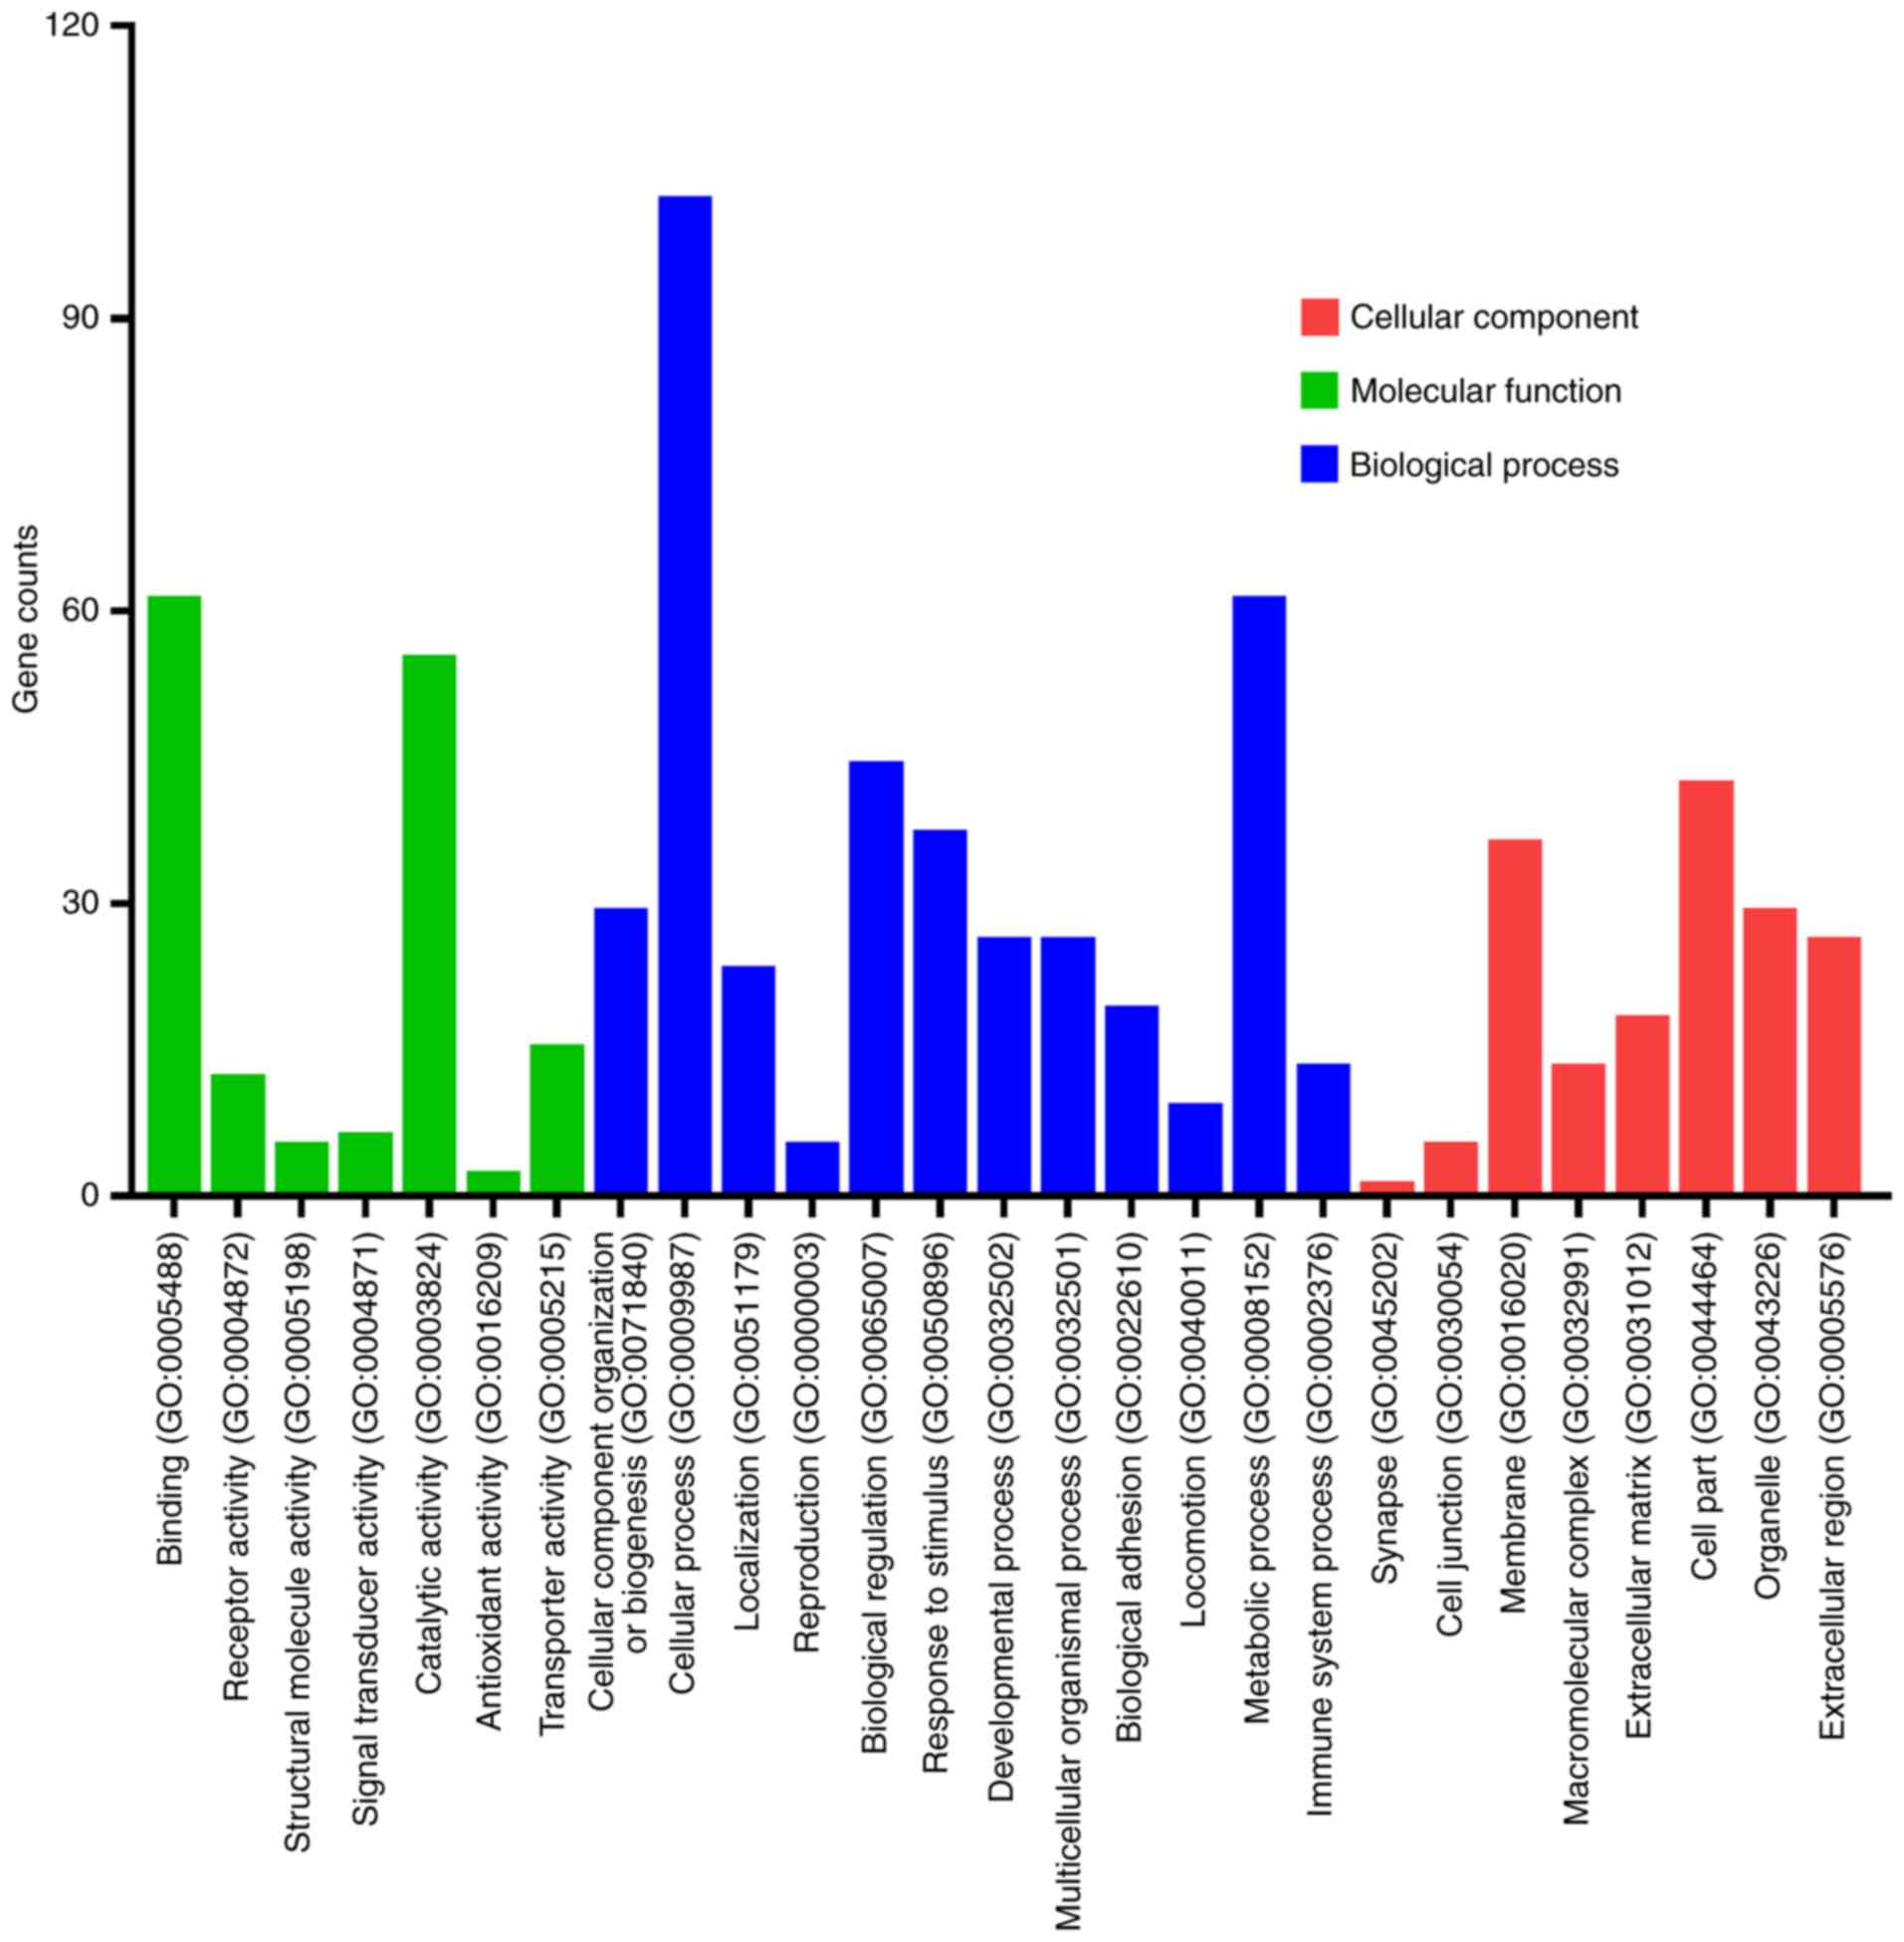
Candidate DEGs function enrichment analysis was
conducted with DAVID and Panther software. The functions of the
DEGs were classified into three groups as follows: ‘Cellular
Component’; ‘Molecular Function’; and ‘Biological Process’
(Fig. 2). DEGs were primarily
involved in binding and catalytic activity with regard to the
‘Molecular Function’ group, cellular and metabolic processes with
regard to the ‘Biological Process’ group, and cell membrane with
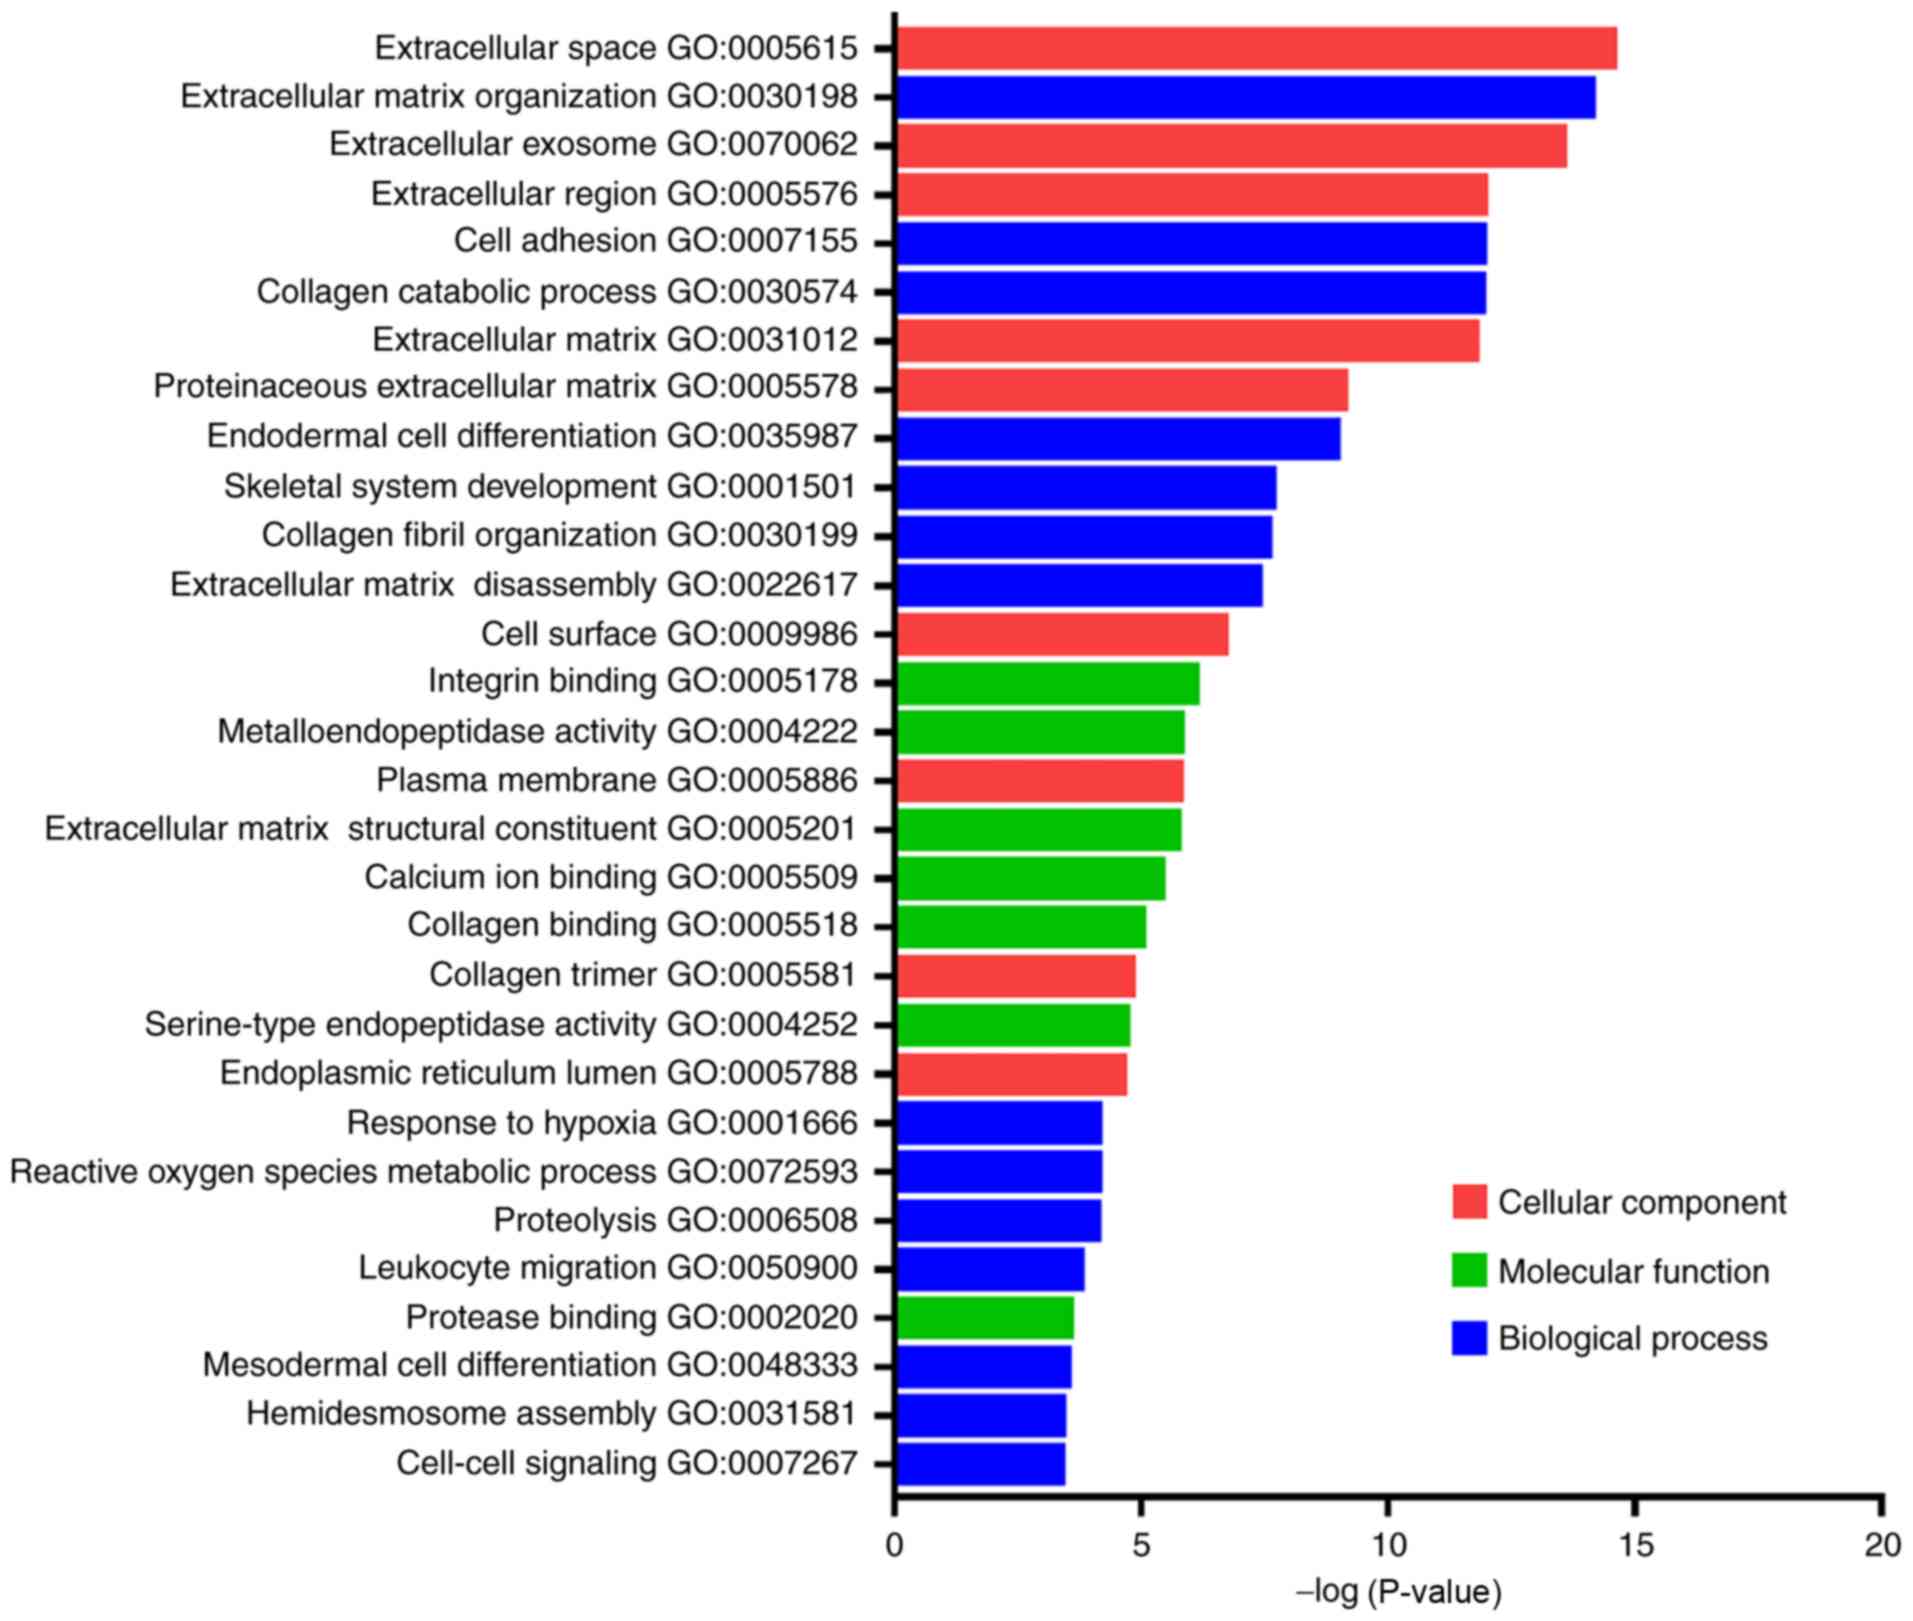
regard to the ‘Cellular Component’ group. Furthermore, the top 30
GO terms of these DEGs (Fig. 3), and
the top 10 GO terms of the upregulated and downregulated DEGs were
classified (Table II). The
upregulated DEGs that were primarily enriched were associated with
extracellular matrix (ECM) organisation, cell adhesion, collagen
catabolic process and ECM disassembly in the ‘Biological Process’
group, whereas with regard to the ‘Cellular Component’ group ECM,
extracellular space, extracellular region and extracellular exosome
formation were the primary processes identified. The downregulated
DEGs that were primarily enriched were associated with reactive
oxygen species, metabolic processes, proteolysis and cellular
response to starvation in the ‘Biological Process’ group. The
enriched downregulated DEGs were also associated with extracellular
exosome formation, extracellular space, integral component of
plasma membrane and extracellular region with regard to the
‘Cellular Component’ group. These results indicated that the
majority of DEGs were significantly enriched in processes,
including extracellular exosome formation, ECM, ECM organisation,
extracellular space and extracellular region.
| Table II.Enrichment analysis of DEGs in
pancreatic cancer. |
Table II.
Enrichment analysis of DEGs in
pancreatic cancer.
| DEGs | Term | Description | Category | P-value |
|---|
| Upregulated | GO:0030198 | Extracellular matrix
organization | BP |
8.62×10⁻¹⁶ |
|
| GO:0031012 | Extracellular
matrix | CC |
1.09×10⁻¹⁴ |
|
| GO:0007155 | Cell adhesion | BP |
2.15×10⁻¹⁴ |
|
| GO:0030574 | Collagen catabolic
process | BP |
6.69×10⁻¹⁴ |
|
| GO:0005615 | Extracellular
space | CC |
3.16×10⁻¹³ |
|
| GO:0005576 | Extracellular
region | CC |
3.37×10⁻¹¹ |
|
| GO:0005578 | Proteinaceous
extracellular matrix | CC |
1.11×10⁻¹⁰ |
|
| GO:0035987 | Endodermal cell
differentiation | BP |
1.85×10⁻¹⁰ |
|
| GO:0070062 | Extracellular
exosome | CC |
1.37×10⁻⁹ |
|
| GO:0022617 | Extracellular
matrix disassembly | BP |
4.93×10⁻⁹ |
| Downregulated | GO:0070062 | Extracellular
exosome | CC |
5.19×10⁻⁶ |
|
| GO:0072593 | Reactive oxygen
species metabolic process | BP |
9.67×10⁻⁵ |
|
| GO:0006508 | Proteolysis | BP |
1.62×10⁻³ |
|
| GO:0005615 | Extracellular
space | CC |
5.84×10⁻³ |
|
| GO:0015171 | Amino acid
transmembrane transporter | MF |
6.37×10⁻³ |
|
| GO:0009267 | Cellular response
to starvation | BP |
6.44×10⁻³ |
|
| GO:0005887 | Integral component
of plasma membrane | CC |
8.01×10⁻³ |
|
| GO:0031093 | Platelet α granule
lumen | CC |
8.50×10⁻³ |
|
| GO:0016323 | Basolateral plasma
membrane | CC |
1.05×10⁻² |
|
| GO:0005576 | Extracellular
region | CC |
1.77×10⁻² |
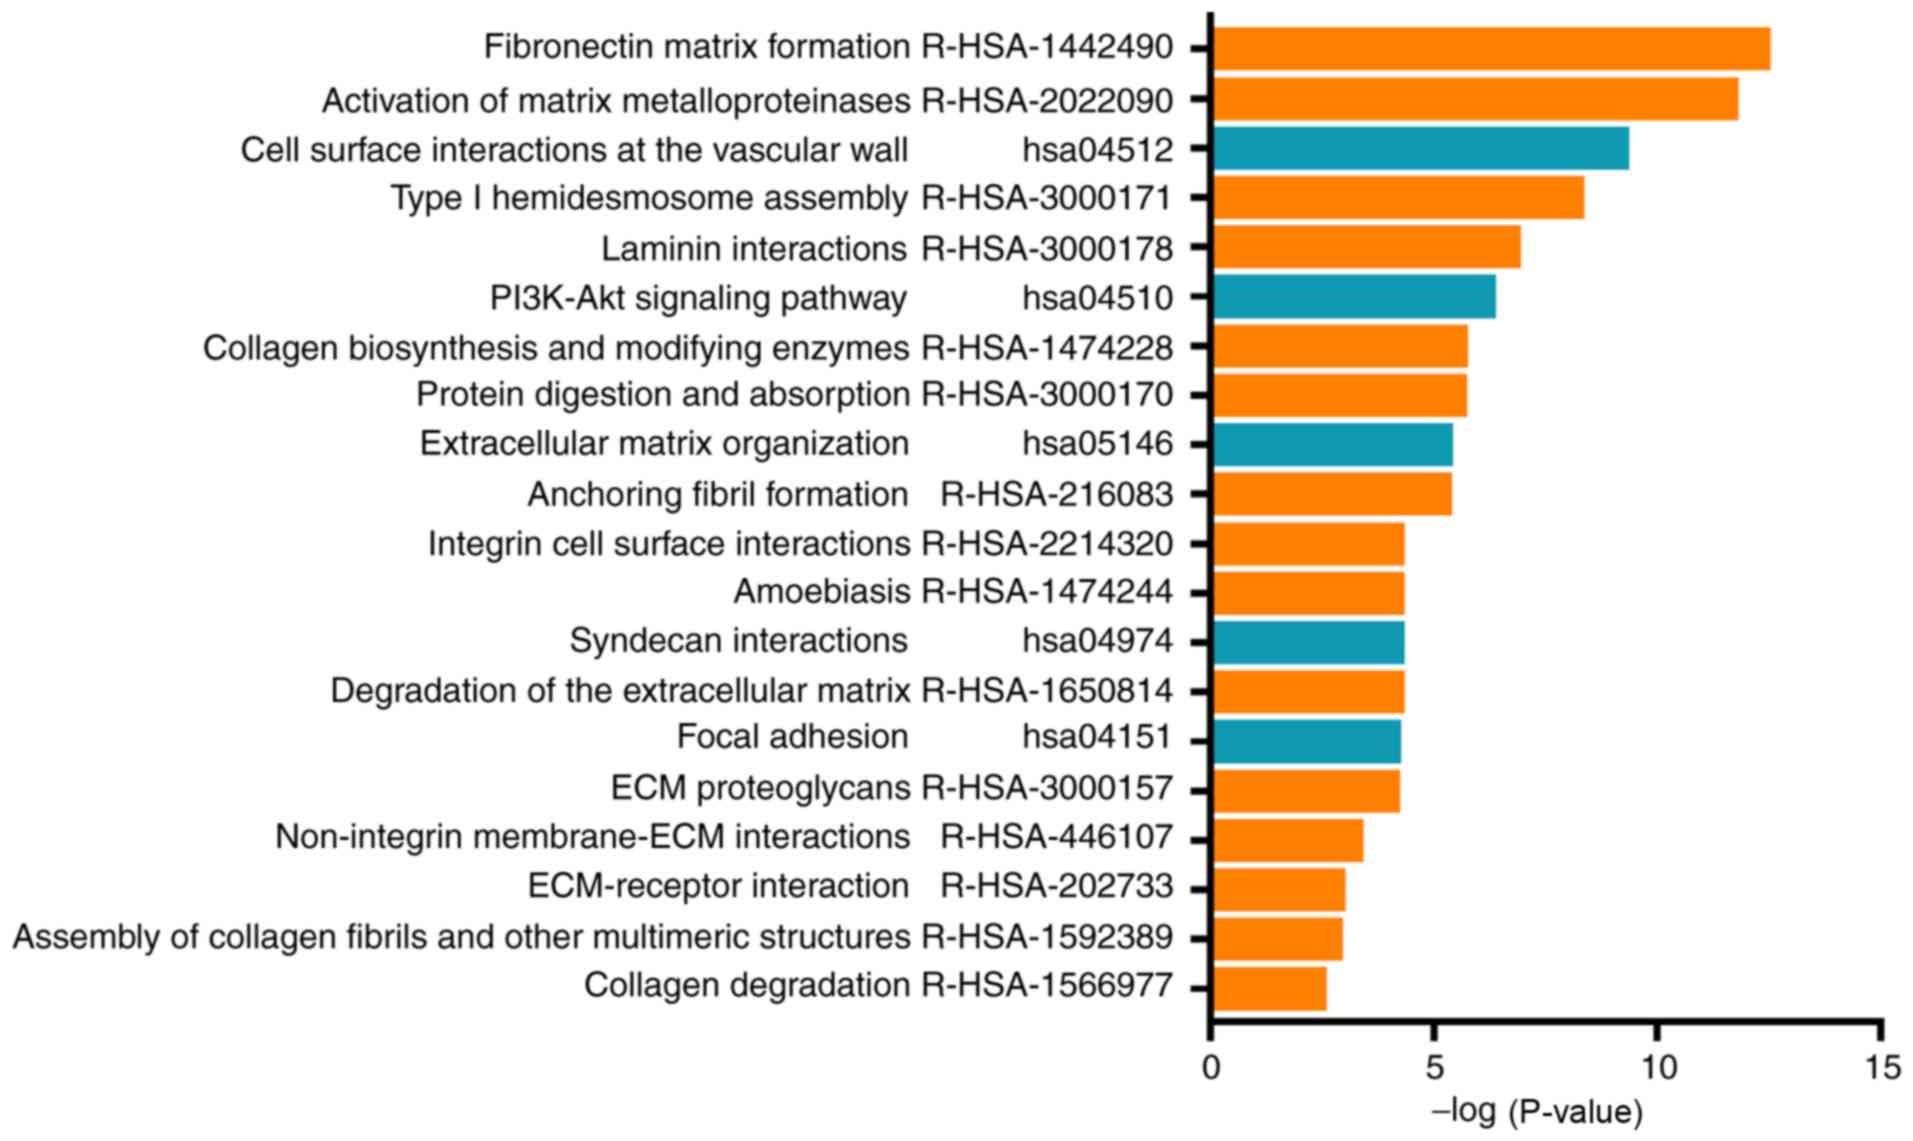
Pathway enrichment analysis of DEGs in
pancreatic cancer
The DEG signaling pathway enrichment was performed
with DAVID. The 30 significantly enriched pathway terms are
demonstrated in Fig. 4. The data
indicated that these enriched genes were involved in matrix
formation, activation of matrix metalloproteinase enzymes, ECM
organisation, degradation of the ECM, ECM proteoglycan formation,
non-integrin membrane-ECM interactions and ECM-receptor
interaction. The data suggested that the DEGs primarily
participated in the regulation of the ECM.
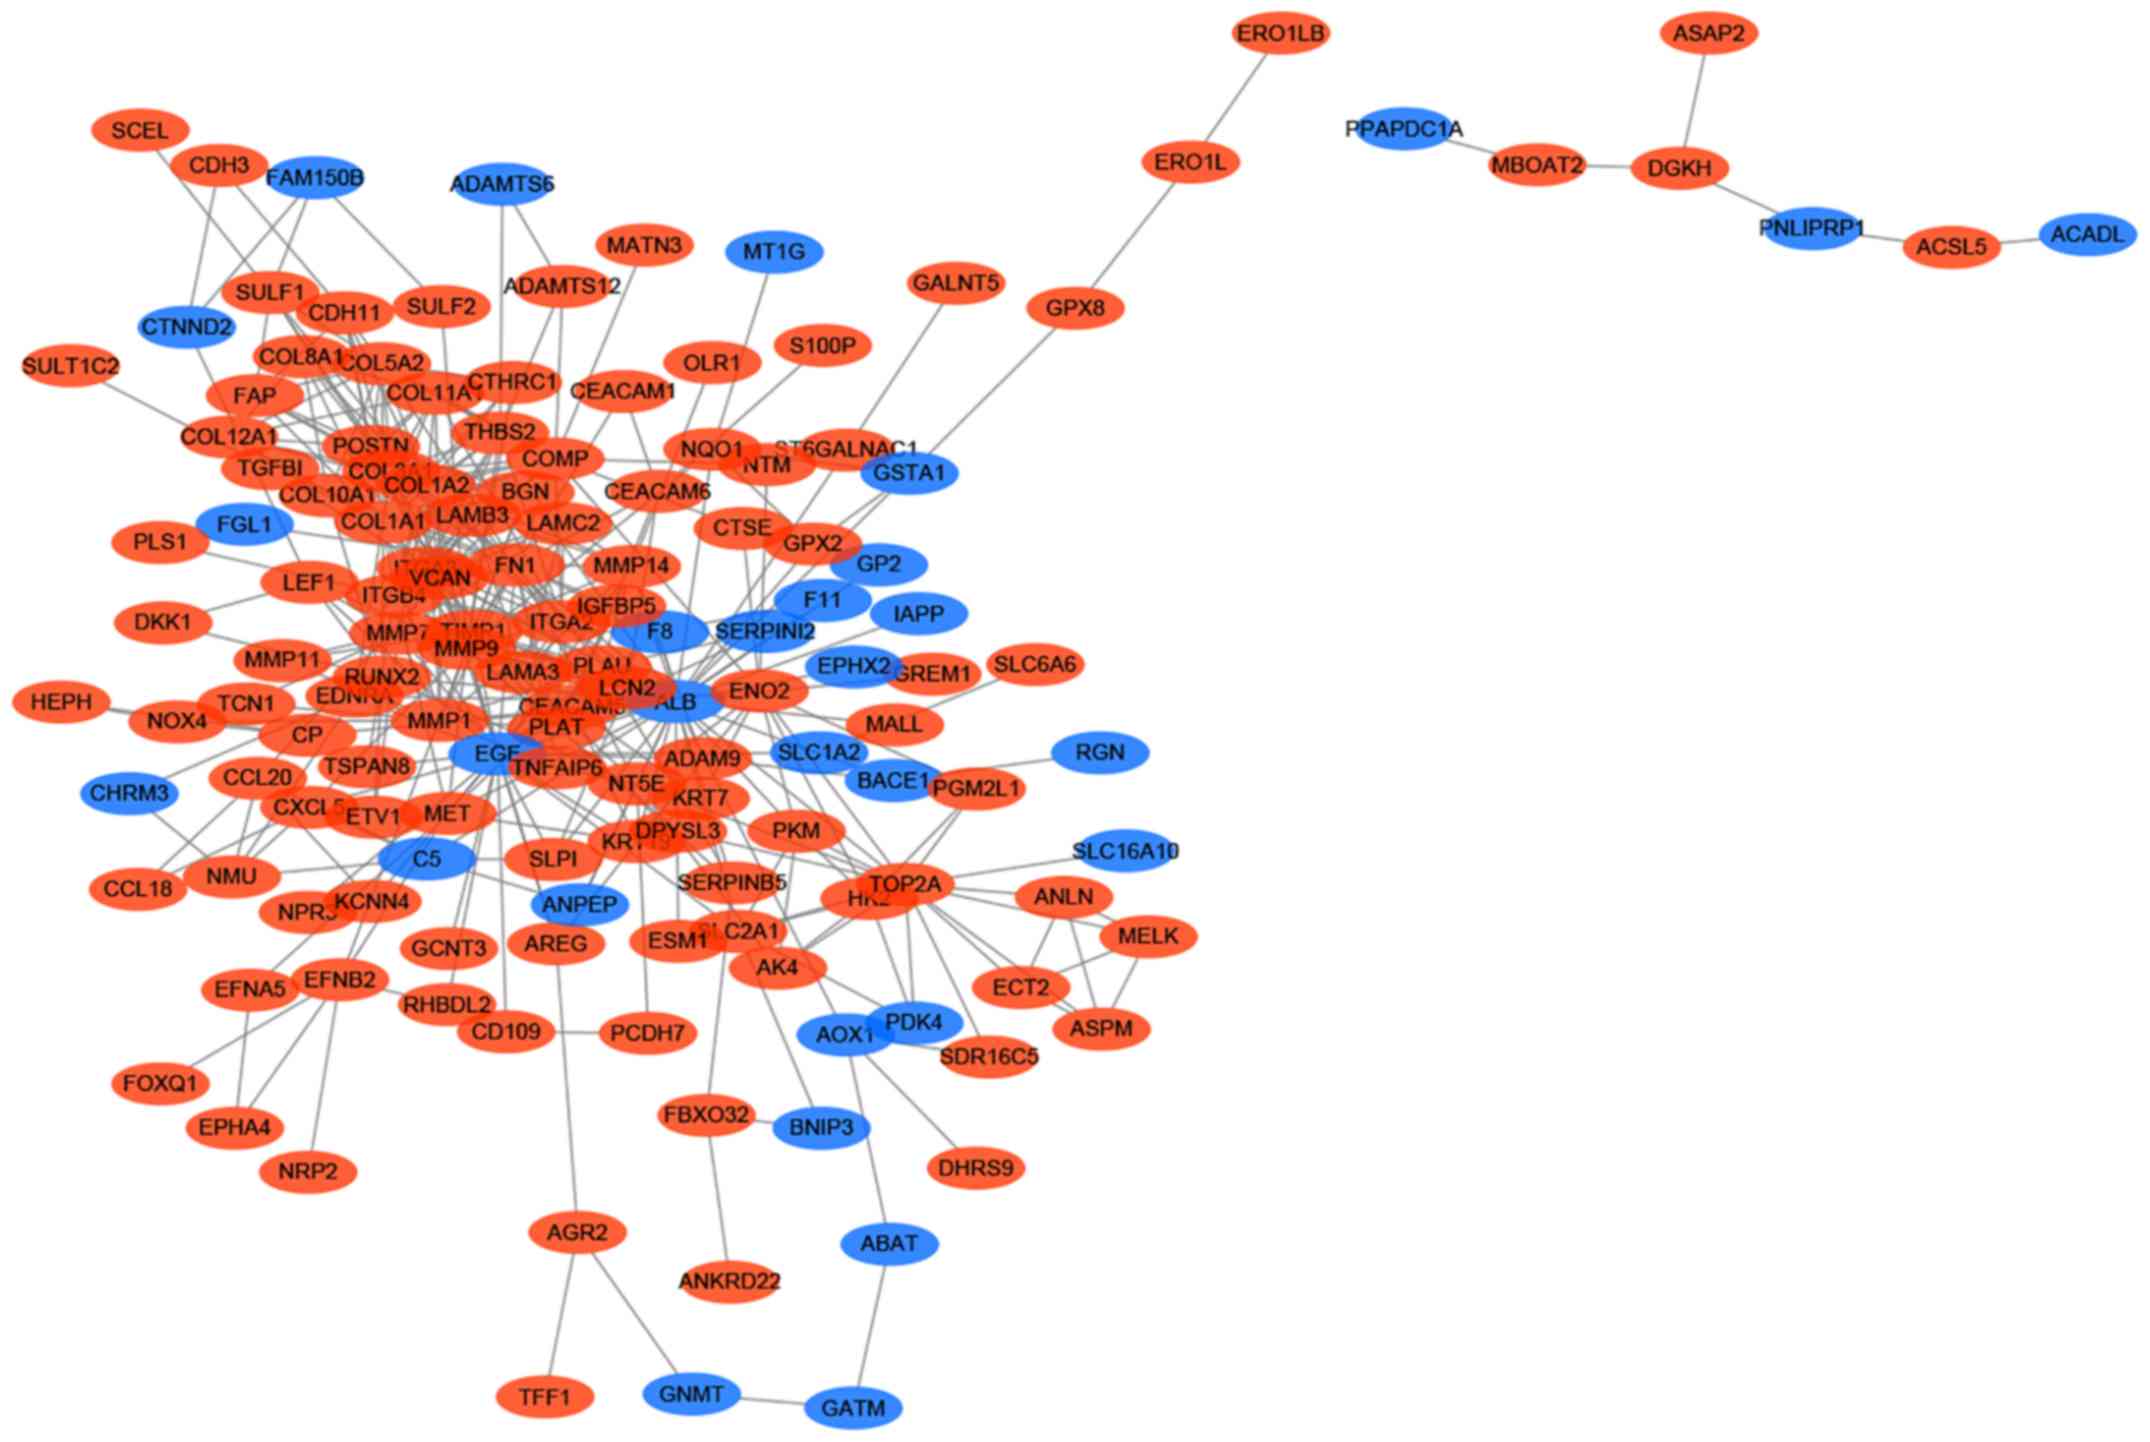
PPI network construction and module
analysis
The PPI network of the DEGs was constructed
according to the STRING database and subsequently visualized and
analysed using Cytoscape. The results indicated that 163 genes,
including 133 upregulated and 30 downregulated genes, of the 229
DEGs were filtered into the PPI network, and the PPI network
complex contained 163 nodes and 438 edges (Fig. 5). Among the 163 nodes, 24 hub genes
were identified with the following filter: Node degree >10. The
top 10 most significant hub genes were albumin, epidermal growth
factor, matrix metalloproteinase (MMP) 9, collagen type I α
2 chain (COL1A2), fibronectin 1, collagen type I α 1 chain
(COL1A1), collagen type III α 1 chain (COL3A1),
tissue inhibitors of metalloproteinases 1 (TIMP1), integrin
subunit α 2 and MMP2. Subsequently, MCODE was used to
determine the role of the hub genes, and the top 2 significant
modules were selected for subsequent analysis. Module 1 consisted
of 10 genes, whereas module 2 consisted of 7 genes. GO analysis
indicated that module 1 was primarily associated with ECM
disassembly and ECM formation, whereas module 2 was primarily
associated with ECM organisation and ECM formation (Table III). Furthermore, pathway
enrichment analysis demonstrated that module 1 was mainly enriched
in the activation of matrix and the degradation of the ECM, whereas
module 2 was mainly enriched in ECM proteoglycan formation,
ECM-receptor interaction and ECM organisation (Table IV). These data indicated that the
hub genes served key roles in the regulation of the ECM.
| Table III.Gene Ontology analysis of the top 2
modules genes. |
Table III.
Gene Ontology analysis of the top 2
modules genes.
| Modules | Term | Description | Category | P-value |
|---|
| Module 1 | GO:0004252 | Serine-type
endopeptidase activity | MF |
7.34×10⁻⁶ |
|
| GO:0022617 | Extracellular
matrix disassembly | BP |
3.13×10⁻⁵ |
|
| GO:0005576 | Extracellular
region | CC |
5.57×10⁻⁵ |
|
| GO:0070062 | Extracellular
exosome | CC |
8.66×10⁻⁵ |
|
| GO:0009986 | Cell surface | CC |
8.69×10⁻⁵ |
|
| GO:0006508 | Proteolysis | BP |
2.14×10⁻⁴ |
|
| GO:0005615 | Extracellular
space | CC |
3.18×10⁻⁴ |
|
| GO:0031093 | Platelet α granule
lumen | CC |
3.31×10⁻⁴ |
|
| GO:0031012 | Extracellular
matrix | CC |
5.06×10⁻⁴ |
|
| GO:0030574 | Collagen catabolic
process | BP |
7.34×10⁻⁶ |
| Module 2 | GO:0001501 | Skeletal system
development | BP |
2.22×10⁻¹⁰ |
|
| GO:0030198 | Extracellular
matrix organization | BP |
1.22×10⁻⁹ |
|
| GO:0031012 | Extracellular
matrix | CC |
6.47×10⁻⁹ |
|
| GO:0005615 | Extracellular
space | CC |
1.61×10⁻⁷ |
|
| GO:0005578 | Proteinaceous
extracellular matrix | CC |
6.70×10⁻⁷ |
|
| GO:0005201 | Extracellular
matrix structural | MF |
1.19×10⁻⁶ |
|
| GO:0007155 | Cell adhesion | BP |
7.91×10⁻⁶ |
|
| GO:0005576 | Extracellular
region | CC |
2.97×10⁻⁵ |
|
| GO:0005518 | Collagen
binding | MF |
1.85×10⁻⁴ |
|
| GO:0030574 | Collagen catabolic
process | BP |
2.12×10⁻⁴ |
| Table IV.Pathway enrichment analysis of the
top 2 module genes. |
Table IV.
Pathway enrichment analysis of the
top 2 module genes.
| Modules | Pathway | Name | P-value |
|---|
| Module 1 | R-HSA-1592389 | Activation of
matrix |
3.63×10⁻⁶ |
|
| R-HSA-1442490 | Collagen
degradation |
1.71×10⁻³ |
|
| R-HSA-1474228 | Degradation of the
extracellular |
2.52×10⁻³ |
|
| R-HSA-114608 | Platelet
degranulation |
6.86×10⁻³ |
|
| R-HSA-75205 | Dissolution of
fibrin clot |
1.28×10⁻² |
|
| hsa04510 | Focal adhesion |
2.10×10⁻² |
|
| hsa04810 | Regulation of actin
cytoskeleton |
2.30×10⁻² |
|
| R-HSA-210991 | Basigin
interactions |
2.45×10⁻² |
|
| R-HSA-3000157 | Laminin
interactions |
2.94×10⁻² |
|
| R-HSA-2022090 | Assembly of
collagen fibrils and other multimeric structures |
4.47×10⁻² |
| Module 2 | R-HSA-3000178 | ECM
proteoglycans |
2.14×10⁻⁸ |
|
| R-HSA-216083 | Integrin cell
surface interactions |
8.11×10⁻⁶ |
|
| hsa04512 | ECM-receptor
interaction |
1.89×10⁻⁵ |
|
| R-HSA-1474244 | Extracellular
matrix organization |
2.54×10⁻⁵ |
|
| R-HSA-3000170 | Syndecan
interactions |
8.48×10⁻⁵ |
|
| R-HSA-3000171 | Non-integrin
membrane-ECM |
1.88×10⁻⁴ |
|
| R-HSA-2022090 | Assembly of
collagen fibrils and other multimeric structures |
2.49×10⁻⁴ |
|
| hsa04510 | Focal adhesion |
2.50×10⁻⁴ |
|
| R-HSA-1442490 | Collagen
degradation |
4.83×10⁻⁴ |
|
| hsa04151 | PI3K-Akt signaling
pathway |
1.14×10⁻³ |
Discussion
Pancreatic cancer is usually asymptomatic and is
diagnosed in the advanced stages of progression due to lack of
specific and sensitive detection markers that may be used during
the early stages of the disease (12). The cancer cells are able to readily
invade blood vessels and lymph nodes and metastasize to distant
organs (13). Furthermore,
pancreatic cancer is often resistant to conventional treatment, and
it is characterised as one of the most lethal neoplasms (14). Previously, numerous studies have been
performed to explore the underlying mechanism of pancreatic cancer
progression and its treatment resistance. However, the disease
prognosis has not changed significantly (15). The majority of these studies have
focused on a single gene to investigate its potential role in
pancreatic cancer, although cancer is a complex disease, and is not
determined by only one or a few genes.
Therefore, the present study integrated three
pancreatic cancer microarray datasets from different studies, using
bioinformatics analysis. Consequently, 226 DEGs were identified,
which included 176 upregulated and 47 downregulated genes. The
function and pathway enrichment analysis were conducted, and the
results indicated that these genes primarily participated in the
ECM process. Furthermore, a PPI network was constructed in order to
determine the role of the hub genes, and MCODE was used to
determine the interactions of these genes with several pathways.
The results identified 24 hub genes among the 226 DEGs that were
associated with ECM regulation.
The ECM is a 3-dimensional non-cellular structure,
which serves important roles in all tissues and biological process
and is primarily responsible for the maintenance of tissue
homeostasis and the regulation of development (16). As a complex network, the ECM consists
of extracellular macromolecules, including glycoproteins, collagen
and enzymes, which provide structural support to the surrounding
cells and segregate cells from one another. This sequesters a
variety of cellular growth factors and regulates intercellular
communication (17,18). Although the composition of the ECM
varies between tissues and species, its common functions comprise
cell differentiation, cell adhesion and cell to cell communication
(19). Stem cells are able to
actively detect the elasticity and rigidity of the surrounding ECM,
and subsequently adjust gene expression, which determines the
differentiation process (20). Cells
bind to the ECM via intermediate actin filaments, which is
regulated by specific cell adhesion molecules, including integrin,
fibronectin and laminin (21). The
ECM interacts biochemically with the surrounding cells by serving
as a ligand to transmit signals, which mediate cell adhesion,
differentiation, apoptosis, survival, proliferation and migration
(22).
Although the ECM is responsible for regulating
normal tissue development and homeostasis, its dysregulation also
contributes to neoplastic progression. The development of cancer is
significantly affected by the microenvironment and the ECM is
considered the major component of tumor associated microenvironment
(23). Although ECM remodelling is
strictly regulated and mediated by the activities of specific
enzymes, the dysregulation of these activities may account for the
progression and development of certain disease conditions. This may
lead to changes in the amount and composition of the ECM, which may
significantly alter the biochemical properties of the ECM and
promote the oncogenic effects of various pathways, and deregulate
cell behaviours during malignant transformation (24). Several studies have suggested that
the ECM is important for the maintenance of the polarity and
architecture of tissues, and that deregulated ECM promotes
epithelial-mesenchymal transition, eventually facilitating tumor
invasion (25). Furthermore, the
abnormal ECM function may promote tumor angiogenesis and
lymphangiogenesis (26) and
tumor-associated inflammation (27).
In summary, abnormal ECM may promote tumor progression through a
number of mechanisms.
The present study revealed that the specific DEGs
identified primarily participated in ECM formation, as demonstrated
by analysis of specific hub genes, including MMP2, MMP9, TIMP1,
COL1A2, COL1A1 and COL3A1. MMPs are the primary enzymes
that degrade the ECM and are synthesized by tumor cells (MMP7) or
tumor stromal cells (MMP2 and MMP9). A previous study has
demonstrated that MMPs serves important roles in cancer progression
by increasing tumor cell migration, invasion, metastasis and
angiogenesis (28). In pancreatic
cancer, MMPs were correlated with prognosis, survival time, local
invasion and distant metastasis (29). TIMPs are the endogenous inhibitors of
MMPs, which bind to active and alternative sites of the activated
MMP enzymes, prevent angiostatin and endostatin production, and
serve a role in the promotion of tumor angiogenesis (30). The balance between MMPs and TIMPs may
determine the ECM dynamics and affect tumor progression (31). COL1A1, COL1A2 and
COL3A1 are the genes that encode collagen proteins, and the
target genes of transforming growth factor-β (TGF-β)/SMAD3.
Collagens mediate the tumor metastatic process via the interactions
with MMPs and may also serve significant roles in the immune
response to cancer (32).
β-TGF/SMAD3 may promote the expression of ECM-associated proteins
(33). The aforementioned hub genes
participated in ECM formation and may serve as potential targets
for the treatment of pancreatic cancer.
Acknowledgements
Not applicable.
Funding
No funding was received.
Availability of data and materials
The datasets used and/or analyzed during the current
study are available from the corresponding author on reasonable
request.
Authors' contributions
JG designed the study and revised the manuscript. KL
performed the GEO database analysis, analysed the data and wrote
the manuscript. JY and JS performed bioinformatics analyses and
assisted with analysis of other data. All authors have read and
approved the manuscript.
Ethics approval and consent to
participate
Not applicable.
Patient consent for publication
Not applicable.
Competing interests
The authors declare that they have no competing
interests.
References
|
1
|
Siegel RL, Miller KD and Jemal A: Cancer
statistics, 2018. CA Cancer J Clin. 68:7–30. 2018. View Article : Google Scholar : PubMed/NCBI
|
|
2
|
Gillen S, Schuster T, Meyer Zum
Buschenfelde C, Friess H and Kleeff J: Preoperative/neoadjuvant
therapy in pancreatic cancer: A systematic review and meta-analysis
of response and resection percentages. PLoS Med. 7:e10002672010.
View Article : Google Scholar : PubMed/NCBI
|
|
3
|
Kamisawa T, Wood LD, Itoi T and Takaori K:
Pancreatic cancer. Lancet. 388:73–85. 2016. View Article : Google Scholar : PubMed/NCBI
|
|
4
|
Barrett T, Troup DB, Wilhite SE, Ledoux P,
Rudnev D, Evangelista C, Kim IF, Soboleva A, Tomashevsky M and
Edgar R: NCBI GEO: Mining tens of millions of expression
profiles-database and tools update. Nucleic Acids Res.
35:D760–D765. 2007. View Article : Google Scholar : PubMed/NCBI
|
|
5
|
Li J, Tan W, Peng L, Zhang J, Huang X, Cui
Q, Zheng J, Tan W, Wu C and Lin D: Integrative analysis of gene
expression profiles reveals specific signaling pathways associated
with pancreatic duct adenocarcinoma. Cancer Commun (Lond).
38:132018. View Article : Google Scholar : PubMed/NCBI
|
|
6
|
Wang H, Zhan M, Yang R, Shi Y, Liu Q and
Wang J: Elevated expression of NFE2L3 predicts the poor prognosis
of pancreatic cancer patients. Cell Cycle. 17:2164–2174. 2018.
View Article : Google Scholar : PubMed/NCBI
|
|
7
|
Kanehisa M, Sato Y, Furumichi M, Morishima
K and Tanabe M: New approach for understanding genome variations in
KEGG. Nucleic Acids Res. 47:D590–D595. 2019. View Article : Google Scholar : PubMed/NCBI
|
|
8
|
Huang da W, Sherman BT and Lempicki RA:
Systematic and integrative analysis of large gene lists using DAVID
bioinformatics resources. Nat Protoc. 4:44–57. 2009. View Article : Google Scholar : PubMed/NCBI
|
|
9
|
Huang da W, Sherman BT and Lempicki RA:
Bioinformatics enrichment tools: Paths toward the comprehensive
functional analysis of large gene lists. Nucleic Acids Res.
37:1–13. 2009. View Article : Google Scholar : PubMed/NCBI
|
|
10
|
Mi H, Huang X, Muruganujan A, Tang H,
Mills C, Kang D and Thomas PD: PANTHER version 11: Expanded
annotation data from Gene Ontology and Reactome pathways, and data
analysis tool enhancements. Nucleic Acids Res. 45:D183–D189. 2017.
View Article : Google Scholar : PubMed/NCBI
|
|
11
|
Shannon P, Markiel A, Ozier O, Baliga NS,
Wang JT, Ramage D, Amin N, Schwikowski B and Ideker T: Cytoscape: A
software environment for integrated models of biomolecular
interaction networks. Genome Res. 13:2498–2504. 2003. View Article : Google Scholar : PubMed/NCBI
|
|
12
|
Ilic M and Ilic I: Epidemiology of
pancreatic cancer. World J Gastroenterol. 22:9694–9705. 2016.
View Article : Google Scholar : PubMed/NCBI
|
|
13
|
Khadka R, Tian W, Hao X and Koirala R:
Risk factor, early diagnosis and overall survival on outcome of
association between pancreatic cancer and diabetes mellitus:
Changes and advances, a review. Int J Surg. 52:342–346. 2018.
View Article : Google Scholar : PubMed/NCBI
|
|
14
|
Kleeff J, Korc M, Apte M, La Vecchia C,
Johnson CD, Biankin AV, Neale RE, Tempero M, Tuveson DA, Hruban RH
and Neoptolemos JP: Pancreatic cancer. Nat Rev Dis Primers.
2:160222016. View Article : Google Scholar : PubMed/NCBI
|
|
15
|
Cancer Research UK, . Pancreatic cancer
statistics 2015. https://www.cancerresearchuk.org/health-professional/cancer-statistics/statistics-by-cancer-type/pancreatic-cancerSeptember
20–2018
|
|
16
|
Mammoto T and Ingber DE: Mechanical
control of tissue and organ development. Development.
137:1407–1420. 2010. View Article : Google Scholar : PubMed/NCBI
|
|
17
|
Geiger B, Spatz JP and Bershadsky AD:
Environmental sensing through focal adhesions. Nat Rev Mol Cell
Biol. 10:21–33. 2009. View
Article : Google Scholar : PubMed/NCBI
|
|
18
|
Theocharis AD, Skandalis SS, Gialeli C and
Karamanos NK: Extracellular matrix structure. Adv Drug Deliv Rev.
97:4–27. 2016. View Article : Google Scholar : PubMed/NCBI
|
|
19
|
Abedin M and King N: Diverse evolutionary
paths to cell adhesion. Trends Cell Biol. 20:734–742. 2010.
View Article : Google Scholar : PubMed/NCBI
|
|
20
|
Engler AJ, Sen S, Sweeney HL and Discher
DE: Matrix elasticity directs stem cell lineage specification.
Cell. 126:677–689. 2006. View Article : Google Scholar : PubMed/NCBI
|
|
21
|
Gumbiner BM: Cell adhesion: The molecular
basis of tissue architecture and morphogenesis. Cell. 84:345–357.
1996. View Article : Google Scholar : PubMed/NCBI
|
|
22
|
Hynes RO: The extracellular matrix: Not
just pretty fibrils. Science. 326:1216–1219. 2009. View Article : Google Scholar : PubMed/NCBI
|
|
23
|
Lu P, Weaver VM and Werb Z: The
extracellular matrix: A dynamic niche in cancer progression. J Cell
Biol. 196:395–406. 2012. View Article : Google Scholar : PubMed/NCBI
|
|
24
|
Pickup MW, Mouw JK and Weaver VM: The
extracellular matrix modulates the hallmarks of cancer. EMBO Rep.
15:1243–1253. 2014. View Article : Google Scholar : PubMed/NCBI
|
|
25
|
Radisky ES and Radisky DC: Matrix
metalloproteinase-induced epithelial-mesenchymal transition in
breast cancer. J Mammary Gland Biol Neoplasia. 15:201–212. 2010.
View Article : Google Scholar : PubMed/NCBI
|
|
26
|
Avraamides CJ, Garmy-Susini B and Varner
JA: Integrins in angiogenesis and lymphangiogenesis. Nat Rev
Cancer. 8:604–617. 2008. View
Article : Google Scholar : PubMed/NCBI
|
|
27
|
Sorokin L: The impact of the extracellular
matrix on inflammation. Nat Rev Immunol. 10:712–723. 2010.
View Article : Google Scholar : PubMed/NCBI
|
|
28
|
Egeblad M and Werb Z: New functions for
the matrix metalloproteinases in cancer progression. Nat Rev
Cancer. 2:161–174. 2002. View
Article : Google Scholar : PubMed/NCBI
|
|
29
|
Garcea G, Neal CP, Pattenden CJ, Steward
WP and Berry DP: Molecular prognostic markers in pancreatic cancer:
A systematic review. Eur J Cancer. 41:2213–2236. 2005. View Article : Google Scholar : PubMed/NCBI
|
|
30
|
Jiang Y, Goldberg ID and Shi YE: Complex
roles of tissue inhibitors of metalloproteinases in cancer.
Oncogene. 21:2245–2252. 2002. View Article : Google Scholar : PubMed/NCBI
|
|
31
|
Bonnans C, Chou J and Werb Z: Remodelling
the extracellular matrix in development and disease. Nat Rev Mol
Cell Biol. 15:786–801. 2014. View
Article : Google Scholar : PubMed/NCBI
|
|
32
|
Nerenberg PS, Salsas-Escat R and Stultz
CM: Collagen - A necessary accomplice in the metastatic process.
Cancer Genomics Proteomics. 4:319–327. 2007.PubMed/NCBI
|
|
33
|
Verrecchia F, Chu ML and Mauviel A:
Identification of novel TGF-beta/Smad gene targets in dermal
fibroblasts using a combined cDNA microarray/promoter
transactivation approach. J Biol Chem. 276:17058–17062. 2001.
View Article : Google Scholar : PubMed/NCBI
|