Introduction
Osteoarthritis (OA) is one of the most prevalent
joint diseases, and has been predicted to be the greatest cause of
disability among patients aged >40 years by 2040 (1). One study have revealed that the
economic and humanistic burden of OA is high worldwide (2). A patient with OA typically presents
with cartilage degeneration and synovial inflammation (3). Clinically, OA is characterized by pain,
swelling, joint deformity and disability (4). In addition to operative treatment, the
most common pharmacological therapies for OA are analgesic and
non-steroidal anti-inflammatory drugs (5). Although a considerable amount of
studies investigating OA have been published (6), a systematic understanding of the
pathogenesis of OA and its potential therapeutic targets would be
of great clinical significance.
With the development of high-throughput genomics
technology, gene expression profiles obtained from microarrays have
been extensively used to explore and examine genes associated with
the progression of various diseases, including the pathogenesis of
OA (7,8). However, these studies may have been
more relevant if they had considered the correlation of the
expression between multiple genes, rather than just focused on the
screening of differentially expressed genes (DEGs). Based on the
idea that genes with similar expression patterns may be
functionally associated, a novel biological methodology, weighted
gene co-expression network analysis (WGCNA), has been developed
(9). Based on WGCNA, complex
microarray data may be simplified into several functional modules,
which are composed of co-expressed genes. Subsequently, hub modules
may be identified through the associations between modules and
clinical traits. Due to the limited access to normal cartilage to
serve as control groups, the majority of Bioinformatics studies are
focused on knee synovial tissue. However, to the best of our
knowledge, WGCNA has not been previously applied to analyze the
cartilaginous expression profiles of OA.
The primary objective of the present study was to
obtain data which will aid in providing a more detailed
understanding of the pathogenesis of OA. The methodological
approach taken in the present study is a mixed methodology based on
WGCNA and the screening of DEGs. Microarray data with the accession
number GSE114007 were downloaded in the present study, which were
subjected to Bioinformatics analysis with the attempt to identify
hub genes from a protein-protein interaction (PPI) network, and
construct a co-expression network through WGCNA in order to
identify hub modules associated with the pathogenesis of OA.
Considering that the co-expressed genes in the same module may
participate in the same biological function or signaling pathway,
and from the point of view of co-expressed genes having the
potential to be regulated by the same transcription factors (TFs),
the present study attempted to identify key TFs involved in the
pathogenesis of OA (10,11).
Materials and methods
Data collection
The dataset GSE114007 [deposited by Fisch et
al (11)], which is based on the
Illumina HiSeq 2000 and Illumina HiSeq 500 platforms (Illumina,
Inc.), was downloaded from the Gene Expression Omnibus (GEO)
database (http://www.ncbi.nlm.nih.gov/geo/) (12). The GSE114007 dataset was selected for
analysis as it contained the complete information comprising gene
expression data and detailed clinical data in this database.
RNA-sequencing (RNA-seq) was performed on 18 normal and 20 OA human
knee cartilage tissues. Subsequently, the gene expression data were
subjected to identical processing using the Robust Multichip
Average function within the limma R package (version 3.24.15)
(13) for background correction,
log2 transformation, quantile normalization and median polish
algorithm summarization. The microarray data probe was transformed
to gene symbols with Bioconductor Annotation Data software packages
(version 1.20.0) (14). In the case
that 1 single gene symbol was captured by several probes, the final
gene expression level was calculated from the average value of
those probes. When one probe was mapped to multiple gene sets,
information about the probe was deleted. A principal component
analysis (PCA) of normalized data was performed in the present
study using the prcomp algorithm in R software. PCA was used for
unsupervised multivariate analyses in order to determine the
directions of maximum covariance without referring to class labels
(Normal/OA).
Identification of DEGs
The DEGs between OA and normal samples were
identified through the limma R package using the Student's t-test
(13). A |Log2(fold
change)|>1 and adjusted P-value of <0.05 were set as the
cut-off criteria. To control the false discovery rate, adjusted
P-values were computed for multiple testing corrections of the raw
P-value through the Benjamini-Hochberg (BH) method (15). Volcano plots were also constructed to
visually display the DEGs. DEGs were counted in the respective hub
modules.
Weighted co-expression network
construction
WGCNA is a widely used systems biology method, which
may be used to construct a scale-free network from gene expression
data. Based on the dataset GSE114007, which is comprised of 18
normal and 20 OA samples, a gene co-expression network was
constructed through the WGCNA R package (version 1.68) (9). In order to determine whether there were
any outlier samples, the present study performed sample clustering
according to the distance between different samples in Pearson's
correlation matrices. The correlation coefficient between genes ‘m’
and ‘n’ was defined as sm,n=|cor(m,n)|, with the gene
expression correlation matrix being S=[smn]. The
correlation matrix was subsequently translated into an adjacency
matrix, A=[amn], through a power function
amn=|smn|β. β was defined as the
soft threshold parameter. The β-value was selected as long as
scale-free topology fit index (R2) reached 0.9. The
adjacency matrix was then transformed into a topological overlap
matrix (TOM) through the following algorithm:
ϖmn=lmn+αmnkmkn+1-αmn
lmn indicates the product sums of
the adjacency coefficients of the nodes connected to both m and n.
αmn indicates the correlation coefficient between
m and n. km indicates the sum of the adjacency
coefficients of the nodes only connected to m. kn
indicates the sum of the adjacency coefficients of the nodes only
connected to n. Co-expressed gene modules were identified by the
dynamic tree cut method, which performs adaptive branch pruning
based on various criteria, including a minimum cluster size of 30
genes and a cut height of 0.25. Modules with highly correlated
genes were detected and genes exhibiting weaker connectivity were
left unassigned. Hierarchical clustering was used to produce a
dendrogram of genes based on the corresponding dissimilarity of
TOM, and to classify genes with similar expression patterns into
gene modules. The module eigengene (ME) was calculated using the
MEs function in the ‘WGCNA’ R package. Finally, hub modules were
detected based on the correlation between ME and clinical traits.
The correlation values >0.6 were set as cutoff criteria.
PPI network construction and
identification of hub genes
The Search Tool for the Retrieval of Interacting
Genes (STRING) database (http://www.string-db.org/; version 11.0) was used for
the construction of the protein-protein interaction (PPI) network
for DEGs and hub modules using default parameters in the STRING
database. The types of connection included the following items:
Textmining, Experiments, Databases, Co-expression, Neighborhood,
Gene fusion and Co-occurrence. To extract valid interactions, a
confidence score of >0.4 was set as the cut-off criterion. The
nodes in the PPI network with the highest degrees of interactions
were considered as hub proteins. The present study also used the
Cytoscape plugin CytoHubba to calculate the degree of each node in
the PPI network (version 1.5) (16).
The top 10 genes in each module and top 10 DEGs were defined as hub
genes. In addition, OA-associated genes were downloaded from Junior
Doc (http://www.drwang.top/). By entering
‘OA’ in the search tool, 520 OA-associated genes were listed and
downloaded. Finally, OA-associated genes were counted in the
respective hub modules.
Functional enrichment analysis of DEGs
and hub modules
To determine the DEGs and hub modules involved in BP
terms and pathways, Gene ontology (GO) and Kyoto Encyclopedia of
Genes and Genomes (KEGG) pathway enrichment analyses were performed
using the ClusterProfiler R package (version 3.8.1) (17). An adjusted P-value <0.01 (to
control the false discovery rate, adjusted P-values were computed
for multiple testing corrections of the raw P-value through the BH
method) was set as the cutoff criterion for the functional
enrichment analysis.
Identification of key TFs
CisTargetX may be used to predict TFs involved in
the regulation of co-expressed genes (18,19).
Based on CisTargetX, the present study further explored the
potential TFs for each hub module. CisTargetX was used with the
following parameters: Mapping of genes in regions, ‘10 kb upstream,
transcription start site, 10 kb downstream’; minimum fraction of
overlap, ‘0.4’; normalized enrichment score threshold, ‘4’;
receiver operating characteristic threshold for area under the
curve calculation, ‘0.005’. Key TFs of each hub module were defined
as predicted TFs, which were also DEGs in the present study. Common
elements in DEGs and predicted TFs were compared using Microsoft
Excel (version 14.5.1; Microsoft Corporation). By comparing the
genes targeted by key TFs with DEGs, the DEGs that were targeted by
the key TFs were counted and extracted for further study.
Identification of pivotal signaling
pathways
To provide a deeper understanding of changes in gene
regulation underlying OA, information on key TFs likely involved in
regulating these DEGs was extracted. KEGG analysis was subsequently
performed for key TFs and their target DEGs in order to identify
pivotal signaling pathways. Based on STRING database and the
pheatmap R package (https://cran.r-project.org/web/packages/pheatmap/index.html;
version 1.0.12), a PPI network (confidence score >0.4 set as the
cut-off criterion) and heatmap were constructed for key TFs and
their target DEGs that were involved in key signaling pathways. The
transcriptional regulatory network was visualized by Cytoscape.
Results
Identification of DEGs
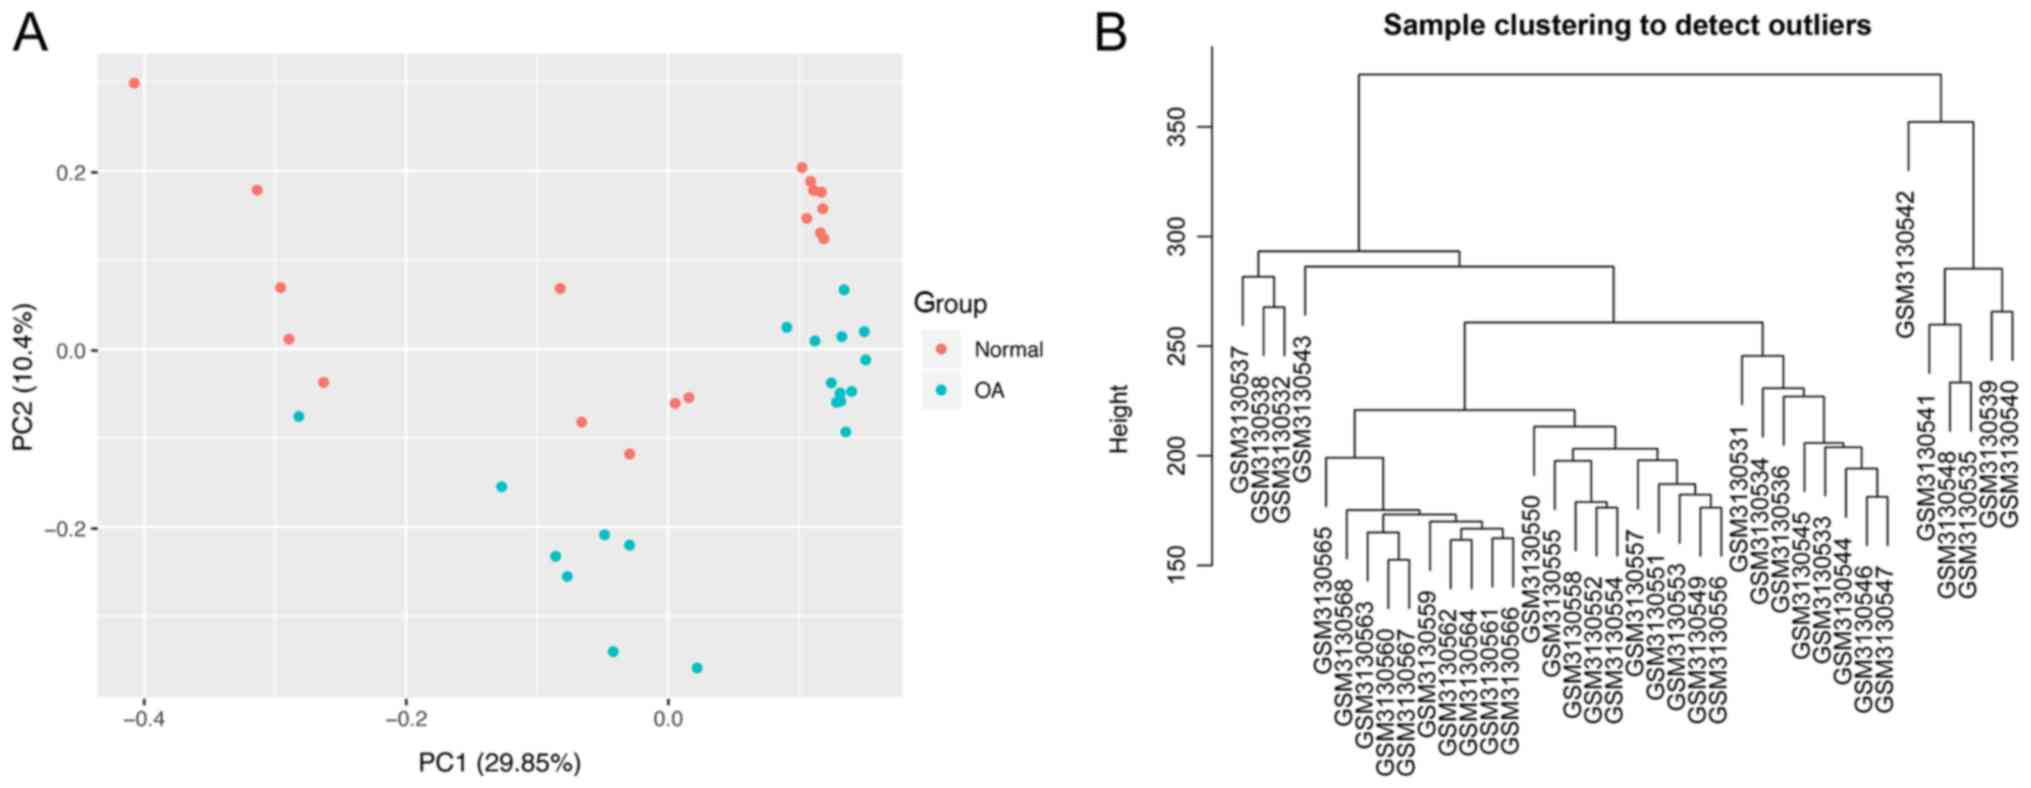
To estimate false-positives, the procedure was
performed using randomized versions of the sample labels and the
outcomes were compared with the original results based on PCA
(Fig. 1A) (20). PCA revealed clear differences between
the normal and OA samples. Sample clustering revealed that no
samples required removal from subsequent analysis due to outliers
(Fig. 1B). With an adjusted P-value
<0.05 and |log2fold change|>1 as the cut-off criteria, a
total of 1,898 genes were identified to be differentially expressed
between OA samples and normal samples, of which 966 were
upregulated (Table SI) and 932 were
downregulated (Table SII). The DEGs
are highlighted in the volcano plot (Fig. S1). As illustrated in Fig. S2, unsupervised hierarchical
clustering analysis of the obtained DEGs was able to distinctly
classify all samples into normal and OA groups.
Weighted co-expression network
construction
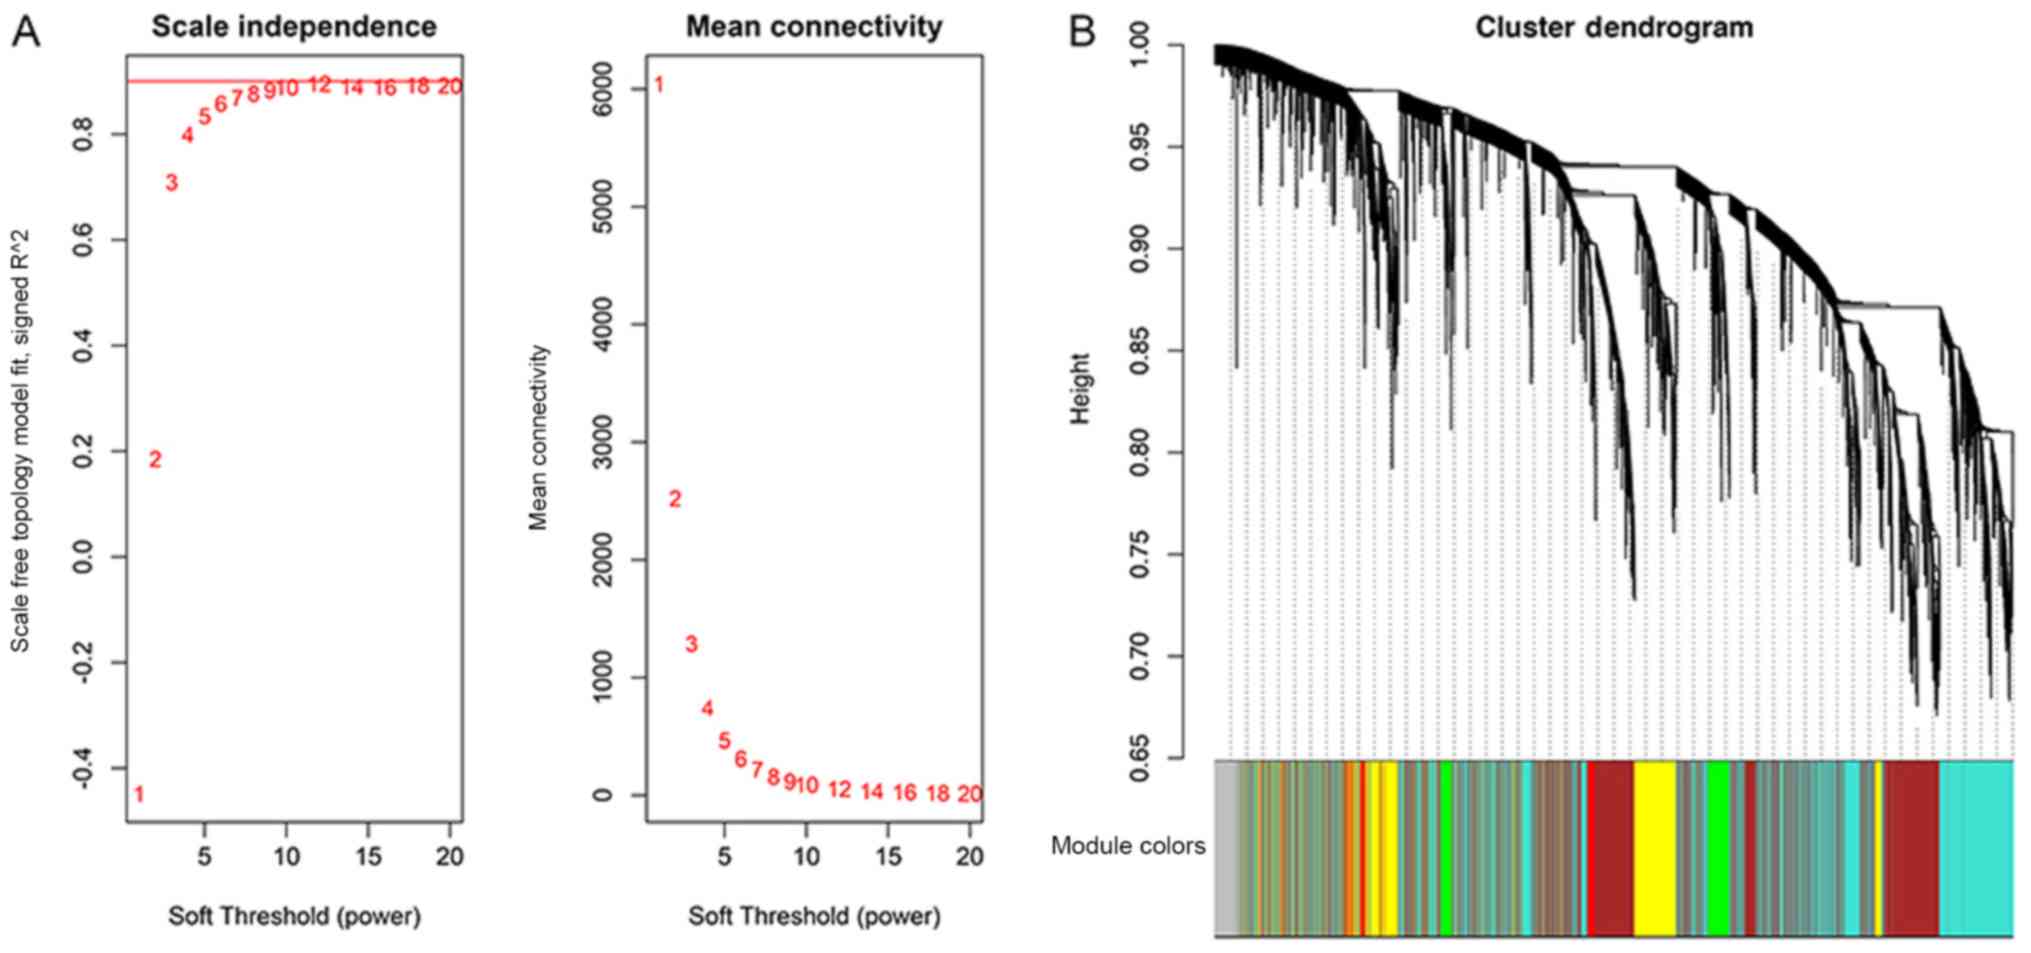
A weighted co-expression network was constructed
using the ‘WGCNA’ R package. Construction of an appropriate
scale-free network required an optimal soft-thresholding power to
which co-expression similarity was raised to calculate adjacency.
The analysis of network topology was performed for various
soft-thresholding powers in order to obtain a relatively balanced
scale independence and mean connectivity of the WGCNA (9). In Fig.
2A, the scale-free topology fitting index (R2,
y-axis) is presented as a function of the soft-thresholding power
(x-axis) in the left panel, while the right panel displays the mean
connectivity (degree, y-axis) as a function of the
soft-thresholding power (x-axis). Red Arabic numbers in the panels
denote different soft-thresholds. The red line in the left panel
indicates R2=0.9. There was a trade-off between
maximization of the scale-free topology model fitting index
(R2) and maintenance of a high mean number of
connections. Thus, β was set as 9. Subsequently, co-expressed gene
modules were identified by the dynamic tree cut method, and each of
the modules was marked by a color, indicated in the color band
below the dendrogram (Fig. 2B).
Genes that were not assigned to any of the modules were colored in
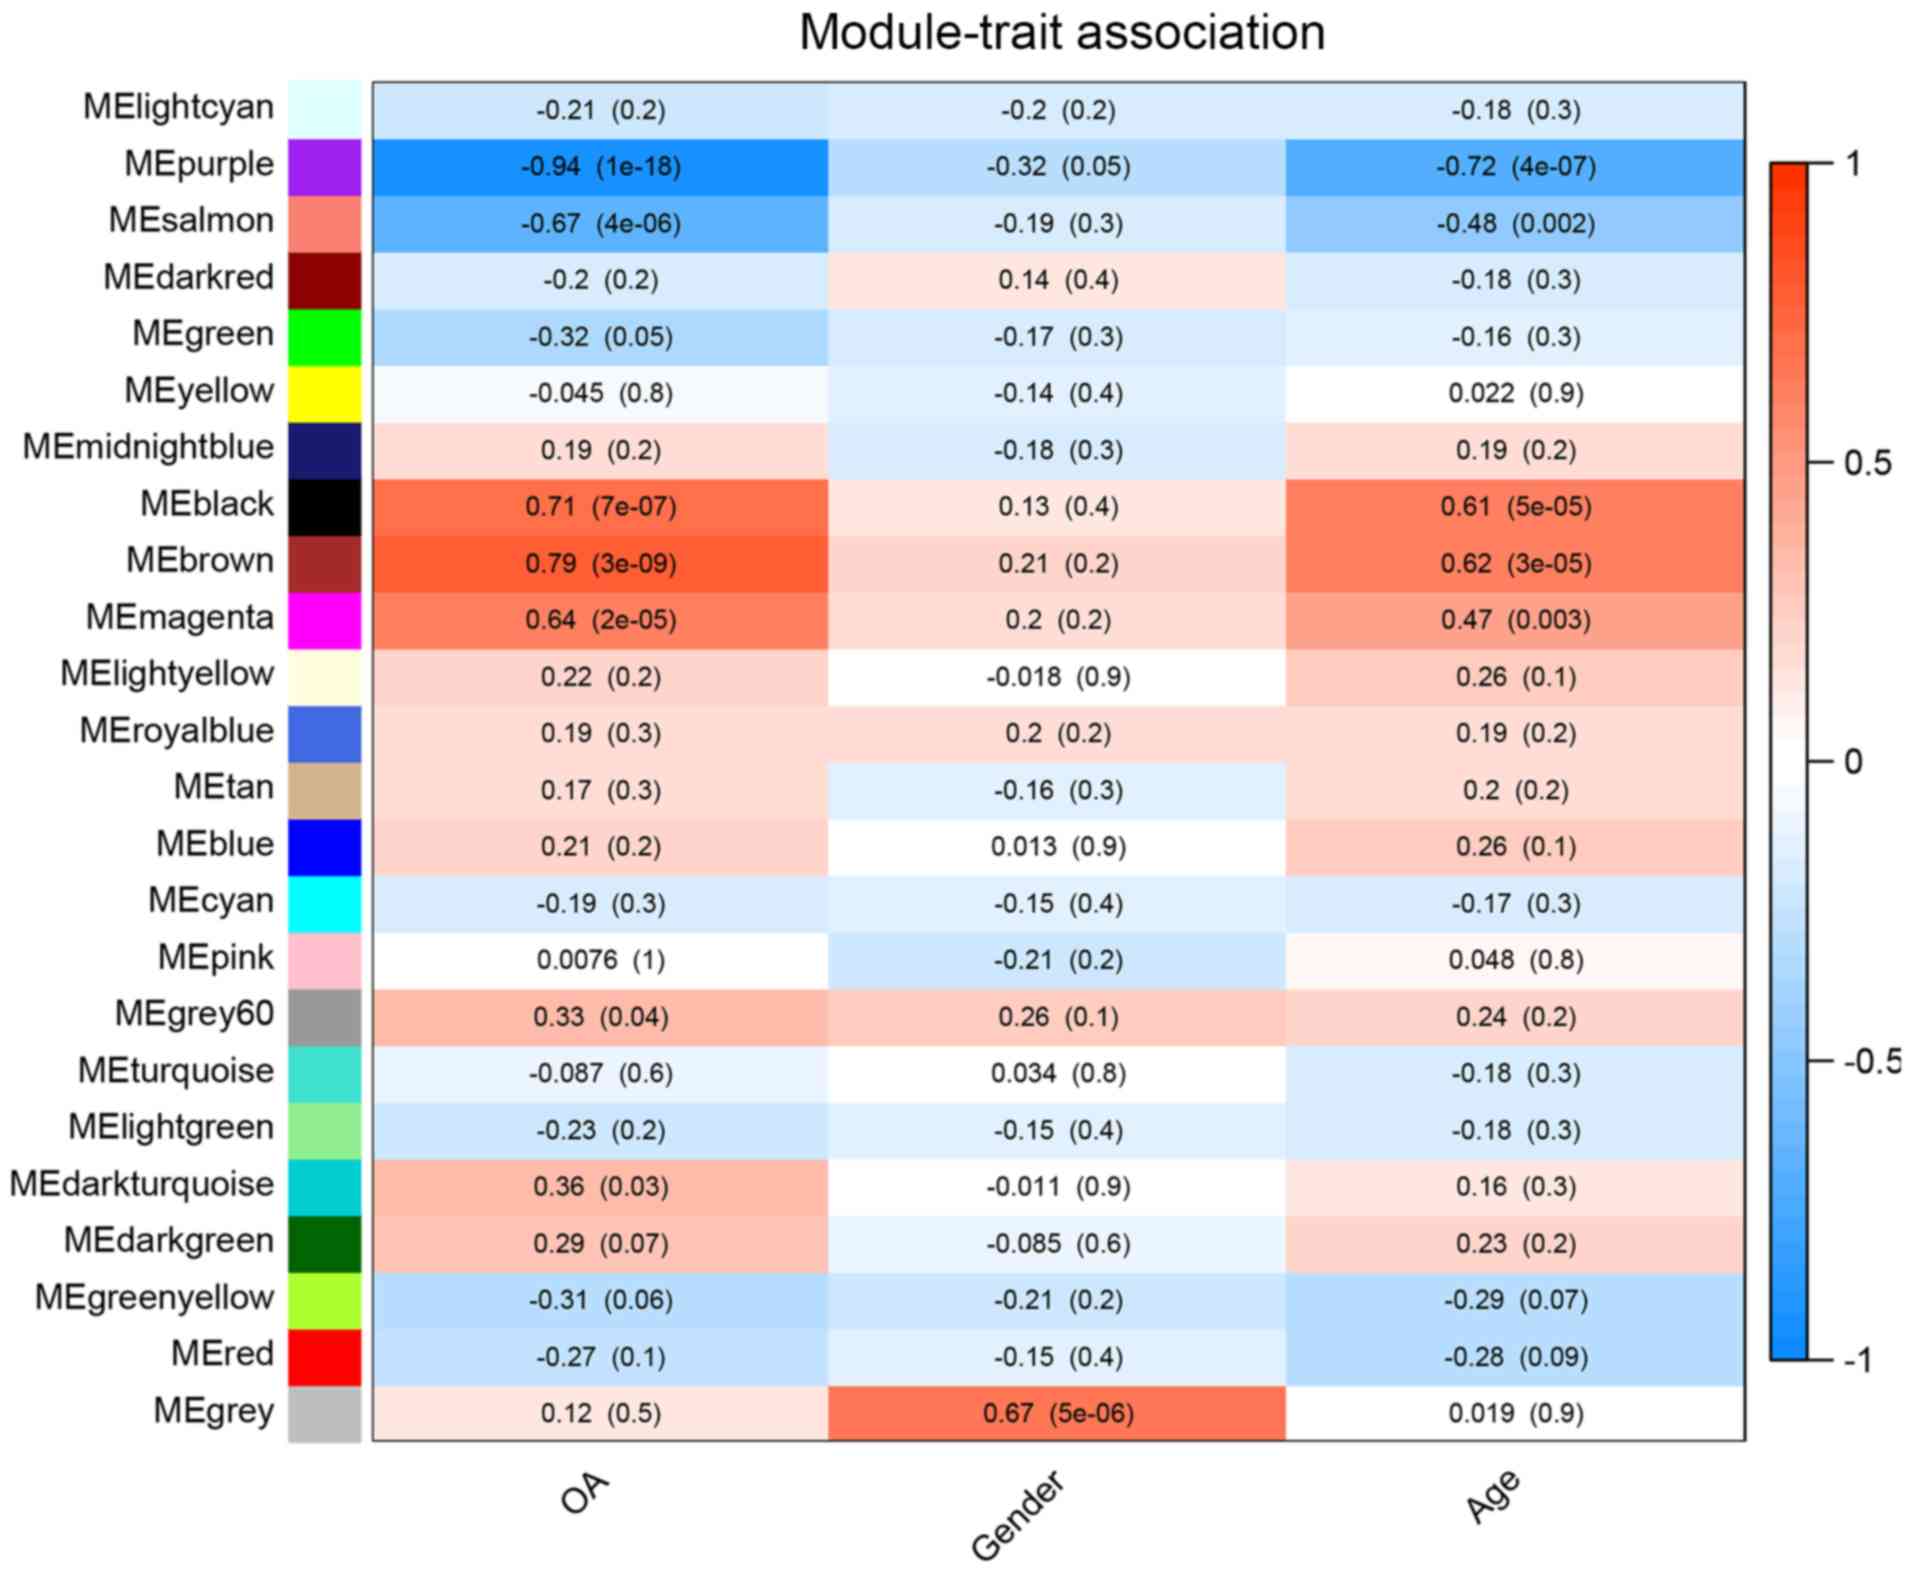
grey. A total of 24 modules were identified in the GSE114007
dataset (Fig. 3), of which 5 modules
were identified as hub modules based on the correlation
coefficients between the ME and traits (>0.6). The genes in each
module are listed in Table SIII.
The purple, salmon, black, brown and magenta modules were close to
‘OA’ traits. Among them, the purple, black and brown modules were
also close to ‘age’ traits. Previous studies have concluded that
females are more susceptible to OA than males (21). However, the present study did not
identify any modules that were closely associated with ‘sex’
traits. Detailed information of hub modules is listed in Table I.
 | Table I.Detailed information of hub
modules. |
Table I.
Detailed information of hub
modules.
| Module name | Trait | Gene count | Module association
to trait | OA associated genes
count | DEG count | Key TFs |
|---|
| Brown | OA/Age | 1,741 | 0.79/0.62 | 77 | 594 | BCL6, MYEF2 |
| Purple | OA/Age | 307 | −0.94/−0.72 | 14 | 180 | JUN, ATF3, CEBPG,
NFIL3, FOSL2, FOSL1, FOS, MYC, JUND |
| Salmon | OA | 202 | −0.67 | 5 | 47 | TFCP2L1, RELA,
SOX3 |
| Black | OA/Age | 920 | 0.71/0.61 | 22 | 316 | ETS2, SOX9,
SOX10 |
| Magenta | OA | 328 | 0.64 | 18 | 159 | IRF4, REL |
GO enrichment function and pathway
analysis
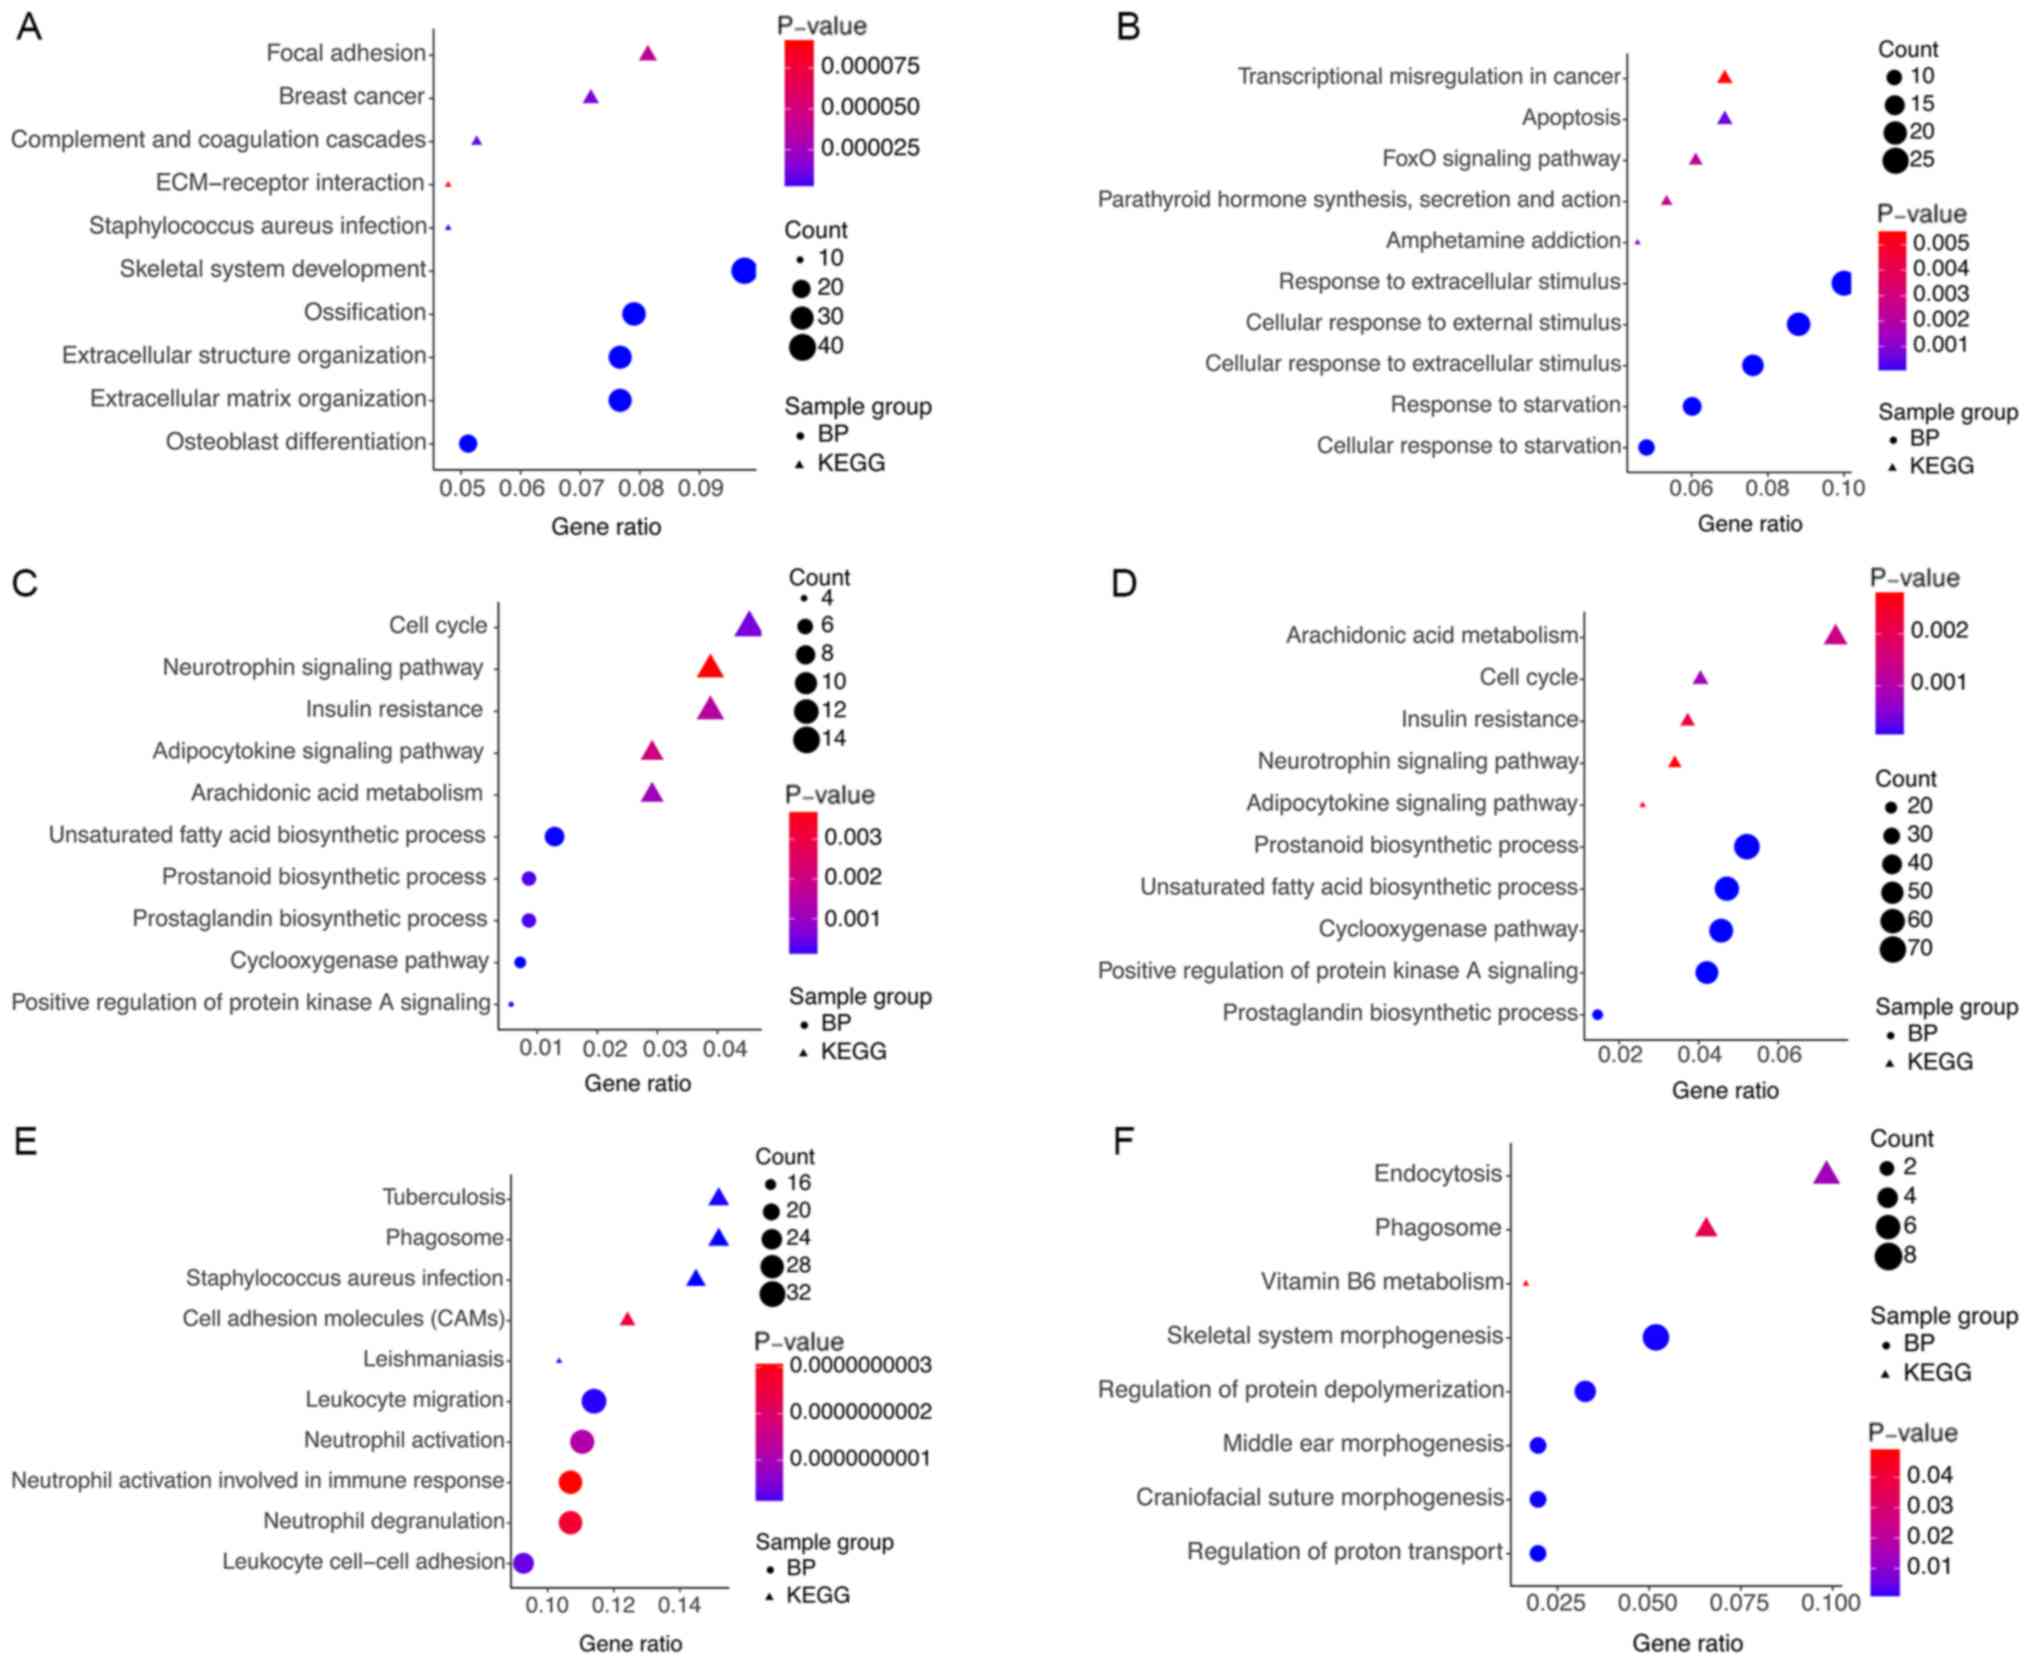
To further investigate the DEGs and hub modules
involved in BP terms and signaling pathways, respective GO and KEGG
analyses were performed using the clusterProfiler R package
(Fig. 4). The results demonstrated
that the DEGs were significantly enriched in key processes,
including skeletal system development, ossification, extracellular
structure organization, osteoblast differentiation, response to
corticosteroid, focal adhesion, the Wnt signaling pathway,
complement and coagulation cascades, extracellular matrix
(ECM)-receptor interactions and rheumatoid arthritis (Fig. 4A). Fig.
4B-G presents the results obtained from the enrichment analysis
of hub modules, which suggest that these BP terms and pathways may
exert pivotal functions in the pathogenesis of OA.
PPI network analysis of DEGs and hub
modules
A PPI network for the DEGs at the protein level was
constructed using the STRING analysis tool. A total of 537 nodes
and 1,218 edges were contained in the PPI network. Based on the
plugin CytoHubba, the hub genes were defined as the genes with the
top 10 with the highest degree of connectivity in the entire PPI
network (Table II), including Jun
Proto-Oncogene (JUN), Vascular Endothelial Growth Factor A (VEGFA),
Fos Proto-Oncogene (FOS), DNA Topoisomerase IIα and Matrix
Metallopeptidase 9. A PPI network of hub modules was constructed
using the same method, and genes with the top 10 connectivity in
the hub modules were defined as the hub genes (Table II), including Cell Division Cycle 42
(CDC42), PH Domain and Leucine Rich Repeat Protein Phosphatase 1
(PHLPP1), Protein Tyrosine Phosphatase Receptor Type C (PTPRC), JUN
and Ribosome Production Factor 2 (RPF2).
| Table II.Top 10 hub genes in protein-protein
interaction network of DEGs and hub modules. |
Table II.
Top 10 hub genes in protein-protein
interaction network of DEGs and hub modules.
| DEGs/Modules | Top 10 hub
genes |
|---|
| DEGs | JUN VEGFA FOS TOP2A
MMP9 CDK1 BIRC5 PTPRC KIT KIF23 |
| Black | CDC42 CDK2 ACTC1
EHHADH CDK5 INSR DLG4 ACSL4 ACE E2F4 |
| Brown | PHLPP1 EGF MYC
CALM1 CCND1 CDC20 IGF1 AURKA NOTCH1 APP |
| Magenta | PTPRC CDK1 KIF15
TOP2A BUB1 CSF1R TYROBP ITGAM MELK BUB1B |
| Purple | JUN FOS VEGFA ATF3
EGR1 CDKN1A DUSP1 YARS JUNB FOSB |
| Salmon | RPF2 NGDN RCL1
RSL24D1 AEN TRMT11 ZNRD1 PAN2 SRSF7 DDX39A |
Identification of key TFs for hub
modules
Transcriptional regulation is a fundamental and
pivotal process involved in the pathogenesis of various diseases
(22). Co-expressed genes in each
hub module may be involved in the same biological functions and
regulated by the same TFs. Therefore, the present study further
explored the potential TFs for hub modules based on CisTargetX
(Table SIV). The results
demonstrated that B-Cell Lymphoma 6 (BCL6), Myelin Gene Expression
Factor 2 (MYEF2), Activating Transcription Factor 3 (ATF3), CCAAT
Enhancer Binding Protein γ (CEBPG), Nuclear Factor
Interleukin-3-Regulated (NFIL3), FOS Like Antigen-2 (FOSL2),
FOS-Like Antigen-1 (FOSL1), Fos Proto-Oncogene (FOS), JunD
Proto-Oncogene (JUND), Transcription Factor CP2 Like 1 (TFCP2L1),
RELA proto-oncogene NF-kB subunit (RELA), SRY-box transcription
factor 3, V-Ets Avian Erythroblastosis Virus E26 Oncogene Homolog
2, Interferon Regulatory Factor 4 (IRF4) and REL proto-oncogene
NF-kB subunit (REL) were the potential regulators involved in
managing hub modules (Table I).
Detailed information of key TFs is listed in Table SV. These TFs may serve a key role in
regulating the network of hub modules, and potentially affect the
initiation and progression of OA.
Identification of pivotal signaling
pathways
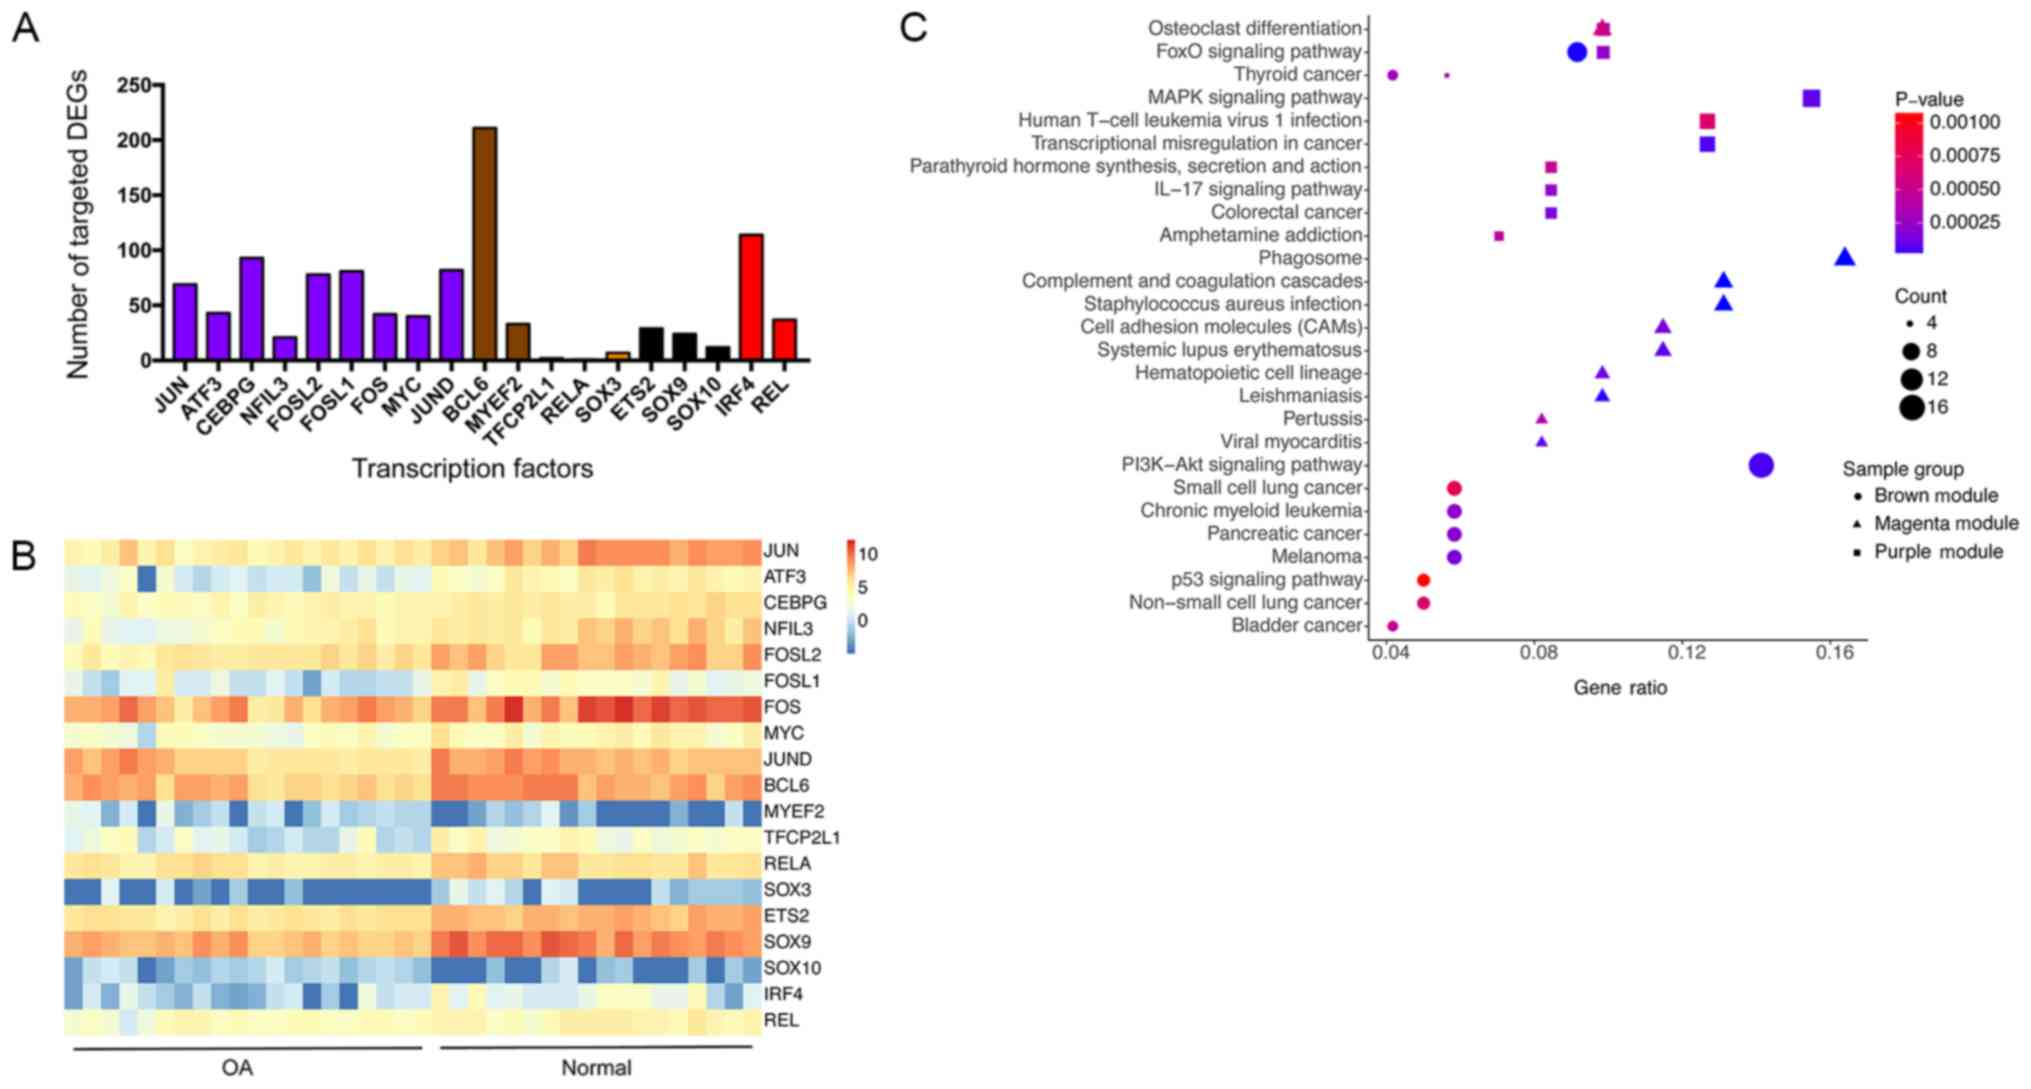
The key TFs that target the largest number of DEGs
were in the purple, brown and magenta modules (Fig. 5A), and were therefore further
investigated. Fig. 5B provides a
heat map on 19 key TFs. KEGG analysis was subsequently performed
for key TFs and their target DEGs in the purple, brown and magenta
modules (Fig. 5C). Based on the
results of this enrichment analysis, it was indicated that
osteoclast differentiation (purple and magenta modules), forkhead
box (Fox)O signaling pathway (brown and purple modules),
mitogen-activated protein kinase (MAPK) signaling pathway (purple
module) and PI3K/Akt signaling pathway (brown module) are
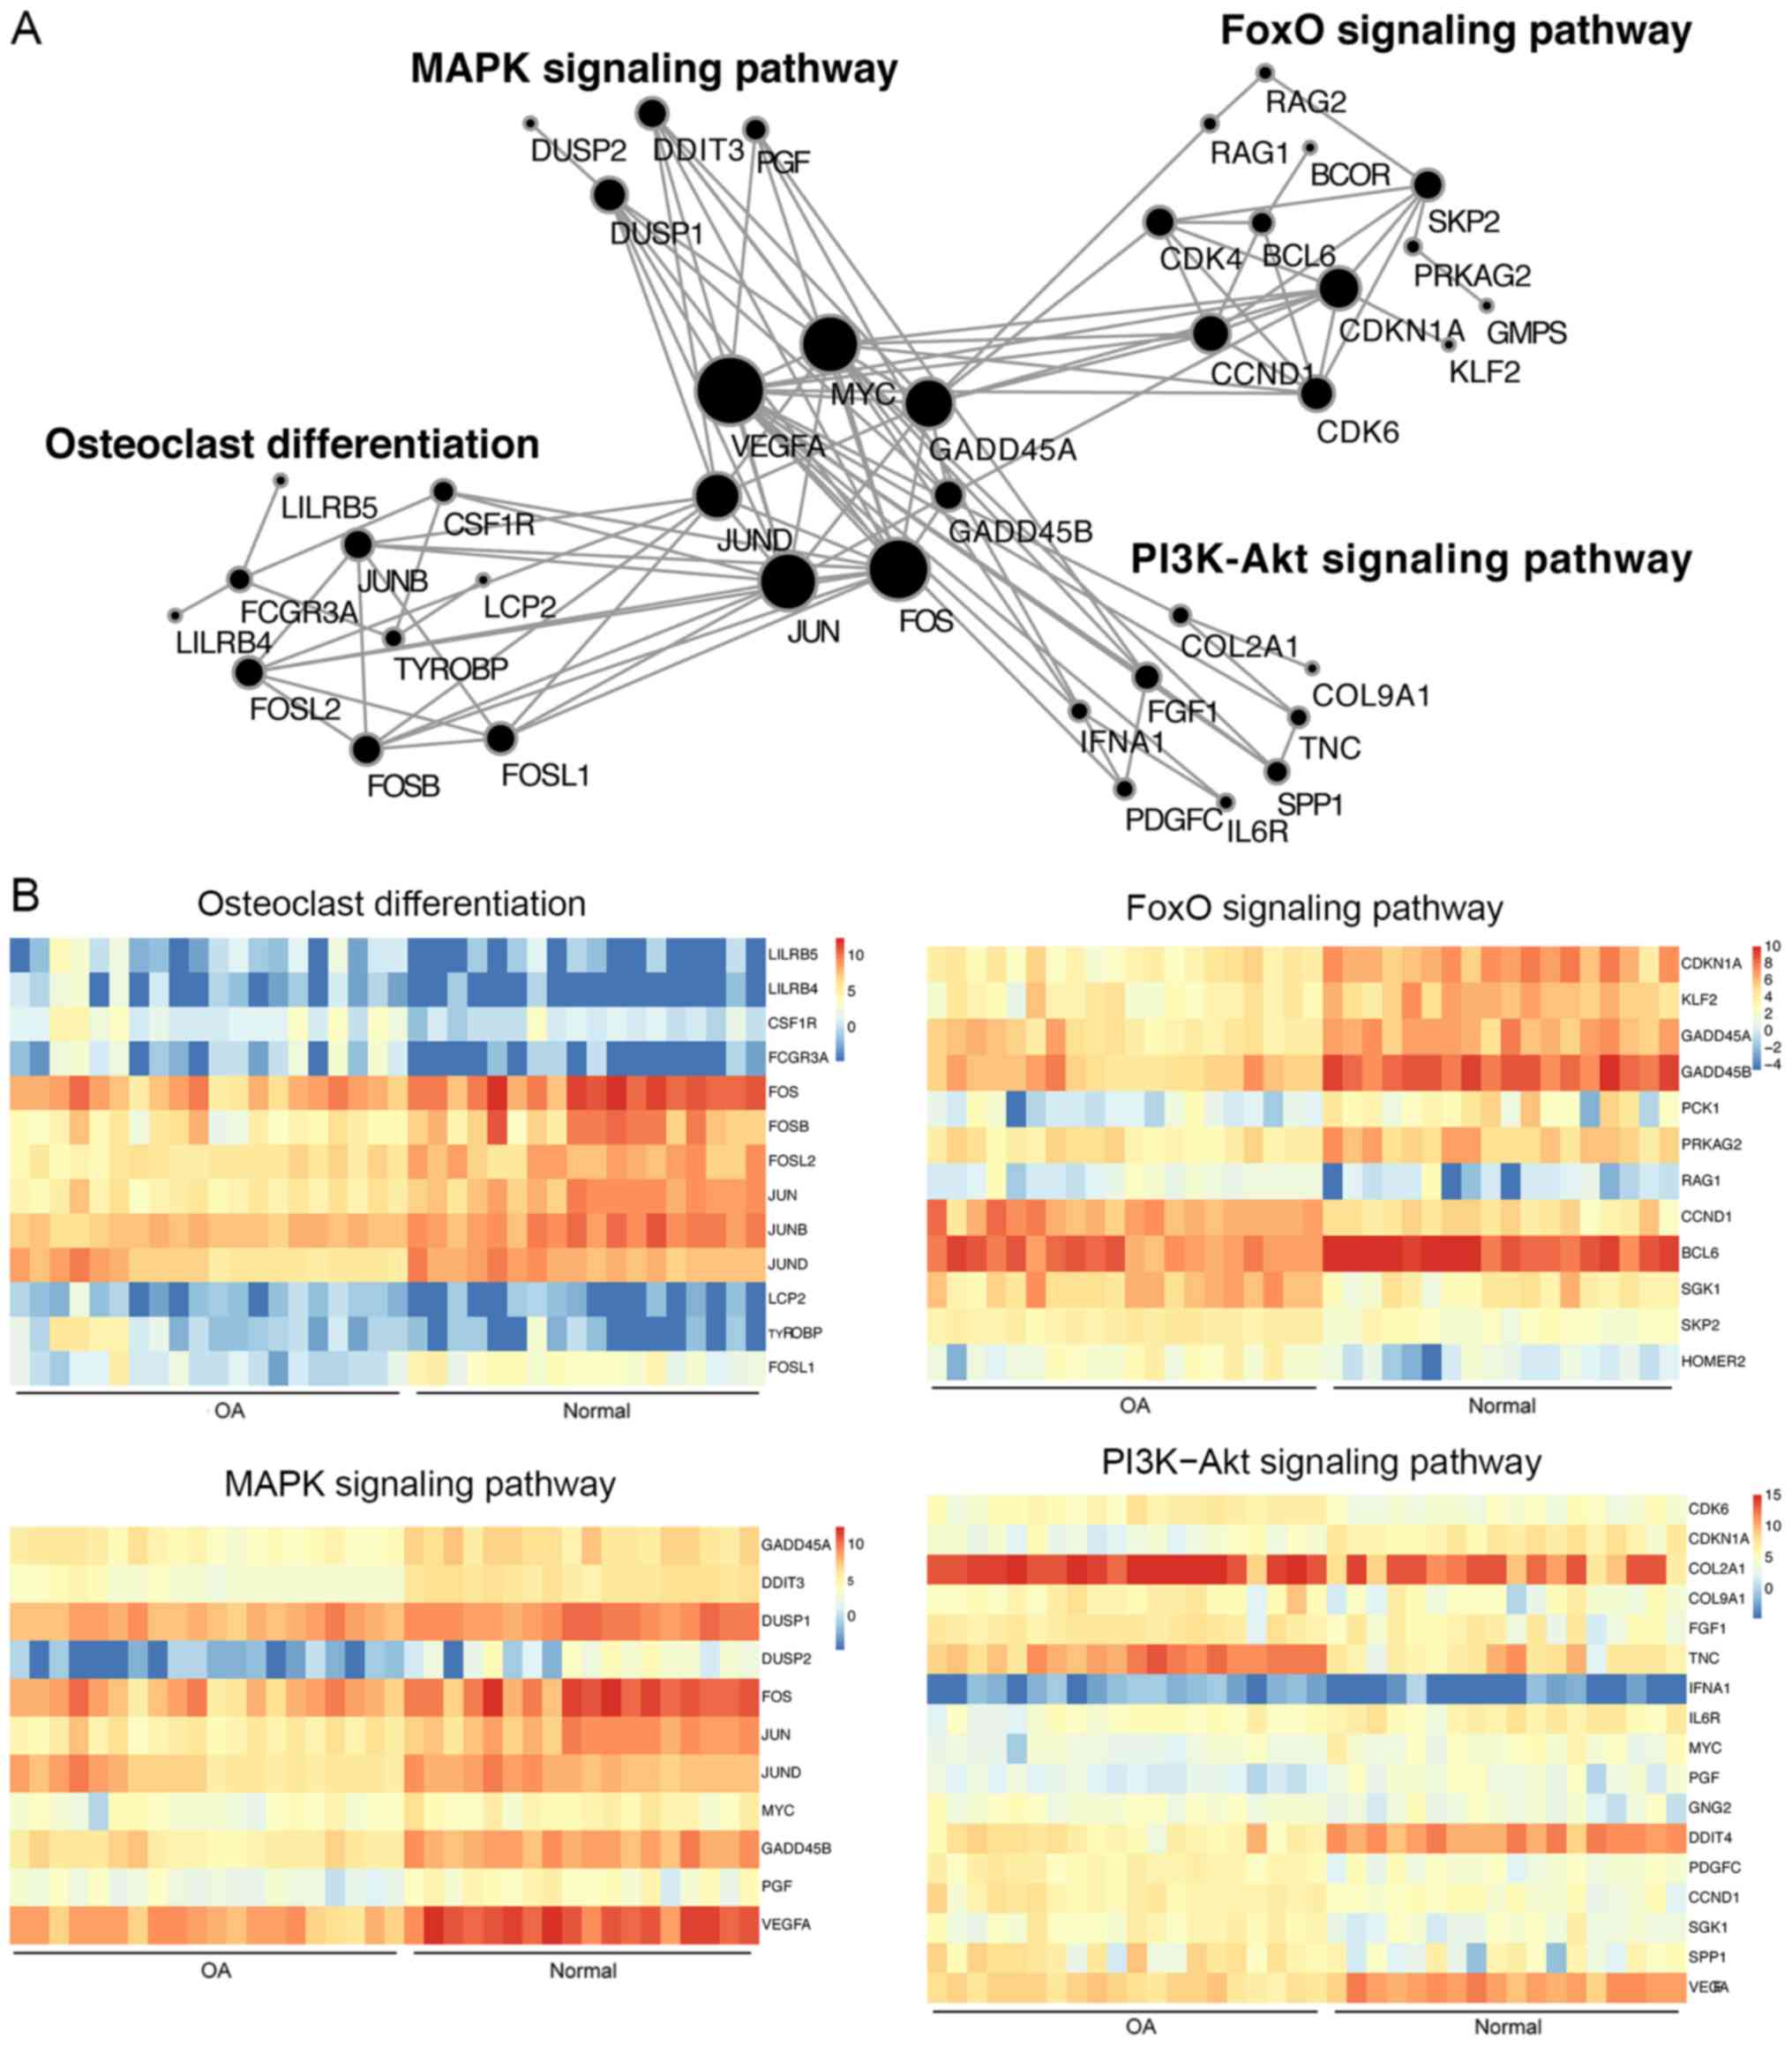
imperative for the pathogenesis of OA. Based on analysis using the
STRING database and the pheatmap R package, a PPI network and
heatmap were respectively constructed for key TFs and their target
DEGs that were involved in the pivotal signaling pathways (Fig. 6). This analysis highlights that these
key TFs and DEGs serve a central role in the pivotal signaling
pathways. It was also observed that the 4 pivotal signaling
pathways are tightly linked through 4 key TFs, including FOS, JUN,
JUND and MYC, as well as 4 DEGs, including VEGFA, GADD45A, GADD45B
and CCND1. In addition to these 8 genes, the present study also
revealed that BCL6 is the key TF that targets the largest number of
DEGs, and that BCL6 is also involved in the FoxO signaling pathway.
These results suggest that FOS, JUN, JUND, MYC, VEGFA, CCND1,
GADD45A, GADD45B and BCL6 serve important roles in the pathogenesis
of OA.
Discussion
OA is a common chronic joint disease among aging
individuals, and is characterized by articular cartilage
degeneration, thickening of synovial lining, subchondral bone
sclerosis and the formation of osteophytes at the joint margin
(23). However, there is currently
no efficient treatment for OA. Therefore, it is imperative to
understand the underlying molecular mechanisms and pathological
processes governing OA. Due to the limited access to normal
cartilage to serve as a control group, microarray data in the GEO
database containing normal cartilage tissues are relatively sparse,
and the sample size is frequently insufficient. For the present
study, a total of 64 articles were screened out from the Pubmed
database based on the following search terms applied to title and
abstract only: ‘Osteoarthritis’ AND (‘co-expression’ OR
‘coexpression’ OR ‘networks’) AND gene expression. The abstract of
these 64 studies was carefully read and these articles are
summarized in Table SVI. As
indicated in this table, the samples in most of the studies are
from knee synovial tissue, while three studies investigated the
microarray data containing samples of human knee articular
cartilage (11,24,25). The
GSE114007 dataset contained 18 normal and 20 OA human knee
cartilage tissues. The cartilage tissues were obtained from the
weight-bearing regions on medial and lateral femoral condyles. The
samples for the normal group were collected from joints that had no
macroscopic or microscopic evidence of cartilage damage, so that
the differences between normal and OA samples are obvious. Another
two datasets in the GEO database are worth mentioning, namely
GSE117999 and GSE113825, which contain data on human knee cartilage
tissues. Degenerative OA tends to be initiated in weight-bearing
regions. Therefore, the major drawback of GSE117999 is that the
healthy-appearing cartilage was garnered from the
non-weight-bearing site of the knee joint. The dataset GSE113825 is
restricted by the amount of samples. On the basis of the above, it
was we concluded that GSE114007 is a valuable microarray dataset,
and is worthy of further in-depth analysis based on WGCNA. To the
best of our knowledge, the WGCNA has not been previously applied to
analyze the expression profiles of cartilaginous OA. The results of
the present study revealed that there were a total of 1,898 DEGs,
including 966 upregulated and 932 downregulated DEGs in human knee
cartilage tissues of OA. In addition, 5 hub modules were identified
to be closely associated with OA based on WGCNA. A PPI network was
constructed in order to identify hub genes among DEGs and hub
modules. Functional enrichment analysis was also performed for the
DEGs and hub modules in order to identify significant BP terms and
signaling pathways. It is well-accepted that co-expressed genes are
more likely to be co-regulated (26), and transcriptional regulation is a
basic and critical BP in eukaryotes (22). Therefore, the further analysis
focused on TFs, and 19 potential key TFs were identified, which may
be involved in the regulation of hub modules based on CisTargetX.
Finally, 4 pivotal signaling pathways that may largely contribute
to the molecular processes of OA were identified via KEGG
enrichment analysis. These signaling pathways are i) Osteoclast
differentiation; ii) FoxO signaling pathway; iii) the MAPK
signaling pathway, and iv) the PI3K/Akt signaling pathway.
Based on the WGCNA performed in the present study, 5
hub modules with highly relevant expression patterns that were
closely associated with OA were identified. GO BP and KEGG analyses
were subsequently performed to identify significant BP terms and
pathways in each hub module. The genes in the black module were
primarily enriched in monocarboxylic acid biosynthetic process,
signal transduction by p53 class mediator, cell cycle, insulin
signaling pathway and FoxO signaling pathway. Monocarboxylate
transporter 4 is a potential therapeutic target for inflammatory
arthritis (27) and Zhu et al
(28) reported that p53 genes are
correlated with the disease grade of knee OA. The brown module was
primarily enriched in skeletal system development, extracellular
structure organization, ECM organization, ossification, chondrocyte
differentiation, collagen catabolic process, PI3K/Akt signaling
pathway, Hippo signaling pathway and FoxO signaling pathway. It has
previously been reported that the chondrocyte ECM serves an
important role in cartilage function (29), and that the dynamic equilibrium
between matrix synthesis and degradation maintains the stability
and integrity of cartilage tissue (30). A recent study has reported that the
Hippo signaling pathway and ECM-receptor pathway are involved in
the process of osteoarthritic chondrocyte apoptosis (31). In addition, the results of the
present study revealed that the purple module was primarily
enriched in response to extracellular stimulus, FoxO signaling
pathway and human T-cell leukemia virus 1 infection. Andriacchi
et al (32) reported that a
mechanical stimulus at the baseline may enhance the sensitivity of
a biomarker to predict cartilage thinning in a 5-year follow-up in
patients with knee OA through a systems model of OA. In addition,
the magenta module was typically enriched in neutrophil-mediated
immunity and neutrophil activation involved in immune response. The
magenta module is principally associated with the immune response.
A previous study has suggested that the innate immune response is a
potentially modifiable process, which may subsequently augment the
pathological changes observed in OA (33).
The pathogenesis of OA is multifactorial and
intricate, and is influenced by inflammation and oxidative stress
(34). Due to its complex mechanism,
numerous genes are differentially expressed in OA. In order to
efficiently identify the crucial candidate genes, the present study
primarily focused on the TFs likely involved in the pathogenesis of
OA. A holistic approach was utilized, in which hub genes, key TFs
and pivotal signaling pathways were integrated to identify more
effective targets, which may be assessed in subsequent research.
This analysis identified 8 key TFs and 1 hub gene (JUN, JUND, FOS,
FOSL1, FOSL2, MYC, BCL6, ATF3 and VEGFA) that exert major functions
in regulating hub modules and pivotal signaling pathways. Among
these genes, JUN, FOS, MYC, ATF3 and VEGFA are also the hub genes
in the PPI network of DEGs and the hub modules (Table II). JUN, JUND, FOS, FOSL1 and FOSL2
are subunits of activator protein 1 (AP-1) (35). Previous studies have suggested that
AP-1 is involved in the differentiation, hypertrophy and expression
of matrix metalloproteinase (MMP)13 in chondrocytes (36–38). In
addition, Papachristou et al (39) identified that AP-1 is involved in the
signal transduction pathway of mechanical loading in condylar
chondrocytes. The results of the present study indicate that JUN,
JUND, FOS, FOSL1 and FOSL2 are involved in osteoclast
differentiation. In addition, previous research has suggested that
AP-1 proteins are important inflammatory regulators in skin disease
(40) and are hypothesized to be
involved in regulating reactive oxygen species (ROS) in macrophages
(41). There is evidence to suggest
that C-myc suppresses apoptosis and promotes the proliferation of
chondrocytes to prevent the occurrence and subsequent progression
of OA via inactivating the MAPK signaling pathway (42). Consistent with the literature, the
present study identified that MYC participates in the MAPK
signaling pathway and is downregulated in OA samples. Lemos et
al (43) demonstrated that
inhibition of MYC in vivo as well as in human kidney
organoids in vitro abrogated inflammation and fibrosis. The
results of Anderton et al (44) suggest that MYC may serve a role in
regulating a major anti-oxidant pathway downstream of glutamine.
The present study identified BCL6 as the key TF that targeted the
largest number of DEGs in the brown module. The precise association
between OA and BCL6 has remained to be determined. However, a
previous study reported that BCL6 attenuates
lipopolysaccharide-induced inflammation in HK-2 cells via negative
regulation of NLRP3 transcription (45). Iezaki et al (46) argued that ATF3 modulates the
expression of MMP13 in human chondrocytes and indicated that ATF3
is implicated in the pathogenesis of OA through the modulation of
inflammatory cytokine expression in chondrocytes, which may serve
as a novel therapeutic target for the treatment of OA. ATF3 has
been reported to be involved in regulating the inflammatory process
in renal ischemia-reperfusion injury (47) and the central nervous system
(48). With increasing severity of
OA, greater vascular invasion into articular cartilage has been
observed (49), and VEGFA has a
fundamental role in angiogenesis (50). The present study observed that VEGFA
is an integral DEG and in the center of a regulatory network
(Fig. 6). CCND1 is an important cell
cycle regulator, and CCND1 silencing may promote interleukin
(IL)-1β-induced apoptosis in rat chondrocytes (51). SOX9, a TF known to regulate type II
collagen and aggrecan, is a critical factor in the OA-associated
downregulation of ECM molecules (52). According to a recent Bioinformatics
study, VEGFA, JUN, ATF3, JUN and MYC were also significantly
dysregulated in synovial membranes between the normal and OA group
(53). These results suggest that
dysregulation of these TFs and hub DEGs may participate in
chondrocyte homeostasis and the pathogenesis of OA. Fisch et
al (11) systematically analyzed
the dataset GSE114007 based on a set of methods (identification of
DEGs, TF enrichment analysis and network analysis), and obtained
numerous significant results. They identified eight TFs (JUN, EGR1,
JUND, FOSL2, MYC, KLF4, RELA and FOS) and 3 pivotal signaling
pathways (hypoxia-inducible factor-1 signaling, pathways in cancer
and FoxO signaling) that have a central role in the pathogenesis of
OA. The present study used a different method, WGCNA, to further
analyze the dataset GSE114007. The present analysis confirmed
several of the key TFs identified by Fisch et al (11), including JUN, JUND, FOS, FOSL1,
FOSL2, MYC and RELA, and suggested further key genes that may be
involved in the pathogenesis of OA, including ATF3, BCL6, SOX9,
VEGFA, CCND1, GADD45A and GADD45B. In addition to FoxO signaling, 3
further pivotal signaling pathways were identified (osteoclast
differentiation, MAPK and PI3K/Akt signaling pathway).
In addition to the genes that have already been
discussed, there are still other key TFs that target large numbers
of DEGs and hub genes with high connectivity in PPI networks
identified at present study that require further investigation,
including GADD45A, GADD45B, CDC42, CEBPG, NFIL3, MYEF2, IRF4, REL,
PHLPP1, PTPRC, RPF2. GADD45A and GADD45B, members of the GADD45
family, have been implicated in numerous basic processes, and have
been demonstrated to be associated with aging and age-associated
diseases (54). GADD45A and GADD45B
have been reported to interact with AP-1, ATF3 and MYC, which have
been identified as key TFs in the present study (55). However, to the best of our knowledge,
the roles of GADD45s in the pathogenesis of OA have not been
previously assessed, and therefore, further studies are required in
order to investigate this. Previous studies have demonstrated that
CDC42 is closely associated with the chondrocyte phenotype
(56) and age-associated OA
(57). A previous study has also
indicated that C/EBPβ represses the transcriptional activity of
Col2A1 directly and indirectly in ATDC5 cells (58). However, there is currently no
evidence that C/EBPγ directly correlates with OA.
REL, also termed C-Rel, is a subunit of NF-κB, and
it is well established that NF-κB serves a key role in OA (59). Morrovati et al (60) demonstrated that treatment of
chondrocytes with IL-1β resulted in a significant increase in the
expression level of C-Rel. However, there is still uncertainty as
to whether C-Rel may serve as a therapeutic target for OA. Bradley
et al (61) reported that
Phlpp1 controls chondrogenesis via multiple mechanisms and that
Phlpp1 inhibition may be a strategy to promote cartilage
regeneration and repair. However, no previous study has
investigated other genes, including NFIL3, MYEF2, IRF4, PTPRC and
RPF2, in articular cartilage, and the results of the present study
suggest that they deserve further investigation. The degradation
and loss of articular cartilage is a central feature in OA
(29). Therefore, the present study
utilized the GSE114007 dataset, in which samples were obtained from
cartilage tissue. Subchondral bone has received particular
attention in recent years (62). In
one study, WGCNA, the same method as that used in the present
study, was applied to analyze the dataset GSE51588, whose samples
were obtained from subchondral bone. They identified another set of
core genes, including COL6A3, COL6A1, ITGA11, BAMBI and HCK, to be
associated with the pathological processes of subchondral bone in
OA (63). However, these results are
inconsistent with those obtained by the present study, which
indicated that different pathological mechanisms may exist between
cartilage tissue and subchondral bone in OA. As summarized by
Loeser et al (62), it is
indicated that each event (osteophyte formation, subchondral bone
sclerosis and cartilage degeneration) is regulated by different
mediators.
In addition to the key TFs and hub DEGs discussed
above, the present study also identified 4 pivotal signaling
pathways in the pathogenesis of OA, including osteoclast
differentiation, FoxO, MAPK and the PI3K-Akt signaling pathway. It
was also identified that GADD45A and GADD45B participated in the
MAPK and FoxO signaling pathways, and that the PI3K/Akt and MAPK
signaling pathways are closely associated with MYC and VEGFA.
Furthermore, FOS, JUN and JUND were indicated to be involved in
osteoclast differentiation and MAPK signaling pathways. It is now
well established that in OA, the balance between osteoclast-induced
bone resorption and osteoblast-induced remodeling is being
progressively deregulated (34). A
study by Durand et al (64),
by comparing the osteoclastogenic capacity of peripheral blood
mononuclear cells (PBMCs) from patients with OA to that of PBMCs
from normal individuals, revealed that monocytes from patients with
OA have increased osteoclastogenesis and bone resorption. In fact,
numerous studies on OA have suggested that enhanced
osteoclast-mediated bone resorption is a potential pathological
mechanism for OA (65,66). The FoxO signaling pathway has been
reported to be a regulator of the pathological processes of OA
(67) and the function is perhaps
realized by autophagy (68,69). A recent study revealed that FoxO as
essential TFs regulating postnatal articular cartilage growth and
homeostasis (68). Activation of the
MAPK signaling pathway increases the expression of MMPs in
chondrocytes (70). In addition, the
MAPK signaling pathway is involved in the apoptosis and expression
of pro-inflammatory cytokines in human OA chondrocytes (71). Therefore, MAPK signaling is closely
associated with the pathological changes of OA, and is a potential
therapeutic target for OA. The PI3K signaling pathway is paramount
for cell growth and survival (72),
with a previous study revealing that the influence of the PI3K/Akt
signaling pathway on OA is realized by autophagy (73). The PI3K/Akt pathway may be suppressed
by elevated levels of ROS in OA chondrocytes so that inflammatory
processes are promoted (74).
Furthermore, oxidative stress may cause chondrocyte senescence by
activating MAPK and PI3K/Akt signaling pathways. In general, there
is a close association between abnormal regulation of pivotal
signaling pathways and the disequilibrium of cellular homeostasis
and cartilage degeneration.
In summary, the present study identified the hub
genes and 5 hub modules associated with OA based on WGCNA. In
addition, the present study was the first to identify key TFs
through co-expressed gene modules. Although there have been a
multitude of academic theses on the pathogenic mechanism of OA, the
pathogenesis of OA has remained to be completely elucidated. Novel
potential targets and 4 pivotal signaling pathways for therapeutic
intervention. The present study provides an important opportunity
to advance the understanding of OA. However, the present results
are based on a Bioinformatics analysis and further validation is
required in order to verify the potential key roles of these genes
in the development of OA in vitro and in vivo.
Supplementary Material
Supporting Data
Supporting Data
Supporting Data
Supporting Data
Supporting Data
Supporting Data
Supporting Data
Acknowledgements
Not applicable.
Funding
No funding was received.
Availability of data and materials
The datasets used and/or analyzed during the current
study are available from the corresponding author on reasonable
request.
Authors' contributions
XL conceived and designed the study. XG performed
data analyses and wrote the manuscript. YS contributed to data
acquisition and manuscript revision.
Ethics approval and consent to
participate
Not applicable.
Patient consent for publication
Not applicable.
Competing interests
The authors declare that they have no competing
interests.
References
|
1
|
Thomas E, Peat G and Croft P: Defining and
mapping the person with osteoarthritis for population studies and
public health. Rheumatology (Oxford). 53:338–345. 2014. View Article : Google Scholar : PubMed/NCBI
|
|
2
|
Xie F, Kovic B, Jin X, He X, Wang M and
Silvestre C: Economic and humanistic burden of osteoarthritis: A
systematic review of large sample studies. Pharmacoeconomics.
34:1087–1100. 2016. View Article : Google Scholar : PubMed/NCBI
|
|
3
|
Goldring MB and Otero M: Inflammation in
osteoarthritis. Curr Opin Rheumatol. 23:471–478. 2011. View Article : Google Scholar : PubMed/NCBI
|
|
4
|
Sellam J and Berenbaum F: The role of
synovitis in pathophysiology and clinical symptoms of
osteoarthritis. Nat Rev Rheumatol. 6:625–635. 2010. View Article : Google Scholar : PubMed/NCBI
|
|
5
|
Tonge DP, Pearson MJ and Jones SW: The
hallmarks of osteoarthritis and the potential to develop
personalised disease-modifying pharmacological therapeutics.
Osteoarthritis Cartilage. 22:609–621. 2014. View Article : Google Scholar : PubMed/NCBI
|
|
6
|
Hunter DJ and Bierma-Zeinstra S:
Osteoarthritis. Lancet. 393:1745–1759. 2019. View Article : Google Scholar : PubMed/NCBI
|
|
7
|
Ren YM, Zhao X, Yang T, Duan YH, Sun YB,
Zhao WJ and Tian MQ: Exploring the key genes and pathways of
osteoarthritis in knee cartilage in a rat model using gene
expression profiling. Yonsei Med J. 59:760–768. 2018. View Article : Google Scholar : PubMed/NCBI
|
|
8
|
Zhu N, Hou J, Wu Y, Li G, Liu J, Ma G,
Chen B and Song Y: Identification of key genes in rheumatoid
arthritis and osteoarthritis based on bioinformatics analysis.
Medicine (Baltimore). 97:e109972018. View Article : Google Scholar : PubMed/NCBI
|
|
9
|
Langfelder P and Horvath S: WGCNA: An R
package for weighted correlation network analysis. BMC
bioinformatics. 9:5592008. View Article : Google Scholar : PubMed/NCBI
|
|
10
|
Fei Q, Lin J, Meng H, Wang B, Yang Y, Wang
Q, Su N, Li J and Li D: Identification of upstream regulators for
synovial expression signature genes in osteoarthritis. Joint Bone
Spine. 83:545–551. 2016. View Article : Google Scholar : PubMed/NCBI
|
|
11
|
Fisch KM, Gamini R, Alvarez-Garcia O,
Akagi R, Saito M, Muramatsu Y, Sasho T, Koziol JA, Su AI and Lotz
MK: Identification of transcription factors responsible for
dysregulated networks in human osteoarthritis cartilage by global
gene expression analysis. Osteoarthritis Cartilage. 26:1531–1538.
2018. View Article : Google Scholar : PubMed/NCBI
|
|
12
|
Barrett T, Troup DB, Wilhite SE, Ledoux P,
Evangelista C, Kim IF, Tomashevsky M, Marshall KA, Phillippy KH,
Sherman PM, et al: NCBI GEO: Archive for functional genomics data
sets-10 years on. Nucleic Acids Res. 39(Database Issue):
D1005–D1010. 2011. View Article : Google Scholar : PubMed/NCBI
|
|
13
|
Ritchie ME, Phipson B, Wu D, Hu Y, Law CW,
Shi W and Smyth GK: limma powers differential expression analyses
for RNA-sequencing and microarray studies. Nucleic Acids Res.
43:e472015. View Article : Google Scholar : PubMed/NCBI
|
|
14
|
Xin J, Mark A, Afrasiabi C, Tsueng G,
Juchler M, Gopal N, Stupp GS, Putman TE, Ainscough BJ, Griffith OL,
et al: High-performance web services for querying gene and variant
annotation. Genome Biol. 17:912016. View Article : Google Scholar : PubMed/NCBI
|
|
15
|
Benjamini Y, Drai D, Elmer G, Kafkafi N
and Golani I: Controlling the false discovery rate in behavior
genetics research. Behav Brain Res. 125:279–284. 2001. View Article : Google Scholar : PubMed/NCBI
|
|
16
|
Chin CH, Chen SH, Wu HH, Ho CW, Ko MT and
Lin CY: cytoHubba: Identifying hub objects and sub-networks from
complex interactome. BMC Syst Biol. 8 (Suppl 4):S112014. View Article : Google Scholar : PubMed/NCBI
|
|
17
|
Yu G, Wang LG, Han Y and He QY:
clusterProfiler: An R package for comparing biological themes among
gene clusters. OMICS. 16:284–287. 2012. View Article : Google Scholar : PubMed/NCBI
|
|
18
|
Potier D, Atak ZK, Sanchez MN, Herrmann C
and Aerts S: Using cisTargetX to predict transcriptional targets
and networks in Drosophila. Methods Mol Biol. 786:291–314. 2012.
View Article : Google Scholar : PubMed/NCBI
|
|
19
|
Aerts S, Quan XJ, Claeys A, Naval Sanchez
M, Tate P, Yan J and Hassan BA: Robust target gene discovery
through transcriptome perturbations and genome-wide enhancer
predictions in Drosophila uncovers a regulatory basis for sensory
specification. PLoS Biol. 8:e10004352010. View Article : Google Scholar : PubMed/NCBI
|
|
20
|
Ringnér M: What is principal component
analysis? Nat Biotechnol. 26:303–304. 2008. View Article : Google Scholar : PubMed/NCBI
|
|
21
|
O'Connor MI and Hooten EG: Breakout
session: Gender disparities in knee osteoarthritis and TKA. Clin
Orthop Relat Res. 469:1883–1885. 2011. View Article : Google Scholar : PubMed/NCBI
|
|
22
|
Lee TI and Young RA: Transcriptional
regulation and its misregulation in disease. Cell. 152:1237–1251.
2013. View Article : Google Scholar : PubMed/NCBI
|
|
23
|
Abusarah J, Benabdoune H, Shi Q, Lussier
B, Martel-Pelletier J, Malo M, Fernandes JC, de Souza FP, Fahmi H
and Benderdour M: Elucidating the role of protandim and 6-Gingerol
in protection against osteoarthritis. J Cell Biochem.
118:1003–1013. 2017. View Article : Google Scholar : PubMed/NCBI
|
|
24
|
Dunn SL, Soul J, Anand S, Schwartz JM,
Boot-Handford RP and Hardingham TE: Gene expression changes in
damaged osteoarthritic cartilage identify a signature of
non-chondrogenic and mechanical responses. Osteoarthritis
Cartilage. 24:1431–1440. 2016. View Article : Google Scholar : PubMed/NCBI
|
|
25
|
Fu M, Huang G, Zhang Z, Liu J, Zhang Z,
Huang Z, Yu B and Meng F: Expression profile of long noncoding RNAs
in cartilage from knee osteoarthritis patients. Osteoarthritis
Cartilage. 23:423–432. 2015. View Article : Google Scholar : PubMed/NCBI
|
|
26
|
Stuart JM, Segal E, Koller D and Kim SK: A
gene-coexpression network for global discovery of conserved genetic
modules. Science. 302:249–255. 2003. View Article : Google Scholar : PubMed/NCBI
|
|
27
|
Fujii W, Kawahito Y, Nagahara H, Kukida Y,
Seno T, Yamamoto A, Kohno M, Oda R, Taniguchi D, Fujiwara H, et al:
Monocarboxylate transporter 4, associated with the acidification of
synovial fluid, is a novel therapeutic target for inflammatory
arthritis. Arthritis Rheumatol. 67:2888–2896. 2015. View Article : Google Scholar : PubMed/NCBI
|
|
28
|
Zhu X, Yang S, Lin W, Wang L, Ying J, Ding
Y and Chen X: Roles of cell cyle regulators cyclin D1, CDK4, and
p53 in knee osteoarthritis. Genet Test Mol Biomarkers. 20:529–534.
2016. View Article : Google Scholar : PubMed/NCBI
|
|
29
|
Troeberg L and Nagase H: Proteases
involved in cartilage matrix degradation in osteoarthritis. Biochim
Biophys Acta 1824. 133–145. 2012.
|
|
30
|
Ahmed U, Thornalley PJ and Rabbani N:
Possible role of methylglyoxal and glyoxalase in arthritis. Biochem
Soc Trans. 42:538–542. 2014. View Article : Google Scholar : PubMed/NCBI
|
|
31
|
Luo H, Yao L, Zhang Y and Li R: Liquid
chromatography-mass spectrometry-based quantitative proteomics
analysis reveals chondroprotective effects of astragaloside IV in
interleukin-1β-induced SW1353 chondrocyte-like cells. Biomed
Pharmacother. 91:796–802. 2017. View Article : Google Scholar : PubMed/NCBI
|
|
32
|
Andriacchi TP, Favre J, Erhart-Hledik JC
and Chu CR: A systems view of risk factors for knee osteoarthritis
reveals insights into the pathogenesis of the disease. Ann Biomed
Eng. 43:376–387. 2015. View Article : Google Scholar : PubMed/NCBI
|
|
33
|
Scanzello CR, Plaas A and Crow MK: Innate
immune system activation in osteoarthritis: Is osteoarthritis a
chronic wound? Curr Opin Rheumatol. 20:565–572. 2008. View Article : Google Scholar : PubMed/NCBI
|
|
34
|
Marchev AS, Dimitrova PA, Burns AJ, Kostov
RV, Dinkova-Kostova AT and Georgiev MI: Oxidative stress and
chronic inflammation in osteoarthritis: Can NRF2 counteract these
partners in crime? Ann N Y Acad Sci 1401. 114–135. 2017. View Article : Google Scholar
|
|
35
|
Hess J, Angel P and Schorpp-Kistner M:
AP-1 subunits: Quarrel and harmony among siblings. J Cell Sci.
117:5965–5973. 2004. View Article : Google Scholar : PubMed/NCBI
|
|
36
|
Ionescu AM, Schwarz EM, Vinson C, Puzas
JE, Rosier R, Reynolds PR and O'Keefe RJ: PTHrP modulates
chondrocyte differentiation through AP-1 and CREB signaling. J Biol
Chem. 276:11639–11647. 2001. View Article : Google Scholar : PubMed/NCBI
|
|
37
|
Schmucker AC, Wright JB, Cole MD and
Brinckerhoff CE: Distal interleukin-1β (IL-1β) response element of
human matrix metalloproteinase-13 (MMP-13) binds activator protein
1 (AP-1) transcription factors and regulates gene expression. J
Biol Chem. 287:1189–1197. 2012. View Article : Google Scholar : PubMed/NCBI
|
|
38
|
Moritani NH, Kubota S, Eguchi T, Fukunaga
T, Yamashiro T, Takano-Yamamoto T, Tahara H, Ohyama K, Sugahara T
and Takigawa M: Interaction of AP-1 and the ctgf gene: A possible
driver of chondrocyte hypertrophy in growth cartilage. J Bone Miner
Metab. 21:205–210. 2003.PubMed/NCBI
|
|
39
|
Papachristou D, Pirttiniemi P, Kantomaa T,
Agnantis N and Basdra EK: Fos- and Jun-related transcription
factors are involved in the signal transduction pathway of
mechanical loading in condylar chondrocytes. Eur J Orthod.
28:20–26. 2006. View Article : Google Scholar : PubMed/NCBI
|
|
40
|
Kim MG, Yang JH, Kim KM, Jang CH, Jung JY,
Cho IJ, Shin SM and Ki SH: Regulation of Toll-like
receptor-mediated Sestrin2 induction by AP-1, Nrf2, and the
ubiquitin-proteasome system in macrophages. Toxicol Sci.
144:425–435. 2015. View Article : Google Scholar : PubMed/NCBI
|
|
41
|
Briso EM, Guinea-Viniegra J, Bakiri L,
Rogon Z, Petzelbauer P, Eils R, Wolf R, Rincón M, Angel P and
Wagner EF: Inflammation-mediated skin tumorigenesis induced by
epidermal c-Fos. Genes Dev. 27:1959–1973. 2013. View Article : Google Scholar : PubMed/NCBI
|
|
42
|
Wu YH, Liu W, Zhang L, Liu XY, Wang Y, Xue
B, Liu B, Duan R, Zhang B and Ji Y: Effects of microRNA-24
targeting C-myc on apoptosis, proliferation, and cytokine
expressions in chondrocytes of rats with osteoarthritis via MAPK
signaling pathway. J Cell Biochem. 119:7944–7958. 2018. View Article : Google Scholar : PubMed/NCBI
|
|
43
|
Lemos DR, McMurdo M, Karaca G,
Wilflingseder J, Leaf IA, Gupta N, Miyoshi T, Susa K, Johnson BG,
Soliman K, et al: Interleukin-1β activates a MYC-dependent
metabolic switch in kidney stromal cells necessary for progressive
tubulointerstitial fibrosis. J Am Soc Nephrol. 29:1690–1705. 2018.
View Article : Google Scholar : PubMed/NCBI
|
|
44
|
Anderton B, Camarda R, Balakrishnan S,
Balakrishnan A, Kohnz RA, Lim L, Evason KJ, Momcilovic O, Kruttwig
K, Huang Q, et al: MYC-driven inhibition of the glutamate-cysteine
ligase promotes glutathione depletion in liver cancer. EMBO Rep.
18:569–585. 2017. View Article : Google Scholar : PubMed/NCBI
|
|
45
|
Chen D, Xiong XQ, Zang YH, Tong Y, Zhou B,
Chen Q, Li YH, Gao XY, Kang YM and Zhu GQ: BCL6 attenuates renal
inflammation via negative regulation of NLRP3 transcription. Cell
Death Dis. 8:e31562017. View Article : Google Scholar : PubMed/NCBI
|
|
46
|
Iezaki T, Ozaki K, Fukasawa K, Inoue M,
Kitajima S, Muneta T, Takeda S, Fujita H, Onishi Y, Horie T, et al:
ATF3 deficiency in chondrocytes alleviates osteoarthritis
development. J Pathol. 239:426–437. 2016. View Article : Google Scholar : PubMed/NCBI
|
|
47
|
Chen HH, Lai PF, Lan YF, Cheng CF, Zhong
WB, Lin YF, Chen TW and Lin H: Exosomal ATF3 RNA attenuates
pro-inflammatory gene MCP-1 transcription in renal
ischemia-reperfusion. J Cell Physiol. 229:1202–1211. 2014.
View Article : Google Scholar : PubMed/NCBI
|
|
48
|
Pernhorst K, Herms S, Hoffmann P, Cichon
S, Schulz H, Sander T, Schoch S, Becker AJ and Grote A: TLR4, ATF-3
and IL8 inflammation mediator expression correlates with seizure
frequency in human epileptic brain tissue. Seizure. 22:675–678.
2013. View Article : Google Scholar : PubMed/NCBI
|
|
49
|
Walsh DA, McWilliams DF, Turley MJ, Dixon
MR, Fransès RE, Mapp PI and Wilson D: Angiogenesis and nerve growth
factor at the osteochondral junction in rheumatoid arthritis and
osteoarthritis. Rheumatology (Oxford). 49:1852–1861. 2010.
View Article : Google Scholar : PubMed/NCBI
|
|
50
|
Tan Z, Chen K, Wu W, Zhou Y, Zhu J, Wu G,
Cao L, Zhang X, Guan H, Yang Y, et al: Overexpression of HOXC10
promotes angiogenesis in human glioma via interaction with PRMT5
and upregulation of VEGFA expression. Theranostics. 8:5143–5158.
2018. View Article : Google Scholar : PubMed/NCBI
|
|
51
|
Zan PF, Yao J, Wu Z, Yang Y, Hu S and Li
GD: Cyclin D1 gene silencing promotes IL-1β-induced apoptosis in
rat chondrocytes. J Cell Biochem. 119:290–299. 2018. View Article : Google Scholar : PubMed/NCBI
|
|
52
|
Lefebvre V and Dvir-Ginzberg M: SOX9 and
the many facets of its regulation in the chondrocyte lineage.
Connect Tissue Res. 58:2–14. 2017. View Article : Google Scholar : PubMed/NCBI
|
|
53
|
Li Z, Wang Q, Chen G, Li X, Yang Q, Du Z,
Ren M, Song Y and Zhang G: Integration of gene expression profile
data to screen and verify hub genes involved in osteoarthritis.
Biomed Res Int 2018. 94827262018.
|
|
54
|
Moskalev AA, Smit-McBride Z, Shaposhnikov
MV, Plyusnina EN, Zhavoronkov A, Budovsky A, Tacutu R and Fraifeld
VE: Gadd45 proteins: Relevance to aging, longevity and age-related
pathologies. Ageing Res Rev. 11:51–66. 2012. View Article : Google Scholar : PubMed/NCBI
|
|
55
|
Amente S, Zhang J, Lavadera ML, Lania L,
Avvedimento EV and Majello B: Myc and PI3K/AKT signaling
cooperatively repress FOXO3a-dependent PUMA and GADD45a gene
expression. Nucleic Acids Res. 39:9498–9507. 2011. View Article : Google Scholar : PubMed/NCBI
|
|
56
|
Novakofski KD, Torre CJ and Fortier LA:
Interleukin-1α, −6, and −8 decrease Cdc42 activity resulting in
loss of articular chondrocyte phenotype. J Orthop Res. 30:246–251.
2012. View Article : Google Scholar : PubMed/NCBI
|
|
57
|
Fortier LA and Miller BJ: Signaling
through the small G-protein Cdc42 is involved in insulin-like
growth factor-I resistance in aging articular chondrocytes. J
Orthop Res. 24:1765–1772. 2006. View Article : Google Scholar : PubMed/NCBI
|
|
58
|
Ushijima T, Okazaki K, Tsushima H and
Iwamoto Y: CCAAT/enhancer-binding protein β regulates the
repression of type II collagen expression during the
differentiation from proliferative to hypertrophic chondrocytes. J
Biol Chem. 289:2852–2863. 2014. View Article : Google Scholar : PubMed/NCBI
|
|
59
|
Lepetsos P, Papavassiliou KA and
Papavassiliou AG: Redox and NF-κB signaling in osteoarthritis. Free
Radic Biol Med. 132:90–100. 2019. View Article : Google Scholar : PubMed/NCBI
|
|
60
|
Morrovati F, Karimian Fathi N, Soleimani
Rad J and Montaseri A: Mummy prevents IL-1β-induced inflammatory
responses and cartilage matrix degradation via inhibition of NF-κB
subunits gene expression in pellet culture system. Adv Pharm Bull.
8:283–289. 2018. View Article : Google Scholar : PubMed/NCBI
|
|
61
|
Bradley EW, Carpio LR, Newton AC and
Westendorf JJ: Deletion of the PH-domain and leucine-rich repeat
protein phosphatase 1 (Phlpp1) increases fibroblast growth factor
(Fgf) 18 expression and promotes chondrocyte proliferation. J Biol
Chem. 290:16272–16280. 2015. View Article : Google Scholar : PubMed/NCBI
|
|
62
|
Loeser RF, Goldring SR, Scanzello CR and
Goldring MB: Osteoarthritis: A disease of the joint as an organ.
Arthritis Rheum. 64:1697–1707. 2012. View Article : Google Scholar : PubMed/NCBI
|
|
63
|
Guo SM, Wang JX, Li J, Xu FY, Wei Q, Wang
HM, Huang HQ, Zheng SL, Xie YJ and Zhang C: Identification of gene
expression profiles and key genes in subchondral bone of
osteoarthritis using weighted gene coexpression network analysis. J
Cell Biochem. 119:7687–7695. 2018. View Article : Google Scholar : PubMed/NCBI
|
|
64
|
Durand M, Komarova SV, Bhargava A,
Trebec-Reynolds DP, Li K, Fiorino C, Maria O, Nabavi N, Manolson
MF, Harrison RE, et al: Monocytes from patients with osteoarthritis
display increased osteoclastogenesis and bone resorption: The in
vitro osteoclast differentiation in arthritis study. Arthritis
Rheum. 65:148–158. 2013. View Article : Google Scholar : PubMed/NCBI
|
|
65
|
Bertuglia A, Lacourt M, Girard C,
Beauchamp G, Richard H and Laverty S: Osteoclasts are recruited to
the subchondral bone in naturally occurring post-traumatic equine
carpal osteoarthritis and may contribute to cartilage degradation.
Osteoarthritis Cartilage. 24:555–566. 2016. View Article : Google Scholar : PubMed/NCBI
|
|
66
|
Botter SM, van Osch GJ, Waarsing JH, van
der Linden JC, Verhaar JA, Pols HA, van Leeuwen JP and Weinans H:
Cartilage damage pattern in relation to subchondral plate thickness
in a collagenase-induced model of osteoarthritis. Osteoarthritis
Cartilage. 16:506–514. 2008. View Article : Google Scholar : PubMed/NCBI
|
|
67
|
Akasaki Y, Hasegawa A, Saito M, Asahara H,
Iwamoto Y and Lotz MK: Dysregulated FOXO transcription factors in
articular cartilage in aging and osteoarthritis. Osteoarthritis
Cartilage. 22:162–170. 2014. View Article : Google Scholar : PubMed/NCBI
|
|
68
|
Matsuzaki T, Alvarez-Garcia O, Mokuda S,
Nagira K, Olmer M, Gamini R, Miyata K, Akasaki Y, Su AI, Asahara H
and Lotz MK: FoxO transcription factors modulate autophagy and
proteoglycan 4 in cartilage homeostasis and osteoarthritis. Sci
Transl Med. 10(pii): eaan07462018. View Article : Google Scholar : PubMed/NCBI
|
|
69
|
Shen C, Cai GQ, Peng JP and Chen XD:
Autophagy protects chondrocytes from glucocorticoids-induced
apoptosis via ROS/Akt/FOXO3 signaling. Osteoarthritis Cartilage.
23:2279–2287. 2015. View Article : Google Scholar : PubMed/NCBI
|
|
70
|
Zeng GQ, Chen AB, Li W, Song JH and Gao
CY: High MMP-1, MMP-2, and MMP-9 protein levels in osteoarthritis.
Genet Mol Res. 14:14811–14822. 2015. View Article : Google Scholar : PubMed/NCBI
|
|
71
|
Sun HY, Hu KZ and Yin ZS: Inhibition of
the p38-MAPK signaling pathway suppresses the apoptosis and
expression of proinflammatory cytokines in human osteoarthritis
chondrocytes. Cytokine. 90:135–143. 2017. View Article : Google Scholar : PubMed/NCBI
|
|
72
|
Chang L, Graham PH and Ni J: Targeting
PI3K/Akt/mTOR signaling pathway in the treatment of prostate cancer
radioresistance. Crit Rev Oncol Hematol. 96:507–517. 2015.
View Article : Google Scholar : PubMed/NCBI
|
|
73
|
Xue JF, Shi ZM, Zou J and Li XL:
Inhibition of PI3K/AKT/mTOR signaling pathway promotes autophagy of
articular chondrocytes and attenuates inflammatory response in rats
with osteoarthritis. Biomed Pharmacother. 89:1252–1261. 2017.
View Article : Google Scholar : PubMed/NCBI
|
|
74
|
Yu SM and Kim SJ: The thymoquinone-induced
production of reactive oxygen species promotes dedifferentiation
through the ERK pathway and inflammation through the p38 and PI3K
pathways in rabbit articular chondrocytes. Int J Mol Med.
35:325–332. 2015. View Article : Google Scholar : PubMed/NCBI
|