Introduction
Lung cancer patients make up ~14% of newly diagnosed
cancer cases and is the second most widespread cancer worldwide
(1). Of those, ~85% are non-small
cell lung cancer (NSCLC) (2). Lung
cancer not only has high incidence, but also high death rate. It is
a huge healthcare and economic burden for both developing and
developed countries.
There are many possible factors that may contribute
to the genesis of lung cancer (2).
Genetics can explain a large proportion of lung cancer occurrence
as many single nucleotide polymorphisms have been discovered to be
associated with lung cancer susceptibility by genome-wide
association studies (3). Environment
factors, such as air pollution (4),
particulate matter 2.5 (5) and
smoking, can facilitate the epigenetic dysfunctions which will
interact with genetic changes and trigger tumorgenesis (2,6–9). Cigarette smoke includes over 5,000
compounds (10), such as nicotine,
free radicals, benzopyrene, catechols, polonium-210 and heavy
metals (11). Many of these
compounds are strong carcinogenic chemicals (12), which can interfere with DNA mismatch
repair and cause somatic mutations. Cigarette smoking accounts for
87% of lung cancer deaths (13) and
is the leading risk factor.
Unfortunately, the genetic mechanisms of smoking
leading to lung carcinogenesis are largely unknown and many
observations are contradictory (10). For example, benzoapyrene, a
carcinogenic chemical from smoke, can induce lung tumors in mice
but not in rats (14). On the
molecular level, several well-established signaling pathways, such
as cyclooxygenase and its derived prostanoids, peroxisome
proliferator-activated receptor γ and arachidonate 15-lipoxygenase,
epidermal growth factor receptor (EGFR) and the P13K/AKT/mTOR and
vascular endothelial growth factor-dependent angiogenetic pathway,
have been reported to have important roles (10). As a complex systems disease (2), lung cancer dysfunctions are dynamic and
the evolution of smoking-induced lung cancer, i.e. the series of
genetic events, can elucidate a more realistic picture of
tumorigenesis. With the rapid development of next-generation
sequencing, the somatic mutations in cancer patients can be more
easily identified. Based on somatic mutation data, the evolutionary
trajectories of cancer patients can be reconstructed. Caravagna
et al (15) developed an
algorithm called Pipeline for Cancer Inference (PiCnIc) to analyze
the colon adenocarcinoma and rectum adenocarcinoma (COAD/READ)
somatic mutation data from The Cancer Genome Atlas project. The
underlying somatic evolution based on Suppes' probabilistic
causation was reconstructed (16)
and it was determined that mutations in APC regulator of WNT
signaling pathway, KRAS proto-oncogene, and tumor protein p53 were
primary events for micro-satellite stable COAD/READ tumors, which
was consistent with previous literature. Brown et al
(17), performed phylogenetic
analysis on whole-exome sequencing and copy number profiling data
of primary and metastatic breast cancer samples and inferred the
phylogeny of genomic alterations during breast cancer progression.
The study utilized the Dollo parsimony method and the branch and
bound exhaustive search algorithm described in Felsenstein
(18), to reconstruct the
phylogenetic tree.
To investigate the genomic alterations triggered by
smoking, the present study analyzed the somatic mutations in 100
NSCLC patients. The different genomic alterations amongst
non-smokers, ex-smokers and smokers were identified and the most
frequent genetic alterations of each smoking subgroup were analyzed
to construct oncogenetic trees, which revealed the evolutionary
trajectories of smoking NSCLC. The present results provided novel
insights into NSCLC development due to smoking and also identified
potential intervention targets for treating NSCLC patients.
Materials and methods
NSCLC somatic mutation dataset
TRAcking Cancer Evolution through therapy (TRACERx)
Consortium is a multi-million pound project funded by Cancer
Research UK to better understand the genetic risks of lung cancer
through exploring the human genome. The present study obtained the
somatic mutation data and smoking status data of 100 NSCLC patients
from Jamal-Hanjani et al (19). The clinical information of these 100
patients are provided in Table SI.
The dataset consists of 12 people who never smoked in their life,
48 people who used to smoke but have quit smoking for >20 years
and 40 current smokers or recent ex-smokers. The somatic mutations
were annotated to genes. If there were non-synonymous exonic
alterations within a gene, this was considered as a mutated gene
and it was allocated ‘1’; otherwise genes were classed as ‘0’.
There were 11,345 genes that were mutated in at least 1 of the 100
NSCLC patients. An 11345×100 matrix was produced where rows denoted
genes, the columns were patients and the binary value indicated
whether the particular gene was mutated in this patient.
Unlike the TRACERx study by Jamal-Hanjani et
al (19), which analyzed the
intratumor heterogeneity by constructing phylogenetic trees for
each patient, the present study was interested in characterizing
the general mutation pattern within patient subtypes.
Identifying the mutated genes amongst
different smoking status groups
To identify the various mutated genes amongst
different smoking status groups, the Fisher's Exact Test (20) was applied for the confusion table of
mutation status and smoking status. P<0.05 was considered to
indicate statistical significance.
Construction of the evolutionary
trajectories for different smoking status groups
How the most frequently mutated genes evolved in
different smoking status groups was analyzed using Oncotree
(21,22), a widely used method for oncogenetic
tree deduction (23).
In an oncogenetic tree model, the evolutionary
trajectories of tumor genesis are simplified and the causality
between genetic alteration events is assumed to occur sequentially.
In addition, the causation of a genetic alteration event by another
is independent of other causations.
The Oncotree method involves several steps. First, a
set of the most relevant genetic events is selected. For the
present study, the top 10 most frequent genetic alterations for
each smoking status group were considered as relevant for the
progression of the tumor group and therefore were selected to be
modeled. Then, each pair of such genetic events was assigned a
weight corresponding to the probabilities of joint or individual
occurrence. Finally, based on the assigned weights, the optimal
oncogenetic tree was inferred as maximum-weight branching (21,22).
The method was applied for the present study using R
package Oncotree (http://cran.r-project.org/web/packages/Oncotree/).
Annotation of the biological function
of the mutated genes
WebGestalt was used to annotate the biological
function of the mutated genes (24).
WebGestalt is a widely used online enrichment tool to model
organisms including human, mouse, rat, yeast, fruit fly and
Caenorhabditis elegans. It has many annotation databases
integrated, including Kyoto Encyclopedia of Genes and Genomes, Gene
Ontology, DrugBank and Online Mendelian Inheritance in Man. The
P-value of overrepresentation enrichment analysis was multiple
test-adjusted as the false discovery rate (FDR). In the present
study, the enriched categories with FDR<0.2 were considered as
significant.
Results and Discussion
A total of 68 genes demonstrate
different mutation patterns amongst smoking status groups
Fisher's exact test was used to identify the
different mutated genes amongst the various smoking status groups.
A total of 68 gene mutations were considered as significant to
smoking status (P<0.05; Table I).
The OncoPrinter plots of these 68 genes in the three different
smoking status groups, non-smoker, ex-smoker and smoker, are
displayed in Fig. 1. The genes were
ranked based on the mutation frequency in all lung cancer patients.
Zinc finger homeobox 4 (ZFHX4), usherin (USH2A), CUB and Sushi
multiple domains 1 (CSMD1), CUB and Sushi multiple domains 2
(CSMD2), spectrin α erythrocytic 1 (SPTA1), pappalysin 2 (PAPPA2),
dynein axonemal heavy chain 9 (DNAH9), contactin-associated protein
like 5 (CNTNAP5), additional sex combs like 3 (ASXL3) were highly
mutated in ex-smokers and smokers, but not in non-smokers. The
mutation rate was associated the smoking status with the current
smokers demonstrating the highest rate of mutated genes. There were
several non-smoker specific mutations, such as lysine demethylase 8
(KDM8), zinc finger protein 677 (ZNF677), TEA domain transcription
factor 1 (TEAD1) and phosphatidylinositol glycan anchor
biosynthesis class M (PIGM). These non-smoker specific mutations
suggested that tumorigenesis of lung cancer in non-smoker patients
was different from the tumorigenesis of lung cancer in smoking
patients.
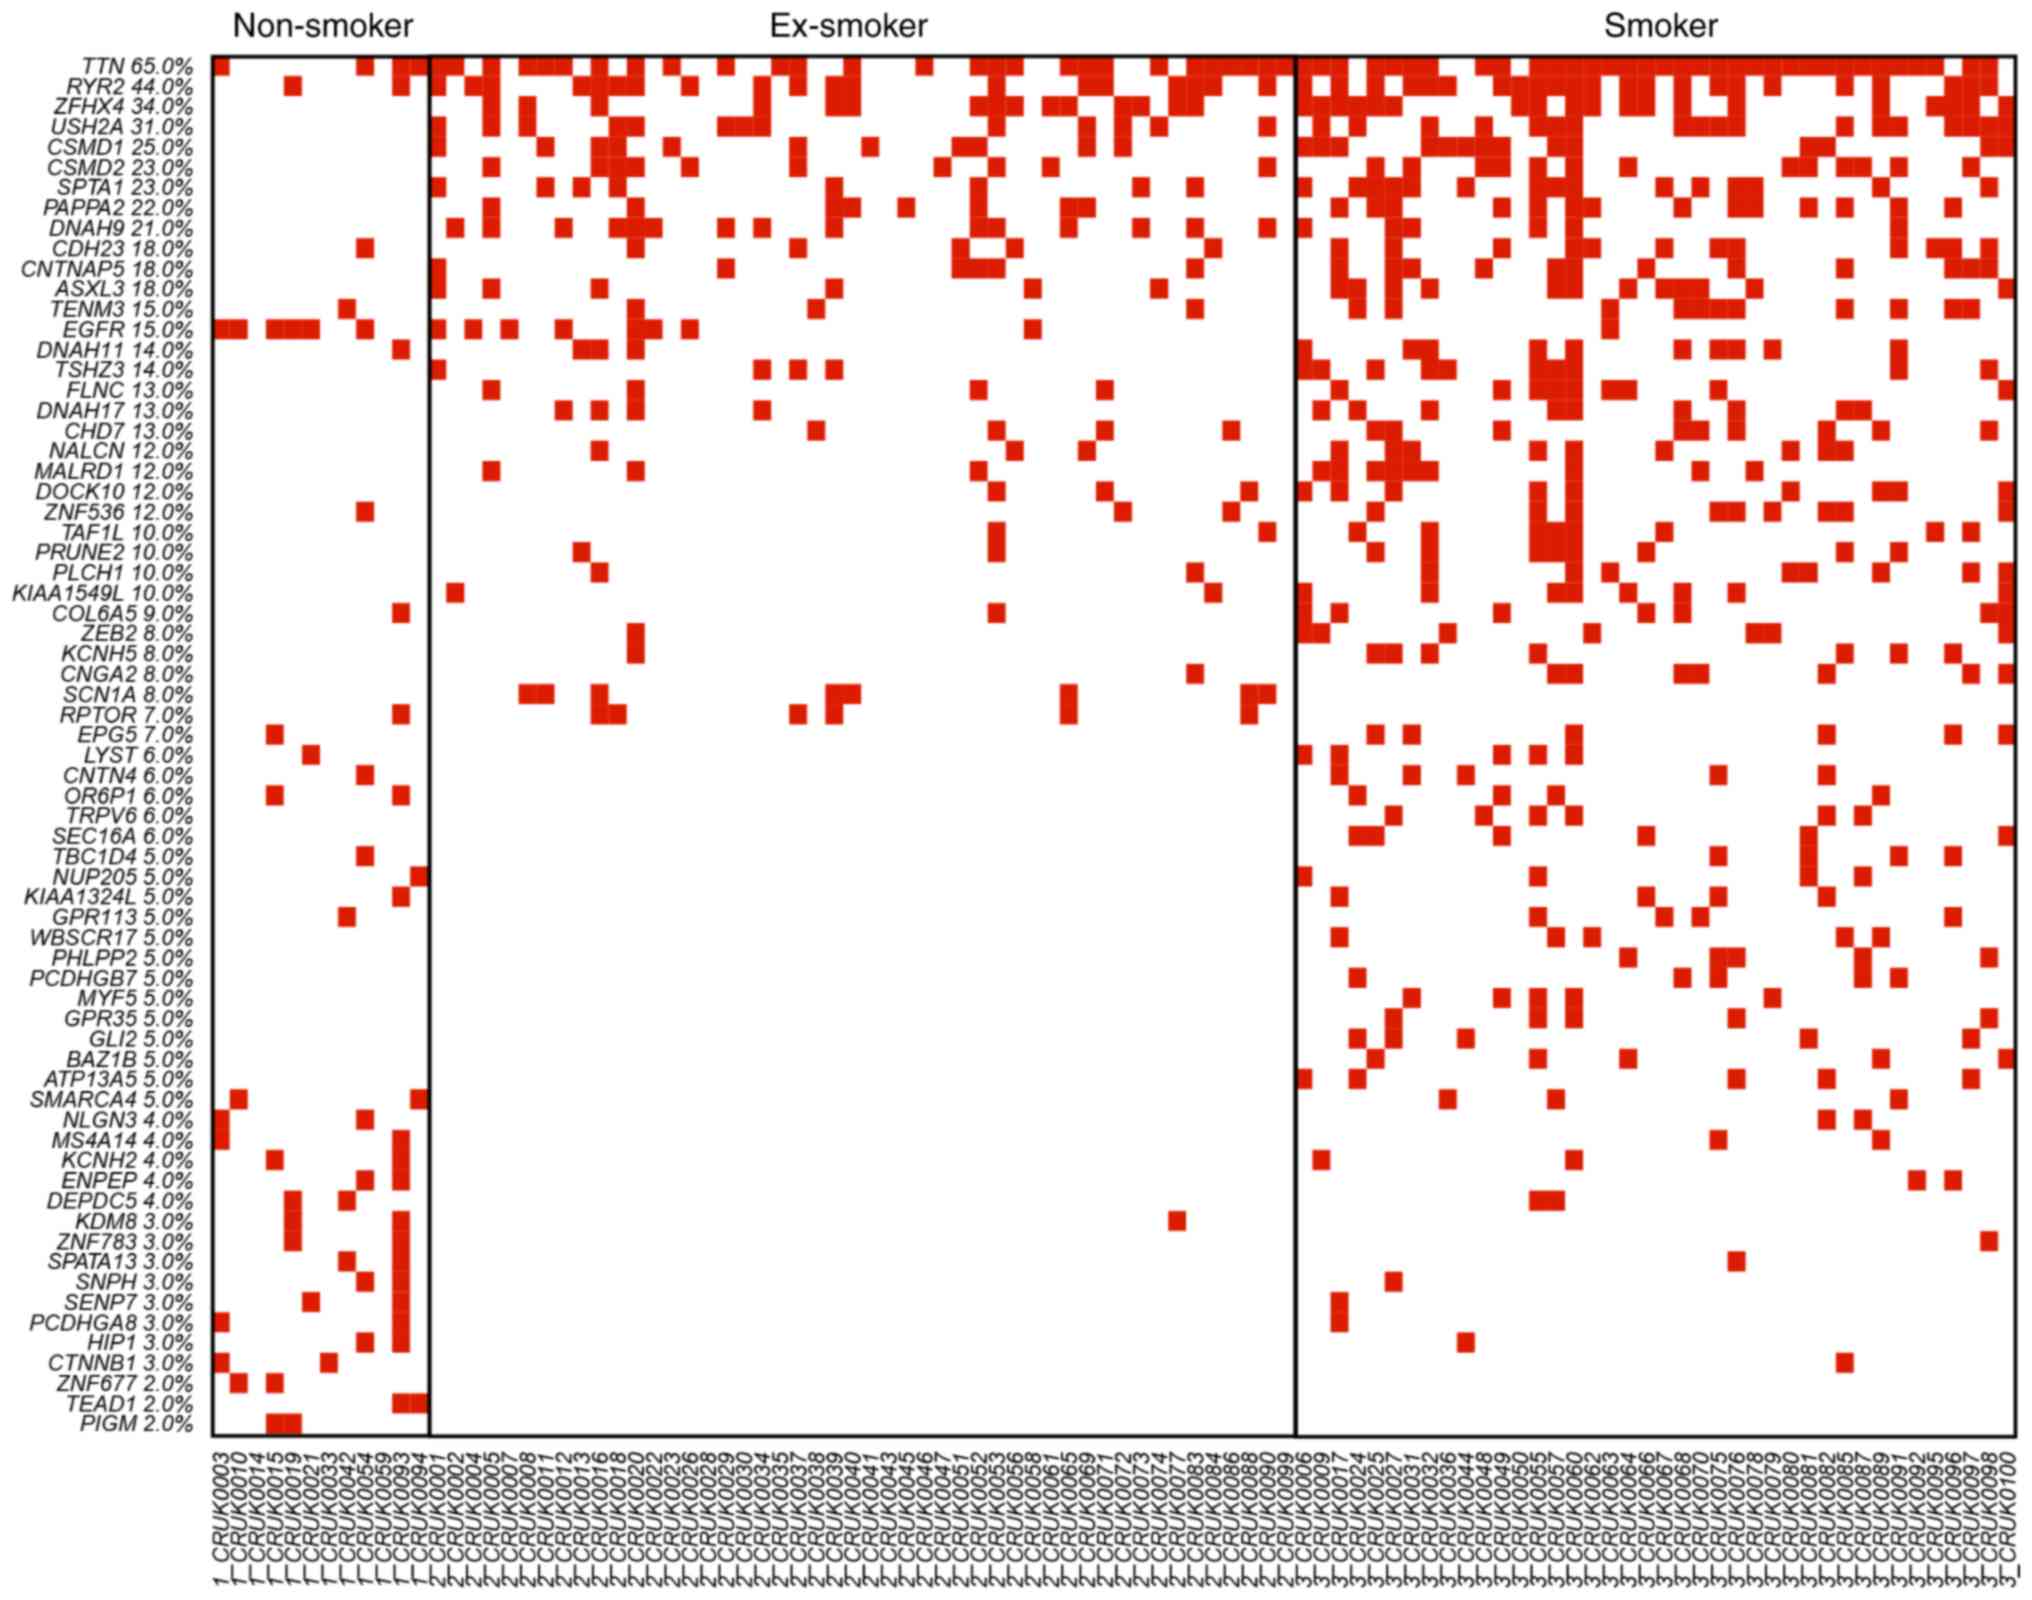 | Figure 1.OncoPrinter plot of the 68 mutated
genes in non-smokers, ex-smokers and smokers. The genes were ranked
by the mutation frequency in all lung cancer patients. ZFHX4,
USH2A, CSMD1, CSMD2, SPTA1, PAPPA2, DNAH9, CNTNAP5 and ASXL3 were
highly mutated in ex-smokers and smokers but not in non-smokers.
Smokers had the highest rate of mutated genes, with smoking status
directly correlated with number of mutations. KDM8, ZNF677, TEAD1
and PIGM were non-smoker specific mutations. The different mutation
patterns suggested the tumor genesis of non-smoker lung cancer
patients was different from the tumor genesis of smoking lung
cancer patients. ZFHX4, zinc finger homeobox 4; USH2A, usherin;
CSMD1, CUB and Sushi multiple domains 1; CSMD2, CUB and Sushi
multiple domains 2; SPTA1, spectrin α erythrocytic 1; PAPPA2,
pappalysin 2; DNAH9, dynein axonemal heavy chain 9; CNTNAP5,
contactin-associated protein like 5; ASXL3, additional sex combs
like 3; KDM8, lysine demethylase 8; ZNF677, zinc finger protein
677; TEAD1, TEA domain transcription factor 1; PIGM,
phosphatidylinositol glycan anchor biosynthesis class M. |
 | Table I.A total of 68 genes that demonstrated
different mutation patterns amongst non-smokers, ex-smokers and
smokers. |
Table I.
A total of 68 genes that demonstrated
different mutation patterns amongst non-smokers, ex-smokers and
smokers.
| Gene symbol | Gene name | NCBI gene ID | Fisher's exact test
P-value |
|---|
| EGFR | Epidermal growth
factor receptor | 1956 | 0.00052 |
| TTN | Titin | 7273 | 0.00071 |
| ZFHX4 | Zinc finger homeobox
4 | 79776 | 0.00433 |
| USH2A | Usherin | 7399 | 0.00549 |
| SPTA1 | Spectrin α,
erythrocytic 1 | 6708 | 0.00753 |
| TRPV6 | Transient receptor
potential cation channel subfamily V member 6 | 55503 | 0.00988 |
| SEC16A | SEC16 homolog A,
endoplasmic reticulum export factor | 9919 | 0.00988 |
| SCN1A | Sodium
voltage-gated channel α subunit 1 | 6323 | 0.01216 |
| ZNF677 | Zinc finger protein
677 | 342926 | 0.01333 |
| TEAD1 | TEA domain
transcription factor 1 | 7003 | 0.01333 |
| PIGM |
Phosphatidylinositol glycan anchor
biosynthesis class M | 93183 | 0.01333 |
| EPG5 | Ectopic P-granules
autophagy protein 5 homolog | 57724 | 0.01427 |
| TENM3 | Teneurin
transmembrane protein 3 | 55714 | 0.01482 |
| OR6P1 | Olfactory receptor
family 6 subfamily P member 1 | 128366 | 0.01494 |
| PAPPA2 | Pappalysin 2 | 60676 | 0.01743 |
| ZNF783 | Zinc finger family
member 783 | 100289678 | 0.01769 |
| CTNNB1 | Catenin β 1 | 1499 | 0.01769 |
| SPATA13 | Spermatogenesis
associated 13 | 221178 | 0.01769 |
| HIP1 | Huntingtin
interacting protein 1 | 3092 | 0.01769 |
| SENP7 | SUMO1/sentrin
specific peptidase 7 | 57337 | 0.01769 |
| PCDHGA8 | Protocadherin γ
subfamily A, 8 | 9708 | 0.01769 |
| SNPH | Syntaphilin | 9751 | 0.01769 |
| ENPEP | Glutamyl
aminopeptidase | 2028 | 0.01819 |
| KCNH2 | Potassium
voltage-gated channel subfamily H member 2 | 3757 | 0.01819 |
| NLGN3 | Neuroligin 3 | 54413 | 0.01819 |
| MS4A14 | Membrane spanning
4-domains A14 | 84689 | 0.01819 |
| DEPDC5 | DEP domain
containing 5 | 9681 | 0.01819 |
| SMARCA4 | SWI/SNF related,
matrix associated, actin dependent regulator of chromatin,
subfamily a, member 4 | 6597 | 0.02044 |
| LYST | Lysosomal
trafficking regulator | 1130 | 0.02157 |
| CNTN4 | Contactin 4 | 152330 | 0.02157 |
| ZNF536 | Zinc finger protein
536 | 9745 | 0.02420 |
| CNTNAP5 | Contactin
associated protein like 5 | 129684 | 0.02459 |
| ASXL3 | Additional sex
combs like 3, transcriptional regulator | 80816 | 0.02459 |
| DNAH9 | Dynein axonemal
heavy chain 9 | 1770 | 0.02568 |
| CNGA2 | Cyclic nucleotide
gated channel α 2 | 1260 | 0.02841 |
| KCNH5 | Potassium
voltage-gated channel subfamily H member 5 | 27133 | 0.02841 |
| ZEB2 | Zinc finger E-box
binding homeobox 2 | 9839 | 0.02841 |
| PHLPP2 | PH domain and
leucine rich repeat protein phosphatase 2 | 23035 | 0.02918 |
| GLI2 | GLI family zinc
finger 2 | 2736 | 0.02918 |
| GPR35 | G protein-coupled
receptor 35 | 2859 | 0.02918 |
| ATP13A5 | Atpase 13A5 | 344905 | 0.02918 |
| MYF5 | Myogenic factor
5 | 4617 | 0.02918 |
| PCDHGB7 | Protocadherin γ
subfamily B, 7 | 56099 | 0.02918 |
| WBSCR17 | Williams-Beuren
syndrome chromosome region 17 | 64409 | 0.02918 |
| BAZ1B | Bromodomain
adjacent to zinc finger domain 1B | 9031 | 0.02918 |
| COL6A5 | Collagen type VI α5
chain | 256076 | 0.03141 |
| CSMD1 | CUB and Sushi
multiple domains 1 | 64478 | 0.03183 |
| RYR2 | Ryanodine receptor
2 | 6262 | 0.03217 |
| TSHZ3 | Teashirt zinc
finger homeobox 3 | 57616 | 0.03459 |
| KDM8 | Lysine demethylase
8 | 79831 | 0.03728 |
| NALCN | Sodium leak
channel, non-selective | 259232 | 0.03732 |
| MALRD1 | MAM and LDL
receptor class A domain containing 1 | 340895 | 0.03732 |
| DOCK10 | Dedicator of
cytokinesis 10 | 55619 | 0.03732 |
| DNAH11 | Dynein axonemal
heavy chain 11 | 8701 | 0.03857 |
| TAF1L | TATA-box binding
protein associated factor 1 like | 138474 | 0.04006 |
| PRUNE2 | Prune homolog
2 | 158471 | 0.04006 |
| PLCH1 | Phospholipase C eta
1 | 23007 | 0.04006 |
| KIAA1549L | KIAA1549 like | 25758 | 0.04006 |
| RPTOR | Regulatory
associated protein of MTOR complex 1 | 57521 | 0.04165 |
| CSMD2 | CUB and Sushi
multiple domains 2 | 114784 | 0.04312 |
| CDH23 | Cadherin related
23 | 64072 | 0.04357 |
| KIAA1324L | KIAA1324 like | 222223 | 0.04374 |
| NUP205 | Nucleoporin
205 | 23165 | 0.04374 |
| TBC1D4 | TBC1 domain family
member 4 | 9882 | 0.04374 |
| FLNC | Filamin C | 2318 | 0.04717 |
| CHD7 | Chromodomain
helicase DNA binding protein 7 | 55636 | 0.04717 |
| DNAH17 | Dynein axonemal
heavy chain 17 | 8632 | 0.04717 |
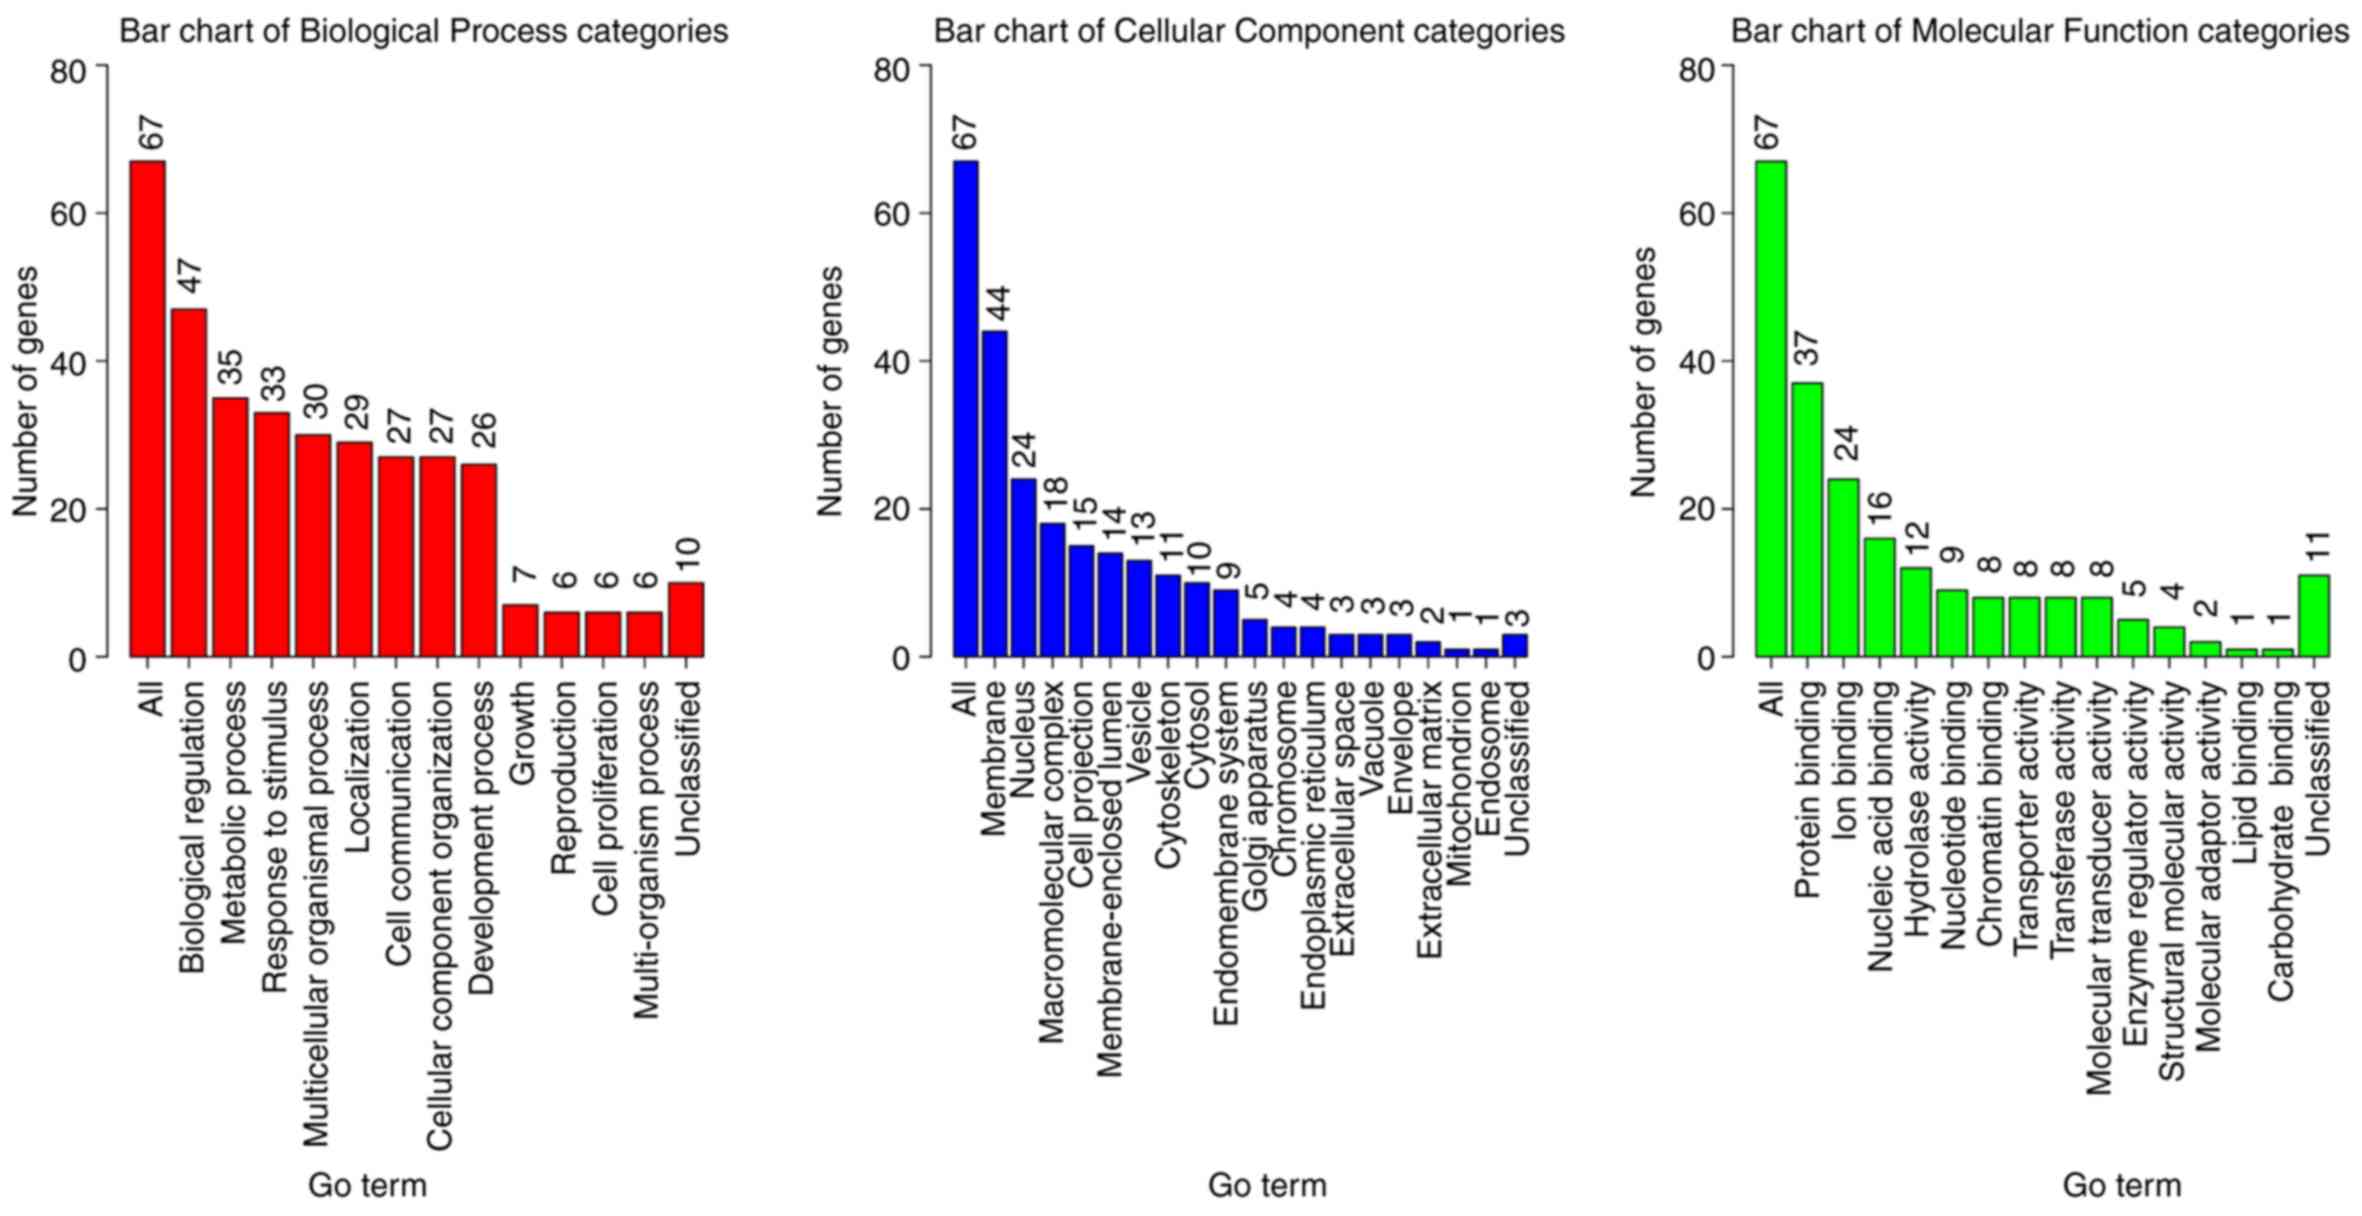
Biological functions of the 68 gene
mutations associated with smoking status
The 68 gene mutations associated with smoking status
were annotated using Gene Ontology (GO) and the biological process
(BP), cellular component (CC) and molecular function (MF)
categories (Fig. 2). Numerous genes
were annotated to be membrane proteins with biological regulation,
metabolic process, and response to stimulus functions (Fig. 2). These results were expected since
smoke is a xenobiotic stimulus to the human body and the chemicals
can affect normal metabolic processes, and alter the biological
regulations. Rigorous statistical test for the enrichment
significance using WebGestalt was performed for deeper
investigation into gene function (24) with significantly enriched BP
(Table II), CC (Table III) and MF (Table IV) categories. It was demonstrated
that the organ development, morphogenesis of an epithelial fold,
muscle tissue morphogenesis and the muscle organ morphogenesis
categories were enriched (Table
II). These genes may serve an important role in tumor
initiation and help transform the normal lung tissue to tumor
tissue. Proteins associated with the plasma membrane were enriched
(Table III), which was consistent
with the preliminary biological function analysis (Fig. 2), and indicated that the mutated
genes were involved in stimulus response. In addition, enrichment
of proteins associated with muscle/fiber functions suggested that
the mutated genes may change the lung muscle structure. Significant
enrichment of multiple binding functions proved that the mutated
genes were key players in signaling transduction and regulation
(Table IV), which may amplify the
dysfunctions and accelerate tumorigenesis.
| Table II.Significantly enriched GO biological
process categories of the 68 mutated genes associated with smoking
status. |
Table II.
Significantly enriched GO biological
process categories of the 68 mutated genes associated with smoking
status.
| GO ID | Description | P-value | FDR | Overlap genes |
|---|
| GO:0007423 | Sensory organ
development |
4.48×10⁻⁵ | 0.1801 | CTNNB1, EGFR, GLI2,
MYF5, CHD7, TENM3, CDH23, SMARCA4, USH2A, ZEB2 |
| GO:0098655 | Cation
transmembrane transport | 0.0001085 | 0.1801 | CNGA2, NALCN,
KCNH5, GPR35, ATP13A5, KCNH2, NLGN3, TRPV6, CHD7, RYR2, SCN1A |
| GO:0034765 | Regulation of ion
transmembrane transport | 0.0001252 | 0.1801 | NALCN, KCNH5,
GPR35, KCNH2, NLGN3, CHD7, RYR2, SCN1A |
| GO:0042391 | Regulation of
membrane potential | 0.0001286 | 0.1801 | CNGA2, NALCN,
KCNH5, GPR35, KCNH2, NLGN3, RYR2, SCN1A |
| GO:0034762 | Regulation of
transmembrane transport | 0.0001394 | 0.1801 | NALCN, KCNH5,
GPR35, KCNH2, NLGN3, CHD7, RYR2, SCN1A |
| GO:0006812 | Cation
transport | 0.0001504 | 0.1801 | CNGA2, CTNNB1,
NALCN, KCNH5, GPR35, ATP13A5, KCNH2, NLGN3, TRPV6, CHD7, RYR2,
SCN1A, CDH23 |
| GO:0060571 | Morphogenesis of an
epithelial fold | 0.0002124 | 0.1974 | CTNNB1, EGFR,
GLI2 |
| GO:0043010 | Camera-type eye
development | 0.0002382 | 0.1974 | CTNNB1, EGFR, MYF5,
CHD7, TENM3, SMARCA4, ZEB2 |
| GO:0060415 | Muscle tissue
morphogenesis | 0.0002664 | 0.1974 | MYF5, CHD7, RYR2,
TTN |
| GO:0048644 | Muscle organ
morphogenesis | 0.0002865 | 0.1974 | MYF5, CHD7, RYR2,
TTN |
| GO:0001508 | Action
potential | 0.0003213 | 0.1974 | NALCN, GPR35,
KCNH2, RYR2, SCN1A |
| GO:0030001 | Metal ion
transport | 0.0003543 | 0.1974 | CNGA2, CTNNB1,
NALCN, KCNH5, GPR35, KCNH2, TRPV6, CHD7, RYR2, SCN1A, CDH23 |
| GO:0043269 | Regulation of ion
transport | 0.0003573 | 0.1974 | CTNNB1, NALCN,
KCNH5, GPR35, KCNH2, NLGN3, CHD7, RYR2, SCN1A |
| Table III.Significantly enriched GO cellular
component categories of the 68 mutated genes associated with
smoking status. |
Table III.
Significantly enriched GO cellular
component categories of the 68 mutated genes associated with
smoking status.
| GO ID | Description | P-value | FDR | Overlap genes |
|---|
| GO:0030018 | Z disc |
4.49×10⁻⁵ | 0.0294 | CTNNB1, FLNC, RYR2,
SCN1A, TTN |
| GO:0031674 | I band | 6.91E-05 | 0.0294 | CTNNB1, FLNC, RYR2,
SCN1A, TTN |
| GO:0044459 | Plasma membrane
part | 0.000105 | 0.0297 | CNGA2, CTNNB1,
EGFR, ENPEP, SPATA13, PHLPP2, KCNH5, GPR35, HIP1, ATP13A5, KCNH2,
NLGN3, TRPV6, TENM3, PCDHGB7, SCN1A, SPTA1, USH2A, PCDHGA8,
SNPH |
| GO:0030017 | Sarcomere | 0.00029 | 0.0572 | CTNNB1, FLNC, RYR2,
SCN1A, TTN |
| GO:0042995 | Cell
projection | 0.000359 | 0.0572 | CNGA2, CTNNB1,
CNTN4, DNAH9, SPATA13, PHLPP2, GLI2, TENM3, RPTOR, TSHZ3, CDH23,
SPTA1, USH2A, DNAH11, SNPH |
| GO:0044449 | Contractile fiber
part | 0.000456 | 0.0572 | CTNNB1, FLNC, RYR2,
SCN1A, TTN |
| GO:0030016 | Myofibril | 0.000471 | 0.0572 | CTNNB1, FLNC, RYR2,
SCN1A, TTN |
| GO:0043292 | Contractile
fiber | 0.000588 | 0.0625 | CTNNB1, FLNC, RYR2,
SCN1A, TTN |
| GO:0030122 | AP-2 adaptor
complex | 0.000942 | 0.0801 | EGFR, HIP1 |
| GO:0030128 | Clathrin coat of
endocytic vesicle | 0.000942 | 0.0801 | EGFR, HIP1 |
| GO:0098590 | Plasma membrane
region | 0.001172 | 0.0906 | CNGA2, CTNNB1,
EGFR, ENPEP, SPATA13, PHLPP2, HIP1, NLGN3, USH2A, SNPH |
| GO:0030132 | Clathrin coat of
coated pit | 0.001618 | 0.1146 | EGFR, HIP1 |
| GO:0097458 | Neuron part | 0.002216 | 0.1449 | CNTN4, PHLPP2,
HIP1, TENM3, RPTOR, TSHZ3, CDH23, SMARCA4, SPTA1, USH2A, SNPH |
| GO:0090575 | RNA polymerase II
transcription factor complex | 0.002476 | 0.1478 | TAF1L, CTNNB1,
MYF5 |
| GO:0005929 | Cilium | 0.003008 | 0.1478 | CNGA2, DNAH9,
PHLPP2, GLI2, USH2A, DNAH11 |
| GO:0043234 | Protein
complex | 0.003037 | 0.1478 | TAF1L, CTNNB1,
DNAH9, EGFR, NUP205, COL6A5, HIP1, MYF5, RPTOR, RYR2, SMARCA4,
TEAD1, TTN, USH2A, DNAH11, DEPDC5 |
| GO:0030125 | Clathrin vesicle
coat | 0.003127 | 0.1478 | EGFR, HIP1 |
| GO:0031226 | Intrinsic component
of plasma membrane | 0.003156 | 0.1478 | CNGA2, ENPEP,
KCNH5, GPR35, ATP13A5, KCNH2, NLGN3, TRPV6, TENM3, PCDHGB7, SCN1A,
SPTA1, PCDHGA8 |
| GO:0031253 | Cell projection
membrane | 0.003305 | 0.1478 | CNGA2, CTNNB1,
SPATA13, PHLPP2, USH2A |
| GO:0098858 | Actin-based cell
projection | 0.003565 | 0.1515 | CTNNB1, SPATA13,
CDH23, USH2A |
| GO:0030131 | Clathrin adaptor
complex | 0.004254 | 0.1718 | EGFR, HIP1 |
| GO:0031090 | Organelle
membrane | 0.004448 | 0.1718 | CNGA2, EGFR, ENPEP,
PHLPP2, NUP205, HIP1, MALRD1, RPTOR, RYR2, WBSCR17, DEPDC5, SNPH,
TBC1D4, SEC16A |
| GO:0044441 | Ciliary part | 0.004724 | 0.1746 | CNGA2, DNAH9,
PHLPP2, GLI2, USH2A |
| GO:0044798 | Nuclear
transcription factor complex | 0.005127 | 0.1816 | TAF1L, CTNNB1,
MYF5 |
| Table IV.Significantly enriched GO molecular
function categories of the 68 mutated genes associated with smoking
status. |
Table IV.
Significantly enriched GO molecular
function categories of the 68 mutated genes associated with smoking
status.
| GO ID | Description | P-value | FDR | Overlap genes |
|---|
| GO:0044877 | Macromolecular
complex binding |
2.18×10⁻⁵ | 0.0308 | CTNNB1, EGFR, FLNC,
GLI2, HIP1, CHD7, RPTOR, TSHZ3, SMARCA4, SPTA1, TTN, USH2A, KDM8,
BAZ1B, DEPDC5 |
| GO:0070577 | Lysine-acetylated
histone binding | 5.57E-05 | 0.0393 | TAF1L, SMARCA4,
BAZ1B |
| GO:0005516 | Calmodulin
binding | 9.33E-05 | 0.0418 | CNGA2, EGFR, KCNH5,
TRPV6, RYR2, TTN |
| GO:0051015 | Actin filament
binding | 0.000118 | 0.0418 | EGFR, FLNC, HIP1,
SPTA1, TTN |
| GO:0005261 | Cation channel
activity | 0.000273 | 0.0742 | CNGA2, NALCN,
KCNH5, KCNH2, TRPV6, RYR2, SCN1A |
| GO:0003682 | Chromatin
binding | 0.0004 | 0.0742 | CTNNB1, EGFR, GLI2,
CHD7, TSHZ3, SMARCA4, KDM8, BAZ1B |
| GO:0000155 | Phosphorelay sensor
kinase activity | 0.000443 | 0.0742 | KCNH5, KCNH2 |
| GO:0004673 | Protein histidine
kinase activity | 0.000443 | 0.0742 | KCNH5, KCNH2 |
| GO:0046982 | Protein
heterodimerization activity | 0.000472 | 0.0742 | CTNNB1, EGFR,
KCNH5, HIP1, MYF5, TENM3, SPTA1 |
| GO:0005244 | Voltage-gated ion
channel activity | 0.000918 | 0.118 | CNGA2, NALCN,
KCNH5, KCNH2, SCN1A |
| GO:0022832 | Voltage-gated
channel activity | 0.000918 | 0.118 | CNGA2, NALCN,
KCNH5, KCNH2, SCN1A |
| GO:0016775 | Phosphotransferase
activity, nitrogenous group as acceptor | 0.001053 | 0.1241 | KCNH5, KCNH2 |
| GO:0005216 | Ion channel
activity | 0.001884 | 0.1874 | CNGA2, NALCN,
KCNH5, KCNH2, TRPV6, RYR2, SCN1A |
| GO:0046873 | Metal ion
transmembrane transporter activity | 0.001917 | 0.1874 | CNGA2, NALCN,
KCNH5, KCNH2, TRPV6, RYR2, SCN1A |
| GO:0001159 | Core promoter
proximal region DNA binding | 0.001988 | 0.1874 | GLI2, MYF5, CHD7,
SMARCA4, TEAD1, ZNF536 |
| GO:0022838 | Substrate-specific
channel activity | 0.002202 | 0.1896 | CNGA2, NALCN,
KCNH5, KCNH2, TRPV6, RYR2, SCN1A |
| GO:0008324 | Cation
transmembrane transporter activity | 0.002279 | 0.1896 | CNGA2, NALCN,
KCNH5, ATP13A5, KCNH2, TRPV6, RYR2, SCN1A |
| GO:0022836 | Gated channel
activity | 0.002541 | 0.1903 | CNGA2, NALCN,
KCNH5, KCNH2, RYR2, SCN1A |
| GO:0032403 | Protein complex
binding | 0.002557 | 0.1903 | EGFR, FLNC, HIP1,
RPTOR, SPTA1, TTN, USH2A, DEPDC5 |
Evolutionary trajectories of
non-smoker, ex-smoker and smoker lung cancer patients
Cancer is a complex multigene and multiprocess
disease. The tumorigenesis of colorectal cancer is well studied
(25,26) and can be used as a perfect example to
explain the roles of mutations in causing pathway dysfunctions. The
process includes several steps (25): i) Mutation of mismatch-repair (MMR)
gene; ii) microsatellite instability (MSI) pathway dysfunction
caused by MMR mutation; iii) normal epithelium becomes small
adenoma; iv) chromosomal instability and mutations in KRAS and
BRAF; v) serrated adenoma pathway dysfunction triggered by BRAF
mutation; vi) small adenoma becomes large adenoma; and vii)
mutations of PIK3CA, PTEN, tumor protein p53 (TP53), BAX, SMAD4 and
transforming growth factor β receptor 2 accelerate the progression
from large adenoma to cancer.
Similarly, lung cancer must also have several
mutational events, which occur sequentially to initiate and
accelerate tumorigenesis. Smoking is a major risk factor that can
cause genetic and epigenetic changes that alter the tumorigenesis
procedures. Research into this process will help explain the
mechanism differences between smoker and non-smoker lung cancer
patients.
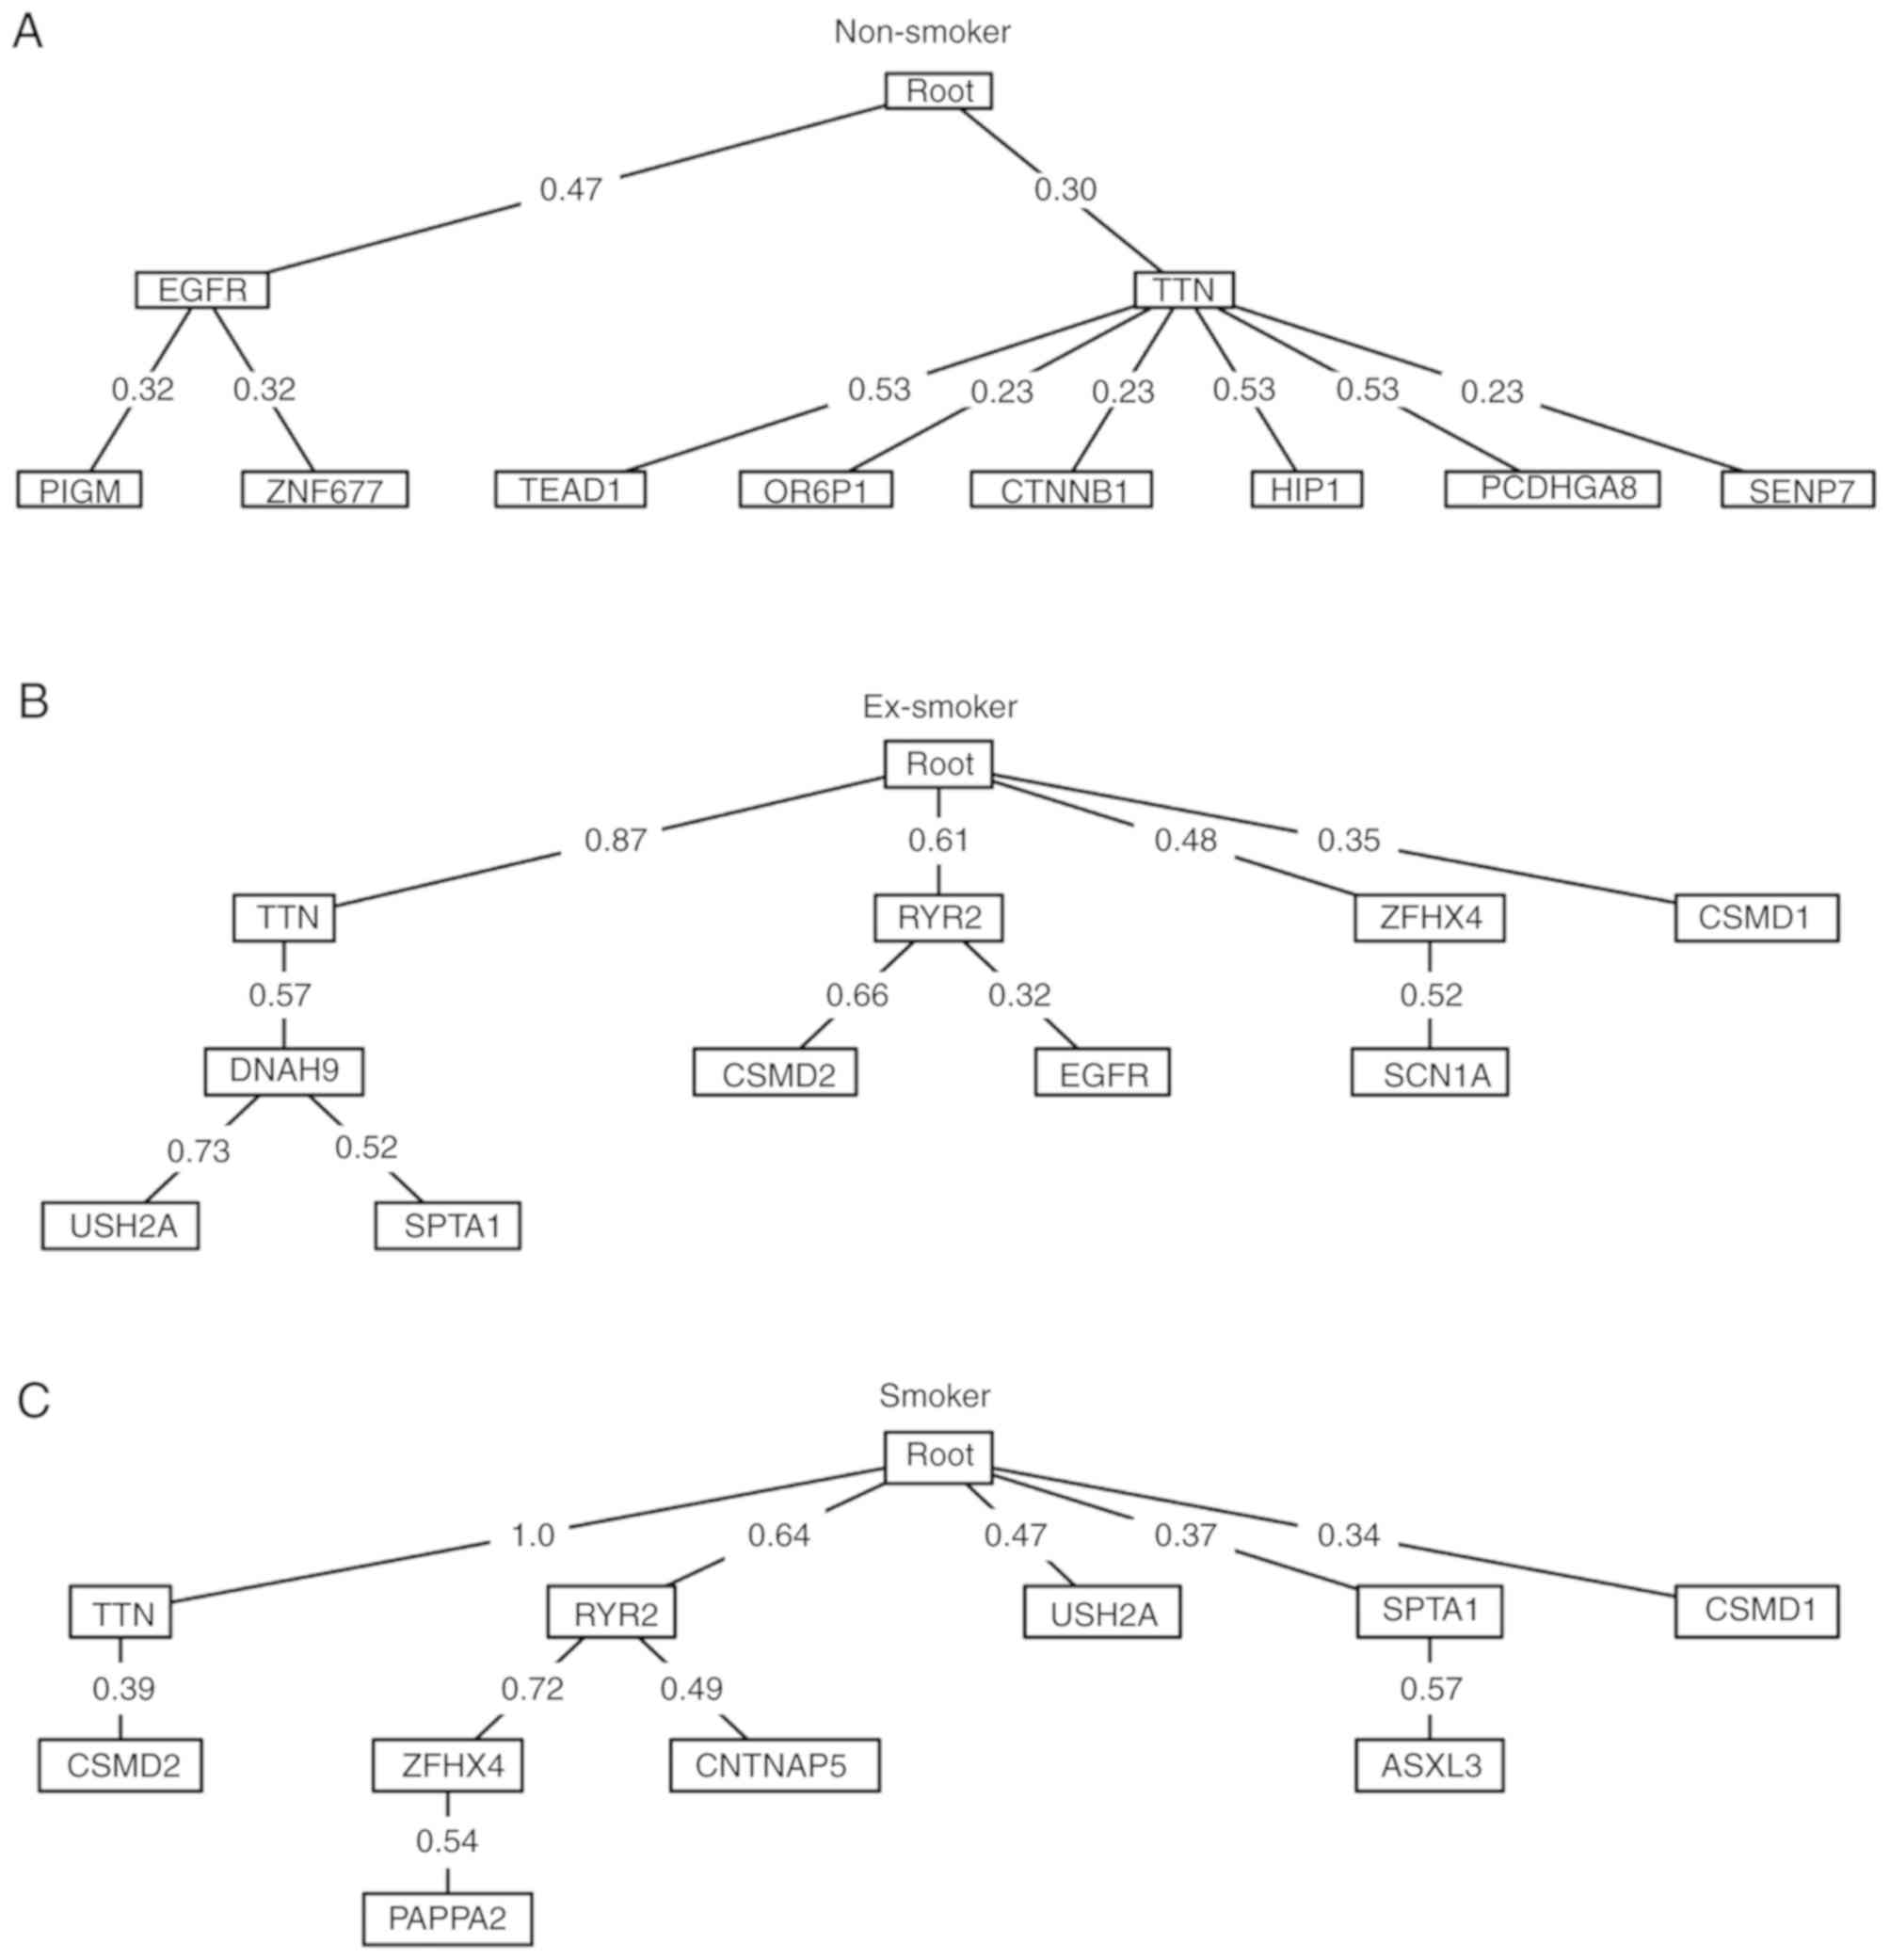
The Oncotree method was used to produce oncogenetic
trees of the top 10 most frequent mutated genes in non-smoker,
ex-smoker and smoker lung cancer patients (Fig. 3). For non-smokers, the early events
were EGFR and titin (TTN) mutation. The late EGFR events were
mutations of PIGM and zinc finger protein 677, while TTN was
followed by mutations of TEAD1, olfactory receptor family 6
subfamily P member 1, catenin β 1, huntingtin interacting protein
1, protocadherin γ subfamily A 8 and SUMO1/sentrin specific
peptidase 7. For ex-smokers, TTN was also an early event but more
early events were detected compared with non-smokers, including
mutations of ryanodine receptor 2, ZFHX4 and CSMD1. For smokers,
the results revealed the highest number of early events, including
mutations of TTN, ryanodine receptor 2, USH2A, SPTA1 and CSMD1.
Results demonstrated that smoking increased spontaneous mutations
and formed more complex oncogenetic trees. For non-smokers, EGFR
was the primary mutation whilst in ex-smokers and smokers, the
importance of TTN was increased. Almost all smokers had the TTN
mutation.
Oncogenetic differences between
non-smoker, ex-smoker and smoker lung cancer patients
Based on the oncogenetic trees of non-smoker,
ex-smoker and smoker lung cancer patients (Fig. 3), the key driver gene of non-smoker
lung cancer patients was EGFR, whilst the key driver gene of smoker
lung cancer patients was TTN.
EGFR is a well-known oncogene that affects the PI3K
and RAS pathway and accelerates cell growth and survival (27). EGFR is widely expressed in >60% of
NSCLC patients and is a clinically relevant target of tyrosine
kinase inhibitors (TKIs). EGFR mutations are more frequent in
Asians, females, non-smokers and lung adenocarcinomas (28,29). The
present findings determined that EGFR was the key driver gene of
non-smoker lung cancer patients which was in agreement with the
literature (28,29).
TTN encodes a protein of striated muscle and is the
key component for striated muscle assembly and function. TTN
mutation is very frequent in the majority of cancer types with the
second highest mutation rate behind TP53 in The Cancer Genome Atlas
dataset (30). In the present study,
65 patients had the TTN mutation and 35 patients did not. For the
65 patients with TTN mutation, there were 2 adenosquamous
carcinoma, 2 carcinosarcoma, 31 invasive adenocarcinoma, 1 large
cell carcinoma and 29 squamous cell carcinoma patients. For the 35
patients without TTN mutations, there were 1 adenosquamous
carcinoma, 30 invasive adenocarcinoma, 1 large cell neuroendocrine
and 3 squamous cell carcinoma patients. Although its mechanisms
remain largely unknown, TTN has great potential for investigation
due to its roles in tumorigenesis and progression (30). The present study determined that TTN
may function through regulating DNAH9, USH2A, SPTA1 or CSMD2 based
on the oncogenetic trees (Fig. 3).
Although the oncogenetic tree only demonstrated the process of
genetic alteration occurrence, it provided hints of functional
regulations; however, this needs to be further confirmed. To
explore the possible regulation mechanisms of TTN, the protein
functional association network STRING (31,32) was
used with medium confidence (>0.4). It was determined that TTN
can interact with SPTA1 through calmodulin 2 (CALM2) and troponin
C1 (TNNC1; Fig. 4). The STRING
confidence scores of each interaction (Table SII) were 0.722 for TTN and CALM2,
0.962 for SPTA1 and CALM2, 0.965 for TTN and TNNC1 and 0.537 for
SPTA1 and TNNC1. These results provided insight into how TTN may
function in lung cancer of smoking patients, or even other types of
cancer.
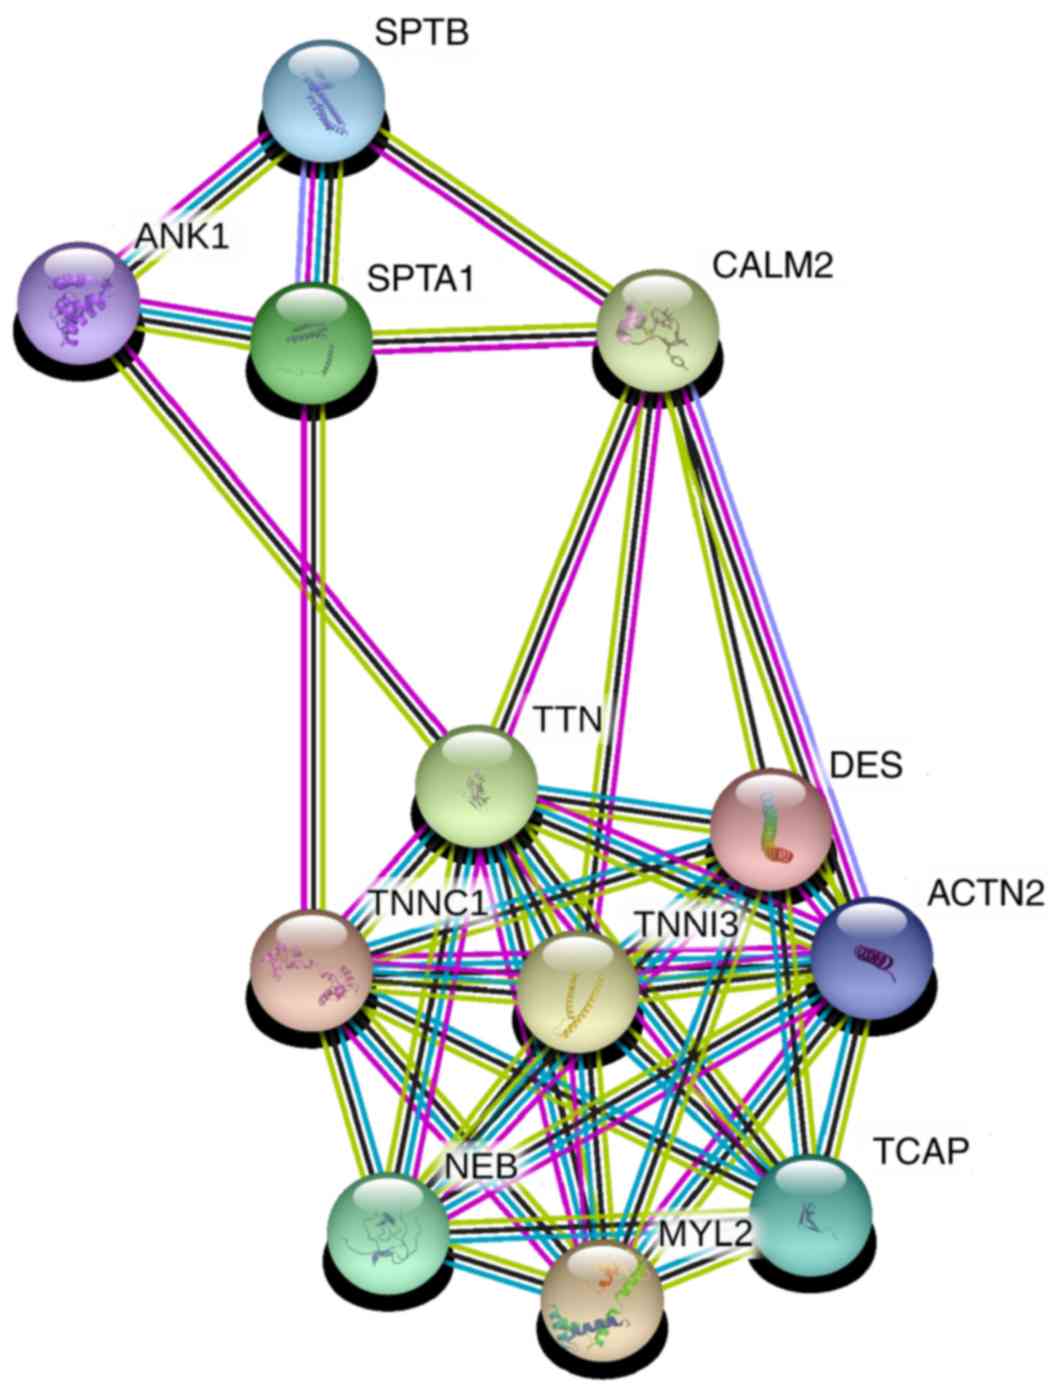 | Figure 4.STRING network of TTN and SPTA1. TTN
can interact with SPTA1 through CALM2 and TNNC1. TTN, titin; SPTA1,
spectrin α erythrocytic 1; CALM2, calmodulin 2; TNNC1, troponin C1;
SPTB, spectrin β erythrocyctic; ANK1, ankyrin 1; DES, desmin;
TNNI3, troponin I3; ACTN2, actinin α 2; NEB, nebulin; MYL2, myosin
light chain 2; TCAP, titin-cap. |
There were limitations to the oncogenetic tree
model. Firstly, the model was based on association rather than
causality and the results could not be treated as actual biological
regulations, therefore these should be further investigated with
experimental methods. Secondly, the oncogenetic tree model cannot
handle a large number of genes. The input genes should be carefully
picked based on mutation frequency or biological literature with
only the highly possible genes analyzed. It is not a general method
that can be applied on a genome wide scale. Finally, the sample
size should be large enough to capture the association so results
generated on small datasets need to be interpreted with
caution.
In conclusion, lung cancer is a complex multigene,
multiprocess disease with complex genetic and environmental risk
factors. Smoking is the biggest risk factor that can alter the
genetics and epigenetics of lung tissue causing cancer. Smokers
have a much greater chance of developing lung cancer. The present
study compared the mutation patterns of non-smoker, ex-smoker and
smoker lung cancer patients and identified 68 genes that were
significantly differentially mutated amongst smoking status groups.
Furthermore, oncogenetic trees were constructed of the top 10 most
frequently mutated genes in each group and analyzed. It was
identified that in non-smoker lung cancer patients, the key driver
gene was EGFR, whilst in smoker lung cancer patients the key driver
gene was TTN. The EGFR mutation finding in non-smokers is in line
with previous literature. A potential mechanism for the high
frequency mutated gene TTN in tumorigenesis was suggested. The
present study provided novel insights into the effect of smoking on
altering the evolutionary trajectory of lung cancer and its
progression.
Supplementary Material
Supporting Data
Supporting Data
Acknowledgements
Not applicable.
Funding
No funding was received.
Availability of data and materials
The datasets generated and/or analyzed during the
present study are available from the corresponding author on
reasonable request.
Authors' contributions
FMZ designed the experiment and XJY performed the
experiment. GC, JY, GCY and PFZ analyzed the data and performed
data analysis. ZKJ, KF, YL and BB contributed to the study design.
KF and YL wrote the article. ZKJ and BB revised the article. All
authors read and approved the final manuscript.
Ethics approval and consent to
participate
Not applicable.
Patient consent for publication
Not applicable.
Competing interests
The authors declare that they have no competing
interests.
References
|
1
|
Siegel R, Naishadham D and Jemal A: Cancer
statistics, 2012. CA Cancer J Clin. 62:10–29. 2012. View Article : Google Scholar : PubMed/NCBI
|
|
2
|
Huang T, Jiang M, Kong X and Cai YD:
Dysfunctions associated with methylation, microRNA expression and
gene expression in lung cancer. PLoS One. 7:e434412012. View Article : Google Scholar : PubMed/NCBI
|
|
3
|
Bossé Y and Amos CI: A decade of GWAS
results in lung cancer. Cancer Epidemiol Biomarkers Prev.
27:363–379. 2018. View Article : Google Scholar : PubMed/NCBI
|
|
4
|
Jiang CL, He SW, Zhang YD, Duan HX, Huang
T, Huang YC, Li GF, Wang P, Ma LJ, Zhou GB and Cao Y: Air pollution
and DNA methylation alterations in lung cancer: A systematic and
comparative study. Oncotarget. 8:1369–1391. 2017.PubMed/NCBI
|
|
5
|
Shu Y, Zhu L, Yuan F, Kong X, Huang T and
Cai YD: Analysis of the relationship between PM2.5 and lung cancer
based on protein-protein interactions. Comb Chem High Throughput
Screen. 19:100–108. 2016. View Article : Google Scholar : PubMed/NCBI
|
|
6
|
Liu C, Zhang YH, Huang T and Cai Y:
Identification of transcription factors that may reprogram lung
adenocarcinoma. Artif Intell Med. 83:52–57. 2017. View Article : Google Scholar : PubMed/NCBI
|
|
7
|
Li BQ, You J, Chen L, Zhang J, Zhang N, Li
HP, Huang T, Kong XY and Cai YD: Identification of
lung-cancer-related genes with the shortest path approach in a
protein-protein interaction network. Biomed Res Int.
2013:2673752013.PubMed/NCBI
|
|
8
|
Li BQ, You J, Huang T and Cai YD:
Classification of non-small cell lung cancer based on copy number
alterations. PLoS One. 9:e883002014. View Article : Google Scholar : PubMed/NCBI
|
|
9
|
Huang T, Yang J and Cai YD: Novel
candidate key drivers in the integrative network of genes,
microRNAs, methylations and copy number variations in squamous cell
lung carcinoma. Biomed Res Int. 2015:3581252015.PubMed/NCBI
|
|
10
|
Tonini G, D'Onofrio L, Dell'Aquila E and
Pezzuto A: New molecular insights in tobacco-induced lung cancer.
Future Oncol. 9:649–655. 2013. View Article : Google Scholar : PubMed/NCBI
|
|
11
|
Hecht SS: More than 500 trillion molecules
of strong carcinogens per cigarette: Use in product labelling? Tob
Control. 20:3872011. View Article : Google Scholar : PubMed/NCBI
|
|
12
|
Chen L, Chu C, Lu J, Kong X, Huang T and
Cai YD: A computational method for the identification of new
candidate carcinogenic and non-carcinogenic chemicals. Mol Biosyst.
11:2541–2550. 2015. View Article : Google Scholar : PubMed/NCBI
|
|
13
|
Zon RT, Goss E, Vogel VG, Chlebowski RT,
Jatoi I, Robson ME, Wollins DS, Garber JE, Brown P and Kramer BS;
American Society of Clinical Oncology, : American society of
clinical oncology policy statement: The role of the oncologist in
cancer prevention and risk assessment. J Clin Oncol. 27:986–993.
2009. View Article : Google Scholar : PubMed/NCBI
|
|
14
|
Nesnow S, Ross JA, Stoner GD and Mass MJ:
Mechanistic linkage between DNA adducts, mutations in oncogenes and
tumorigenesis of carcinogenic environmental polycyclic aromatic
hydrocarbons in strain A/J mice. Toxicology. 105:403–413. 1995.
View Article : Google Scholar : PubMed/NCBI
|
|
15
|
Caravagna G, Graudenzi A, Ramazzotti D,
Sanz-Pamplona R, De Sano L, Mauri G, Moreno V, Antoniotti M and
Mishra B: Algorithmic methods to infer the evolutionary
trajectories in cancer progression. Proc Natl Acad Sci USA.
113:E4025–E4034. 2016. View Article : Google Scholar : PubMed/NCBI
|
|
16
|
Suppes P: A probabilistic theory of
causalityNorth-Holland Pub. Co.; Amsterdam: 1970, PubMed/NCBI
|
|
17
|
Brown D, Smeets D, Székely B, Larsimont D,
Szász AM, Adnet PY, Rothé F, Rouas G, Nagy ZI, Faragó Z, et al:
Phylogenetic analysis of metastatic progression in breast cancer
using somatic mutations and copy number aberrations. Nat Commun.
8:149442017. View Article : Google Scholar : PubMed/NCBI
|
|
18
|
Rohlf FJ: J. Felsenstein J, Inferring
PhylogeniesSinauer Associates Inc.; Sunderland, MA: 2004
|
|
19
|
Jamal-Hanjani M, Wilson GA, McGranahan N,
Birkbak NJ, Watkins TBK, Veeriah S, Shafi S, Johnson DH, Mitter R,
Rosenthal R, et al: Tracking the evolution of non-small-cell lung
cancer. N Engl J Med. 376:2109–2121. 2017. View Article : Google Scholar : PubMed/NCBI
|
|
20
|
Fisher RA: The logic of inductive
inference. J Royal Stat Soc. 98:39–82. 1935. View Article : Google Scholar
|
|
21
|
Szabo A and Boucher K: Estimating an
oncogenetic tree when false negatives and positives are present.
Math Biosci. 176:219–236. 2002. View Article : Google Scholar : PubMed/NCBI
|
|
22
|
Desper R, Jiang F, Kallioniemi OP, Moch H,
Papadimitriou CH and Schäffer AA: Inferring tree models for
oncogenesis from comparative genome hybridization data. J Comput
Biol. 6:37–51. 1999. View Article : Google Scholar : PubMed/NCBI
|
|
23
|
Li XC, Liu C, Huang T and Zhong Y: The
occurrence of genetic alterations during the progression of breast
carcinoma. Biomed Res Int. 2016:52378272016.PubMed/NCBI
|
|
24
|
Zhang B, Kirov S and Snoddy J: WebGestalt:
An integrated system for exploring gene sets in various biological
contexts. Nucleic Acids Res. 33((Web Server Issue)): W741–W748.
2005. View Article : Google Scholar : PubMed/NCBI
|
|
25
|
Markowitz SD and Bertagnolli MM: Molecular
origins of cancer: Molecular basis of colorectal cancer. N Engl J
Med. 361:2449–2460. 2009. View Article : Google Scholar : PubMed/NCBI
|
|
26
|
Calvert PM and Frucht H: The genetics of
colorectal cancer. Ann Intern Med. 137:603–612. 2002. View Article : Google Scholar : PubMed/NCBI
|
|
27
|
Vogelstein B, Papadopoulos N, Velculescu
VE, Zhou S, Diaz LA Jr and Kinzler KW: Cancer genome landscapes.
Science. 339:1546–1558. 2013. View Article : Google Scholar : PubMed/NCBI
|
|
28
|
Proceedings from the 10th annual meeting
of molecularly targeted therapy in non-small cell lung cancer. J
Thorac Oncol. 5 (12 Suppl 6):S433–S496. 2010. View Article : Google Scholar
|
|
29
|
Tokumo M, Toyooka S, Kiura K, Shigematsu
H, Tomii K, Aoe M, Ichimura K, Tsuda T, Yano M, Tsukuda K, et al:
The relationship between epidermal growth factor receptor mutations
and clinicopathologic features in non-small cell lung cancers. Clin
Cancer Res. 11:1167–1173. 2005.PubMed/NCBI
|
|
30
|
Kim N, Hong Y, Kwon D and Yoon S: Somatic
mutaome profile in human cancer tissues. Genomics Inform.
11:239–244. 2013. View Article : Google Scholar : PubMed/NCBI
|
|
31
|
Szklarczyk D, Franceschini A, Wyder S,
Forslund K, Heller D, Huerta-Cepas J, Simonovic M, Roth A, Santos
A, Tsafou KP, et al: STRING v10: Protein-protein interaction
networks, integrated over the tree of life. Nucleic Acids Res.
43((Database Issue)): D447–D452. 2015. View Article : Google Scholar : PubMed/NCBI
|
|
32
|
Szklarczyk D, Gable AL, Lyon D, Junge A,
Wyder S, Huerta-Cepas J, Simonovic M, Doncheva NT, Morris JH, Bork
P, et al: STRING v11: Protein-protein association networks with
increased coverage, supporting functional discovery in genome-wide
experimental datasets. Nucleic Acids Res. 47:D607–D613. 2019.
View Article : Google Scholar : PubMed/NCBI
|