Introduction
Esophageal cancer is one of the most common types of
malignant tumor encountered in the clinic and is the 6th most
frequent cause of cancer-associated mortality. Esophageal
adenocarcinoma (EAC) is the predominant pathological subtype of
esophageal cancer in Europe and the USA (1). Due to a lack of reliable early
diagnostic methods and efficient intervention approaches, EAC has
had a poor five-year survival rate of <20% (2). Although significant progress has been
made in the medical field over the past few years, the median
survival time of EAC has only slightly increased (3). Therefore, more research effort is
required to explore potential prognostic markers and therapeutic
strategies for EAC.
In recent years, molecular biomarkers with an early
diagnostic and prognostic value for EC have been investigated. Chen
et al (4) performed a
systematic review of the literature and summarized that
cyclooxygenase-2 and HER-2 are valuable prognostic markers for EAC.
A study by Darlavoix et al (5) on EAC reported that the decrease in
E-cadherin expression and the altered expression of CD44 and
dickkopf WNT signaling pathway inhibitor 1 may indicate an
increased risk of EAC progression. A large number of microRNA (miR)
biomarkers have been identified; for instance, the loss of miR-31
is considered as an early molecular marker for the
metaplasia-to-dysplasia transition of EAC, while miR-194, miR-196a
and miR-375 are considered as oncogenic factors (6,7). In
spite of the large number of miR biomarkers identified, only few of
them are suitable for clinical use due to a lack of sensitivity and
specificity. An increased knowledge of EAC-associated biomarkers
may provide further mechanistic insight and lay a foundation for
novel approaches to prevent, diagnose and treat EAC.
High-throughput sequencing technology is a widely
used tool to explore genetic alterations during tumorigenesis. In
the present study, a high-throughput sequencing dataset was
analysed using bioinformatics tools to identify differentially
expressed genes (DEGs). The DEGs were subjected to functional
enrichment, co-expression network analysis and survival analysis to
identify key genes in EAC, while the validation of key gene
expression levels in EAC and normal epithelial tissues was
performed using data from The Cancer Genome Atlas (TCGA) database
and another microarray dataset.
Materials and methods
High-throughput sequencing data
The GSE94869 gene expression profile obtained
through high-throughput sequencing was downloaded from the Gene
Expression Omnibus database (https://www.ncbi.nlm.nih.gov/geo/) (8,9). The
data]]set was based on the Illumina MiSeq [Homo sapiens
(hsa)] platform (Illumina, Inc., San Diego, CA, USA). The GSE94869
dataset included 40 pairs of EAC and matched normal esophageal
squamous epithelium tissues.
DEG analysis
The DEGs in EAC tissues compared with normal tissues
were identified using the Linear Models for Microarray Analysis
(Limma) package in R software (10).
The Benjamini-Hochberg false discovery rate (FDR) was used to
correct the P-values. An adjusted P-value of <0.05 and a fold
change of ≥2 were used as the cut-off criteria for the DEG
analysis.
Functional enrichment analysis of
DEGs
Gene Ontology (GO) (11) and the Kyoto Encyclopedia of Genes and
Genomes (KEGG) (12) analyses are
widely used to identify the most correlative GO terms in the
category biological process (BP) and relevant pathway information,
and were performed through the online tool Database for Annotation
Visualization and Integrated Discovery (13). A corrected P-value (P-value adjusted
using Benjamini-Hochberg) of <0.05 was used as the cut-off
criterion.
Co-expression module detection and
functional enrichment analysis for each module
The weighted gene co-expression network analysis
(WGCNA) (14) was restricted to the
DEGs by using the WGCNA package in R software. An unsupervised
co-expression association was constructed on the basis of the
adjacency matrix of connection strengths using Pearson's
correlation coefficients. Gene modules that had a high topologic
overlap were identified as gene sets and a minimum gene module size
of 30 was used to cut branches. The top 10 genes with the highest
network connectivity in each module were identified as hub genes.
Subsequently, the co-expression network of each module was
presented using Cytoscape 3.4.0 (15). GO and KEGG analyses for each module
were then performed as specified above. A corrected P-value
(P-value adjusted using Benjamini-Hochberg) of <0.05 was used as
the cut-off criterion.
Survival analysis depending on hub
genes
The mRNA transcript per million of 104 EAC tissue
samples and corresponding follow-up information for these patients
were downloaded from the Xena browser from the University of
California Santa Cruz (https://xenabrowser.net/datapages/?host=https://tcga.xenahubs.net).
The survival R package (https://CRAN.R-project.org/package=survival) (16) was used to explore the prognostic
value of hub genes. Kaplan-Meier survival curves were plotted.
Relapse-free survival (RFS) was used as the survival endpoint and
only the 62 patients with RFS data were included. Patients with EAC
were divided into low and high expression groups according to the
median expression value of each hub gene. A Log-rank P-value of
<0.05 was considered to indicate statistical significance.
Cox proportional hazards (CPH)
analysis
The association of clinical parameters, including
age at diagnosis, history of alcohol use or Barrett's esophagus,
pathologic tumor-nodes-metastasis stage with survival was assessed
using the univariate CPH model. The results of the CPH analysis
were presented as hazard ratios, along with parameters of
significance and 95% confidence intervals. All prognosis-associated
genes identified by the Kaplan-Meier analysis were converted into
ordinal or unordered categorical variables based on quartiles (Q)
in order to determine the risk of recurrence of EAC for each
quartile expression level of the prognosis-associated genes. A
P-value for the trend referred to different quartiles was obtained
from the CPH model when the expression of prognosis-associated
genes was categorized into ordinal categorical variables. As for
unordered categorical variables, the CPH analysis was applied with
the lowest quartiles as a reference. Model 1 remained unadjusted
and Model 2 was adjusted for risk factors that were indicated to
have an effect (P<0.2) on survival in the univariate analysis.
P<0.05 was considered to indicate statistical significance.
Validation of differential expression
of prognosis-associated genes
Validation of the expression levels of all
prognosis-associated genes identified through Kaplan-Meier analysis
was performed using a box plot to visualize the difference in
expression between EAC and normal tissues based on data from TCGA
and the dataset GSE26886 (17). The
data of 8 EAC tissues and paired paracancerous lesions were
obtained from the TCGA database. The GSE26886 dataset was based on
the Affymetrix Human Genome U133 Plus 2.0 Array platform (Thermo
Fisher Scientific, Inc., Waltham, MA, USA) and included the data of
21 EAC tissues and 19 normal esophageal squamous epithelial
tissues. The expression levels were presented as the mean ±
standard deviation. A P-value of <0.05 was considered to
indicate a statistically significant difference.
Results
DEG and functional enrichment
analysis
In total, 130 DEGs, including 82 upregulated and 48
downregulated genes, were identified using the Limma package. The
GO BP analysis demonstrates that the upregulated DEGs were
significantly associated with extracellular matrix organization,
endodermal cell differentiation and extracellular matrix
disassembly, while the downregulated DEGs were significantly
associated with cell fate commitment, neuron differentiation and
the canonical Wnt signaling pathway. The KEGG pathway analysis
demonstrated that the upregulated genes were significantly enriched
in focal adhesion, the phosphoinositide-3 kinase (PI3K)-Akt
signaling pathway and the Rap1 and Ras signaling pathways, while
the downregulated genes were significantly associated with
signaling pathways regulating pluripotency of stem cells and the
Wnt signaling pathway. These results are presented in Table I.
 | Table I.GO terms in the category biological
process and Kyoto Encyclopedia of Genes and Genomes pathways
significantly enriched by the differentially expressed genes in
esophageal adenocarcinoma. |
Table I.
GO terms in the category biological
process and Kyoto Encyclopedia of Genes and Genomes pathways
significantly enriched by the differentially expressed genes in
esophageal adenocarcinoma.
| Term/pathway | Description | Enriched genes
(n) | Adjusted P-value |
|---|
| Upregulated |
|
GO:0030198 | Extracellular matrix
organization | 12 |
9.43×10⁻⁷ |
|
GO:0035987 | Endodermal cell
differentiation | 5 |
2.92×10⁻³ |
|
GO:0030168 | Platelet
activation | 7 |
3.95×10⁻³ |
|
GO:0007596 | Blood
coagulation | 8 |
4.23×10⁻³ |
|
GO:0022617 | Extracellular matrix
disassembly | 6 |
4.33×10⁻³ |
|
GO:0048013 | Ephrin receptor
signaling pathway | 6 |
6.57×10⁻³ |
|
hsa04510 | Focal adhesion | 13 |
7.58×10⁻⁶ |
|
hsa04151 | PI3K-Akt signaling
pathway | 14 |
1.53×10⁻⁴ |
|
hsa04611 | Platelet
activation | 8 |
1.69×10⁻³ |
|
hsa05200 | Pathways in
cancer | 13 |
1.70×10⁻³ |
|
hsa04015 | Rap1 signaling
pathway | 10 |
1.74×10⁻³ |
|
hsa04014 | Ras signaling
pathway | 10 |
1.86×10⁻³ |
|
hsa05146 | Amoebiasis | 7 |
3.78×10⁻³ |
|
hsa04071 | Sphingolipid
signaling pathway | 7 |
6.50×10⁻³ |
|
hsa04512 | ECM-receptor
interaction | 6 |
9.85×10⁻³ |
| Downregulated |
|
GO:0045165 | Cell fate
commitment | 5 |
1.69×10⁻³ |
|
GO:0030182 | Neuron
differentiation | 6 |
2.03×10⁻³ |
|
GO:0060070 | Canonical Wnt
signaling pathway | 6 |
2.09×10⁻³ |
|
GO:0000122 | Negative regulation
of transcription from RNA polymerase II promoter | 11 |
3.38×10⁻³ |
|
hsa04550 | Signaling pathways
regulating pluripotency of stem cells | 9 |
1.39×10⁻⁵ |
|
hsa04310 | Wnt signaling
pathway | 6 |
9.79×10⁻³ |
Co-expression module detection and
functional enrichment analysis
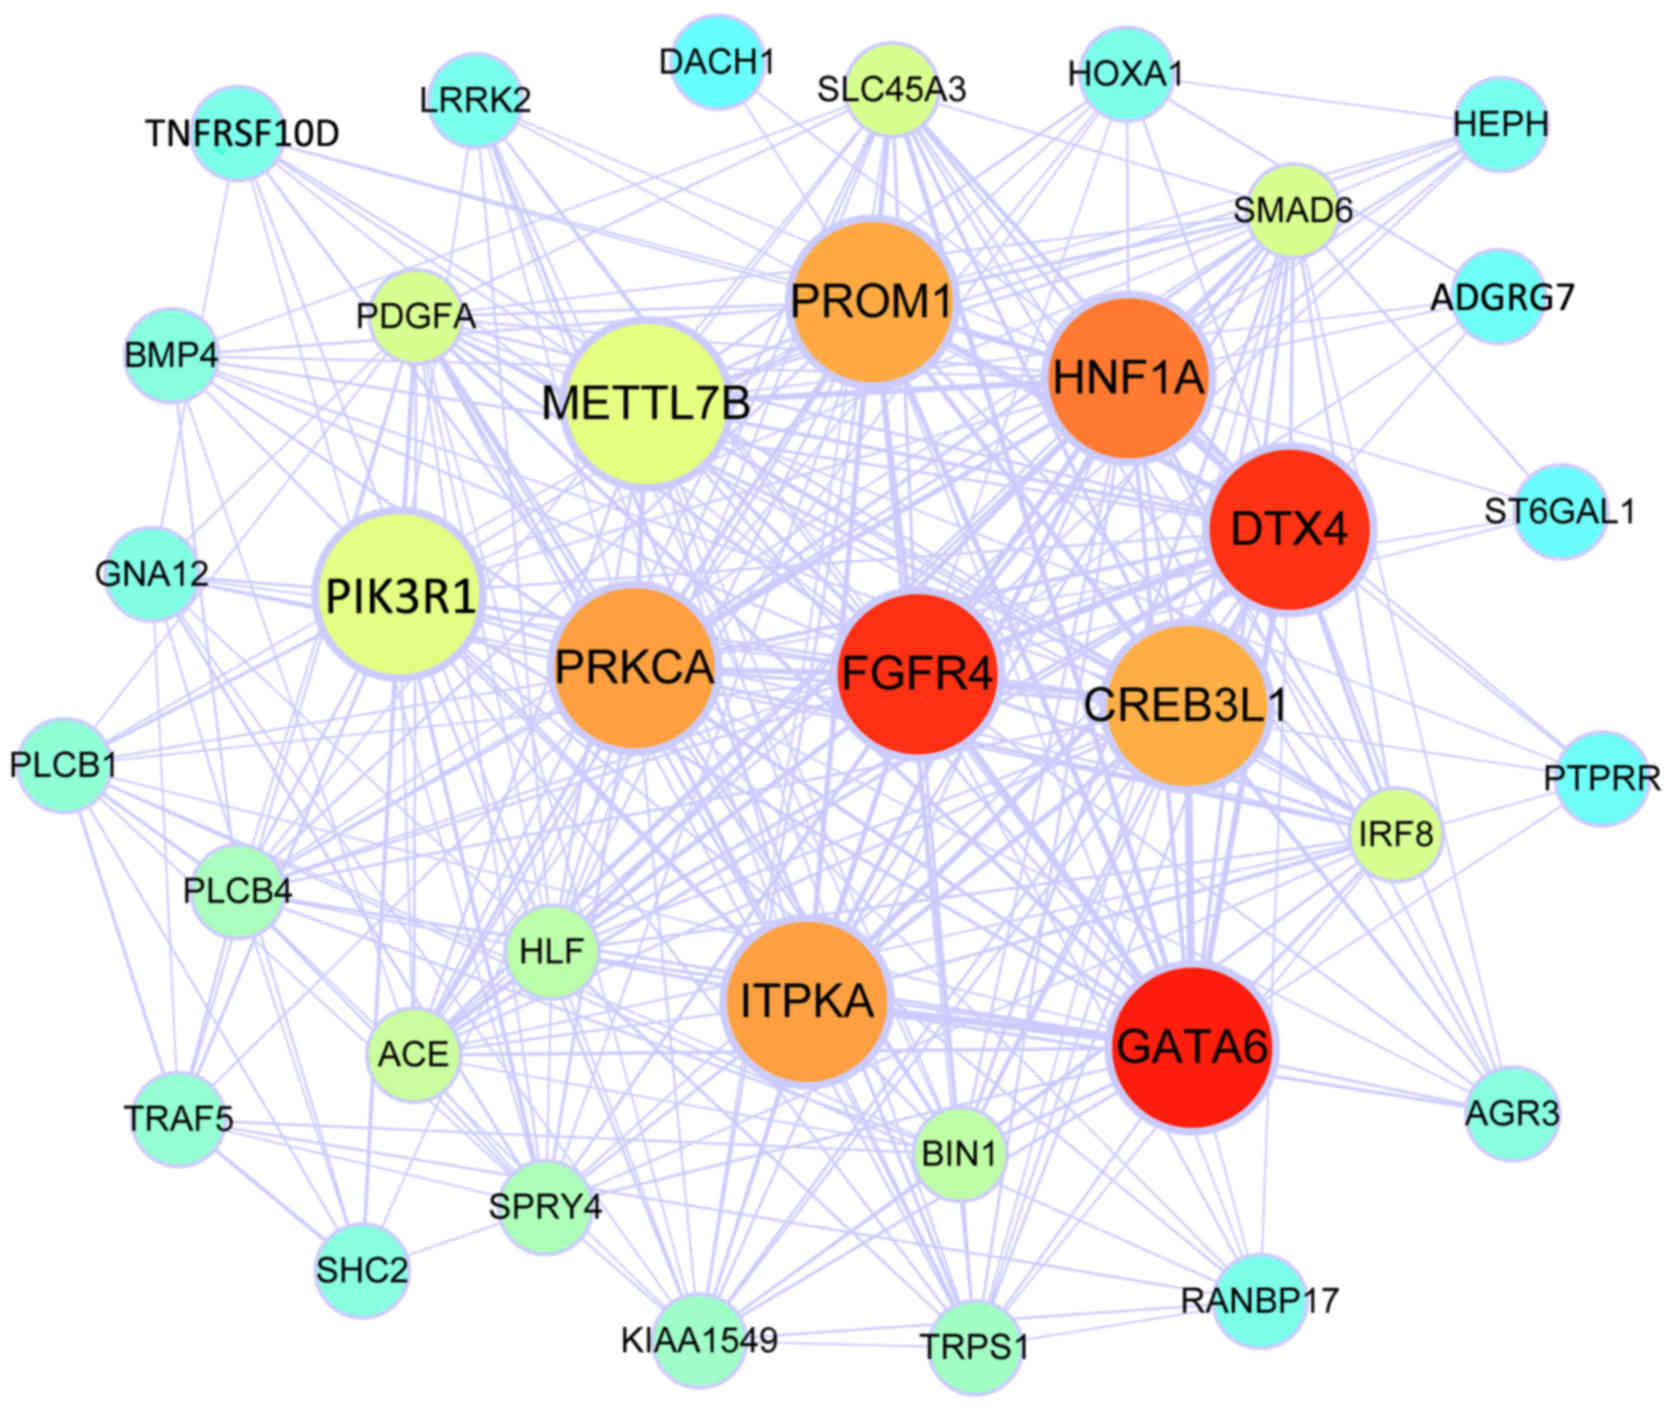
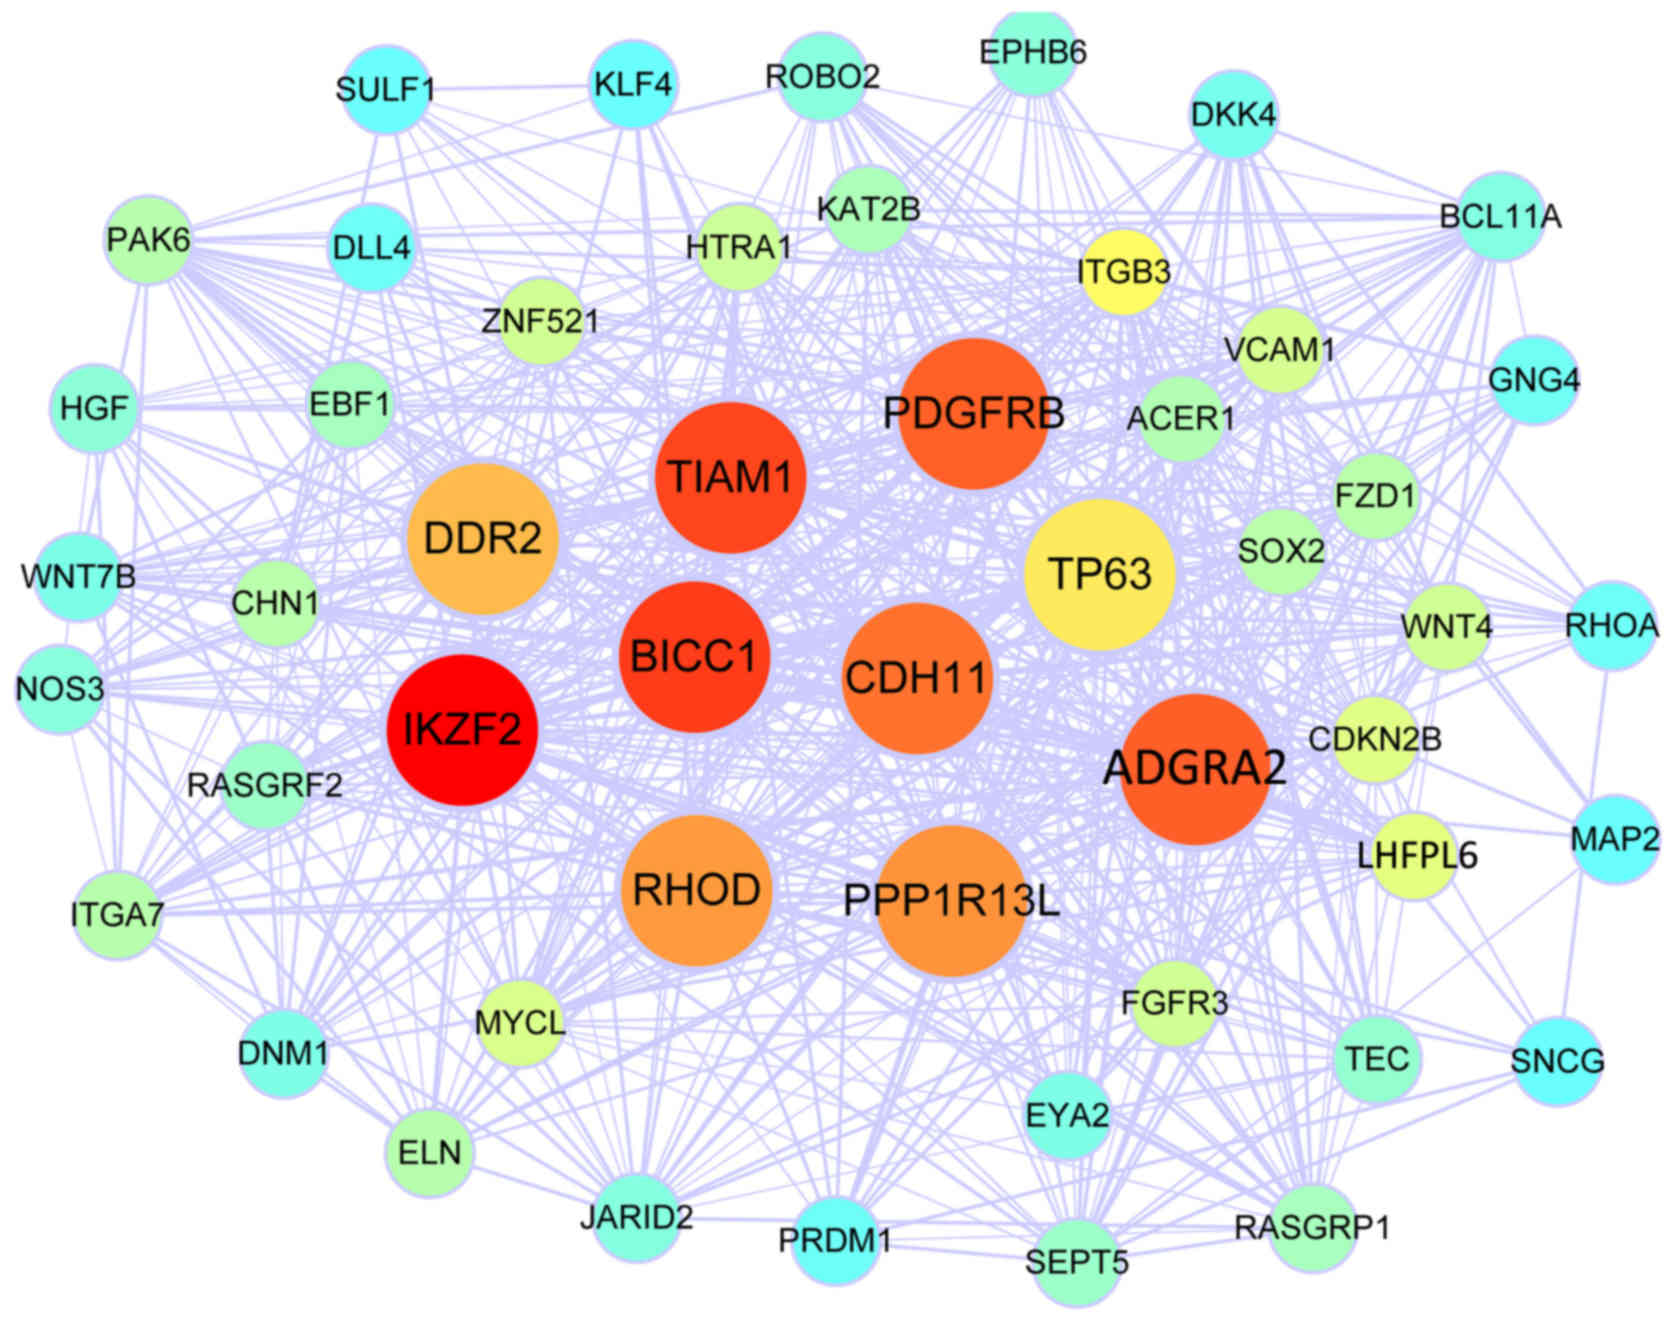
WGCNA was performed to construct gene co-expression
modules from the expression profiles of the 130 DEG. A total of 2
modules comprising of 36 and 50 genes each were identified. The
co-expression networks of the 2 modules including their hub genes
are visualized in Figs. 1 and
2. The genes involved in the blue
module were associated with the Rap1 signalling pathway,
melanogenesis and holinergic synapses according to KEGG analysis,
while the genes in of the turquoise module were associated with
positive regulation of osteoblast differentiation and the ephrin
receptor signaling pathway according to GO BP analysis, and the Ras
signaling pathway, pathways in cancer and signaling pathways
regulating the pluripotency of stem cells according to KEGG
analysis. Theseresults are presented in Table II.
| Table II.Significantly enriched GO terms in
the category biological process and Kyoto Encyclopedia of Genes and
Genomes pathways in the different co-expression modules. |
Table II.
Significantly enriched GO terms in
the category biological process and Kyoto Encyclopedia of Genes and
Genomes pathways in the different co-expression modules.
| Term or
pathway | Description | Enriched genes
(n) | Adjusted
P-value |
|---|
| Module blue |
|
hsa04015 | Rap1 signaling
pathway | 5 |
4.10×10⁻² |
|
hsa04916 | Melanogenesis | 4 |
4.28×10⁻² |
|
hsa04725 | Cholinergic
synapse | 4 |
4.31×10⁻² |
|
hsa04540 | Gap junction | 4 |
4.46×10⁻² |
|
hsa05143 | African
trypanosomiasis | 3 |
4.54×10⁻² |
|
hsa04071 | Sphingolipid
signaling pathway | 4 |
4.59×10⁻² |
|
hsa04918 | Thyroid hormone
synthesis | 4 |
4.61×10⁻² |
|
hsa04915 | Estrogen signaling
pathway | 4 |
4.67×10⁻² |
|
hsa04270 | Vascular smooth
muscle contraction | 4 |
4.82×10⁻² |
|
hsa04911 | Insulin
secretion | 4 |
4.84×10⁻² |
| Module
turquoise |
|
GO:0045669 | Positive regulation
of osteoblast differentiation | 5 |
1.48×10⁻² |
|
GO:0048013 | ephrin receptor
signaling pathway | 5 |
3.04×10⁻² |
|
hsa04014 | Ras signaling
pathway | 9 |
3.09×10⁻⁴ |
|
hsa05200 | Pathways in
cancer | 10 |
7.90×10⁻⁴ |
|
hsa04550 | Signaling pathways
regulating pluripotency of stem cells | 7 |
1.05×10⁻³ |
|
hsa05205 | Proteoglycans in
cancer | 7 |
3.84×10⁻³ |
|
hsa04810 | Regulation of actin
cytoskeleton | 7 |
4.12×10⁻³ |
|
hsa05166 | HTLV–I
infection | 7 |
9.65×10⁻³ |
|
hsa04360 | Axon guidance | 5 |
1.93×10⁻² |
|
hsa04015 | Rap1 signaling
pathway | 6 |
1.99×10⁻² |
|
hsa04510 | Focal adhesion | 6 |
2.09×10⁻² |
|
hsa04310 | Wnt signaling
pathway | 5 |
2.35×10⁻² |
|
hsa04151 | PI3K-Akt signaling
pathway | 7 |
2.43×10⁻² |
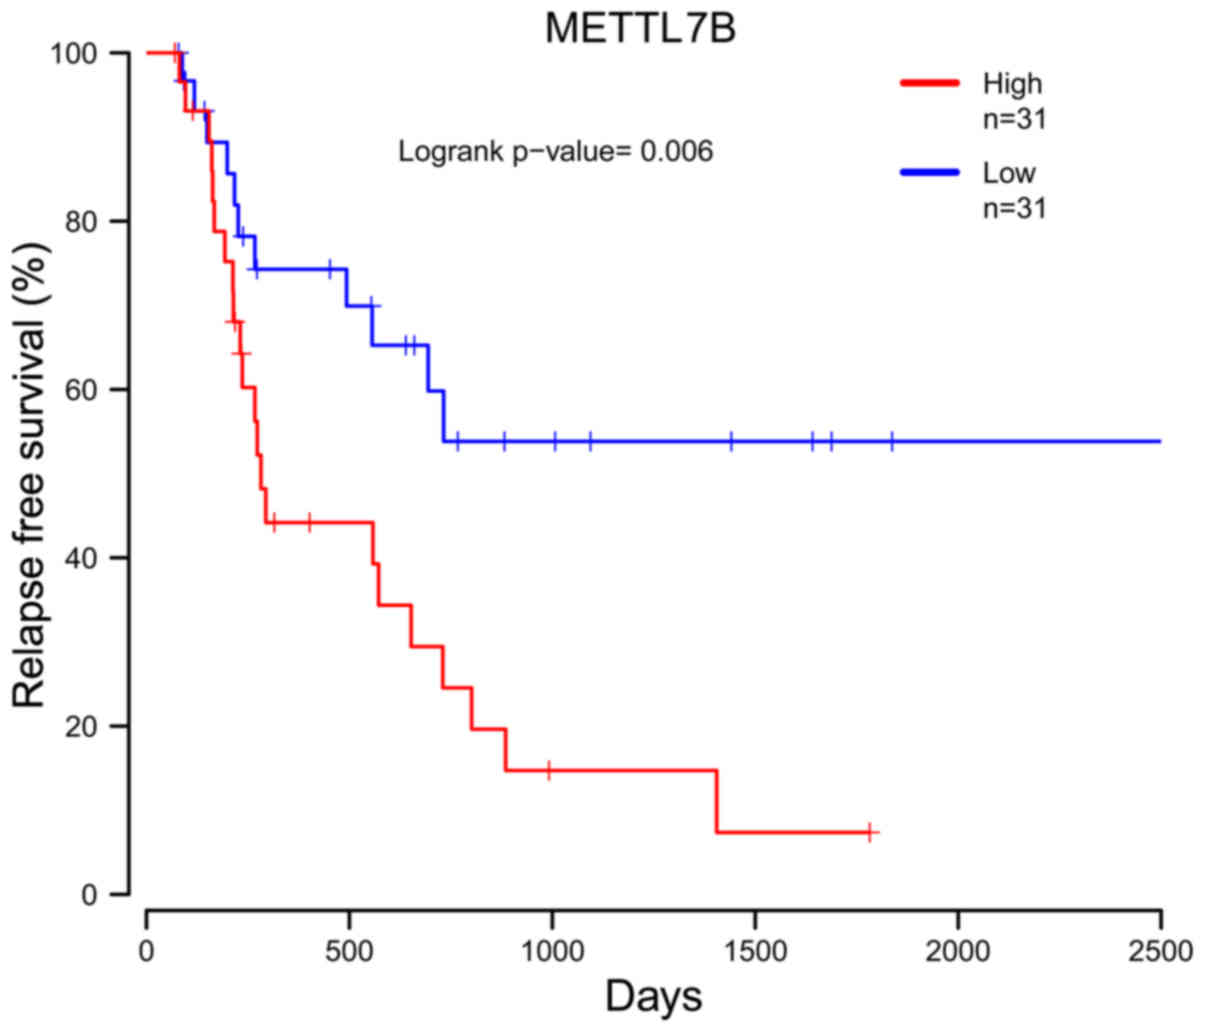
Survival analysis depending on the hub
genes
In the dataset from TCGA database, the follow-up
information for only 62 cases included the RFS. The prognostic
value of 20 hub genes was assessed using the survival package in R
software. Kaplan-Meier analysis indicated that a higher expression
of methyltransferase like 7B (METTL7B) was associated with a poorer
RFS of EAC patients (P=0.006; Fig.
3).
CPH analysis
In the univariate CPH model, only the pathological
TNM stage was marginally significantly associated with a higher
risk of recurrence, while the pathological TNM stage (P=0.056) and
the pathological N stage (P=0.140) were used to adjust the
prognostic gene, METTL7B, in the multivariate CPH model (Table III). As an ordinal categorical
variable, overexpressed METTL7B was significantly associated with a
higher risk of recurrence. However, the pathological TNM stage and
N stage weakened the association between METTL7B expression levels
and RFS (P=0.092). As unordered categorical variables, Q3 and Q4 of
METTL7B were significantly associated with a higher risk of
recurrence in the univariate CPH model, while only Q3 of METTL7B
was significantly associated with a higher risk of recurrence
compared with that of the lowest quartile adjusted by the
pathologic TNM stage and N stage (Table
IV).
| Table III.Univariate Cox proportional hazard
regression analysis of parameters affecting relapse-free
survival. |
Table III.
Univariate Cox proportional hazard
regression analysis of parameters affecting relapse-free
survival.
| Parameter | n | HR (95% CI) | P-value |
|---|
| Age (≤65 vs. >65
years) | 29:32 | 0.93
(0.47–1.83) | 0.825 |
| History of alcohol
use (yes vs. no) | 10:50 | 0.59
(0.25–1.36) | 0.215 |
| History of
Barrett's esophagus (yes vs. no) | 37:17 | 1.03
(0.48–2.22) | 0.936 |
| Location of lesion
(mid vs. distal) |
5:56 | 0.73
(0.21–2.45) | 0.605 |
| Pathologic N-stage
(0/1 vs. 2/3) | 38:9 | 2.07
(0.79–5.43) | 0.140 |
| Pathologic T-stage
(1/2 vs. 3/4) | 26:21 | 1.41
(0.59–3.37) | 0.435 |
| Pathologic TNM
stage (1/2 vs. 3/4) | 26:18 | 2.37
(0.98–5.72) | 0.056 |
| Table IV.Risk of recurrence for each quartile
of methyltransferase like 7B expression levels. |
Table IV.
Risk of recurrence for each quartile
of methyltransferase like 7B expression levels.
| Calculation | Q1 | Q2 | Q3 | Q4 | P-value for
trend |
|---|
| Range | 6.39–8.17 | 8.18–9.01 | 9.04–9.49 | 9.5–10.62 |
|
| Patients, n | 16 | 15 | 14 | 16 |
|
| Model 1, HR (95%
CI) | Ref | 2.78
(0.74–10.53) | 6.46
(1.78–23.38) | 4.16
(1.16–14.96) |
|
| P-value |
| 0.131 | 0.005 | 0.029 | 0.013 |
| (No. of
patients) | (n=13) | (n=11) | (n=7) | (n=12) |
|
| Model 2 (HR (95%
CI)) | Ref | 2.18
(0.52–9.12) | 4.62
(1.08–19.75) | 2.9
(0.76–11.08) |
|
| P-value |
| 0.287 | 0.039 | 0.12 | 0.092 |
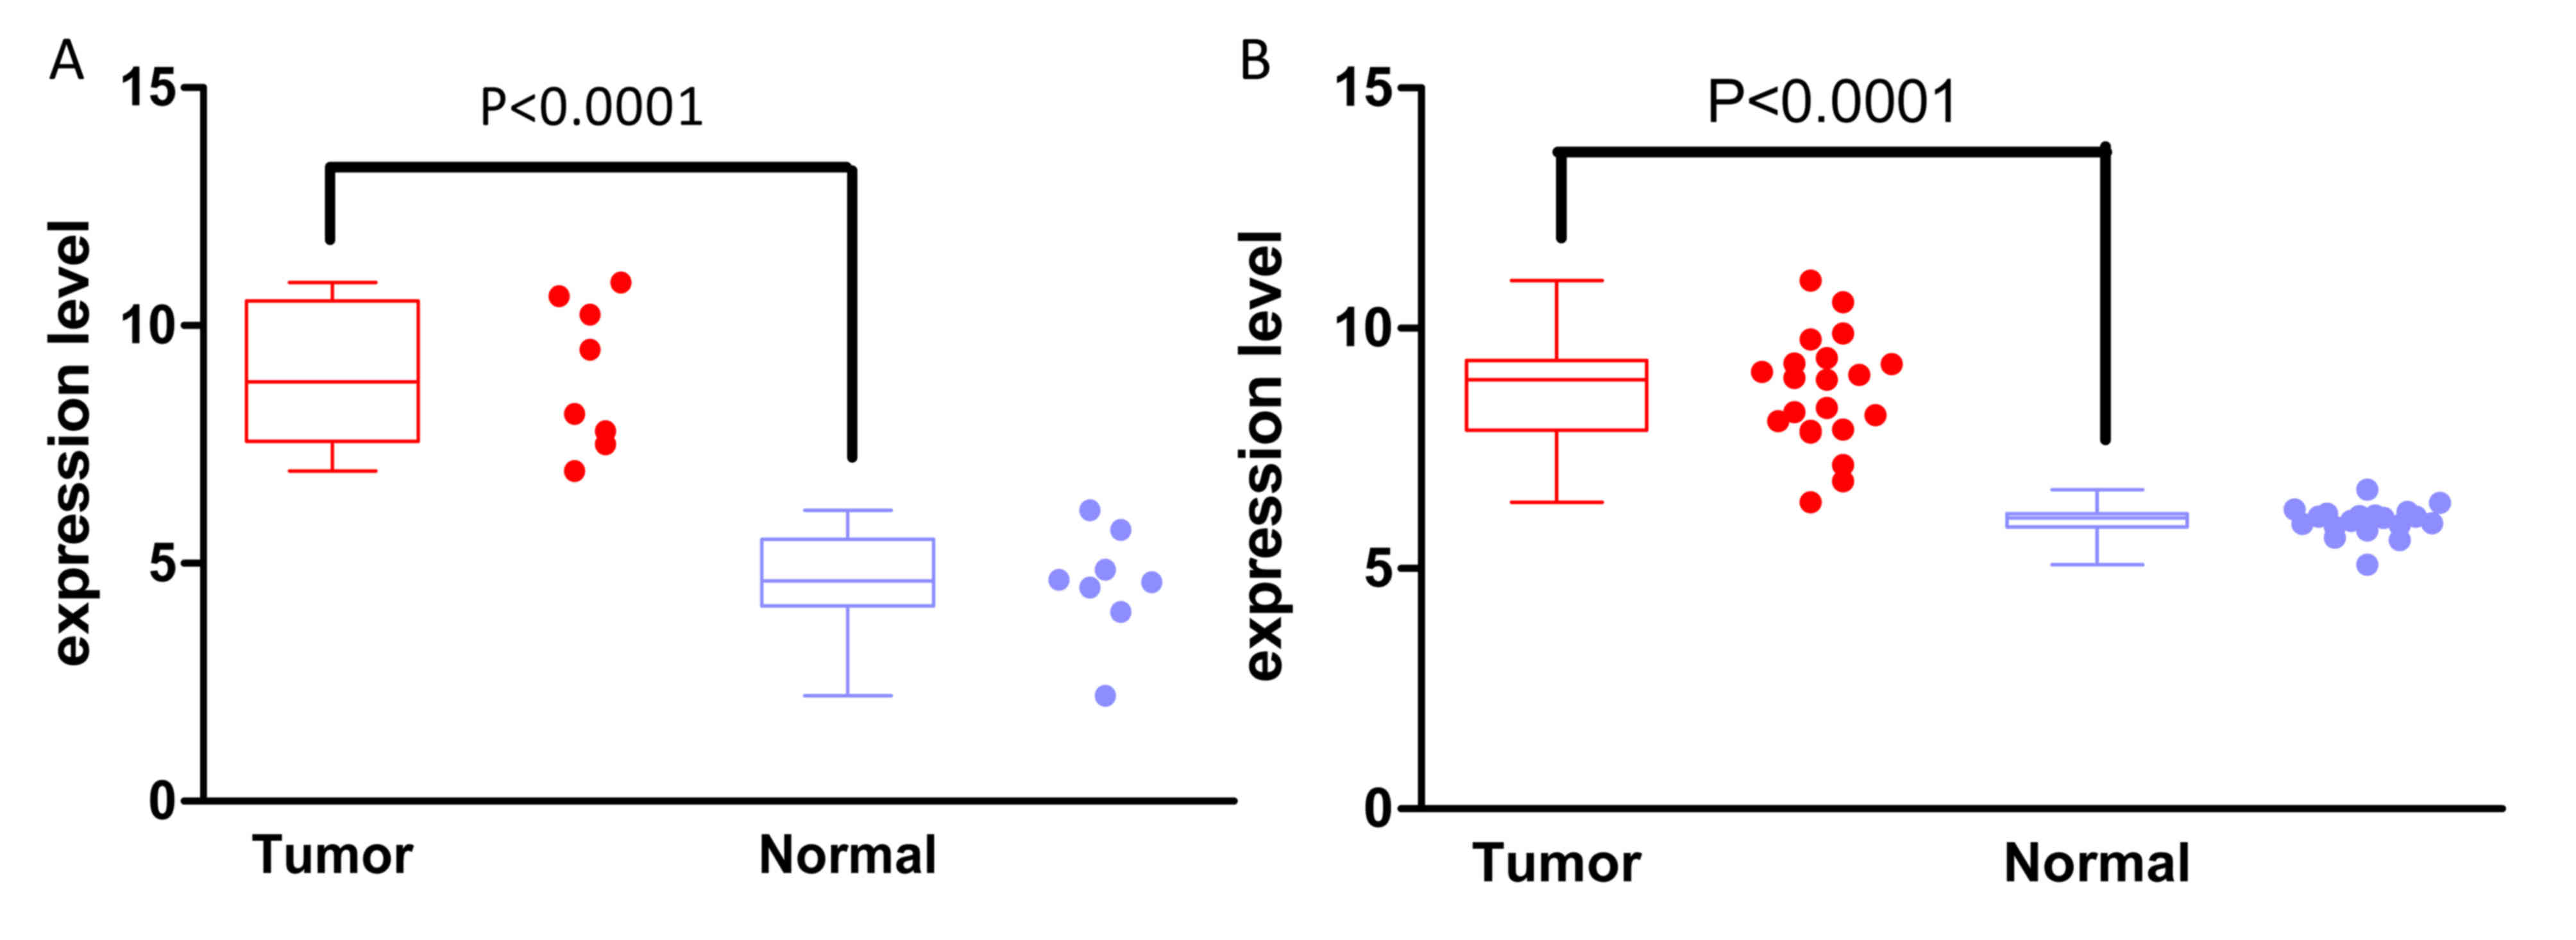
Validation of differential expression
of prognostic genes
As displayed in Fig.
4, the METTL7B expression levels were significantly increased
in EAC tissues compared with those in paracancerous lesions in the
two additional datasets used for validation. The relative METTL7B
expression levels in EAC vs. paired paracancerous lesions were
8.95±0.55 vs. 4.58±0.42 (P<0.0001) based on the data from the
TCGA database and 8.66±0.25 vs. 5.99±0.07 (P<0.0001) based on
data from the GSE26886 dataset.
Discussion
In the present study, a total of 130 DEGs associated
with EAC were identified, including 82 upregulated and 48
downregulated genes. The upregulated genes were associated with
extracellular matrix organization, disassembly, PI3K-Akt, and the
Rap1 and Ras signaling pathways, while the downregulated genes were
associated with the Wnt signaling pathway. Among them, 2
co-expression modules and 20 hub genes were identified. The blue
module was associated with the Rap1 signaling pathway, while the
turquoise module was associated with the Ras and Rap1 signaling
pathways. Subsequently, Kaplan-Meier analysis of hub genes revealed
that higher expression of METTL7B was significantly associated with
poorer RFS. The CPH model also confirmed this result. Finally, the
overexpression of METTL7B in EAC tissues was also validated using
data from TCGA and another microarray dataset, GSE26886. Therefore,
METTL7B may be regarded as a key gene, while the Ras and Rap1
signaling pathways may be crucial mechanisms of genesis of EAC. In
addition, all enriched GO BPs and KEGG pathways may participate in
mechanisms underlying EAC progression and require to be considered
in future studies.
METTL7B is a protein-coding gene located at
chromosome 12q13.2. It was reported to be a major component of
hepatic lipid droplets and a prognostic marker of non-alcoholic
steatohepatitis (18). Although
certain studies have revealed that METTL7B is associated with
common lipid metabolism and functional organelle production, its
precise functions have been rarely reported (19,20). A
recent study focusing on breast cancer cell lines identified that
downregulation of METTL7B, which may be caused by a reduction in
Rho-related BTB domain-containing protein 1, leads to a profound
fragmentation of the Golgi apparatus; this then contributes to a
loss of normal epithelial polarity and finally converts mammary
epithelial cell phenotypes into an invasive one (21). However, to the best of our knowledge,
no previous study has assessed the role of METTL7B in esophageal
neoplasms. Therefore, the potential existence of a mechanism of
this specific gene in EAC analogous to that in breast cancer is
worthy of investigation.
The Ras signaling pathway is one of the most
thoroughly studied pathways in various types of human cancer,
including EAC. The mitogen-activated protein kinase (MAPK)
signaling pathway, a key downstream effector of Ras signaling, is
shared by four distinct cascades named as extracellular
signal-regulated kinase (ERK)1/2, c-Jun N-terminal kinase (JNK),
p38MAPK and ERK5. Upregulation of the Ras signaling pathway
activates the MAPK pathway, and this or other dysregulations in
downstream signaling probably lead to carcinogenesis. The ERK1/2
pathway has a crucial role in regulating cellular growth and
differentiation. Accordingly, Fan et al (22) demonstrated that inhibition of ERK
activation prevented proliferation of human esophageal cancer cells
by inducing cell cycle arrest in G0/G1 phase. The p38MAPK and JNK
pathways are closely linked to stress, including inflammation and
apoptosis. It was observed that Ras-JNK signaling significantly
enhances the invasive behaviour of EAC cell lines (23), while Connor et al (24) indicated that JNK activation leads to
the induction of apoptosis of EAC cells. A similar phenomenon was
reported for Ras-p38MAPK signalling (25,26), and
it may therefore be hypothesized that these two pathways have a
tumor suppressor or oncogenic role depending on certain conditions,
e.g. the stage of EAC. From the above information, it is apparent
that the Ras signaling pathway has a definite role in EAC, and
therefore, the proteins associated with this signal transduction
pathway that were identified in the present bioinformatics analysis
are worthy of further investigation.
The Rap1 pathway is another ‘hot spot’ of cancer
research. Rap1 is a member of the Ras-like small GTPase family with
two subtypes, Rap1a and Rap1b. The Rap1 signaling pathway is known
to be over-activated in various tumor types. Furthermore, it has
been reported to promote tumor cell migration, invasion and
metastasis in the development of cancer, including, prostate cancer
(27), head and neck cancer
(28) and esophageal squamous cell
carcinoma (29). Conversely, active
Rap1 also prevents tumor invasion and metastasis in the bladder,
lung and brain (29). However, to
the best of our knowledge, the role of the Rap1 signaling pathway
in EAC has remained unreported. Further experiments are required to
verify the role of the Rap1 signaling pathway and EAC.
In conclusion, in the present study, a total of 130
DEGs were identified in EAC, from which 2 co-expression modules
were established. The enriched pathways, including the Ras and Rap1
signaling pathways, may be closely linked to EAC progression.
Furthermore, METTL7B may be a key gene associated with the
prognosis of EAC. However, no additional experiments or clinical
research were performed to verify these results. Thus, further
studies are required, which should focus on a more detailed
clinical application of this key gene and associated pathways.
Acknowledgements
Not applicable.
Funding
The present study was supported by National Natural
Science Foundation of China (grant nos. 81570484, 81600424 and
81502041).
Availability of data and materials
Not applicable.
Authors' contributions
ZD conducted the research, analysed the data and
wrote this manuscript. SX designed the study, performed the
research and revised the paper. JW performed the research and wrote
this manuscript. HZ, TZ and YC performed the research and acquired
the data.
Ethical approval and consent to
participate
Not applicable.
Patient consent for publication
Not applicable.
Competing interests
The authors declare that they have no competing
interests.
Glossary
Abbreviations
Abbreviations:
|
EAC
|
esophageal adenocarcinoma
|
|
WGCNA
|
Weighted Gene Co-Expression Network
Analysis
|
|
DEG
|
differentially expressed gene
|
|
GO
|
Gene Ontology
|
|
KEGG
|
Kyoto Encyclopedia of Genes and
Genomes
|
|
DAVID
|
Database for Annotation Visualization
and Integrated Discovery
|
|
RFS
|
relapse-free survival
|
References
|
1
|
Domper Arnal MJ, Ferrández Arenas Á and
Lanas Arbeloa Á: Esophageal cancer: Risk factors, screening and
endoscopic treatment in Western and Eastern countries. World J
Gastroenterol. 21:7933–7943. 2015. View Article : Google Scholar : PubMed/NCBI
|
|
2
|
Siegel R, Naishadham D and Jemal A: Cancer
statistics, 2012. CA Cancer J Clin. 62:10–29. 2012. View Article : Google Scholar : PubMed/NCBI
|
|
3
|
Brown CS, Gwilliam N, Kyrillos A, Lutfi W,
Lapin B, Kim KW, Krantz SB, Howington JA, Yao K and Ujiki MB:
Predictors of pathologic upstaging in early esophageal
adenocarcinoma: Results from the national cancer database. Am J
Surg. 216:124–130. 2018. View Article : Google Scholar : PubMed/NCBI
|
|
4
|
Chen M, Huang J, Zhu Z, Zhang J and Li K:
Systematic review and meta-analysis of tumor biomarkers in
predicting prognosis in esophageal cancer. BMC Cancer. 13:5392013.
View Article : Google Scholar : PubMed/NCBI
|
|
5
|
Darlavoix T, Seelentag W, Yan P, Bachmann
A and Bosman FT: Altered expression of CD44 and DKK1 in the
progression of Barrett's esophagus to esophageal adenocarcinoma.
Virchows Arch. 454:629–637. 2009. View Article : Google Scholar : PubMed/NCBI
|
|
6
|
Smith CM, Watson DI, Michael MZ and Hussey
DJ: MicroRNAs, development of Barrett's esophagus, and progression
to esophageal adenocarcinoma. World J Gastroenterol. 16:531–537.
2010. View Article : Google Scholar : PubMed/NCBI
|
|
7
|
Leidner RS, Ravi L, Leahy P, Chen Y,
Bednarchik B, Streppel M, Canto M, Wang JS, Maitra A, Willis J, et
al: The MicroRNAs, MiR-31 and MiR-375, as candidate markers in
Barrett's esophageal carcinogenesis. Genes Chromosomes Cancer.
51:473–479. 2012. View Article : Google Scholar : PubMed/NCBI
|
|
8
|
Barrett T, Wilhite SE, Ledoux P,
Evangelista C, Kim IF, Tomashevsky M, Marshall KA, Phillippy KH,
Sherman PM, Holko M, et al: NCBI GEO: Archive for functional
genomics data sets-update. Nucleic Acids Res. 41:D991–D995. 2013.
View Article : Google Scholar : PubMed/NCBI
|
|
9
|
Wang Z, Cheng Y, Abraham JM, Yan R, Liu X,
Chen W, Ibrahim S, Schroth GP, Ke X, He Y and Meltzer SJ: RNA
sequencing of esophageal adenocarcinomas identifies novel fusion
transcripts, including NPC1-MELK, arising from a complex
chromosomal rearrangement. Cancer. 123:3916–3924. 2017. View Article : Google Scholar : PubMed/NCBI
|
|
10
|
Ritchie ME, Phipson B, Wu D, Hu Y, Law CW,
Shi W and Smyth GK: limma powers differential expression analyses
for RNA-sequencing and microarray studies. Nucleic Acids Res.
43:e472015. View Article : Google Scholar : PubMed/NCBI
|
|
11
|
Ashburner M, Ball CA, Blake JA, Botstein
D, Butler H, Cherry JM, Davis AP, Dolinski K, Dwight SS, Eppig JT,
et al: Gene Ontology: Tool for the unification of biology The gene
ontology consortium. Nat Genetics. 25:25–29. 2000. View Article : Google Scholar : PubMed/NCBI
|
|
12
|
Kanehisa M and Goto S: KEGG: Kyoto
encyclopedia of genes and genomes. Nucleic Acids Res. 28:27–30.
2000. View Article : Google Scholar : PubMed/NCBI
|
|
13
|
Huang DW, Sherman BT, Tan Q, Collins JR,
Alvord WG, Roayaei J, Stephens R, Baseler MW, Lane HC and Lempicki
RA: The DAVID gene functional classification tool: A novel
biological module-centric algorithm to functionally analyze large
gene lists. Genome Biol. 8:R1832007. View Article : Google Scholar : PubMed/NCBI
|
|
14
|
Langfelder P and Horvath S: Fast R
functions for robust correlations and hierarchical clustering. J
Stat Softw. 46:i112012. View Article : Google Scholar : PubMed/NCBI
|
|
15
|
Shannon P, Markiel A, Ozier O, Baliga NS,
Wang JT, Ramage D, Amin N, Schwikowski B and Ideker T: Cytoscape: A
software environment for integrated models of biomolecular
interaction networks. Genome Res. 13:2498–2504. 2003. View Article : Google Scholar : PubMed/NCBI
|
|
16
|
Lin H and Zelterman D: Modeling survival
data: Extending the cox model. J Am Stat Assoc. 44:85–86. 2002.
|
|
17
|
Wang Q, Ma C and Kemmner W: Wdr66 is a
novel marker for risk stratification and involved in
epithelial-mesenchymal transition of esophageal squamous cell
carcinoma. BMC Cancer. 13:1372013. View Article : Google Scholar : PubMed/NCBI
|
|
18
|
Thomas A, Klein MS, Stevens AP, Reinders
Y, Hellerbrand C, Dettmer K, Gronwald W, Oefner PJ and Reinders J:
Changes in the hepatic mitochondrial and membrane proteome in mice
fed a non-alcoholic steatohepatitis inducing diet. J Proteomics.
80:107–122. 2013. View Article : Google Scholar : PubMed/NCBI
|
|
19
|
Zehmer JK, Bartz R, Liu P and Anderson RG:
Identification of a novel N-terminal hydrophobic sequence that
targets proteins to lipid droplets. J Cell Sci. 121:1852–1860.
2008. View Article : Google Scholar : PubMed/NCBI
|
|
20
|
Wu CC, MacCoss MJ, Mardones G, Finnigan C,
Mogelsvang S, Yates JR 3rd and Howell KE: Organellar proteomics
reveals golgi arginine dimethylation. Mol Biol Cell. 15:2907–2919.
2004. View Article : Google Scholar : PubMed/NCBI
|
|
21
|
McKinnon CM and Mellor H: The tumor
suppressor RhoBTB1 controls Golgi integrity and breast cancer cell
invasion through METTL7B. BMC Cancer. 17:1452017. View Article : Google Scholar : PubMed/NCBI
|
|
22
|
Fan W, Sun L, Zhou JQ, Zhang C, Qin S,
Tang Y, Liu Y, Lin SS and Yuan ST: Marsdenia tenacissima extract
induces G0/G1 cell cycle arrest in human esophageal carcinoma cells
by inhibiting mitogen-activated protein kinase (MAPK) signaling
pathway. Chin J Nat Med. 13:428–437. 2015.PubMed/NCBI
|
|
23
|
Onwuegbusi BA, Rees JR, Lao-Sirieix P and
Fitzgerald RC: Selective loss of TGF beta smad-dependent signalling
prevents cell cycle arrest and promotes invasion in oesophageal
adenocarcinoma cell lines. Plos One. 2:e1772007. View Article : Google Scholar : PubMed/NCBI
|
|
24
|
Connor CA, Adriaens M, Pierini R, Johnson
IT and Belshaw NJ: Procyanidin induces apoptosis of esophageal
adenocarcinoma cells via JNK activation of c-Jun. Nutr Cancer.
66:335–341. 2014. View Article : Google Scholar : PubMed/NCBI
|
|
25
|
Sutter AP, Maaser K, Barthel B and
Scherübl H: Ligands of the peripheral benzodiazepine receptor
induce apoptosis and cell cycle arrest in oesophageal cancer cells:
Involvement of the p38MAPK signalling pathway. Br J Cancer.
89:564–572. 2003. View Article : Google Scholar : PubMed/NCBI
|
|
26
|
Hu JL, Xiao L, Li ZY, Wang Q, Chang Y and
Jin Y: Upregulation of HO-1 is accompanied by activation of p38MAPK
and mTOR in human oesophageal squamous carcinoma cells. Cell Biol
Int. 37:584–592. 2013. View Article : Google Scholar : PubMed/NCBI
|
|
27
|
Menon J, Doebele RC, Gomes S, Bevilacqua
E, Reindl KM and Rosner MR: A Novel interplay between Rap1 and PKA
regulates induction of angiogenesis in prostate cancer. Plos One.
7:e498932012. View Article : Google Scholar : PubMed/NCBI
|
|
28
|
Banerjee R, Russo N, Liu M, Van Tubergen E
and D'Silva NJ: Rap1 and its regulatory proteins: The tumor
suppressor, oncogene, tumor suppressor gene axis in head and neck
cancer. Small GTPases. 3:192–197. 2012. View Article : Google Scholar : PubMed/NCBI
|
|
29
|
Zhang YL, Wang RC, Cheng K, Ring BZ and Su
L: Roles of Rap1 signaling in tumor cell migration and invasion.
Cancer Biol Med. 14:90–99. 2017. View Article : Google Scholar : PubMed/NCBI
|