Introduction
Liver cirrhosis is the end stage of liver disease
and it has a number of different etiologies. Liver cirrhosis is
currently the 11th most common cause of death worldwide (1). Hepatocellular carcinoma (HCC) is the
most common cause of death in people with cirrhosis (2,3).
Although liver biopsy is the gold standard for diagnosing liver
cirrhosis, it is not readily accepted by patients as it is an
invasive procedure. No exact non-invasive markers have been
identified to evaluate and monitor the progression of liver
cirrhosis and the occurrence of HCC. Therefore, it is necessary to
develop a safe, convenient, and effective method to monitor the
occurrence and progression of liver cirrhosis.
Bile acids (BAs) are synthesized by a cascade of
reactions catalyzed by enzymes acting upon hepatocyte cholesterol
for recycling in the gut-liver axis (4). Factors including the gut microbiota
(5), bile salt transporters
(6) and nuclear receptor
farnesoid-X-receptor (FXR) (7),
participate in the regulation of BA homeostasis. Chronic
cholestasis leads to fibrosis, cirrhosis, and eventually liver
failure and hepatocellular/cholangiocellular carcinomas (7,8). Recent
studies have shown that alterations in BA homeostasis occur in
liver diseases. The primary-to-secondary BA ratio is higher in
non-alcoholic fatty hepatitis compared to healthy controls
(9). glycocholic acid (GCA),
taurocholic acid (TCA), glycochenodeoxycholic acid (GCDCA),
taurochenoxycholic acid (TCDCA), and glycoursodeoxycholic acid
(GUDCA) are significantly altered among different stages of
hepatitis B-induced cirrhosis (10).
In addition, higher concentrations of conjugated BAs, GCDCA and TCA
are found in the serum of HCC patients compared with healthy
controls (11). The elevated levels
of conjugated BAs appear to be associated with early-stage HCC,
whereas levels of BAs are elevated to a lesser extent in patients
with more advanced HCC (11). These
studies indicate the potential value of BAs as biomarkers for
pathological progression in liver diseases; however, the role of
BAs in the diagnosis and progression of liver cirrhosis has rarely
been investigated.
Thus, it is hypothesized that total and individual
BAs are sensitive indicators in assessing liver function and that
studying the BA spectrum may provide a better understanding of the
progression of liver cirrhosis and the occurrence of HCC. The aim
of this present study was to investigate the linkage between serum
BAs and the progression and prognosis of liver cirrhosis.
Materials and methods
Participants
Patients with chronic hepatitis (n=23), cirrhosis
(n=101) and cirrhosis complicated with HCC (CC-HCC; n=56)
hospitalized in Shanghai Tenth People's Hospital between January
2017 and January 2018 were enrolled into this prospective study.
Healthy subjects (n=22) were volunteer inpatients who had healthy
examinations during the same period. Chronic hepatitis in this
context referred to disease of the liver for ≥6 months in duration,
that had not developed into cirrhosis. Diagnosis of chronic
hepatitis, cirrhosis or CC-HCC was established based on a detailed
medical history; clinical signs; laboratory tests; imaging
examinations; and liver biopsy, if necessary. The exclusion
criteria were as follows: i) Patients who also presented with
severe heart, brain, kidney or other organ disease; ii) patients
with a history of gastrointestinal or hepatic surgery; iii)
patients with a history of treatment with ursodeoxycholic acid
(UDCA); iv) poor treatment compliance; v) patients who had had
viral infections or hepatotoxicity medications during the preceding
6 months; and (6) patients who also
presented with cholestasis caused by extrahepatic factors. Patients
with HCC were also excluded from the cirrhosis group in this
context. The Ethics Committee of Shanghai Tenth People's Hospital
approved this study.
All patients provided a detailed medical history,
underwent a physical examination, provided a blood sample, and
underwent an enhanced abdominal CT scan. Liver function was
assessed based on the Child-Pugh (CP) classification: Early-stage
cirrhosis (CP A), middle stage cirrhosis (CP B) and late stage
cirrhosis (CP C). The patients only received conservative and
symptomatic treatment with medicine during the course of cirrhosis.
Survival was recorded for 6 months after blood collection in
cirrhotic patients. Model for end-stage liver disease (MELD) has
been validated as an ideal and objective survival model in patients
with chronic liver diseases (12,13). It
accurately predicts short-term mortality among patients with
end-stage liver disease, and has been used worldwide for allocation
of organs for liver transplantation (14). MELD scores were calculated using the
following formula according to the guidelines of the United Network
of Organ Sharing (12,13): MELD score=9.57 × ln[creatinine
(mg/dl)] 3.78 × ln[bilirubin (mg/dl)] + 11.2 × ln(INR) + 6.43.
BA analysis
Blood samples were obtained from patients after an
overnight fast. The serum was separated by centrifugation at 1,700
× g for 10 min at 4°C, and stored at −80°C until the assay. Serum
samples (100 µl) were thawed and mixed with 500 µl acetonitrile.
After shaking vigorously for 5 min at room temperature and
centrifugation at 14,000 × g for 5 min at 4°C, 400 µl supernatant
was dried with 60°C nitrogen and suspended with 100 µl
acetonitrile. The analysis of bile samples was performed on a
Shimadzu high performance liquid chromatography apparatus (Shimadzu
Corporation) coupled to an API3200 Triple-Quadrupole mass
spectrometer (Applied Biosystems; Thermo Fisher Scientific, Inc.).
Quantification was conducted using deuterated internal standards.
BAs were separated using a Waters X SELECT column (3.0×50 mm; 3.5
µm; Waters Corporation) according to the manufacturer's
instructions. Tandem mass spectrometry was operated in negative ion
mode with multiple reaction monitoring (MRM) using settings in
accordance with a previous study (15). The ion spray voltage was −4,500 V.
The nitrogen gas temperature was 450°C. The ion source gas 1, ion
source gas 2 and curtain gas were set at 40, 35 and 20 psi,
respectively. The MRM transitions (m/z) were as follows:
407.3>407.3 for CA; 391.3>391.3 for UDCA, CDCA and DCA;
375.3>375.3 for LCA; 464.3>74 for GCA; 448.3>74 for GUDCA,
GCDCA and GDCA; 432.3>74 for GLCA; 514.3>80 for TCA;
498.3>80 for TUDCA, TCDCA and TDCA; 482.3>80 for TLCA;
411.3>411.3 for D4-CA; 395.3>395.3 for D4-CDCA, D4-DCA and
D4-UDCA; 379.3>379.3 for D4-LCA; 468.3>74 for D4-GCA;
452.3>74 for D4-GCDCA, D4-GUDCA and D4-GDCA; 436.3>74 for
D4-GLCA; 519.3>80 for D5-TCA; 503.3>80 for D5-TUDCA, D5-TCDCA
and D5-TDCA; and 487.3>80 for D5-TLCA. The data obtained from
the above platform were directly imported into Analyst software
1.6.2 (Applied Biosystems; Thermo Fisher Scientific, Inc.) for data
pre-processing. Finally, the concentration of each substance was
obtained by linear regression analysis also using Analyst software
1.6.2. The testing was performed in the Clinical Biochemical
Laboratory of the Shanghai Tenth People's Hospital by experienced
investigators.
The individual BA and the corresponding detection
ranges were as follows: Cholic acid (CA), 20–2,000 nM; deoxycholic
acid (DCA), 40–4,000 nM; chenodeoxycholic acid (CDCA), 40–4.000 nM;
UDCA, 40–4,000 nM; lithocholic acid (LCA), 30–3,000 nM; GCA,
30–3,000 nM; glycolithocholic acid, 10–1,000 nM; glycodeoxycholic
acid, 10–1,000 nM; GCDCA, 100–10,000 nM; GUDCA, 20–2,000 nM; TCA,
6–600 nM; taurolithocholic acid, 2–200 nM; taurodeoxycholic acid,
10–1,000 nM; TCDCA, 10–1,000 nM; and tauroursodeoxycholic acid
(TUDCA), 5–500 nM.
Statistical analysis
According to the distribution of the data,
comparisons of continuous variables between groups were conducted
using the one-way ANOVA (followed by a Bonferroni post hoc test),
Kruskal-Wallis test (followed by a Dunn-Bonferroni post hoc test),
unpaired Student's t-test or Mann-Whitney U test. Categorical
variables were compared with the χ2 test or Fisher's
exact test. Correlations between BAs and CP scores were computed
using Spearman's correlation analysis. Diagnosis and prediction
analyses were determined by receiver operating characteristic (ROC)
curves. Cut-off values were determined via the Youden index. The
Kaplan-Meier method was conducted to analyze survival, and
comparisons were made with the log-rank test. A Cox regression
analysis was used to analyze the association between BAs and
mortality, and the association was adjusted for age and MELD score.
Statistical analyses were carried out using SPSS version 20.0 (IBM
Corp.) and GraphPad Prism software version 7.0 (GraphPad Software,
Inc.) for Windows. P<0.05 was considered to indicate a
statistically significant difference. Partial least
squares-discriminant analysis (PLS-DA) was used to visualize the BA
metabolome, which was conducted using the MetaboAnalyst 4.0 tool
(http://www.metaboanalyst.ca/) (16).
Results
Baseline characteristics
Participants enrolled in the study were 40–80 years
of age. Cirrhotic patients included 51 (50.5%) with viral hepatitis
cirrhosis, 19 (18.8%) with alcoholic liver cirrhosis, 11 (10.9%)
with autoimmune hepatitis cirrhosis, and 20 (19.8%) with cirrhosis
due to other etiologies. The cirrhotic patients were separated into
three groups based on the CP classification (CP A, CP B, and CP C),
with 38 (37.6%), 32 (31.7%), and 31 (30.7%) patients, respectively.
Patients with chronic hepatitis included 11 (47.8%) with viral
hepatitis, 5 (21.7%) with alcoholic hepatitis, 3 (13.0%) with
autoimmune hepatitis, and 4 (17.4%) due to other etiologies. No
statistically significant differences in age, sex, and etiology
existed in patients with chronic hepatitis and CP A, as well as
patients with different stages of cirrhosis (Table I). During the 6-month follow-up, 24
(23.8%) cirrhotic patients died. Age and sex did not differ
statistically between the survival and death groups (Table II). There was no significant
difference in age and sex between the healthy subjects, patients
with cirrhosis, and patients with CC-HCC (Table III).
 | Table I.Clinical information and
characteristics of patients with chronic hepatitis and
cirrhosis. |
Table I.
Clinical information and
characteristics of patients with chronic hepatitis and
cirrhosis.
| Parameter | Chronic hepatitis
(n=23) | CP A (n=38) | CP B (n=32) | CP C (n=31) |
|---|
| Age, years | 63±8 | 62±9 | 65±12 | 65±7 |
| Sex, M/F | 15/8 | 25/13 | 22/10 | 21/10 |
| Etiology |
|
|
|
|
| Viral,
n (%) | 11 (47.8) | 18 (47.4) | 17 (53.1) | 16 (51.6) |
|
Alcoholic, n (%) | 5 (21.7) | 8 (21.1) | 5 (15.6) | 6 (19.4) |
|
Autoimmune, n (%) | 3 (13.0) | 4 (10.5) | 4 (12.5) | 3 (9.7) |
| Others,
n (%) | 4 (17.4) | 8 (21.1) | 6 (18.8) | 6 (19.4) |
| ALT, U/l | 68±21 | 25±18a | 23±20 | 26±14 |
| ALP, U/l | 80±33 | 86±30 | 97±42 | 128±51c |
| Albumin, g/l | 41±3 | 40±4 | 29±6b | 26±4c |
| PT, sec | 12.9±1.1 | 13.1±1.4 | 14.7±1.5 |
17.1±3.6c |
| Table II.Clinical information of cirrhotic
patients in the survival and death groups (6 months following blood
sample collection). |
Table II.
Clinical information of cirrhotic
patients in the survival and death groups (6 months following blood
sample collection).
| Parameter | Survival
(n=77) | Death (n=24) | P-value |
|---|
| Age, years | 63±12 | 68±10 | 0.070 |
| Sex, M/F | 51/27 | 17/6 | 0.614 |
| Etiology |
|
|
|
| Viral,
n (%) | 40 (51.9) | 11 (45.8) | 0.601 |
|
Alcoholic, n (%) | 15 (19.5) | 4 (16.7) | 0.993 |
|
Autoimmune, n (%) | 8 (10.4) | 3 (12.5) | 0.720 |
| Others,
n (%) | 14 (18.2) | 6 (25.0) | 0.558 |
| ALT, U/l | 21±16 | 25±23 | 0.916 |
| ALP, U/l | 95±38 | 129±55 | 0.001 |
| Albumin, g/l | 34±8 | 28±5 | 0.002 |
| PT, sec | 14.6±2.6 | 16.6±4.3 | 0.012 |
| MELD | 12.34±4.73 | 17.19±5.32 | <0.001 |
| Table III.Clinical information of healthy
subjects, patients with cirrhosis and CC-HCC. |
Table III.
Clinical information of healthy
subjects, patients with cirrhosis and CC-HCC.
| Parameter | Healthy control
(n=22) | Cirrhosis
(n=101) | CC-HCC (n=56) |
|---|
| Age (years) | 63±9 | 64±9 | 63±8 |
| Gender (M/F) | 15/7 | 68/33 | 40/16 |
| Child-Pugh
A/B/C | N/A | 38/32/31 | 15/23/18 |
| Etiology |
|
|
|
| Viral,
n (%) | N/A | 51 (50.5) | 29 (51.8) |
|
Alcoholic, n (%) | N/A | 19 (18.8) | 10 (17.9) |
|
Autoimmune, n (%) | N/A | 11 (10.9) | 4 (7.1) |
| Others,
n (%) | N/A | 20 (19.8) | 13 (23.2) |
| ALT (U/l) | 16±7 | 25±18b | 48±39a |
| ALP (U/l) | 68±19 | 103±45 | 125±62a |
| Albumin (g/l) | 43±6 | 33±8a | 31±8a |
| PT (s) | 10.9±0.8 |
15.0±3.1a |
14.5±3.0a |
| Clinical
characteristics |
|
|
|
|
Ascites | N/A | 58 (57.4) | 34 (60.7) |
|
Spontaneous bacterial
peritonitis | N/A | 13 (12.9) | 3 (5.4) |
| Hepatic
encephalopathy | N/A | 24 (23.8) | 6 (19.7) |
| Medical
history |
|
|
|
| Upper
gastrointestinal hemorrhage | N/A | 51
(50.5)b | 18 (32.1) |
|
Symptomatic treatment of
medicine | N/A | 101 (100) | 56 (100) |
BAs in patients with chronic hepatitis
and cirrhosis
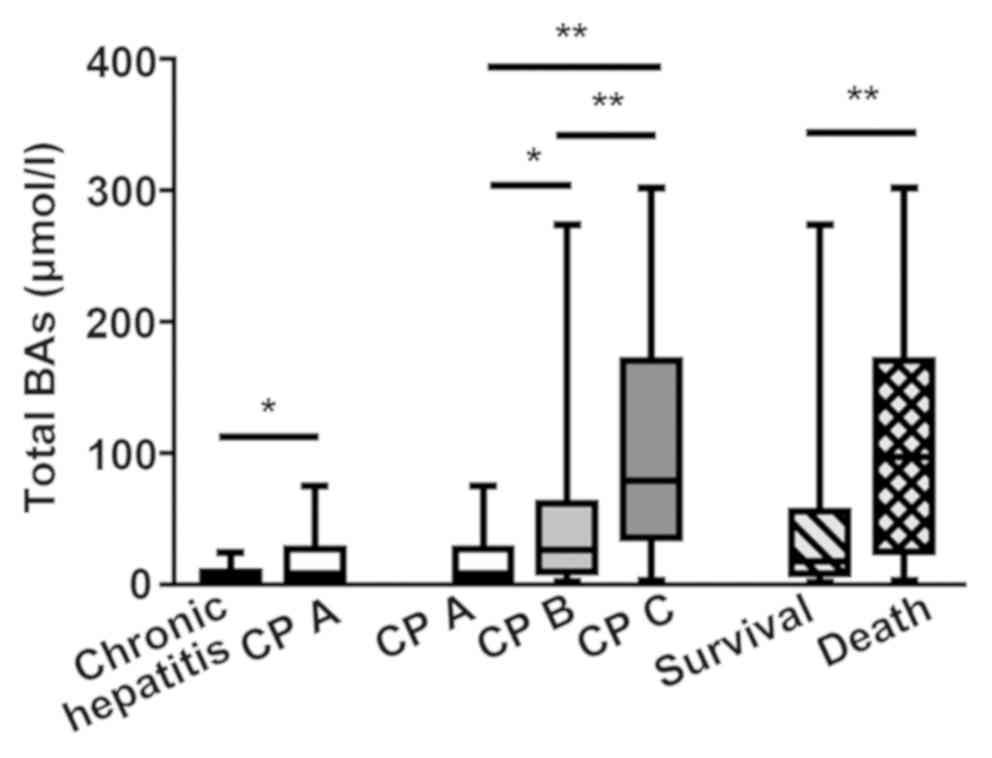
Patients with cirrhosis had significant elevations
in the concentrations of primary conjugated BAs (GCA, GCDCA, TCDCA
and TCA), TUDCA and total BAs compared with chronic hepatitis
patients (P<0.05; Figs. 1 and
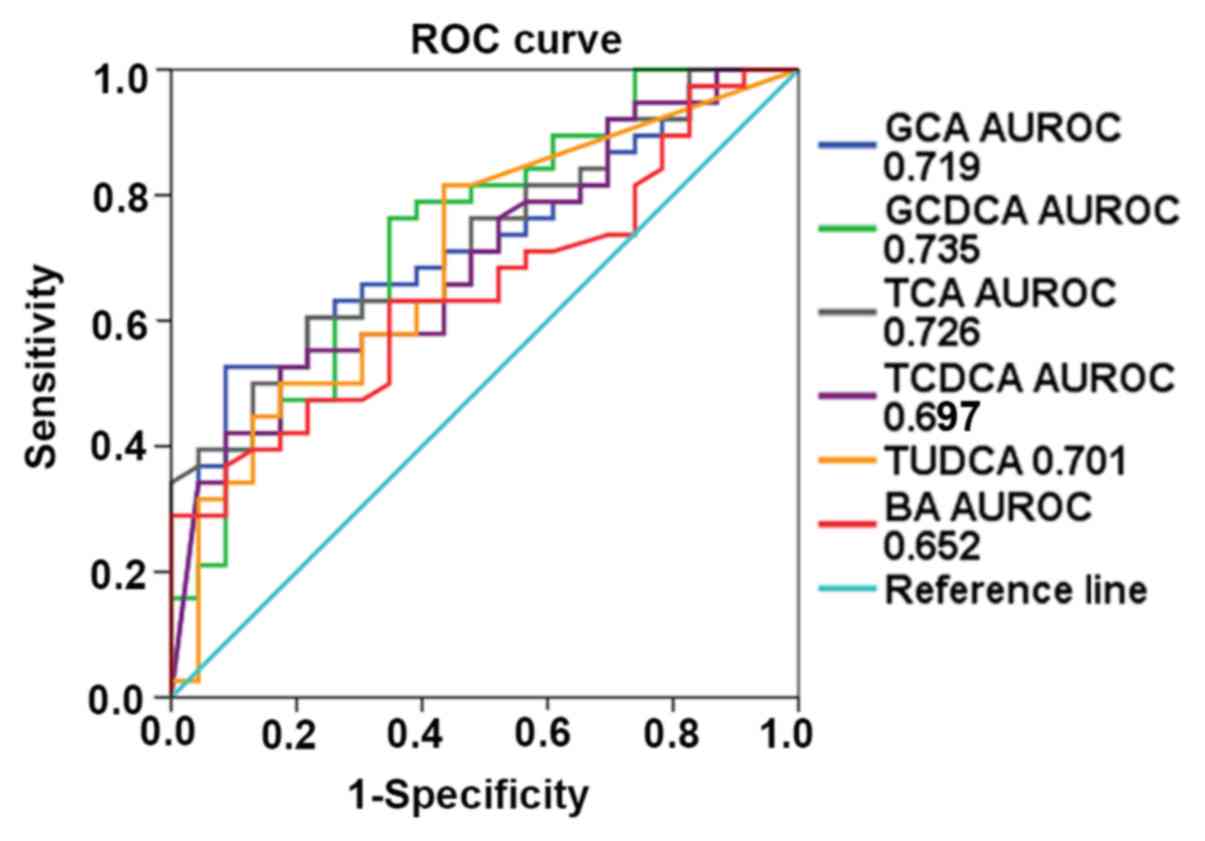
2). The ROC curves revealed that
GCDCA had the best diagnostic performance for liver cirrhosis
(0.735; P=0.002), followed by TCA (0.726; P=0.003), GCA (0.719;
P=0.004), TUDCA (0.701; P=0.009), TCDCA (0.697; P=0.010), and total
BAs (0.652; P=0.049), with an area under the receiver operating
characteristic curve (AUROC) of 0.735 [95% confidence interval
(CI), 0.605–0.864], 0.726 (95% CI, 0.601–0.851), 0.719 (95% CI,
0.591–0.847), 0.701 (95% CI, 0.566–0.837), 0.697 (95% CI,
0.565–0.829), and 0.652 (95% CI, 0.515–0.788), respectively
(Fig. 3).
 | Figure 1.Box diagram of individual serum bile
acids in patients with chronic hepatitis and CP A patients. (A)
Comparison of GCA, GCDCA, and TCDCA concentrations. (B) Comparison
of TCA and TUDCA concentrations. *P<0.05, **P<0.01
(Mann-Whitney U test). CP, Child Pugh score; CP A, early stage
cirrhosis; GCA, glycocholic acid; GCDCA, glycochenodeoxycholic
acid; TCA, taurocholic acid; TCDCA, taurochenoxycholic acid; TUDCA,
tauroursodeoxycholic acid. |
BAs in patients with liver
cirrhosis
The level of total BAs significantly increased as
liver cirrhosis progressed (Fig. 2).
The concentrations of primary conjugated BAs and TUDCA were
significantly higher in the CP B and CP C groups than in the CP A
group (P<0.05). The secondary BAs (DCA and LCA) decreased with
the severity of liver disease, but there was no statistical
significance (Fig. 4). Spearman
correlation analysis showed that the level of total BAs was
significantly correlated with the CP score (r=0.580, P<0.001).
Among the individual BAs, the concentrations of GCA, GCDCA, TCA,
TCDCA, and TUDCA were positively correlated with CP scores
[Spearman r (GCA, 0.489, P<0.001; GCDCA, 0.520, P<0.001; TCA,
0.545, P<0.001; TCDCA, 0.571, P<0.001; TUDCA, 0.467,
P<0.001); Table IV].
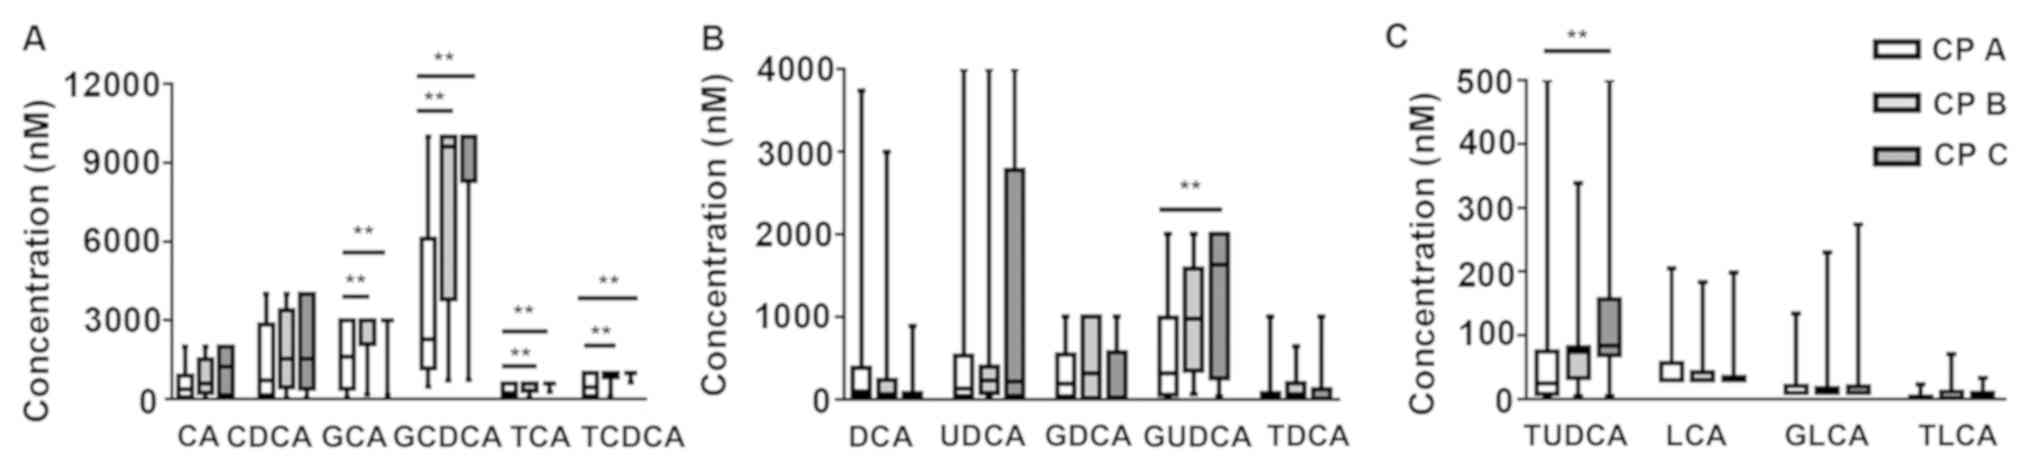 | Figure 4.Box diagrams of individual serum bile
acids in different stages of CP classification in cirrhotic
patients. (A) Comparison of CA, CDCA, GCA, GCDCA, TCA, and TCDCA
concentrations. (B) Comparison of DCA, UDCA, GDCA, GUDCA, and TDCA
concentrations. (C) Comparison of TUDCA, LCA, GLCA, and TLCA
concentrations. **P<0.01 [Kruskal-Wallis test (followed by
Dunn-Bonferroni post hoc method)]. CA, cholic acid; CDCA,
chenodeoxycholic acid; CP, Child-Pugh score; CP A, early stage
cirrhosis; CP B, middle stage cirrhosis; CP C, late stage
cirrhosis; DCA, deoxycholic acid; GCA, glycocholic acid; GCDCA,
glycochenodeoxycholic acid; GLCA, glycolithocholic acid; GUDCA,
glycoursodeoxycholic acid; LCA, lithocholic acid; TCA, taurocholic
acid; TCDCA, taurochenoxycholic acid; TDCA, taurodeoxycholic acid;
TLCA, taurolithocholic acid; TUDCA, tauroursodeoxycholic acid;
UDCA, ursodeoxycholic acid. |
| Table IV.Correlations of Child-Pugh scores
with BAs by Spearman analysis. |
Table IV.
Correlations of Child-Pugh scores
with BAs by Spearman analysis.
| BAs | Correlation
coefficient | P-value |
|---|
| Total BAs | 0.580 | <0.001 |
| GCA | 0.489 | <0.001 |
| GCDCA | 0.520 | <0.001 |
| TCA | 0.545 | <0.001 |
| TCDCA | 0.571 | <0.001 |
| TUDCA | 0.467 | <0.001 |
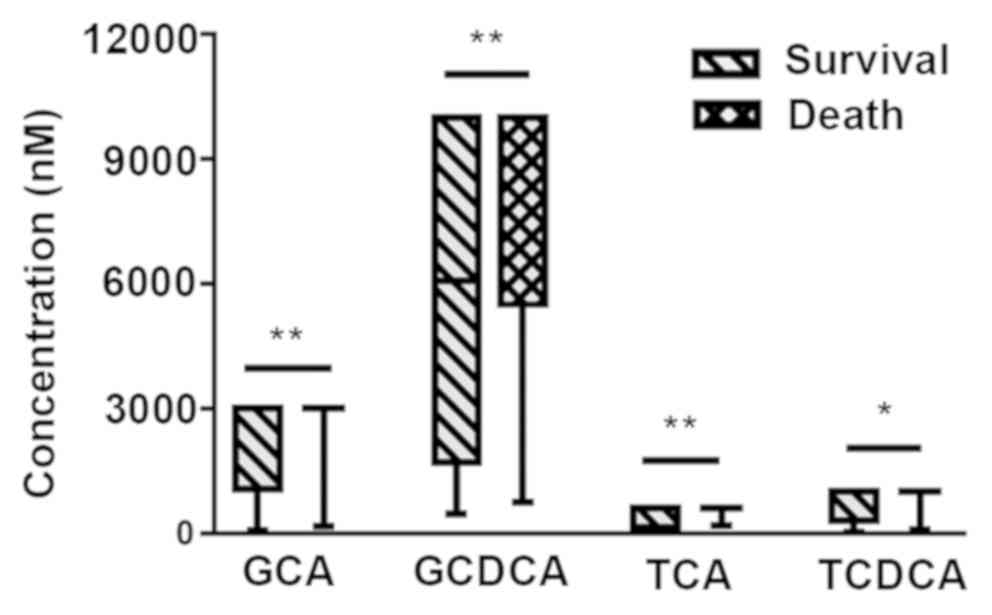
Cirrhotic patients were analyzed as two groups,
depending on their survival after 6 months from blood sample
collections. Total BAs, GCA, GCDCA, TCA and TCDCA showed a
significant increase in the death group (P<0.05; Figs. 2 and 5). Because the levels of GCA, TCA and TCDCA
increased above the maximum detection range in the majority of
deceased patients, the shapes of the box plots looked unusual in
Fig. 5 (if the levels of BAs exceed
the maximum detection range, the samples can be diluted to obtain
precise values; however, considering the limitation of the sample
volume, the samples were not diluted to retest the specific levels
of individual BAs). The concentrations of total BAs, GCA, GCDCA,
and TCA were statistically significant in predicting the 6-month
survival in cirrhotic patients (P=0.0003, 0.005, 0.002, 0.010
respectively), with an AUROC of 0.744 (95% CI, 0.616–0.872), 0.689
(95% CI, 0.583–0.796), 0.707 (95% CI, 0.592–0.823), and 0.674 (95%
CI, 0.565–0.784) respectively (Fig.
6). MELD score is well known for its good performance in
evaluating survival of patients with end-stage cirrhosis (13). In this present study, MELD score
strongly predicted the 6-month survival of cirrhotic patients
(P<0.001), with an AUROC of 0.773 (95% CI, 0.676–0.870).
Although the prediction accuracies of BAs were slightly lower than
those of the MELD score, BAs were still effective and convenient
prognostic indicators for cirrhotic patients. The Youden index
revealed total BAs ≥75.7 µmol/l, GCA ≥2,954 nmol/l, GCDCA ≥8,400
nmol/l, TCA ≥599.5 nmol/l, and TCDCA ≥619.5 nmol/l as best cut-off
values. The cumulative 6-month survival was significantly higher in
patients with total BAs ≥75.7 µmol/l in comparison with total BAs
<75.7 µmol/l (P<0.001). The mortality of patients with a high
concentration of GCA, TCA, GCDCA, or TCDCA was significantly higher
than that of patients with low concentrations of GCA, GCDCA, TCA or
TCDCA (P=0.004, 0.001, 0.005 and 0.021, respectively; Fig. 6). The present study further analyzed
whether BAs were still a relevant predictor of mortality after
adjustment for age and MELD score by using Cox regression. This
showed that total BAs ≥75.7 µmol/l (hazard ratio, 4.046; 95% CI,
1.620–10.108; P=0.003) significantly predicted mortality in
cirrhotic patients independently of age and MELD score (Table V). A high level of total BAs was
associated with a poor outcome among cirrhotic patients. However,
after adjustment for age and MELD, the individual BAs were no
longer significant predictors for mortality (data not shown).
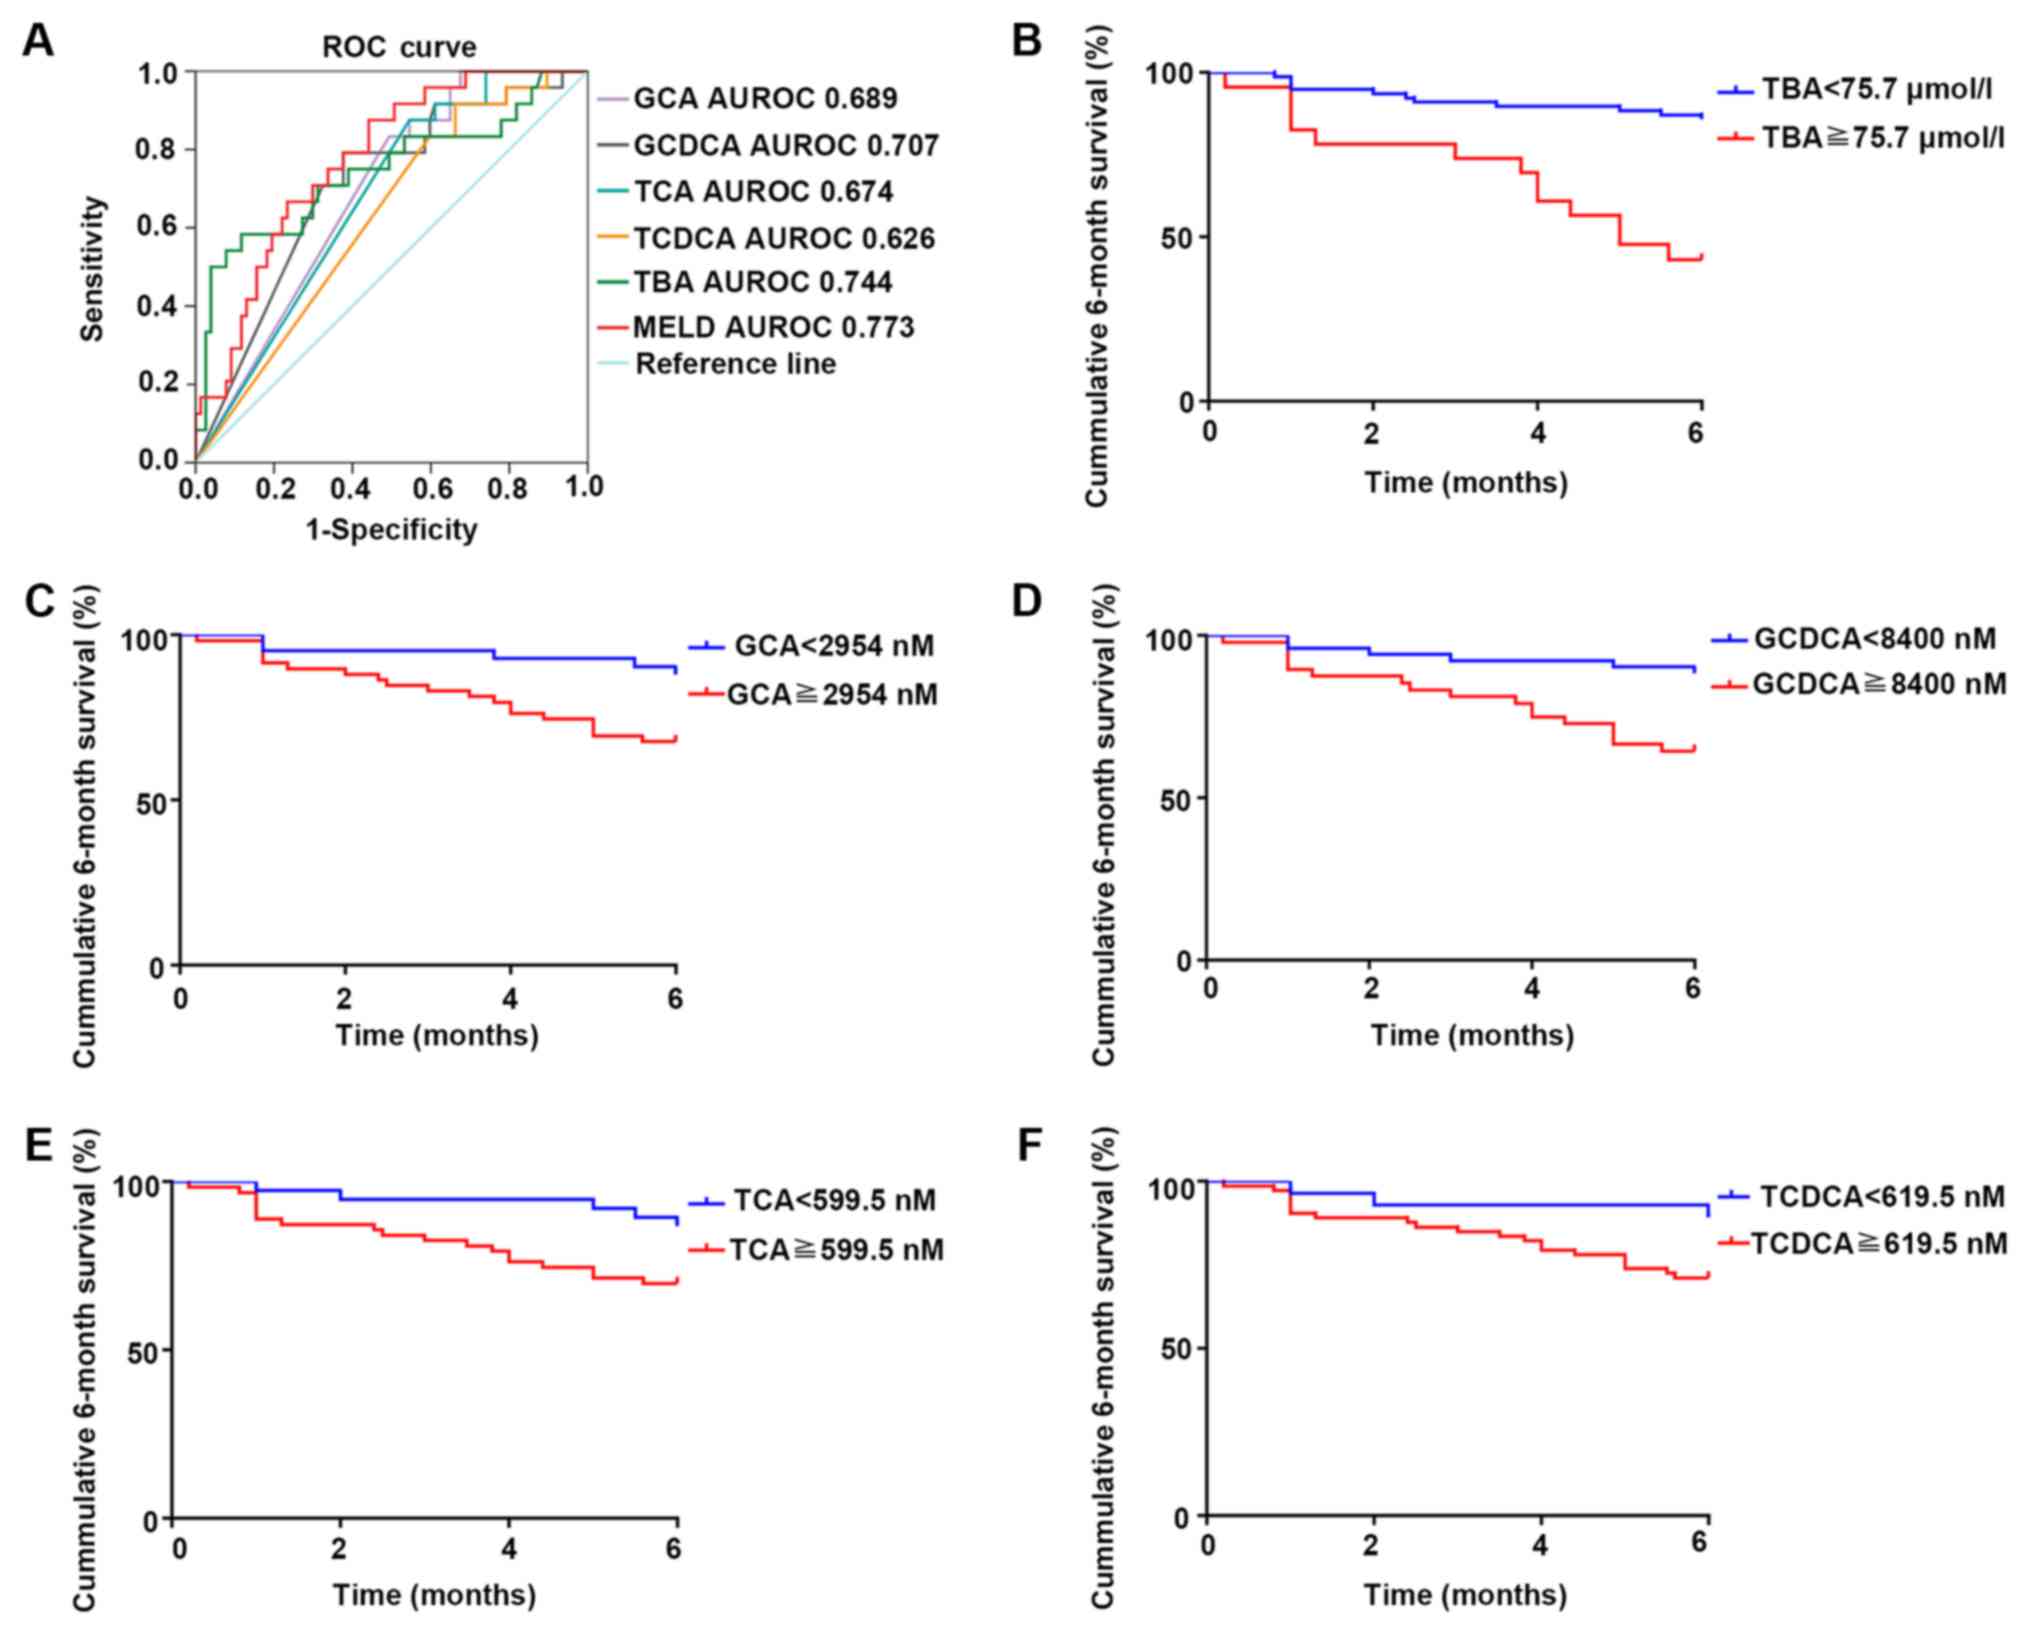 | Figure 6.Survival analysis of TBAs and the
four individual BAs. (A) The ROC curve of TBAs and four individual
BAs in predicting the 6-month survival (TBA: P<0.001; GCA:
P=0.005; GCDCA: P=0.002; TCA: P=0.010; TCDCA: P=0.064).
Kaplan-Meier plot of 6-month survival in patients with different
levels of (B) ΤBAs, (C) GCA, (D) GCDCA, (E) TCA and (F) TCDCA (TBA:
P<0.001; GCA: P=0.004; GCDCA: P=0.005; TCA: P=0.001; TCDCA:
P=0.021). AUROC, area under the receiver operating characteristic
curve; GCA, glycocholic acid; GCDCA, glycochenodeoxycholic acid;
MELD, model for end-stage liver disease; ROC, receiver operating
characteristic; TBA, total bile acids; TCA, taurocholic acid;
TCDCA, taurochenoxycholic acid. |
| Table V.Cox regression analysis for 6-month
mortality. |
Table V.
Cox regression analysis for 6-month
mortality.
| Variables | Univariate Cox
regression HR (95% CI) | P-value | Multivariate Cox
regression HR (95% CI) | P-value |
|---|
| Age, years | 1.045
(0.996–1.096) | 0.074 | 1.047
(0.986–1.112) | 0.132 |
| MELD score | 1.154
(1.073–1.242) | <0.001 | 1.092
(1.005–1.187) | 0.038 |
| Total BAs ≥75.7
µmol/l | 5.998
(2.656–13.548) | <0.001 | 4.046
(1.620–10.108) | 0.003 |
BAs in patients with liver cirrhosis
and CC-HCC
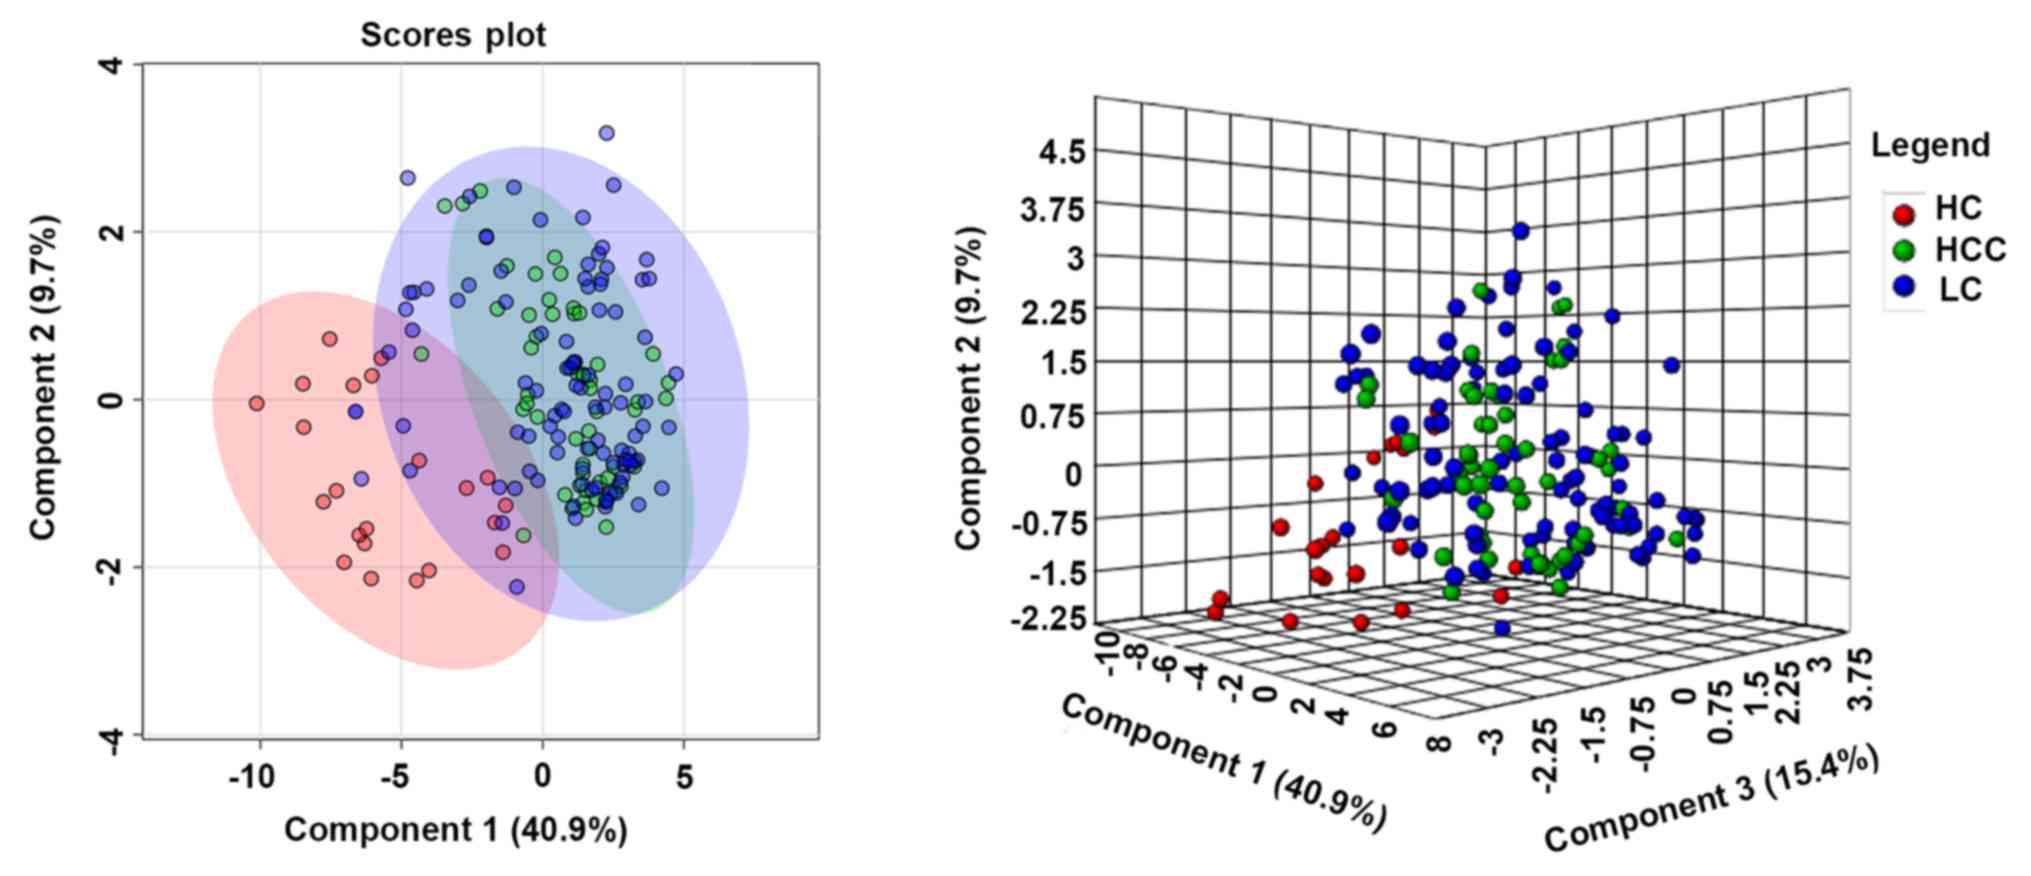
PLS-DA was used to visualize the BA metabolism in
healthy subjects, patients with liver cirrhosis and patients with
CC-HCC. Patients with liver cirrhosis and CC-HCC were distinctly
separated from healthy subjects, but the clusters showed little
variation between patients with cirrhosis and CC-HCC (Fig. 7). Levels of total and individual BAs
were analyzed in patients with cirrhosis and CC-HCC with the same
CP class. In the early-stage (CP A), the concentration of total BAs
was significantly higher in patients with CC-HCC compared with
patients with cirrhosis [median, 22 µmol/l; inter-quartile range
(IQR), 10.4–32.6 vs. median, 8.7 µmol/l; IQR, 4.2–26.5
respectively; P=0.049], and the levels of primary conjugated BAs,
and TUDCA were significantly higher in patients with CC-HCC
compared to patients with cirrhosis (Fig. 8). In the advanced stage, the
concentrations of BAs were not significantly different between the
two groups (data not shown). In patients with CC-HCC, Spearman
correlation analysis showed no significant correlation between the
levels of total and individual BAs and Barcelona scores. During the
6-month follow-up, 23 (41.1%) patients died. There was no
significant difference in the levels of total BAs between the blood
samples collected from patients who survived compared to patients
who died (median, 31.7 µmol/l; IQR 10.4–64.5 vs. median, 63.4
µmol/l; IQR, 20.5–109.9 respectively; P=0.067). The individual BAs
also showed no significant differences among the deceased and
surviving patients (Fig. S1).
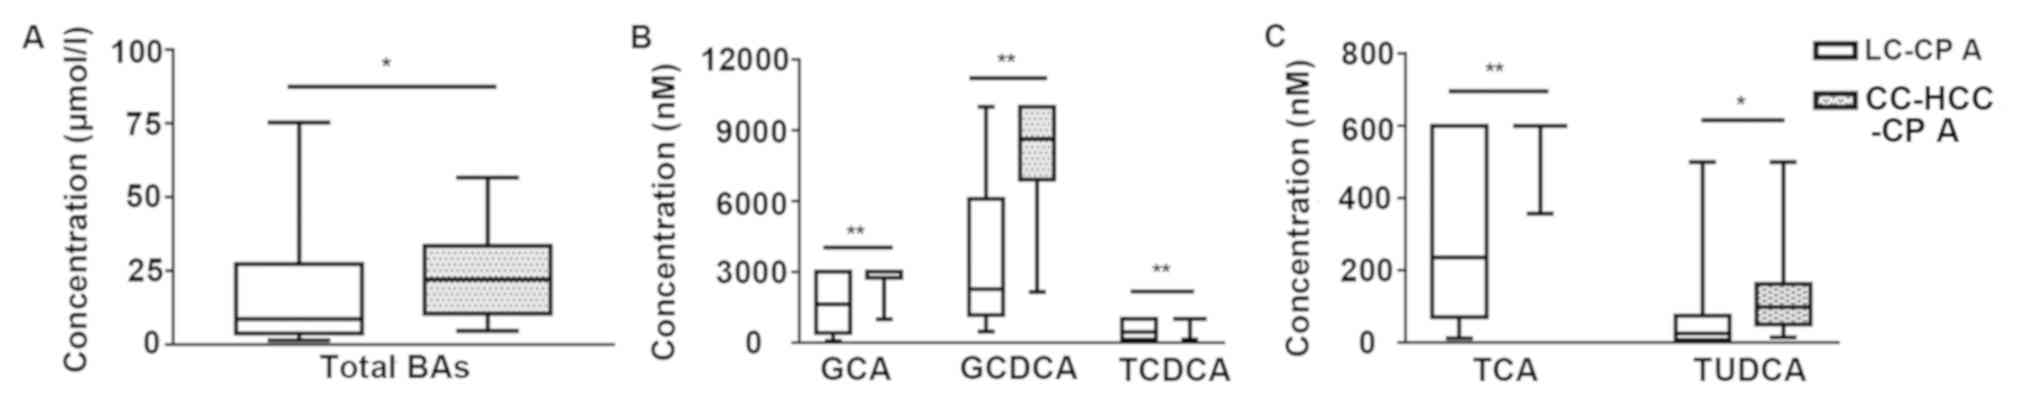 | Figure 8.Box diagram of total BAs and five
individual BAs in patients with cirrhosis and patients with CC-HCC
in early-stage cirrhosis. (A) Comparison of total BAs. (B)
Comparison of GCA, GCDCA, and TCDCA. (C) Comparison of TCA and
TUDCA. *P<0.05, **P<0.01 (Mann-Whitney U test). BAs, bile
acids; CC-HCC, cirrhosis complicated hepatocellular carcinoma; CP,
Child-Pugh score; CP-A, early stage cirrhosis; GCA, glycocholic
acid; GCDCA, glycochenodeoxycholic acid; HCC, hepatocellular
carcinoma; LC, liver cirrhosis; TCA, taurocholic acid; TCDCA,
taurochenoxycholic acid; TUDCA, tauroursodeoxycholic acid. |
Discussion
A previous study indicated the correlation between
serum total BA levels and mortality risk in patients with cirrhosis
(17). Portal-systemic shunting
(18) and diminished hepatic
clearance of BAs (19) are thought
to be two of the most essential factors in the elevation of serum
BAs in patients with cirrhosis. Recent studies have shown that
alterations in the intestinal flora play an indispensable role in
BA disorders among cirrhotic patients (20,21).
Furthermore, FXR plays a pivotal role in regulating BA homeostasis.
BAs are high-affinity endogenous FXR ligands. The order of potency
of BAs is CDCA>LCA=DCA>CA (22). FXR activation regulates a network of
genes in hepatic BA synthesis, biliary BA secretion, intestinal BA
absorption and hepatic BA uptake (22,23). The
inappropriate function of FXR is often associated with liver
diseases, including liver fibrosis and HCC, and previous studies
have shown that FXR is deficient in liver cirrhosis (24,25). The
absence of FXR regulation is an important cause of BA disorders,
and FXR agonists are considered to be potential medicines for BA
regulation and cirrhosis treatment (24). On the basis of these factors, it is
hypothesized that with the occurrence and progression of liver
cirrhosis, the concentrations of individual BAs may correspondingly
change.
This present study indicated that GCA, GCDCA, TCA,
TCDCA, and TUDCA were significantly increased in patients with
cirrhosis compared to patients without cirrhosis. These individual
BAs may be potential indicators in the diagnosis of cirrhosis. In
patients with progressive liver cirrhosis, the main alteration
observed was a significant increase in conjugated primary BAs,
whereas there was a decreasing trend in secondary BAs (DCA and
LCA). A previous study also showed that progressive liver cirrhosis
causes a decrease in the conversion of fecal primary BAs to
secondary BAs (26).
Alterations in BAs are closely related to
pathological changes during the development of cirrhosis. BAs
synthesized in the liver are excreted in bile as conjugates with
glycine or taurine; however, the secretion of BAs markedly
diminishes in cirrhosis (27), which
results in the intrahepatic cholestasis and the low concentrations
of BAs in the intestine. Because the inhibitory effect of BAs on
intestinal flora is weakened, intestinal bacteria overgrow
(5,28). BAs are rapidly deconjugated by
bacteria and absorbed via non-ionic diffusion (29). In addition, with the progression of
liver cirrhosis, portal hypertension leads to an increase in
intestinal permeability (29,30).
This may increase the passive absorption of BAs via the plasma
membrane, and further reduce the quantity of BAs entering the
colon. Thus, conversion of primary BAs to secondary BAs by
bacterial 7α-dehydroxylase is decreased (29,30).
Therefore, with the development of cirrhosis, the level of total
serum BAs is increased, especially conjugated primary BAs, which
may be of great value to clinicians for diagnosing and evaluating
the progress of liver cirrhosis.
BAs play an essential role in the deterioration of
liver cirrhosis. Hydrophobic BAs, such as CDCA and GCDCA, are
considered to be highly toxic (31).
Accumulation of high levels of hydrophobic BAs in hepatocytes may
induce cell injury through promotion of inflammation and
mitochondrial oxidative stress-mediated death pathways (7,32).
Furthermore, the toxicity of BAs which have accumulated in the
circulation is also reflected in organs other than the liver.
Hydrophobic BAs are able to cross the blood-brain barrier, thus
causing damage to the central nervous system and worsening the
course of hepatic encephalopathy in animal experiments (33). Clinical studies have shown that BA
retention is associated with hepatopulmonary syndrome and gas
exchange abnormalities (34). BA
overload has also been shown to be toxic to cardiomyocytes, thus
inducing cardiomyopathy and metabolic dysfunction in the heart
(35), and leading to
life-threatening arrhythmias, vasorelaxation, and decreased
peripheral resistance (36,37).
Retention of toxic BAs may aggravate liver injury
and influence the prognosis of cirrhotic patients. Total and
individual BA values were further analyzed to examine their
potential in predicting 6-month mortality among cirrhotic patients,
which showed that total BAs, GCA, GCDCA and TCA were significantly
altered in cirrhotic patients. The Kaplan-Meier plot suggested that
the 6-month survival rate was significantly higher in patients with
low levels of total and primary conjugated BAs. Notably,
multivariate regression analysis showed that a high level of total
BAs was an independent predictor of mortality in cirrhotic
patients. The results showed that BAs are effective markers for
predicting short-term survival in cirrhotic patients.
HCC is the most common cause of death in cirrhotic
patients (2,3). The lack of good biomarkers for early
diagnosis of HCC may result in poor prognosis, especially for
patients with compensatory liver function (38). Previous studies have shown that BAs
are involved in the proliferation and regeneration of hepatocytes
(39) and pathogenesis of
hepatocellular carcinoma (40).
Hydrophobic BAs may collaboratively promote liver carcinogenesis
(41). In this present study, it was
found that in patients with early cirrhosis, the concentrations of
total BAs and primary conjugated BAs were significantly higher in
patients who also had HCC compared to patients without HCC. This
indicates that the occurrence of HCC should be considered in
patients presenting with early cirrhosis and high levels of total
and primary conjugated BAs. Total and primary conjugated BAs may be
potential biomarkers for the early diagnosis of HCC in patients
with early cirrhosis.
Taken together, the results of the present study
verified the diagnostic value of the BA spectrum in liver
cirrhosis. The results emphasized the close relationship between
liver function and BA components, and suggested the prognostic role
of BAs in cirrhotic patients; however, this present study also had
some limitations. The sample was small and patients involved were
all inpatients. The detection range was limited, which may increase
the errors of the test to some extent. The limitation of the
detection range is reflected in most detection methods. Although it
was not possible to obtain exact values for the BA levels, they may
still be used as potential diagnostic/prognostic markers of
cirrhosis. Further investigations are needed to confirm this
inference.
In conclusion, increased levels of total and primary
conjugated BAs are associated with the occurrence, deterioration
and prognosis of liver cirrhosis. High levels of total BAs may be
an independent predictor of mortality in cirrhotic patients. Total
and primary conjugated BAs may be potential biomarkers for the
occurrence of HCC in patients with early cirrhosis.
Supplementary Material
Supporting Data
Acknowledgements
Not applicable.
Funding
This study was financially supported by the
Sustainable Development of Science and Technology Innovation
Project of Chongming District, Shanghai (grant no. CKY2018-32) and
Shanghai Natural Science Foundation (grant no. 19ZR1439900).
Availability of data and materials
The datasets used and/or analyzed during the current
study are available from the corresponding author on reasonable
request.
Authors' contributions
NL, JF, CG and YZ conceived and designed the
experiments. NL, JF, YL and QL were responsible for data
collection. NL, JD, and YX performed the data analysis. NL wrote
the manuscript. JF and JD critically revised the manuscript before
submission. All authors approved the final version of the
manuscript.
Ethics approval and consent to
participate
The Ethics Committee of Shanghai Tenth People's
Hospital approved this study. Informed consent was obtained from
all participants enrolled in the study.
Patient consent for publication
Not applicable.
Competing interests
The authors declare that they have no competing
interests.
References
|
1
|
Asrani SK, Devarbhavi H, Eaton J and
Kamath PS: Burden of liver diseases in the world. J Hepatol.
70:151–171. 2019. View Article : Google Scholar : PubMed/NCBI
|
|
2
|
Fattovich G, Stroffolini T, Zagni I and
Donato F: Hepatocellular carcinoma in cirrhosis: Incidence and risk
factors. Gastroenterology. 127((5 Suppl 1)): S35–S50. 2004.
View Article : Google Scholar : PubMed/NCBI
|
|
3
|
Forner A, Llovet JM and Bruix J:
Hepatocellular carcinoma. Lancet. 379:1245–1255. 2012. View Article : Google Scholar : PubMed/NCBI
|
|
4
|
Boyer JL: Bile formation and secretion.
Compr Physiol. 3:1035–1078. 2013.PubMed/NCBI
|
|
5
|
Arab JP, Martin-Mateos RM and Shah VH:
Gut-liver axis, cirrhosis and portal hypertension: The chicken and
the egg. Hepatol Int. 12 (Suppl 1):S24–S33. 2018. View Article : Google Scholar
|
|
6
|
Meier PJ and Stieger B: Bile salt
transporters. Annu Rev Physiol. 64:635–661. 2002. View Article : Google Scholar : PubMed/NCBI
|
|
7
|
Li T and Apte U: Bile acid metabolism and
signaling in cholestasis, inflammation, and cancer. Adv Pharmacol.
74:263–302. 2015. View Article : Google Scholar : PubMed/NCBI
|
|
8
|
Wang H, Shang X, Wan X, Xiang X, Mao Q,
Deng G and Wu Y: Increased hepatocellular carcinoma risk in chronic
hepatitis B patients with persistently elevated serum total bile
acid: A retrospective cohort study. Sci Rep. 6:381802016.
View Article : Google Scholar : PubMed/NCBI
|
|
9
|
Mouzaki M, Wang AY, Bandsma R, Comelli EM,
Arendt BM, Zhang L, Fung S, Fischer SE, McGilvray IG and Allard JP:
Bile acids and dysbiosis in non-alcoholic fatty liver disease. PLoS
One. 11:e01518292016. View Article : Google Scholar : PubMed/NCBI
|
|
10
|
Wang X, Xie G, Zhao A, Zheng X, Huang F,
Wang Y, Yao C, Jia W and Liu P: Serum bile acids are associated
with pathological progression of hepatitis B-induced cirrhosis. J
Proteome Res. 15:1126–1134. 2016. View Article : Google Scholar : PubMed/NCBI
|
|
11
|
Chen T, Xie G, Wang X, Fan J, Qiu Y, Zheng
X, Qi X, Cao Y, Su M, Wang X, et al: Serum and urine metabolite
profiling reveals potential biomarkers of human hepatocellular
carcinoma. Mol Cell Proteomics. 10:M110.0049452011. View Article : Google Scholar : PubMed/NCBI
|
|
12
|
Singal AK and Kamath PS: Model for
end-stage liver disease. J Clin Exp Hepatol. 3:50–60. 2013.
View Article : Google Scholar : PubMed/NCBI
|
|
13
|
Kamath PS and Kim WR; Advanced Liver
Disease Study Group, : The model for end-stage liver disease
(MELD). Hepatology. 45:797–805. 2007. View Article : Google Scholar : PubMed/NCBI
|
|
14
|
Wiesner R, Edwards E, Freeman R, Harper A,
Kim R, Kamath P, Kremers W, Lake J, Howard T, Merion RM, et al:
Model for end-stage liver disease (MELD) and allocation of donor
livers. Gastroenterology. 124:91–96. 2003. View Article : Google Scholar : PubMed/NCBI
|
|
15
|
Krautbauer S and Liebisch G: LC-MS/MS
analysis of bile acids. Methods Mol Biol. 1730:103–110. 2018.
View Article : Google Scholar : PubMed/NCBI
|
|
16
|
Chong J, Yamamoto M and Xia J:
MetaboAnalystR 2.0: From raw spectra to biological insights.
Metabolites. 9(pii): E572019. View Article : Google Scholar : PubMed/NCBI
|
|
17
|
Mannes GA, Thieme C, Stellaard F, Wang T,
Sauerbruch T and Paumgartner G: Prognostic significance of serum
bile acids in cirrhosis. Hepatology. 6:50–53. 1986. View Article : Google Scholar : PubMed/NCBI
|
|
18
|
Ohkubo H, Okuda K, Iida S, Ohnishi K,
Ikawa S and Makino I: Role of portal and splenic vein shunts and
impaired hepatic extraction in the elevated serum bile acids in
liver cirrhosis. Gastroenterology. 86:514–520. 1984.PubMed/NCBI
|
|
19
|
Gilmore IT and Thompson RP: Plasma
clearance of oral and intravenous cholic acid in subjects with and
without chronic liver disease. Gut. 21:123–127. 1980. View Article : Google Scholar : PubMed/NCBI
|
|
20
|
Bajaj JS, Heuman DM, Hylemon PB, Sanyal
AJ, White MB, Monteith P, Noble NA, Unser AB, Daita K, Fisher AR,
et al: Altered profile of human gut microbiome is associated with
cirrhosis and its complications. J Hepatol. 60:940–947. 2014.
View Article : Google Scholar : PubMed/NCBI
|
|
21
|
Cassard AM and Ciocan D: Microbiota, a key
player in alcoholic liver disease. Clin Mol Hepatol. 24:100–107.
2018. View Article : Google Scholar : PubMed/NCBI
|
|
22
|
Martinot E, Sèdes L, Baptissart M,
Lobaccaro JM, Caira F, Beaudoin C and Volle DH: Bile acids and
their receptors. Mol Aspects Med. 56:2–9. 2017. View Article : Google Scholar : PubMed/NCBI
|
|
23
|
Massafra V and van Mil SWC: Farnesoid X
receptor: A ‘homeostat’ for hepatic nutrient metabolism. Biochim
Biophys Acta Mol Basis Dis. 1864:45–59. 2018. View Article : Google Scholar : PubMed/NCBI
|
|
24
|
Kim SG, Kim BK, Kim K and Fang S: Bile
acid nuclear receptor farnesoid X receptor: Therapeutic target for
nonalcoholic fatty liver disease. Endocrinol Metab (Seoul).
31:500–504. 2016. View Article : Google Scholar : PubMed/NCBI
|
|
25
|
Verbeke L, Farre R, Trebicka J, Komuta M,
Roskams T, Klein S, Elst IV, Windmolders P, Vanuytsel T, Nevens F
and Laleman W: Obeticholic acid, a farnesoid X receptor agonist,
improves portal hypertension by two distinct pathways in cirrhotic
rats. Hepatology. 59:2286–2298. 2014. View Article : Google Scholar : PubMed/NCBI
|
|
26
|
Kakiyama G, Pandak WM, Gillevet PM,
Hylemon PB, Heuman DM, Daita K, Takei H, Muto A, Nittono H, Ridlon
JM, et al: Modulation of the fecal bile acid profile by gut
microbiota in cirrhosis. J Hepatol. 58:949–955. 2013. View Article : Google Scholar : PubMed/NCBI
|
|
27
|
Lorenzo-Zúñiga V, Bartolí R, Planas R,
Hofmann AF, Viñado B, Hagey LR, Hernández JM, Mañé J, Alvarez MA,
Ausina V and Gassull MA: Oral bile acids reduce bacterial
overgrowth, bacterial translocation, and endotoxemia in cirrhotic
rats. Hepatology. 37:551–557. 2003. View Article : Google Scholar : PubMed/NCBI
|
|
28
|
Seo YS and Shah VH: The role of gut-liver
axis in the pathogenesis of liver cirrhosis and portal
hypertension. Clin Mol Hepatol. 18:337–346. 2012. View Article : Google Scholar : PubMed/NCBI
|
|
29
|
Marin JJ, Macias RI, Briz O, Banales JM
and Monte MJ: Bile acids in physiology, pathology and pharmacology.
Curr Drug Metab. 17:4–29. 2015. View Article : Google Scholar : PubMed/NCBI
|
|
30
|
Gadaleta RM, van Mil SW, Oldenburg B,
Siersema PD, Klomp LW and Van Erpecum KJ: Bile acids and their
nuclear receptor FXR: Relevance for hepatobiliary and
gastrointestinal disease. Biochim Biophys Acta. 1801:683–692. 2010.
View Article : Google Scholar : PubMed/NCBI
|
|
31
|
Nuño-Lámbarri N, Barbero-Becerra VJ, Uribe
M and Chávez-Tapia NC: Elevated cholesterol levels have a poor
prognosis in a cholestasis scenario. J Biochem Mol Toxicol. 31:1–6.
2017. View Article : Google Scholar
|
|
32
|
Gong Z, Zhou J, Zhao S, Tian C, Wang P, Xu
C, Chen Y, Cai W and Wu J: Chenodeoxycholic acid activates NLRP3
inflammasome and contributes to cholestatic liver fibrosis.
Oncotarget. 7:83951–83963. 2016. View Article : Google Scholar : PubMed/NCBI
|
|
33
|
Tripodi V, Contin M, Fernández MA and
Lemberg A: Bile acids content in brain of common duct ligated rats.
Ann Hepatol. 11:930–934. 2012. View Article : Google Scholar : PubMed/NCBI
|
|
34
|
Horvatits T, Drolz A, Rutter K, Roedl K,
Fauler G, Müller C, Kluge S, Trauner M, Schenk P and Fuhrmann V:
Serum bile acids in patients with hepatopulmonary syndrome. Z
Gastroenterol. 55:361–367. 2017.PubMed/NCBI
|
|
35
|
Desai MS, Mathur B, Eblimit Z, Vasquez H,
Taegtmeyer H, Karpen SJ, Penny DJ, Moore DD and Anakk S: Bile acid
excess induces cardiomyopathy and metabolic dysfunctions in the
heart. Hepatology. 65:189–201. 2017. View Article : Google Scholar : PubMed/NCBI
|
|
36
|
Pak JM and Lee SS: Vasoactive effects of
bile salts in cirrhotic rats: In vivo and in vitro studies.
Hepatology. 18:1175–1181. 1993. View Article : Google Scholar : PubMed/NCBI
|
|
37
|
Desai MS and Penny DJ: Bile acids induce
arrhythmias: Old metabolite, new tricks. Heart. 99:1629–1630. 2013.
View Article : Google Scholar : PubMed/NCBI
|
|
38
|
Cherqui D, Laurent A, Tayar C, Chang S,
Van Nhieu JT, Loriau J, Karoui M, Duvoux C, Dhumeaux D and Fagniez
PL: Laparoscopic liver resection for peripheral hepatocellular
carcinoma in patients with chronic liver disease: Midterm results
and perspectives. Ann Surg. 243:499–506. 2006. View Article : Google Scholar : PubMed/NCBI
|
|
39
|
Fan M, Wang X, Xu G, Yan Q and Huang W:
Bile acid signaling and liver regeneration. Biochim Biophys Acta.
1849:196–200. 2015. View Article : Google Scholar : PubMed/NCBI
|
|
40
|
Altamirano-Barrera A, Uribe M, Lammert F
and Méndez-Sánchez N: Bile acids and the risk for hepatocellular
carcinoma in primary biliary cholangitis. Ann Hepatol. 15:453–454.
2016. View Article : Google Scholar : PubMed/NCBI
|
|
41
|
Xie G, Wang X, Huang F, Zhao A, Chen W,
Yan J, Zhang Y, Lei S, Ge K, Zheng X, et al: Dysregulated hepatic
bile acids collaboratively promote liver carcinogenesis. Int J
Cancer. 139:1764–1775. 2016. View Article : Google Scholar : PubMed/NCBI
|