Introduction
Esophageal variceal bleeding is a life-threatening
complication of cirrhotic portal hypertension (1). According to LaPlace's law of fluid
mechanics: Tension of the blood vessel wall=(intravascular
pressure-extravascular pressure) × blood vessel diameter/blood
vessel thickness. The intravascular pressure is the root factor for
esophageal variceal bleeding and is directly associated with portal
pressure. Therefore, variceal pressure serves a crucial role in
predicting variceal bleeding and evaluating the effect of drug
therapy for portal hypertension (2).
Regularly measuring varicose pressure is imperative for patients
with cirrhosis. Variceal pressure is currently detected by directly
puncturing the varix with a fine needle; however, it is necessary
to improve on the methods presently available as they are
associated with a high risk of bleeding due to the level of
invasiveness. Numerous clinical trials have been conducted in order
to investigate measurement techniques that are less invasive, or
are even non-invasive, however, the risk of bleeding remains a
possibility for these measurements (3–8). A
previous research group developed a novel device, termed an
endoscopic fiber-optic pressure sensor (9). Compared with traditional pressure
sensors, this device uses the theory of fluid conduction pressure
(Pascal's law) and a computer workstation (i.e. a data processing
terminal) to perform the analysis, and the device processes and
creates a graphical display of the pressure grating signal. The
investigators herein observed that the device was more convenient
than conventional methods, as it can be placed over the varix
through an endoscopic biopsy channel. It was hypothesized that the
endoscopic fiber-optic pressure sensor can effectively predict the
risk of variceal bleeding. Therefore, the present prospective study
focused on the accuracy of fiber-optic pressure sensor in
vitro and investigated the clinical reliability and feasibility
of this method by comparing the results of variceal pressure
measured using the fiber-optic pressure sensor and the PPG.
Materials and methods
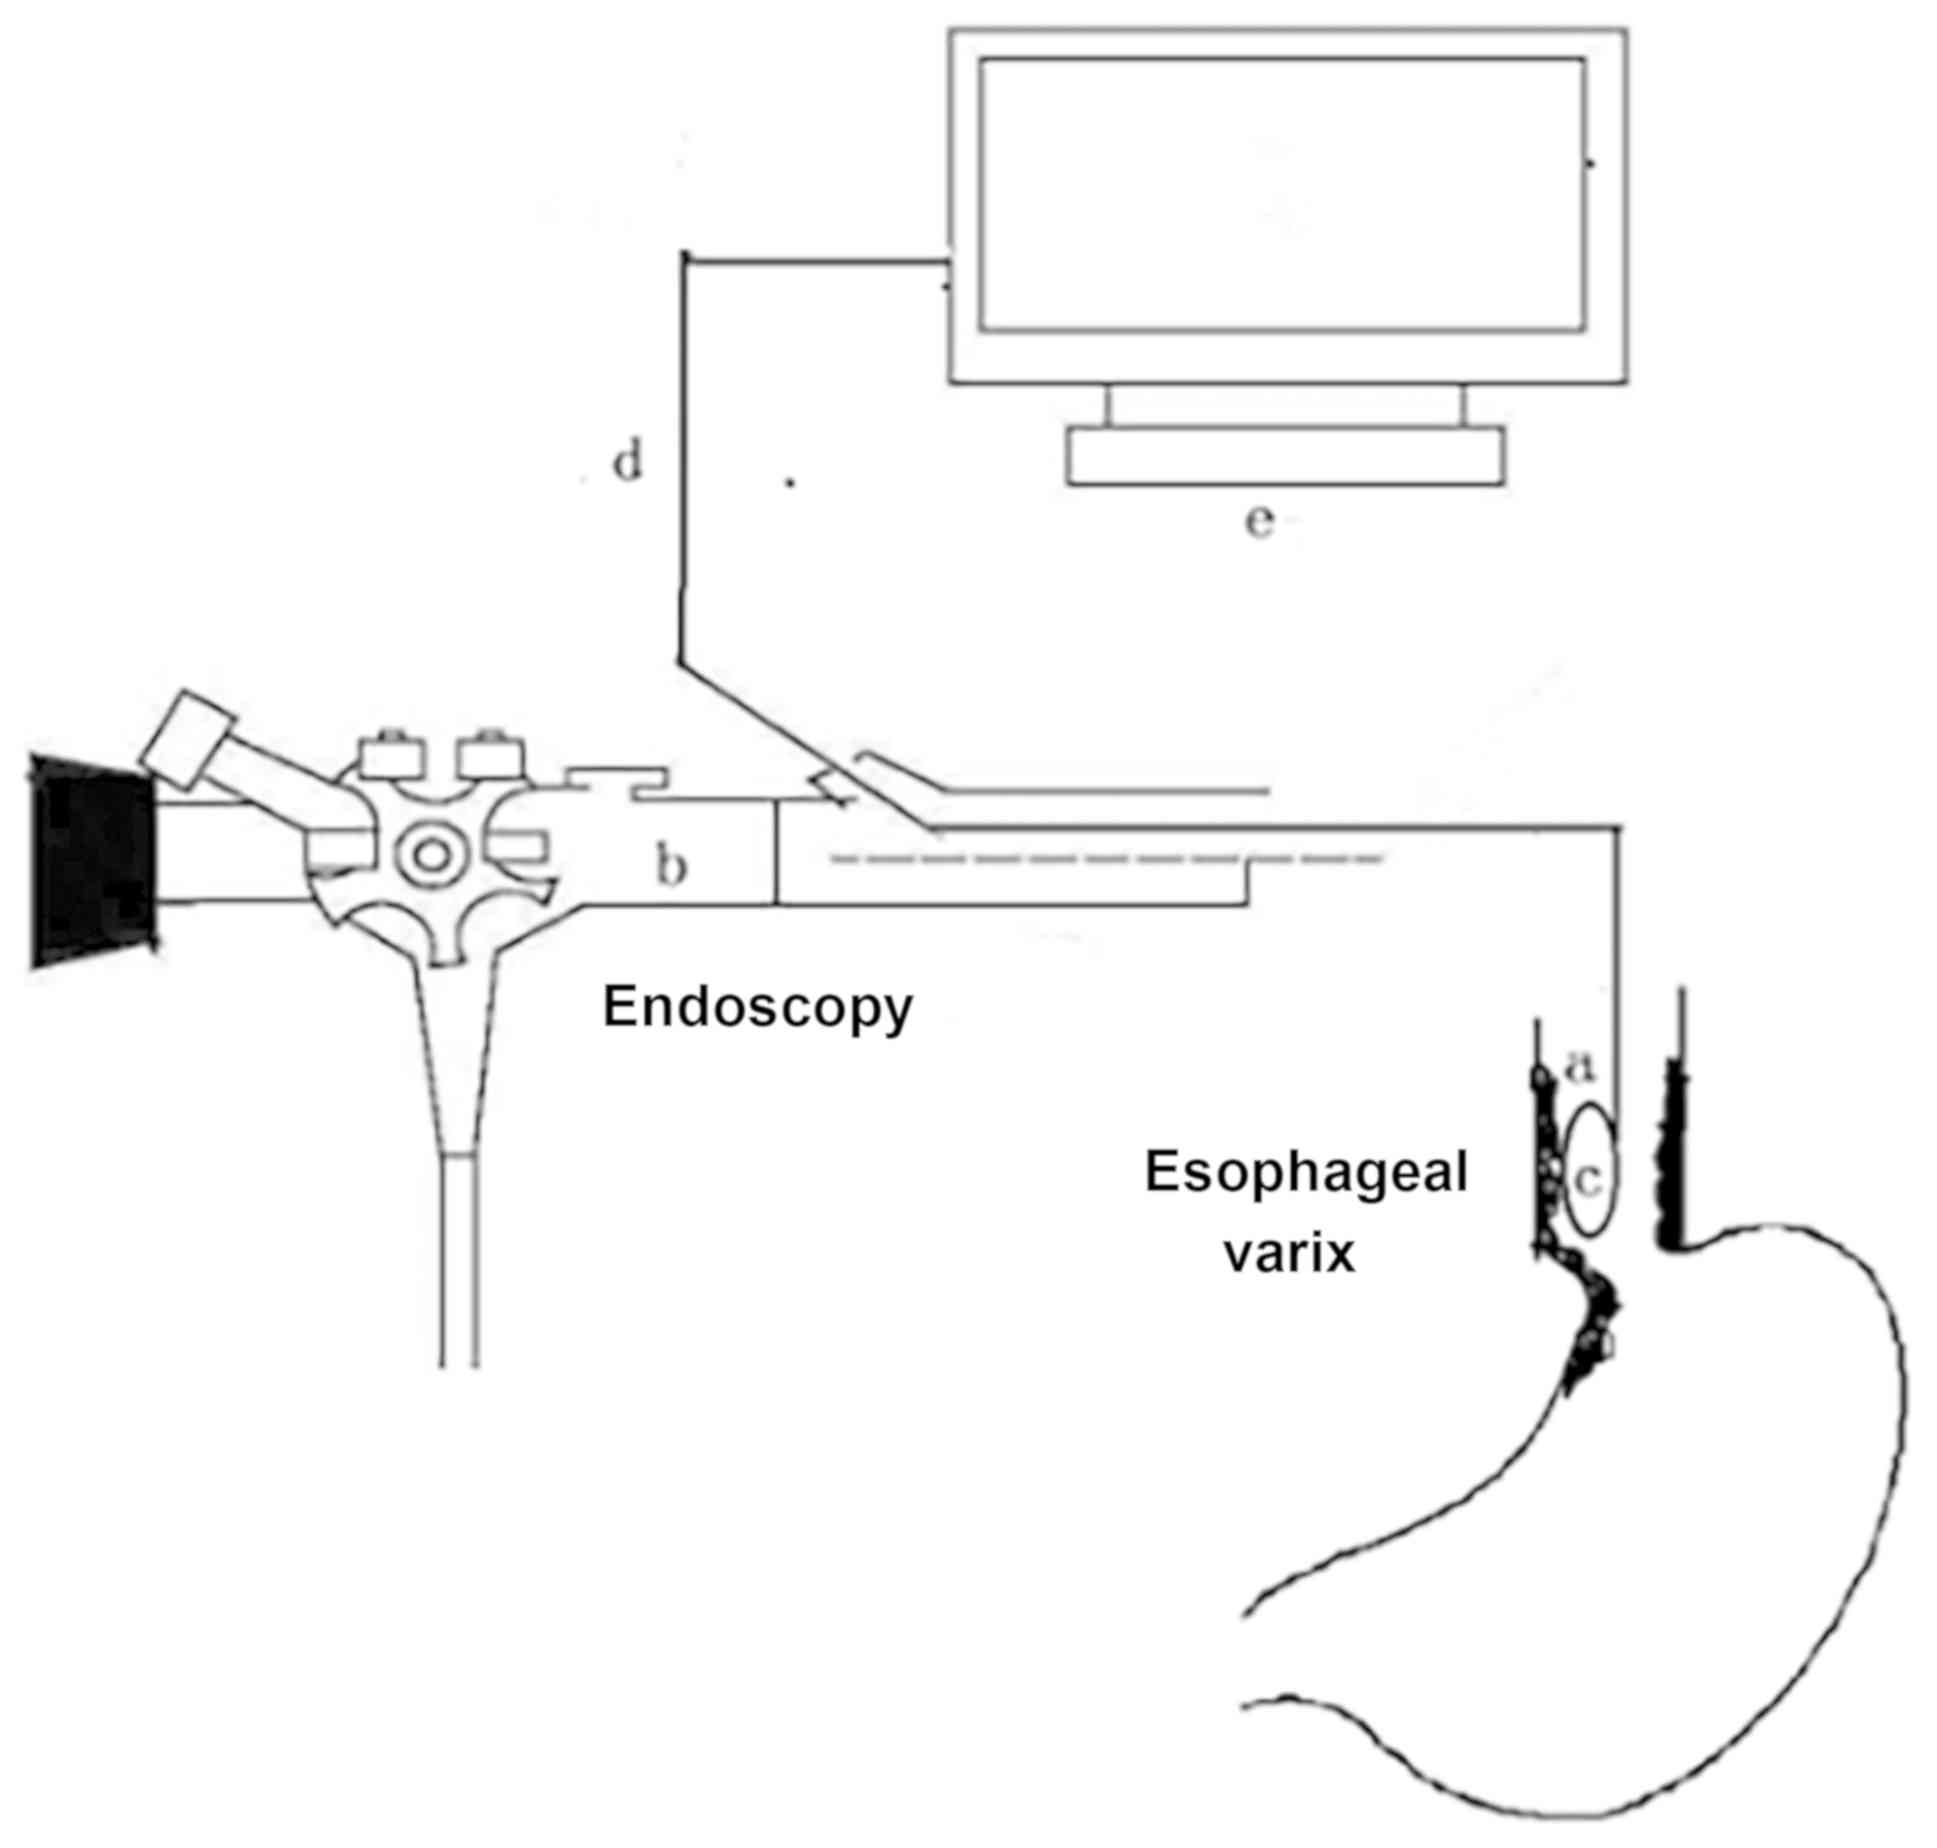
In order to measure varicose vein pressure with a
fiber-optic pressure sensor in the present study, a measuring
device was designed consisting of a probe, optical fiber and a
measurement workstation. The device was based on a fiber-optic
pressure sensor, was designed and constructed by Jiuhong Medical
Instrument Co. Ltd. (Changzhou, China), and consisted of a
pressure-sensitive probe comprised of a fiber-optic pressure sensor
(FOP-F125, FISO Technologies, Inc., Quebec, QC, Canada) and
workstation to record the pressure tracing. The fiber-optic probe
was inserted through the biopsy channel of an endoscope when the
endoscope reached the distal end of the esophagus. The operation
method is illustrated in Fig. 1.
Basic structure and detection
principle of the probe
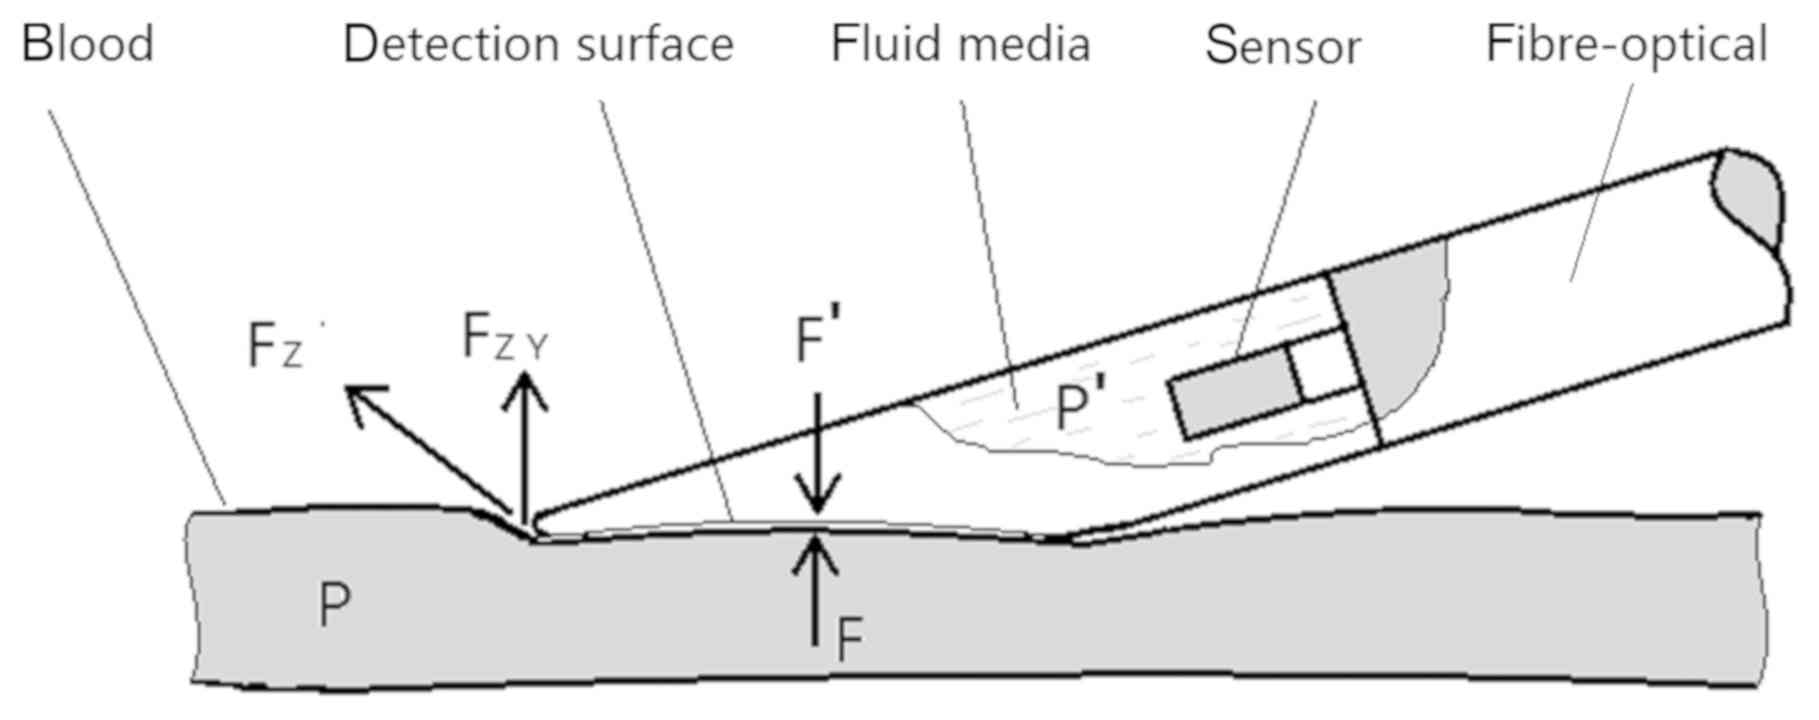
The probe consisted of a rigid cylindrical, sealed
cavity with a wedge-shaped front end. The wedge plane uses a thin
membrane to form a detection surface, and the cavity is equipped
with a fiber-optic pressure sensor and fluid medium. The external
pressure perceived from the detection surface is transmitted to the
sensor through the fluid medium, and the pressure variable is then
transformed into a grating signal by the sensor and is transmitted
to the workstation interface through the optical fiber (9,10).
When the probe detection surface is fitted to the
outer wall of the blood vessel in which pressure is being measured,
stress deformation of the detection surface occurs, and along with
the filling shape of the outer wall of the vessel (the outward
convex surface). The detection surface then deforms inwards. When
deformation of the fitted interface remains static, the blood
pressure in the vessel will be equal to the fluid pressure in the
probe, thus the blood pressure is detected. Pressure analysis
during measurement is illustrated in Fig. 2.
There is: FZY=Sinθ FZ
Where FZ is the surface tension of the blood vessel
when the probe was pressed againt the blood vessel. The direction
of FZ is parallel to the axis of the blood vessel. FZY is the
component of FZ in the Y direction and the value of FZY depends on
θ. θ is the angle between FZ and the surface of probe detection.
The measurement process used by the probe is via internal stress
transfer. When the probe reaches and presses the outer wall of the
blood vessel, the detection membrane of the probe and the outer
wall of the blood vessel deform to the interface in a natural state
of static balance. According to Newton's law, the force acting on a
body at rest is equal to the reaction force: F′=−F + ∑FZY. As FZY
is smaller than F, then F′≈-F. Simultaneously, the correlation area
(S) between the probe membrane and the outer wall of the blood
vessel is equal. According to P=(F/S), it can be deduced that p′≈p.
Therefore, the fluid medium pressure (p′) in the probe is almost
equal to the blood pressure (p). This process can be further
explained by quantitative analysis.
According to Pascal's law, P=ρgh, and the fluid
density formula, ρ=(m/v), the following relation can be derived:
P=ρgh=(m/v)gh. Where p, is the particle pressure in the probe; g is
the acceleration of gravity; h is the depth of the particle in the
probe (the height of the particle from the natural plane of the
fluid); ρ is the density of the fluid medium; m is the mass of the
fluid medium and v is the volume of the fluid medium (the probe
chamber space).
As the probe cavity is small, the influence of
gravity acceleration (g) and particle depth (h) on the measurement
process is not considered; i.e. gh is considered to be a physical
constant.
When the surface of the probe attached to the outer
wall of the blood vessel is deformed by the stress at the surface
caused by the internal pressure of the blood vessel, this
culminates in depression and deformation of the probe surface,
which causes the space of the probe cavity to shrink. This small
change and the variation of the fluid pressure in the probe can be
derived by differentiating the upper form: (δp/δv)=(p)′=[(m/v)
gh]′= -mgh (1/v2).
The deformation of the probe surface is only
affected by the internal pressure of the blood vessel and is
theoretically unaffected by other external forces, such as those
applied at the time of fitting. Any marginal change in the cavity
space caused by deformation of the probe surface causes a
mathematical correlation difference to the particle pressure of the
fluid medium. According to the principle of fluid isotropy, the
particle pressure perceived by the sensor in the probe is equal to
that of any particle pressure in the detection surface.
Detection process
The detection process began with inserting the probe
into the endoscope channel and guiding it to the detection site
using an endoscope. The second step was to set the output level of
the display terminal of the workstation to zero and enter the
measurement state. The probe was then moved closer to the outer
wall of the blood vessel so that the detection surface and the
outer surface of the blood vessel were parallel, and pressure was
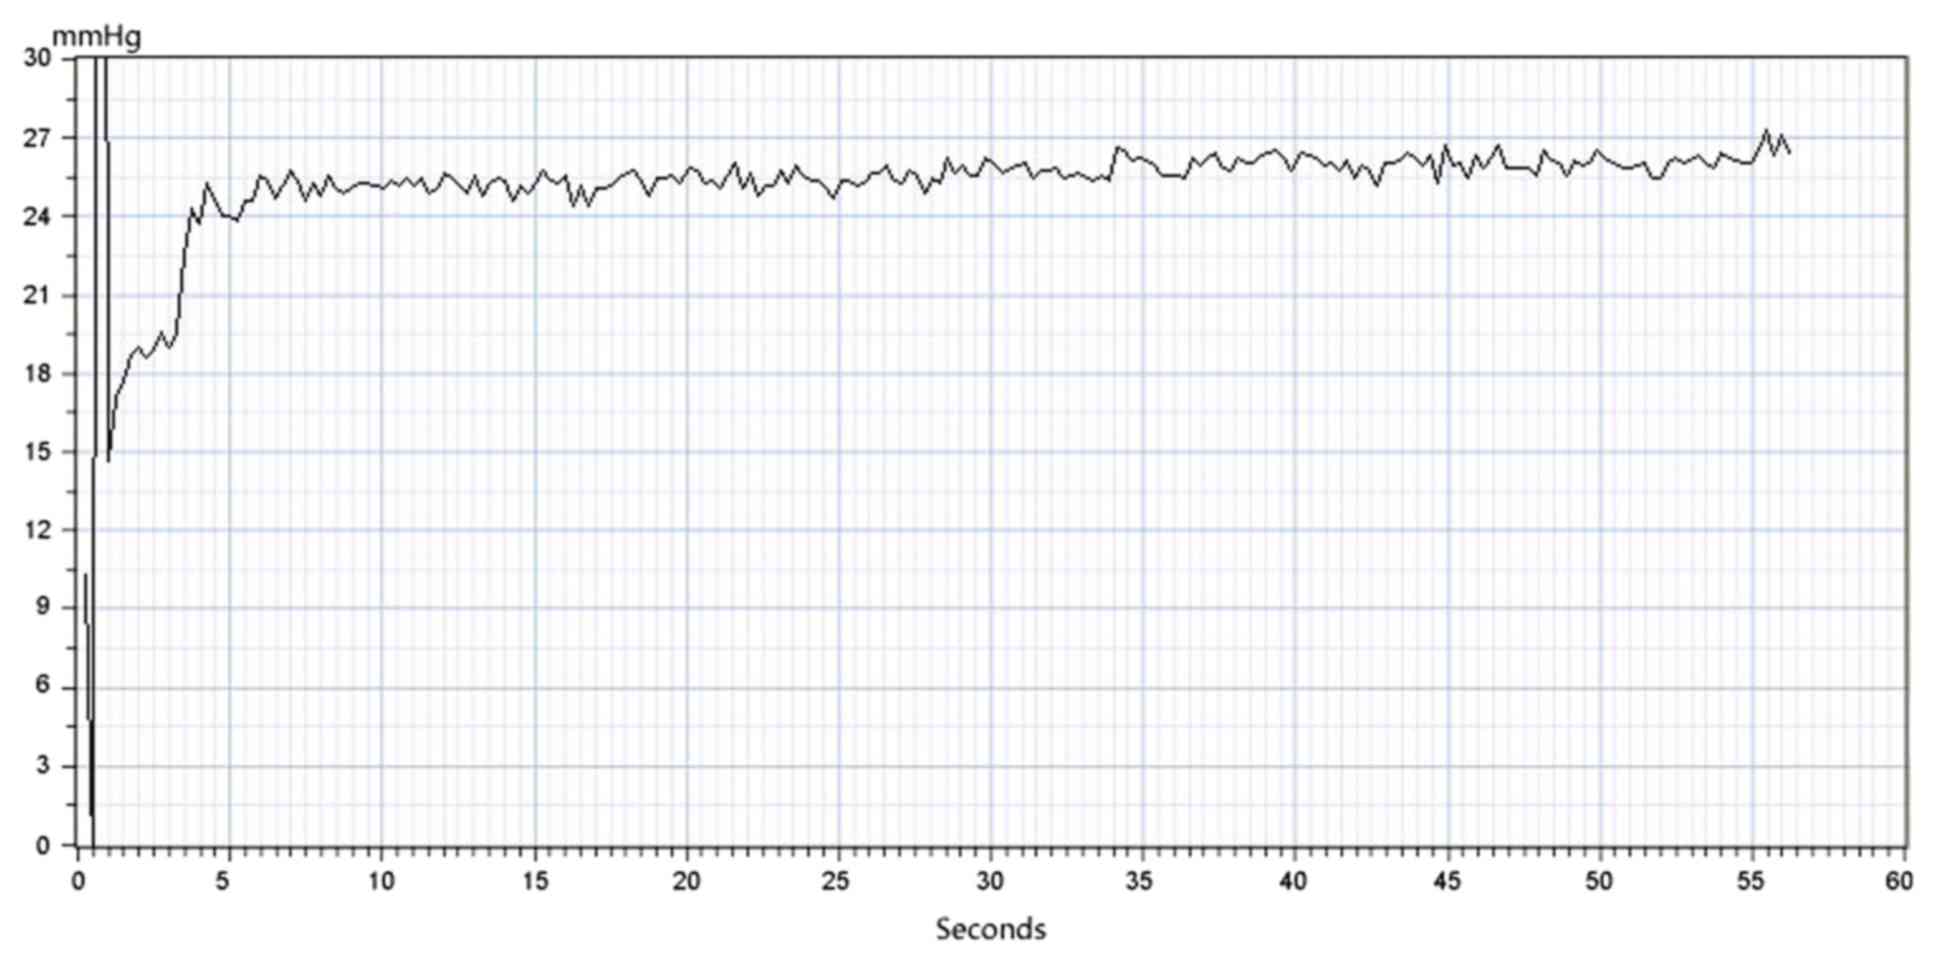
gradually applied. The pressure curve and value in the display
require monitoring; when the value is stable, that is, when the
curve fluctuation slows down and the plateau wave peak appears, the
value is the real-time pressure value. During the measurement
procedure, as long as the probe surface and the surface of the
outer wall of the blood vessel are smoothly fitted, the magnitude
of the press pressure will not cause abnormal fluctuation of the
force curve. All measured data were saved in the workstation. The
force curve in the display is presented in Fig. 3.
Clinical investigation
Between December 2013 and December 2015, the device
was used to assess patients with cirrhosis who were scheduled to
receive a transjugular intrahepatic stent-shunt (TIPS). All
patients had cirrhosis with a history of episodes of esophageal
variceal bleeding and presented with large esophageal varices (F2,
F3) on endoscopy. The exclusion criteria were total portal vein
thrombosis, previous endoscopic treatment of varices (sclerotherapy
or endoscopic band ligation) to prevent any additional bleeding,
isolated gastric or ectopic varices, previous surgical
portosystemic shunt or TIPS, hepatocellular carcinoma or other
malignancies, severe clotting defects and grade III or IV hepatic
encephalopathy.
A total of 93 eligible patients were enrolled in the
present study; 13 patients did not participate resulting in a total
of 80 patients. A total of 64 patients suffered from hepatitis B or
C. In accordance with the Japanese Research Society for Portal
Hypertension (11), the degree of
varices in the present study were set at F2 (n=22) or F3 (n=58).
The patient characteristics are listed in Table I. The diagnosis of cirrhosis was
obtained on the grounds of clinical history, laboratory testing,
imaging examinations and an endoscopy.
 | Table I.Demographic and clinic profile of the
study population. |
Table I.
Demographic and clinic profile of the
study population.
| Characteristic | n (%) |
|---|
| Total patients | 80 |
| Age (years) | 50.9±10.9 |
| Sex |
|
| Male | 61 (76.2) |
|
Female | 19 (23.8) |
| Etiology |
|
|
Viral | 64 (80) |
|
Alcohol | 2 (2.5) |
| Primary
biliary cirrhosis | 3 (3.8) |
|
Other | 11 (13.7) |
| Child-Pugh score |
|
| A | 15 (18.8) |
| B | 46 (57.4) |
| C | 19 (23.8) |
| Varix grade |
|
| F2 | 22 (27.5) |
| F3 | 58 (72.5) |
| Variceal
pressure (mm Hg) | 14.2±2.2 |
| PPG (mm
Hg) | 28.0±4.7 |
In order to avoid the artifacts caused by esophageal
peristalsis, preoperative preparation (diazepam 5 mg; butylbromide
scopolamine 20 mg) was required. The aforementioned device was used
to measure variceal pressure. The largest varix located above the
cardia was detected, once the probe was placed at the distal
esophagus through the endoscopic biopsy channel. In order to
acquire a stable variceal pressure tracing, the probe was applied
over the largest varix for 5 sec during the intermission of two
peristaltic waves.
The criteria required for a sustained satisfactory
measurement included a zero-pressure point and a stable variceal
pressure tracing for at least 5 sec, with the probe applied over
the varix under direct visual control. A pressure point of zero was
defined as the atmospheric pressure in the esophagus and prior to
each measurement, the starting pressure was adjusted to zero. In
addition to the above criteria, satisfactory variceal pressure
measurements were also required to meet the following predetermined
criteria: i) Absence of artifacts caused by esophageal contractions
and ii) correct placement of the probe over the varix. The mean
value of five satisfactory measurements was used to determine the
variceal pressure. In order to eliminate observer bias, the
variceal pressure was measured by two independent observers. The
mean of five satisfactory measurements from each observer was used
to determine the mean variceal pressure of every patient and ensure
intra- and inter-observer agreement.
TIPS was performed within 24 h after variceal
pressure measurement. The technique approach was as described in a
previous publication (9). A A7F
pigtail catheter was introduced into the inferior vena cava under
fluoroscopic guidance. The free hepatic venous pressure (FHVP) was
recorded when the tip of the catheter floated at the junction of
the hepatic vein and the inferior vena cava. The portal vein
pressure (PVP) was measured when the portal venous was punctured
under the guiding of digital subtraction angiography using the RUPS
100set (RUPS-100, Cook Inc., Bloomington, IL, USA). The PPG
resulted from the difference between the PVP and FHVP in the
occluded TIPS condition. To ensure that PPG measurements were
satisfactory, the pressure tracings remained stable for at least 30
sec. The mid-chest was used as the external zero reference.
Following placement of an 8-mm stent (BARD, Luminexx, Voisins le
Bretonneux, France) to generate the TIPS, the PPG of the open TIPS
condition was recorded, and the second variceal pressure
measurement was recorded following the TIPS procedure.
Statistical analysis
Quantitative data are presented as the mean ±
standard deviation. Significant differences between the control and
treated groups were determined using an unpaired Student's t-test.
Inter-observer correlation was analyzed using Pearson's correlation
coefficient and intra-observer correlation was analyzed using the
intraclass correlation coefficient. All analyses were conducted
using SPSS 16.0 software (SPSS, Inc., Chicago, IL, USA). P<0.05
was considered to indicate a statistically significant
difference.
Results
The esophageal variceal pressure results of the
patients were obtained successfully and there were no
intraoperative or postoperative complications, including bleeding.
Although the accuracy of results was affected by esophageal
peristalsis or additional esophageal peristalsis created by
breathing and coughing, this effect could be minimized by sedation,
antispasmodic and sizing the intermission between two peristaltic
waves in future studies.
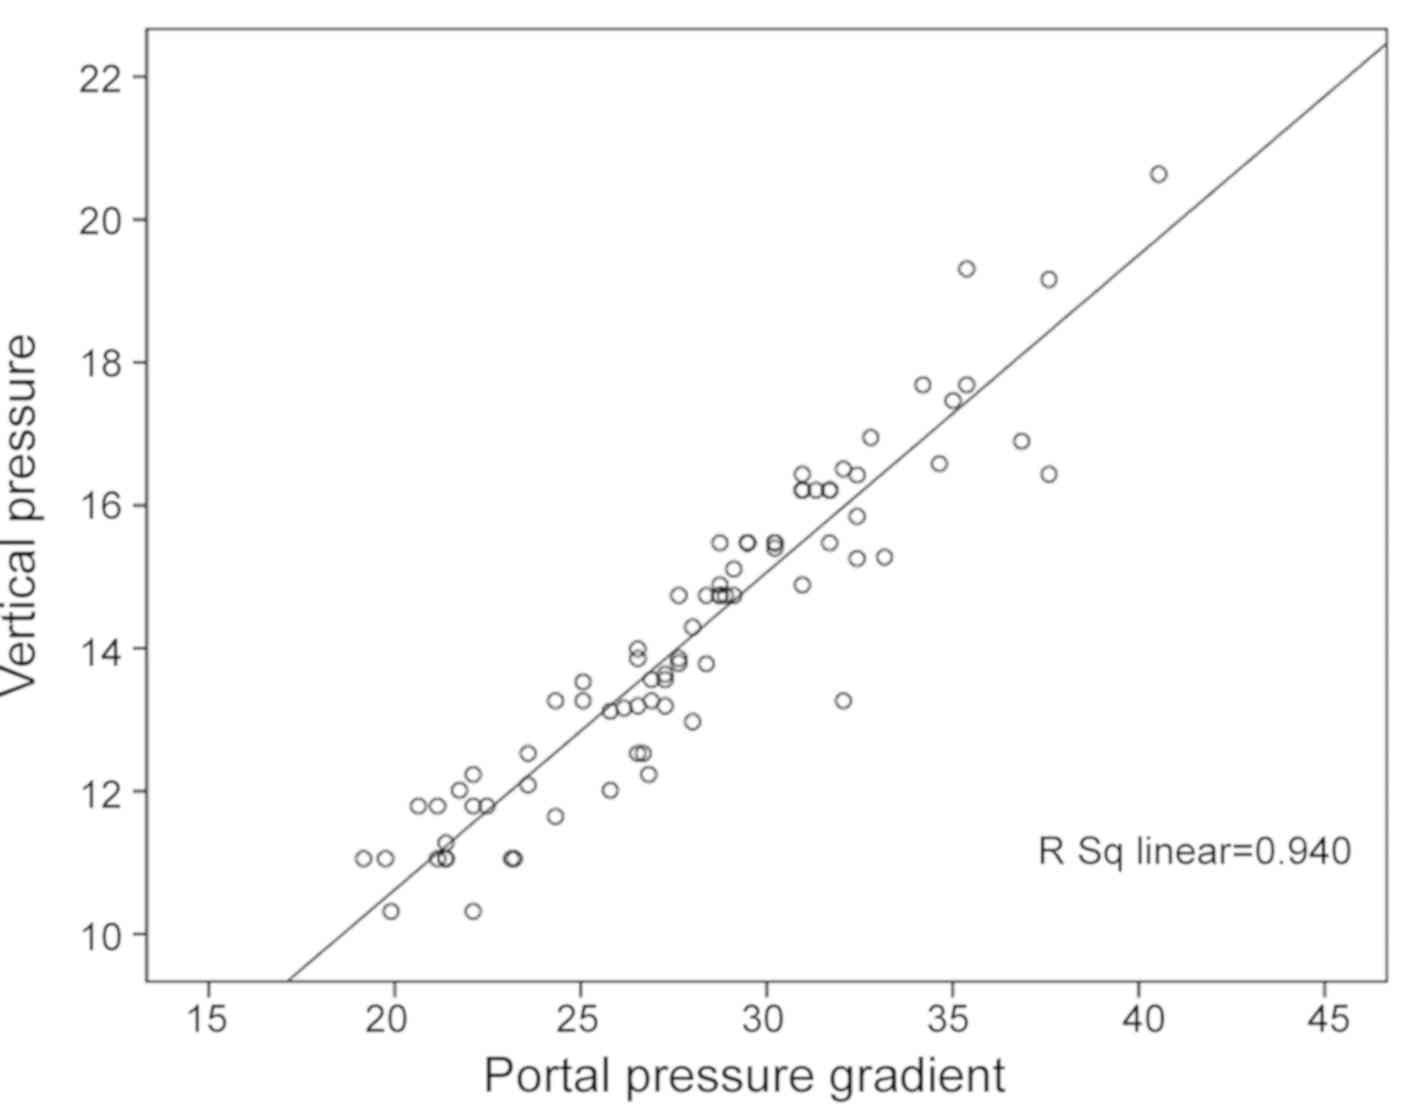
The mean variceal pressure value of the 80 patients
included in the present study was 14.2±2.2 mmHg, and the mean PPG
value was 28.0±4.7 mmHg. There was a linear correlation between the
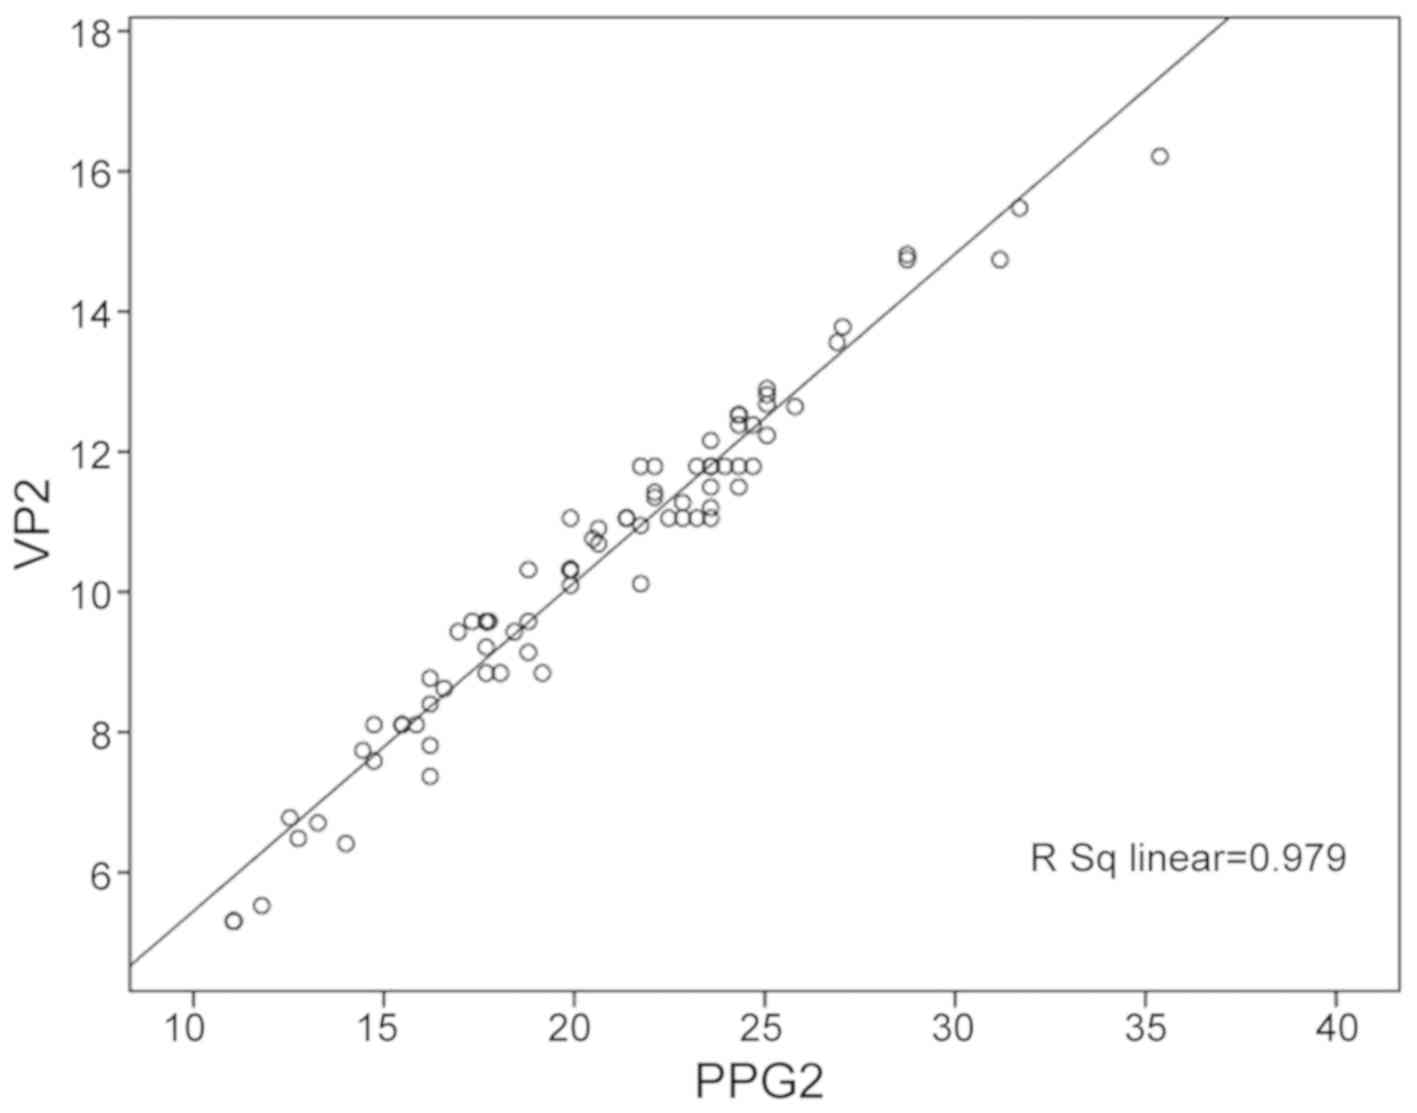
variceal pressure and PPG values (r=0.940, P<0.001, Fig. 4). The PPG values were higher than the
variceal pressure values (t=23.86, P<0.001). In addition, there
was an association between the PPG and variceal pressure in open
TIPS conditions (20.7±4.8 and 10.5±2.3 mmHg, respectively, r=0.979,
P<0.001, Fig. 5). The PPG values
were higher than the variceal pressure values (t=17.15,
P<0.001). Intra- and inter-observer agreement was determined by
the correlation coefficient. The intra-observer correlation for
variceal pressure measurements was 0.94, and the inter-observer
correlation for variceal pressure measurements was 0.96.
Discussion
It is well-established that variceal pressure exerts
a pivotal function in predicting variceal bleeding and is
imperative when assessing the effect of portal hypertension
pharmacotherapy. There are various techniques to measure variceal
pressure; one is by directly puncturing the varix with a thin
needle, whereas other methods involve using non-invasive
techniques. The application of the former is restricted due to the
high risk of variceal bleeding, therefore, the present study
investigated a fiber-optic pressure sensor as a novel non-invasive
technique to measure variceal pressure. The results of the present
study indicated that this technique can predict the risk of
bleeding in patients with liver cirrhosis and may also be used to
monitor drug efficacy. Screening for high-risk patients with
cirrhosis of the liver would assist in providing individualized
treatment strategies for patients with cirrhosis and in developing
a standardized treatment. Therefore, the present study evaluated
the accuracy and reproducibility of a fiber-optic pressure sensor,
to measure its suitability in a clinical setting.
The level of portal hypertension is an important
indicator of the development of variceal bleeding, and portal
hypertension is generally evaluated by determining the hepatic
venous pressure gradient (HVPG) (12). However, measuring the HVPG is
invasive and inconvenient, which has limited its applications as a
routine method. Approaches that aim to assess variceal pressure
using non-invasive techniques may provide a reasonable alternative
method to HPVG. As HVPG is closely associated with variceal
pressure, measuring the variceal pressure should provide an
accurate evaluation of the HVPG. Previous studies have demonstrated
that the measurement of variceal pressure using non-invasive
techniques was positively correlated with those measured by direct
puncture and HVPG (13,14). In order to examine the reliability of
the device based on a fiber-optic pressure sensor, the present
study used the PPG, which was measured directly by the
catheterization of portal veins undergoing TIPS in patients with
cirrhosis as a reference control. A correlation was observed
between the variceal pressure measured using the device and PPG,
and a good positive correlation was identified between them.
Therefore, measuring variceal pressure using the device enabled
evaluation of the degree of portal hypertension in a non-invasive
and convenient manner.
The measurement of variceal pressure in the present
study was technically satisfactory in 78 patients. The high rate of
success in measurement was due to the small measuring surface of
the fiber-optic pressure sensor ensuring its suitability for
measuring variceal pressure in varices of small size. Good and
steady contact between the fiber-optic pressure sensor and the
varices enabled a stable tracing of variceal pressure to be
obtained
The results of the present study demonstrated that
the measurement of variceal pressure based on a fiber-optic
pressure sensor required only short-term training under
gastrointestinal endoscopy. As with a biopsy, the fiber-optic
pressure sensor can be easily applied over any esophageal varix
through the endoscopic working channel described in our previous
study (10). The pressure tracing on
the device in vivo was characterized by a sharp upstroke and
stable plateau phase.
In the present study, it was observed that variceal
pressure was significantly correlated with portal pressure, and
intra-observer and inter-observer agreement in the measurement of
variceal pressure was good. As hypothesized, the present study also
demonstrated that variceal pressure was significantly lower than
PPG, potentially as a result of the significant resistance in
venous circulation in collateral vessels. It has been stated
previously that 6 mmHg in esophageal varices is 312 mmHg
in HVPG, owning to the extra pressure scatters in palisade
esophageal varices (8).
To the best of our knowledge, the device constructed
herein has the smallest gauge for measuring variceal pressure,
which can pass through the working channel of a standard endoscope.
In addition, the small measuring surface makes the device suitable
for measuring variceal pressure in small-radius vessels. However,
in the present study, the measurement of variceal pressure was not
satisfactory in two patients due to poor contact between the device
and the varix. In a previous study, Bosch et al (15) first introduced a pressure gauge fixed
to the tip of an endoscope for measuring variceal pressure. The
pressure gauge consisted of a small chamber covered by a thin latex
membrane, which was perfused with a constant flow of nitrogen.
According to Newtonian force balance equations, it is expected that
when the gauge is applied over the varix, the pressure required to
perfuse the gauge measured by a sensitive pressure transducer is
equivalent to the pressure inside the varix. Using an in
vitro experiment, the accuracy and reproducibility of the
Varipress were considered satisfactory. However, limitations of
this technique have been reported in varices of a small size. In
addition, the reliability of the Varipress in vivo remains
controversial, as ideal placement of the gauge on the varix may be
difficult and patient-dependent factors may influence variceal
pressure measurements. It was estimated that ~25% of patients
initially scheduled for variceal pressure measurements must be
excluded due to poor contact between the gauge and the varices that
result in unstable pressure values, particularly for varices of a
small size (4,16,17).
As the fiber-optic pressure sensor device often
suffers from thermal stability issues, the variceal pressures
measured by the device are susceptible to influence from
circumstantial temperature. Prior to measuring variceal pressure,
the zero reference of the device must be set in order to
acclimatize to the temperature at the time. Another disadvantage of
this method is that in the dynamic process of observing the
varicose veins being indented, the human eye determines that the
varicose veins have been depressed; therefore, the pressure
measurement technique is dependent upon the observations of the
researcher administering the technique.
Despite the aforementioned limitations, the present
study provides support for the use of this novel device based on a
fiber-optic pressure sensor, owing to the fiber-optic pressure
sensor being more convenient than other non-invasive techniques and
having a short training period. Its accuracy is higher for small
size varices than those of other sizes. However, in order to
evaluate clinical applicability of the novel device, further
investigation is required in a larger study cohort. Taken together,
the results of the present study demonstrated that the device and
method investigated herein was accurate and precise for evaluating
the risk of variceal bleeding and efficacy of drug therapy, and was
reliable when detecting variceal pressure.
Acknowledgements
Not applicable.
Funding
The present study was supported by a grant from the
General Program of National Natural Science Foundation of China
(grant no. 81271736). The funders had no role in study design, data
collection and analysis, decision to publish or preparation of the
manuscript.
Availability of data and materials
The datasets used and/or analyzed during the present
study are available from the corresponding author on reasonable
request.
Authors' contributions
DK provided technical support and designed the
study. XW performed the experiments, collected and analyzed the
data and contributed substantially to revision of the manuscript.
HL and JW performed the experiments, collected and analyzed the
data and wrote the manuscript. AW provided detailed instructions on
the principle of the method and was involved in modification of the
methods. All authors hxave read and approved the final
manuscript.
Ethics approval and consent to
participate
The study protocol was authorized by the Ethics
Committee of Anhui Medical University (Hefei, China) and all
patients provided written informed consent prior to study
inclusion. The trial was registered with the Chinese Clinical Trial
Registry (A new device of fiber-optic pressure sensor for measuring
variceal pressure-ChiCTR1800016926 17/06/2018).
Patient consent for publication
Not applicable.
Competing interests
The authors declare that they have no competing
interests.
References
|
1
|
Scaglione S, Kliethermes S, Cao G, Shoham
D, Durazo R, Luke A and Volk ML: The epidemiology of cirrhosis in
the United States: A population-based study. J Clin Gastroenterol.
49:690–696. 2015. View Article : Google Scholar : PubMed/NCBI
|
|
2
|
Tandon RK and Saikia N: Measuring
intravariceal pressure. Gastrointest Endosc. 70:414–416. 2009.
View Article : Google Scholar : PubMed/NCBI
|
|
3
|
Palmer ED: On correlations between portal
venous pressure and the size and extent of esophageal varices in
portal cirrhosis. Ann Surg. 138:741–744. 1953. View Article : Google Scholar : PubMed/NCBI
|
|
4
|
Rigau J, Bosch J, Bordas JM, Navasa M,
Mastai R, Kravetz D, Bruix J, Feu F and Rodés J: Endoscopic
measurement of variceal pressure in cirrhosis: Correlation with
portal pressure and variceal hemorrhage. Gastroenterology.
96:873–880. 1989. View Article : Google Scholar : PubMed/NCBI
|
|
5
|
Gertsch PH and Meister JJ: Pressure
measurement in oesophageal varices: Preliminary report on a new
non-invasive method. Gut. 28:1162–1165. 1987. View Article : Google Scholar : PubMed/NCBI
|
|
6
|
Miller ES, Kim JK, Gandehok J, Hara M, Dai
Q, Malik A, Miller A and Miller L: A new device for measuring
esophageal variceal pressure. Gastrointest Endosc. 56:284–291.
2002. View Article : Google Scholar : PubMed/NCBI
|
|
7
|
Miller LS, Dai Q, Thomas A, Chung CY, Park
J, Irizarry S, Nguyen T, Thangada V, Miller ES and Kim JK: A new
ultrasound-guided esophageal variceal pressure-measuring device. Am
J Gastroenterol. 99:1267–1273. 2004. View Article : Google Scholar : PubMed/NCBI
|
|
8
|
Vegesna AK, Chung CY, Bajaj A, Tiwana MI,
Rishikesh R, Hamid I, Kalra A, Korimilli A, Patel S, Mamoon R, et
al: Minimally invasive measurement of esophageal variceal pressure
and wall tension (with video). Gastrointest Endosc. 70:407–413.
2009. View Article : Google Scholar : PubMed/NCBI
|
|
9
|
Kong DR, Xu JM, Zhang L, Zhang C, Fu ZQ,
He BB, Sun B and Xie Y: Computerized endoscopic balloon manometry
to detect esophageal variceal pressure. Endoscopy. 41:415–420.
2009. View Article : Google Scholar : PubMed/NCBI
|
|
10
|
Kong DR, He BB, Wu AJ, Wang JG, Yu FF and
Xu JM: Fiberoptic sensor for noninvasive measurement of variceal
pressure. Endoscopy 45 Suppl 2 UCTN. E55–E56. 2013.
|
|
11
|
Tajiri T, Yoshida H, Obara K, Onji M, Kage
M, Kitano S, Kokudo N, Kokubu S, Sakaida I, Sata M, et al: General
rules for recording endoscopic findings of esophagogastric varices
(2nd edition). Dig Endosc. 22:1–9. 2010. View Article : Google Scholar : PubMed/NCBI
|
|
12
|
Garcia-Tsao G, Abraldes JG, Berzigotti A
and Bosch J: Portal hypertensive bleeding in cirrhosis: Risk
stratification, diagnosis, and management: 2016 practice guidance
by the American Association for the study of liver diseases.
Hepatology. 65:310–335. 2017. View Article : Google Scholar : PubMed/NCBI
|
|
13
|
Watari A, Miyata K, Kanazawa H and
Kobayashi M: Comparison of portal pressure with intravascular
esophageal variceal pressure (IEVP) directly measured with a
flexible indwelling needle. Gastroenterol Jpn. 28:631–637. 1993.
View Article : Google Scholar : PubMed/NCBI
|
|
14
|
Gertsch P, Fischer G, Kleber G, Wheatley
AM, Geigenberger G and Sauerbruch T: Manometry of esophageal
varices: Comparison of an endoscopic balloon technique with needle
puncture. Gastroenterology. 105:1159–1166. 1993. View Article : Google Scholar : PubMed/NCBI
|
|
15
|
Bosch J, Bordas JM, Rigan J, Viola C,
Mastai R, Kravetz D, Navasa M and Rodés J: Noninvasive measurement
of the pressure of esophageal varices using an endoscopic gauge:
Comparison with measurements by variceal puncture in patients
undergoing endoscopic sclerotherapy. Gastroenterology. 6:667–672.
1986.
|
|
16
|
Polio J, Hanson J, Sikuler E, Vogel G,
Gusberg R, Fisher R and Groszmann RJ: Critical evaluation of a
pressure-sensitive capsule for measurement of esophageal varix
pressure. Studies in vitro and in canine mesenteric vessels.
Gastroenterology. 92:1109–1115. 1987. View Article : Google Scholar : PubMed/NCBI
|
|
17
|
Puckett JL, Liu J, Bhalla V, Kravetz D,
Krinsky ML, Hassanein T and Mittal RK: Ultrasound system to measure
esophageal varix pressure: An in vitro validation study. Am J
Physiol Gastrointest Liver Physiol. 288:G914–G919. 2005. View Article : Google Scholar : PubMed/NCBI
|