Introduction
Type 2 diabetes mellitus (T2DM), resulting from
insulin resistance and impaired β-cell function, constitutes a
major health problem throughout the world (1). Exploration of the underlying
pathological mechanisms and potential therapeutic targets for T2DM
is becoming increasingly important (2).
The liver is involved in glucose metabolism,
including gluconeogenesis, glycogenolysis, glycogenesis and insulin
extraction (3). Dysregulation of
glucose metabolism in the liver contributes to the development of
T2DM (4). Disruption in the process
of hepatic glucose release gives rise to insulin resistance or
diabetes and liver diseases may exacerbate insulin resistance by
disturbing the physiological effects of insulin on liver cells
(5). A previous study reported that
targeted inactivation of the hepatic insulin receptor gene resulted
in diabetes-like symptoms, demonstrating a direct involvement of
insulin regulation in liver metabolism (6). A further study also revealed that
selective inactivation of insulin to disrupt hepatic glucose
release and fatty acid synthesis led to insulin resistance in the
liver, further corroborating that the liver is a significant target
for the effect of insulin (7).
Impaired fatty acid metabolism in the liver also causes the
development of T2DM (8–10). In addition, a clinical study revealed
an elevated incidence of newonset diabetes when patients received
liver grafts with steatosis, which is strongly linked to hepatic
insulin resistance (11).
Genomic data relevant to various diseases are
archived in public repositories that are easily accessed to obtain
meaningful information and to make novel discoveries (12). Searching in public repositories has
been widely applied to investigate the pathology of T2DM, including
the identification of underlying pathways and coexpression networks
in islets of patients with T2DM (13–15). The
gene expression in the liver of a T2DM mouse model has also been
analyzed (16). However, to the best
of our knowledge, differentially expressed genes (DEGs) in the
liver of T2DM patients vs. subjects with normal glucose tolerance
(NGT) have remained to be identified. Therefore, the mechanisms
underlying the putative hepatic pathology of T2DM remain to be
explored.
In the present study, hepatic DEGs in subjects with
T2DM vs. NGT were identified, and subsequently, functional
enrichment analysis was performed. A protein-protein interaction
(PPI) network was also built to identify hub genes. The results of
the present study may contribute towards the elucidation of the
hepatic pathology of T2DM.
Materials and methods
Microarray data
A gene expression profile (accession no. GSE23343)
was obtained from the Gene Expression Omnibus (GEO; http://www.ncbi.nlm.nih.gov/geo/). The GEO
database stores abundant highthroughput data, particularly those
generated by DNA microarray technology (17). A total of 10 patients (6 males and 4
females) with T2DM and 7 subjects (4 males and 3 females) with NGT
were included in this GEO dataset, and their clinical
characteristics are available from the supplementary information
online (18). The array data were
acquired from the Affymetrix Human Genome U133 Plus 2.0 array
[GPL570; transcript (gene) version].
DEG analysis
The gene expression profiles of liver samples from
subjects with T2DM and NGT in the dataset GSE23343 were compared to
identify DEGs. This analysis was performed using GEO2R (http://www.ncbi.nlm.nih.gov/geo/geo2r/)
through Rbased analysis of the microarray data (12). |log (fold change)|≥1 and P<0.05
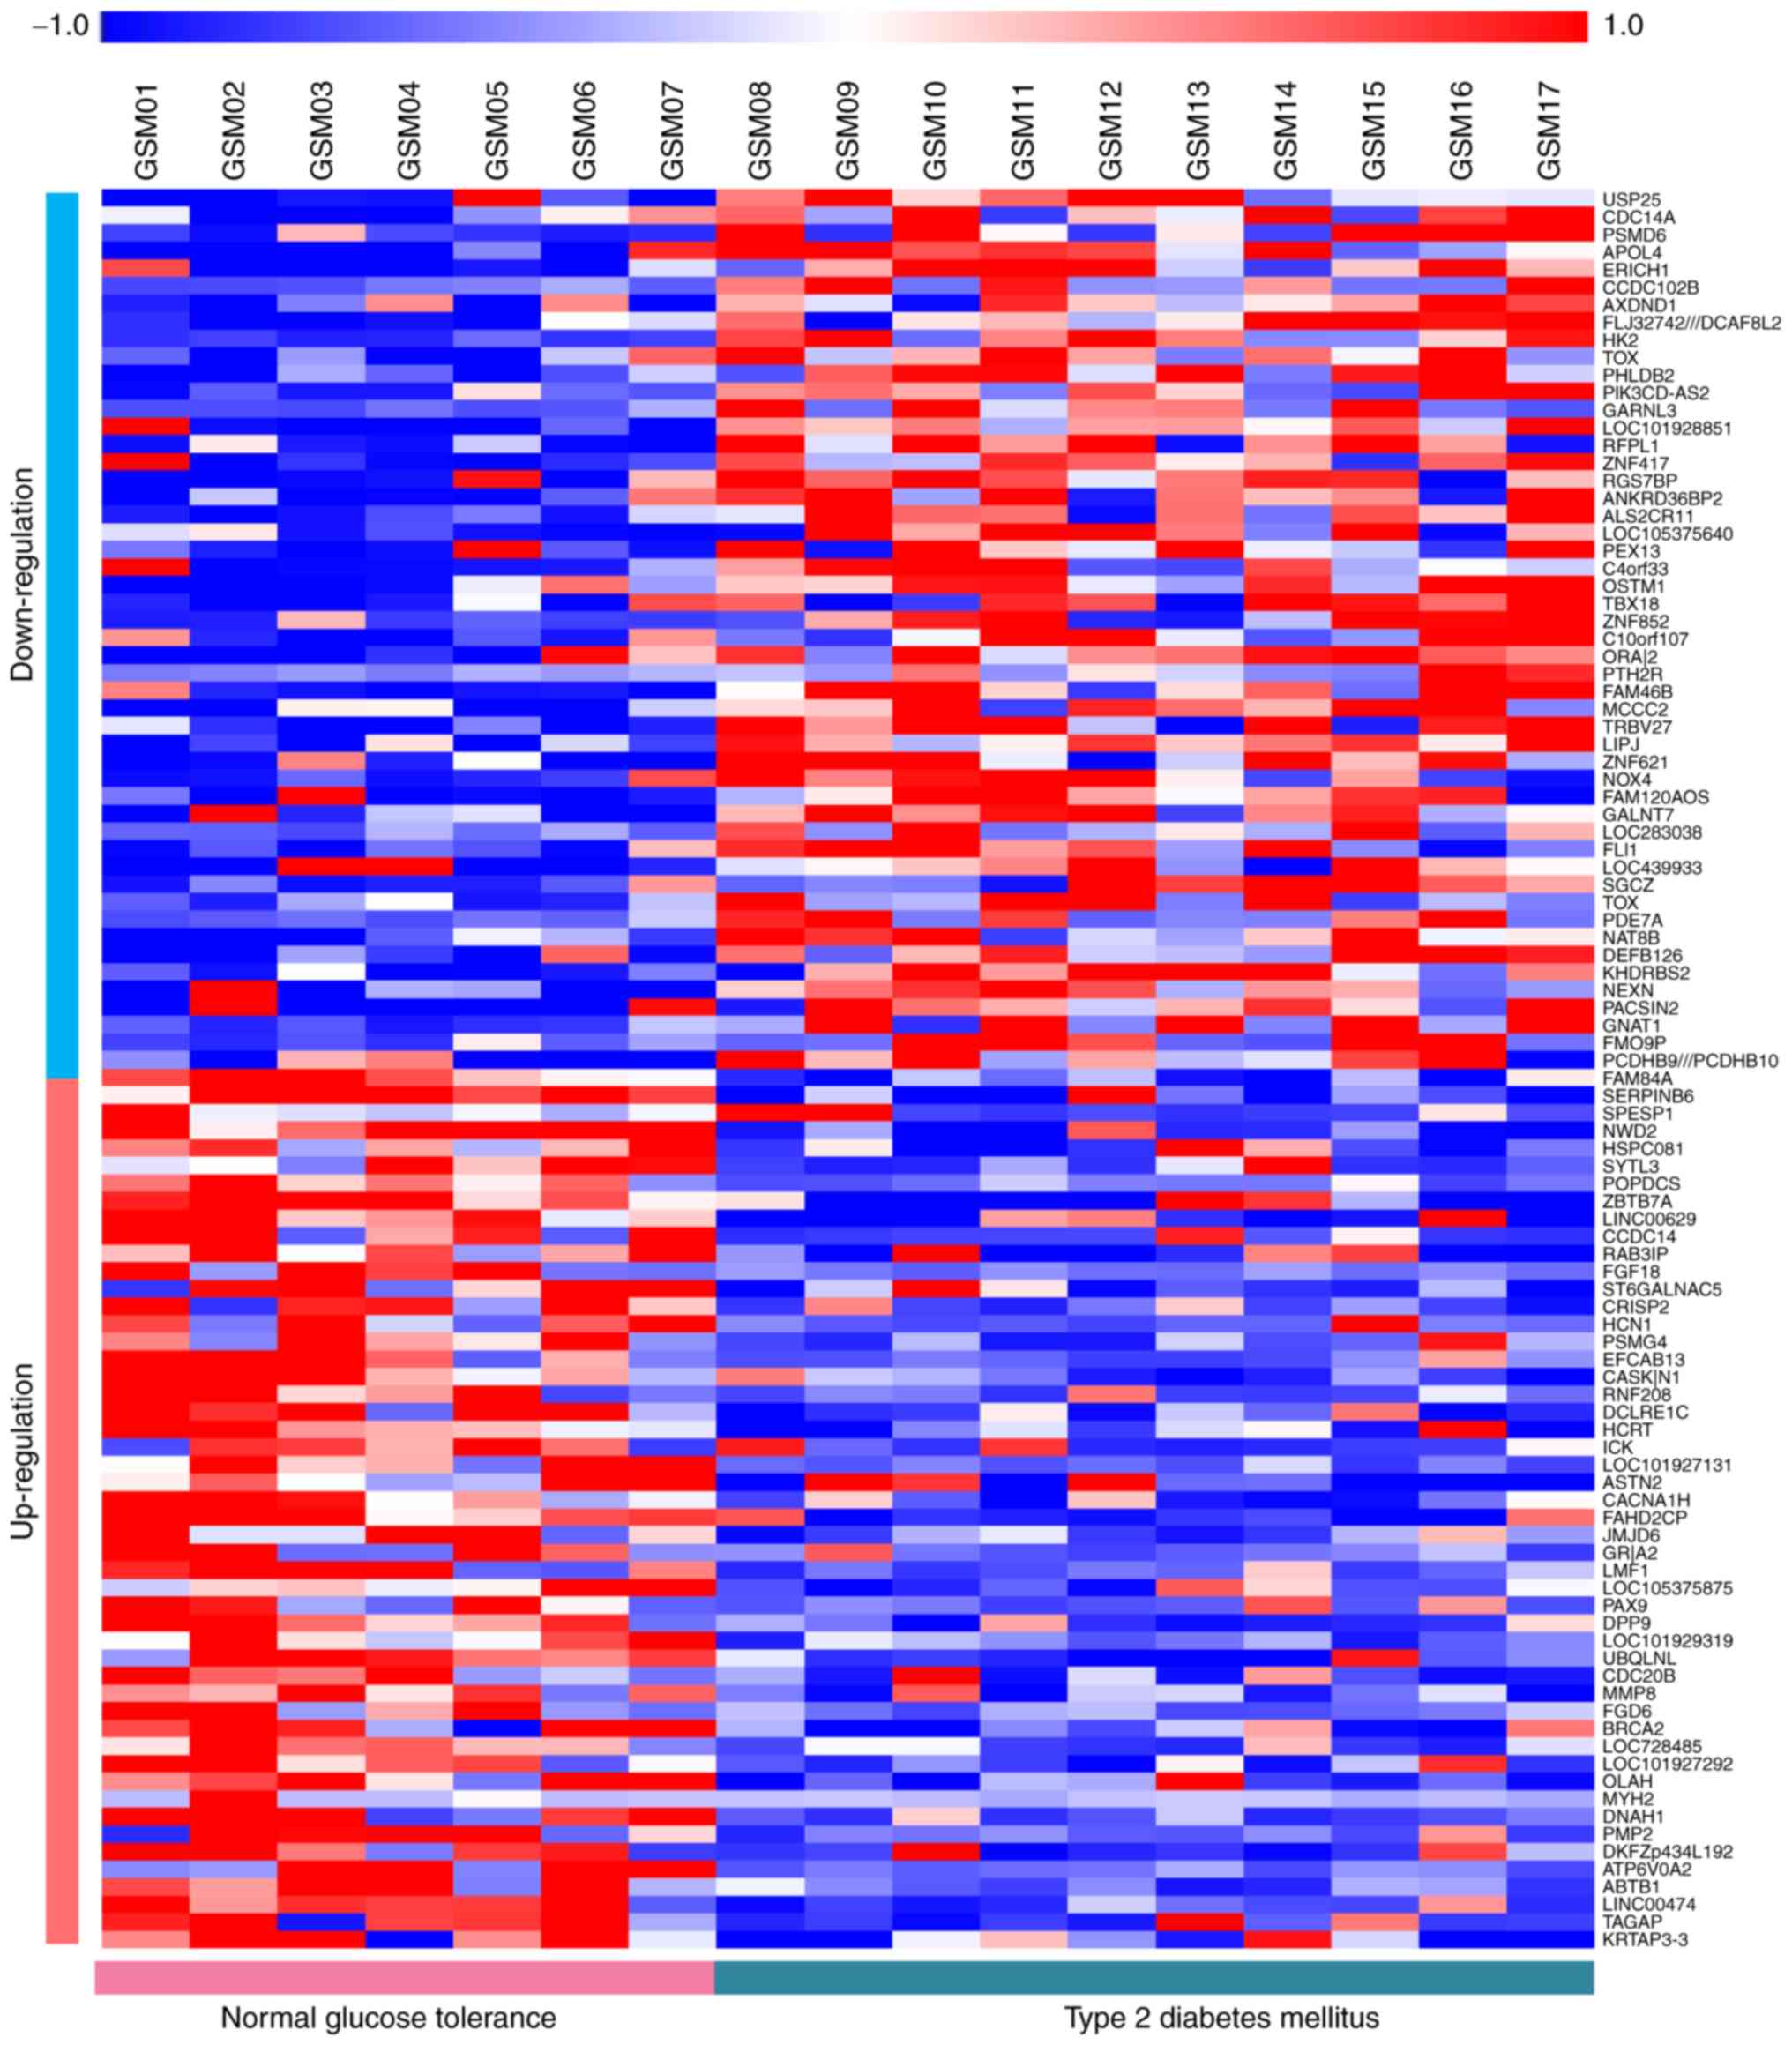
were the cut-off criteria. A heatmap of these DEGs was drawn using
MeV 4.9.0 (https://sourceforge.net/projects/mevtm4/).
Enrichment analysis
Gene Ontology (GO) and Kyoto Encyclopedia of Genes
and Genomes (KEGG) pathway enrichment analysis of the DEGs were
performed using the Database of Annotation Visualization and
Integrated Discovery (DAVID 6.8; http://david.ncifcrf.gov/) (19). The GO categories were biological
process (BP), molecular function (MF) and cellular component (CC).
P<0.05 was considered to indicate a statistically significant
difference. The results of the enrichment analysis were visualized
in a bubble chart using the OmicShare tools 3.0, a free online
platform for data analysis and visualization (http://www.omicshare.com/tools).
PPI network analysis
The Search Tool for the Retrieval of Interacting
Genes (STRING 10.5; http://stringdb.org/) was used to construct a PPI
network. This website offers predicted and verified interactions
among numerous proteins (20). A
combined score >0.7 was selected as the cutoff criterion.
Subsequently, the screened PPI network was imported into
Cytoscape3.2.1 (http://www.cytoscape.org/) to identify critical gene
modules and hub genes. Nodes with a high degree (≥2 fold the median
number of connections with other nodes) were considered as
significant nodes and nodes with a higher degree (≥5 fold the
median number of connections with other nodes) were considered as
hub nodes. Submodules of the network were screened using Molecular
Complex Detection (MCODE 1.4.2) (21), with the criteria of node number
>10 and MCODE score >10. Finally, enrichment analysis of the
submodules was performed using DAVID.
Results
DEG analysis
A total of 1,320 DEGs in liver samples of patients
with T2DM vs. NGT samples were identified, including 698 up- and
622 downregulated genes. The heat-map of the top 50 up- and top 50
downregulated genes is presented in Fig.
1.
GO analysis
In the GO category BP, upregulated genes were mainly
enriched in positive regulation of transcription from RNA
polymerase II (RNAP II) promoter, cell adhesion, inflammatory
response, positive regulation of apoptotic process and
extracellular matrix organization (Table
I), whereas downregulated genes were mainly associated with
signal transduction, multicellular organism development, positive
regulation of GTPase activity, visual perception and axon guidance
(Table II). In the GO category MF,
upregulated genes were mainly involved in calcium ion binding,
extracellular matrix structural constituent, SMAD binding, Rho
guanylnucleotide exchange factor activity and 3′,5′-cyclic AMP
phosphodiesterase activity (Table
I), whereas downregulated genes were mainly involved in actin
binding, receptor activity, RNAP II transcription factor activity,
sequence-specific DNA binding, calmodulin binding and protein
tyrosine kinase activity (Table
II). Finally, concerning the GO category CC, upregulated genes
were mainly involved in the plasma membrane, integral component of
plasma membrane, extracellular region, cell junction and
cytoskeleton (Table I), whereas
downregulated genes were mainly involved in nuclear envelope,
myosin complex, microvillus growth cone membrane and actomyosin
(Table II).
 | Table I.GO analysis of up- and downregulated
genes in type 2 diabetes mellitus (P<0.05). |
Table I.
GO analysis of up- and downregulated
genes in type 2 diabetes mellitus (P<0.05).
| A,
Upregulation |
|---|
|
|---|
| Category/term | N (%) | P-value |
|---|
| BP |
|
GO:0045944-Positive regulation
of transcription from RNA polymerase II promoter | 39 (5.972) | 0.049 |
|
GO:0007155-Cell adhesion | 23 (3.522) | 0.017 |
|
GO:0006954-Inflammatory
response | 20 (3.063) | 0.017 |
|
GO:0043065-Positive regulation
of apoptotic process | 17 (2.603) | 0.016 |
|
GO:0030198-Extracellular
matrix organization | 16 (2.450) | 0.001 |
| CC |
|
GO:0005886-Plasma
membrane | 151 (23.124) | 0.001 |
|
GO:0005887-Integral component
of plasma membrane | 64 (9.801) | 0.000 |
|
GO:0005576-Extracellular
region | 59 (9.035) | 0.049 |
|
GO:0030054-Cell junction | 24 (3.675) | 0.008 |
|
GO:0005856-Cytoskeleton | 19 (2.910) | 0.024 |
| MF |
|
GO:0005509-Calcium ion
binding | 31 (4.747) | 0.033 |
|
GO:0005201-Extracellular
matrix structural constituent | 8 (1.225) | 0.003 |
|
GO:0046332-SMAD binding | 7 (1.072) | 0.001 |
|
GO:0005089-Rho
guanyl-nucleotide exchange factor activity | 7 (1.072) | 0.025 |
|
GO:0004115-3′,5′-cyclic-AMP
phosphodiesterase activity | 4 (0.613) | 0.009 |
|
| B,
Downregulation |
|
|
Category/term | N (%) | P-value |
|
| BP |
|
GO:0007165-Signal
transduction | 46 (7.931) | 0.002 |
|
GO:0007275-Multicellular
organism development | 25 (4.310) | 0.003 |
|
GO:0043547-Positive regulation
of GTPase activity | 25 (4.310) | 0.007 |
|
GO:0007601-Visual
perception | 12 (2.069) | 0.011 |
|
GO:0007411-Axon guidance | 9 (1.552) | 0.043 |
| CC |
|
GO:0005635-Nuclear
envelope | 9 (1.552) | 0.039 |
|
GO:0016459-Myosin complex | 5 (0.862) | 0.032 |
|
GO:0005902-Microvillus | 5 (0.862) | 0.049 |
|
GO:0032584-Growth cone
membrane | 3 (0.517) | 0.011 |
|
GO:0042641-Actomyosin | 3 (0.517) | 0.033 |
| MF |
|
GO:0003779-Actin binding | 14 (2.414) | 0.022 |
|
GO:0004872-Receptor
activity | 12 (2.069) | 0.020 |
|
GO:0000981-RNA polymerase II
transcription factor activity, sequence-specific DNA binding | 11 (1.897) | 0.010 |
|
GO:0005516-Calmodulin
binding | 11 (1.897) | 0.020 |
|
GO:0004713-Protein tyrosine
kinase activity | 10 (1.724) | 0.006 |
| Table II.Kyoto Encyclopedia of Genes and
Genomes pathway analysis of up- and downregulated genes in type 2
diabetes mellitus (P<0.05). |
Table II.
Kyoto Encyclopedia of Genes and
Genomes pathway analysis of up- and downregulated genes in type 2
diabetes mellitus (P<0.05).
| A, Upregulated
genes |
|---|
|
|---|
| Term | N (%) | P-value | Genes |
|---|
| hsa05202:
Transcriptional misregulation in cancer | 11 (1.685) | 0.039 | MAX, CD86, FLI1,
SP1, CCND2, PML, ETV1, MDM2, JMJD1C, ETV5, MYCN |
| hsa04620: Toll-like
receptor signaling pathway | 10 (1.531) | 0.006 | IFNA2, CD86, IFNA7,
MAPK14, CXCL9, MAPK10, CXCL11, TLR6, TLR8, SPP1 |
| hsa04750:
Inflammatory mediator regulation of | 9 (1.378) | 0.012 | PRKCQ, PLA2G4A,
IL1R1, PTGER4, MAPK14, |
| TRP channels |
|
| F2RL1, MAPK10,
HTR2B, PRKCB |
| hsa04724:
Glutamatergic synapse | 9 (1.378) | 0.027 | SLC17A8, PLA2G4A,
GNGT2, GRIK1, GRIN1, SLC38A1, GRM1, SHANK2, PRKCB |
| hsa04974: Protein
digestion and absorption | 8 (1.225) | 0.021 | SLC8A1, COL14A1,
COL13A1, PRCP, COL1A2, COL12A1, ATP1A1, COL5A2 |
|
| B, Downregulated
genes |
|
| Term | Count | P-value | Genes |
|
| hsa04144:
Endocytosis | 12 (2.069) | 0.031 | ARFGAP1, IGF1R,
CBLC, RET, PIP5KL1, FOLR1, SNX5, RAB35, KIF5C, CYTH4, GRK4,
DNM1 |
| hsa04530: Tight
junction | 8 (1.379) | 0.035 | SHROOM4, MYH2,
EXOC4, MYH14, MYH8, CLDN23, MYH7B, AKT2 |
| hsa05218:
Melanoma | 6 (1.034) | 0.022 | FGF6, IGF1R, FGF18,
CDKN2A, AKT2, FGF4 |
KEGG pathway analysis
Upregulated genes were mainly enriched in
transcriptional misregulation in cancer, Toll-like receptor (TLR)
signaling pathway, inflammatory mediator regulation of transient
receptor potential (TRP) channels, glutamatergic synapse, and
protein digestion and absorption, whereas downregulated genes were
mainly associated with endocytosis, tight junction and melanoma
(Table II). The results of the
enrichment analysis were visualized in Figs. 2 and 3, respectively.
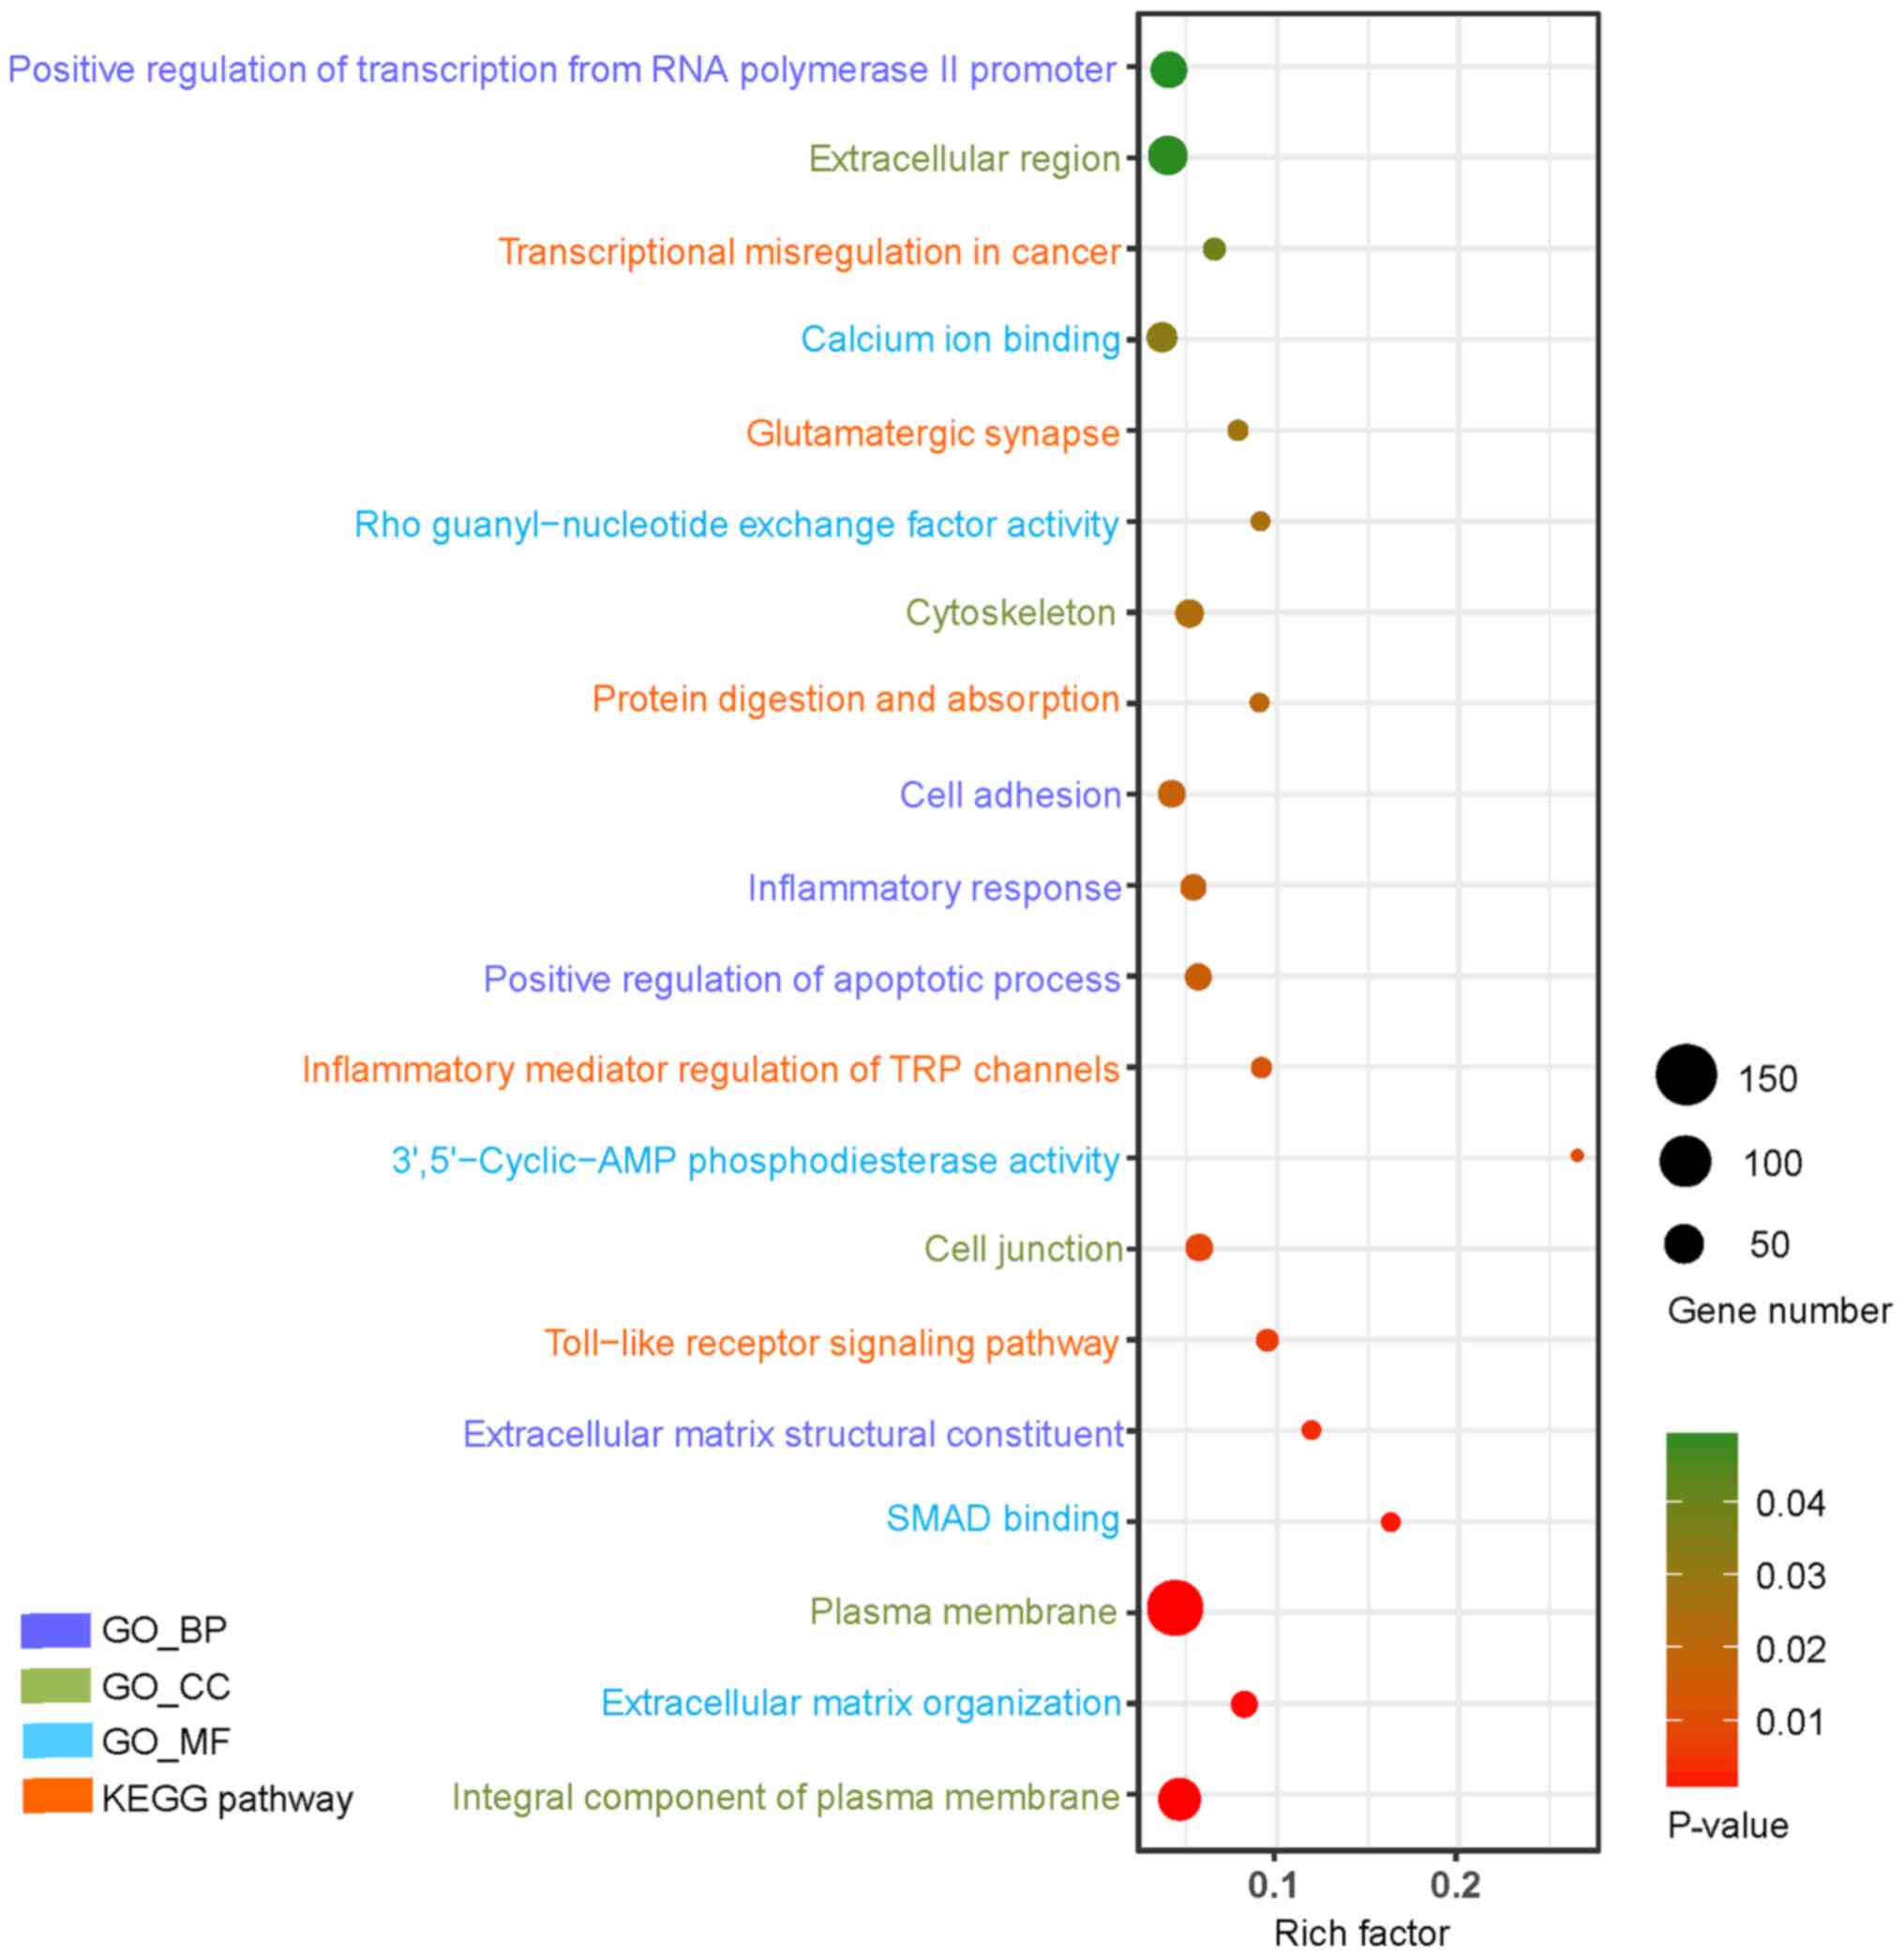 | Figure 2.GO and KEGG pathway analysis of the
top 20 upregulated genes in type 2 diabetes mellitus (P<0.05).
The Y-axis represents GO categories, including BP, MF and CC,
whereas the Xaxis represents the enrichment factor. The enrichment
factor is the ratio of the number of DEGs annotated to the term to
the number of all genes annotated to it. In addition, the dot size
represents the number of DEGs annotated to the term, whereas the
dot color indicates the significance of gene enrichment. GO, gene
ontology; KEGG, Kyoto Encyclopedia of Genes and Genomes; DEG,
differentially expressed gene; TRP, transient receptor potential;
BP, biological process; CC, cellular component; MF, molecular
function. |
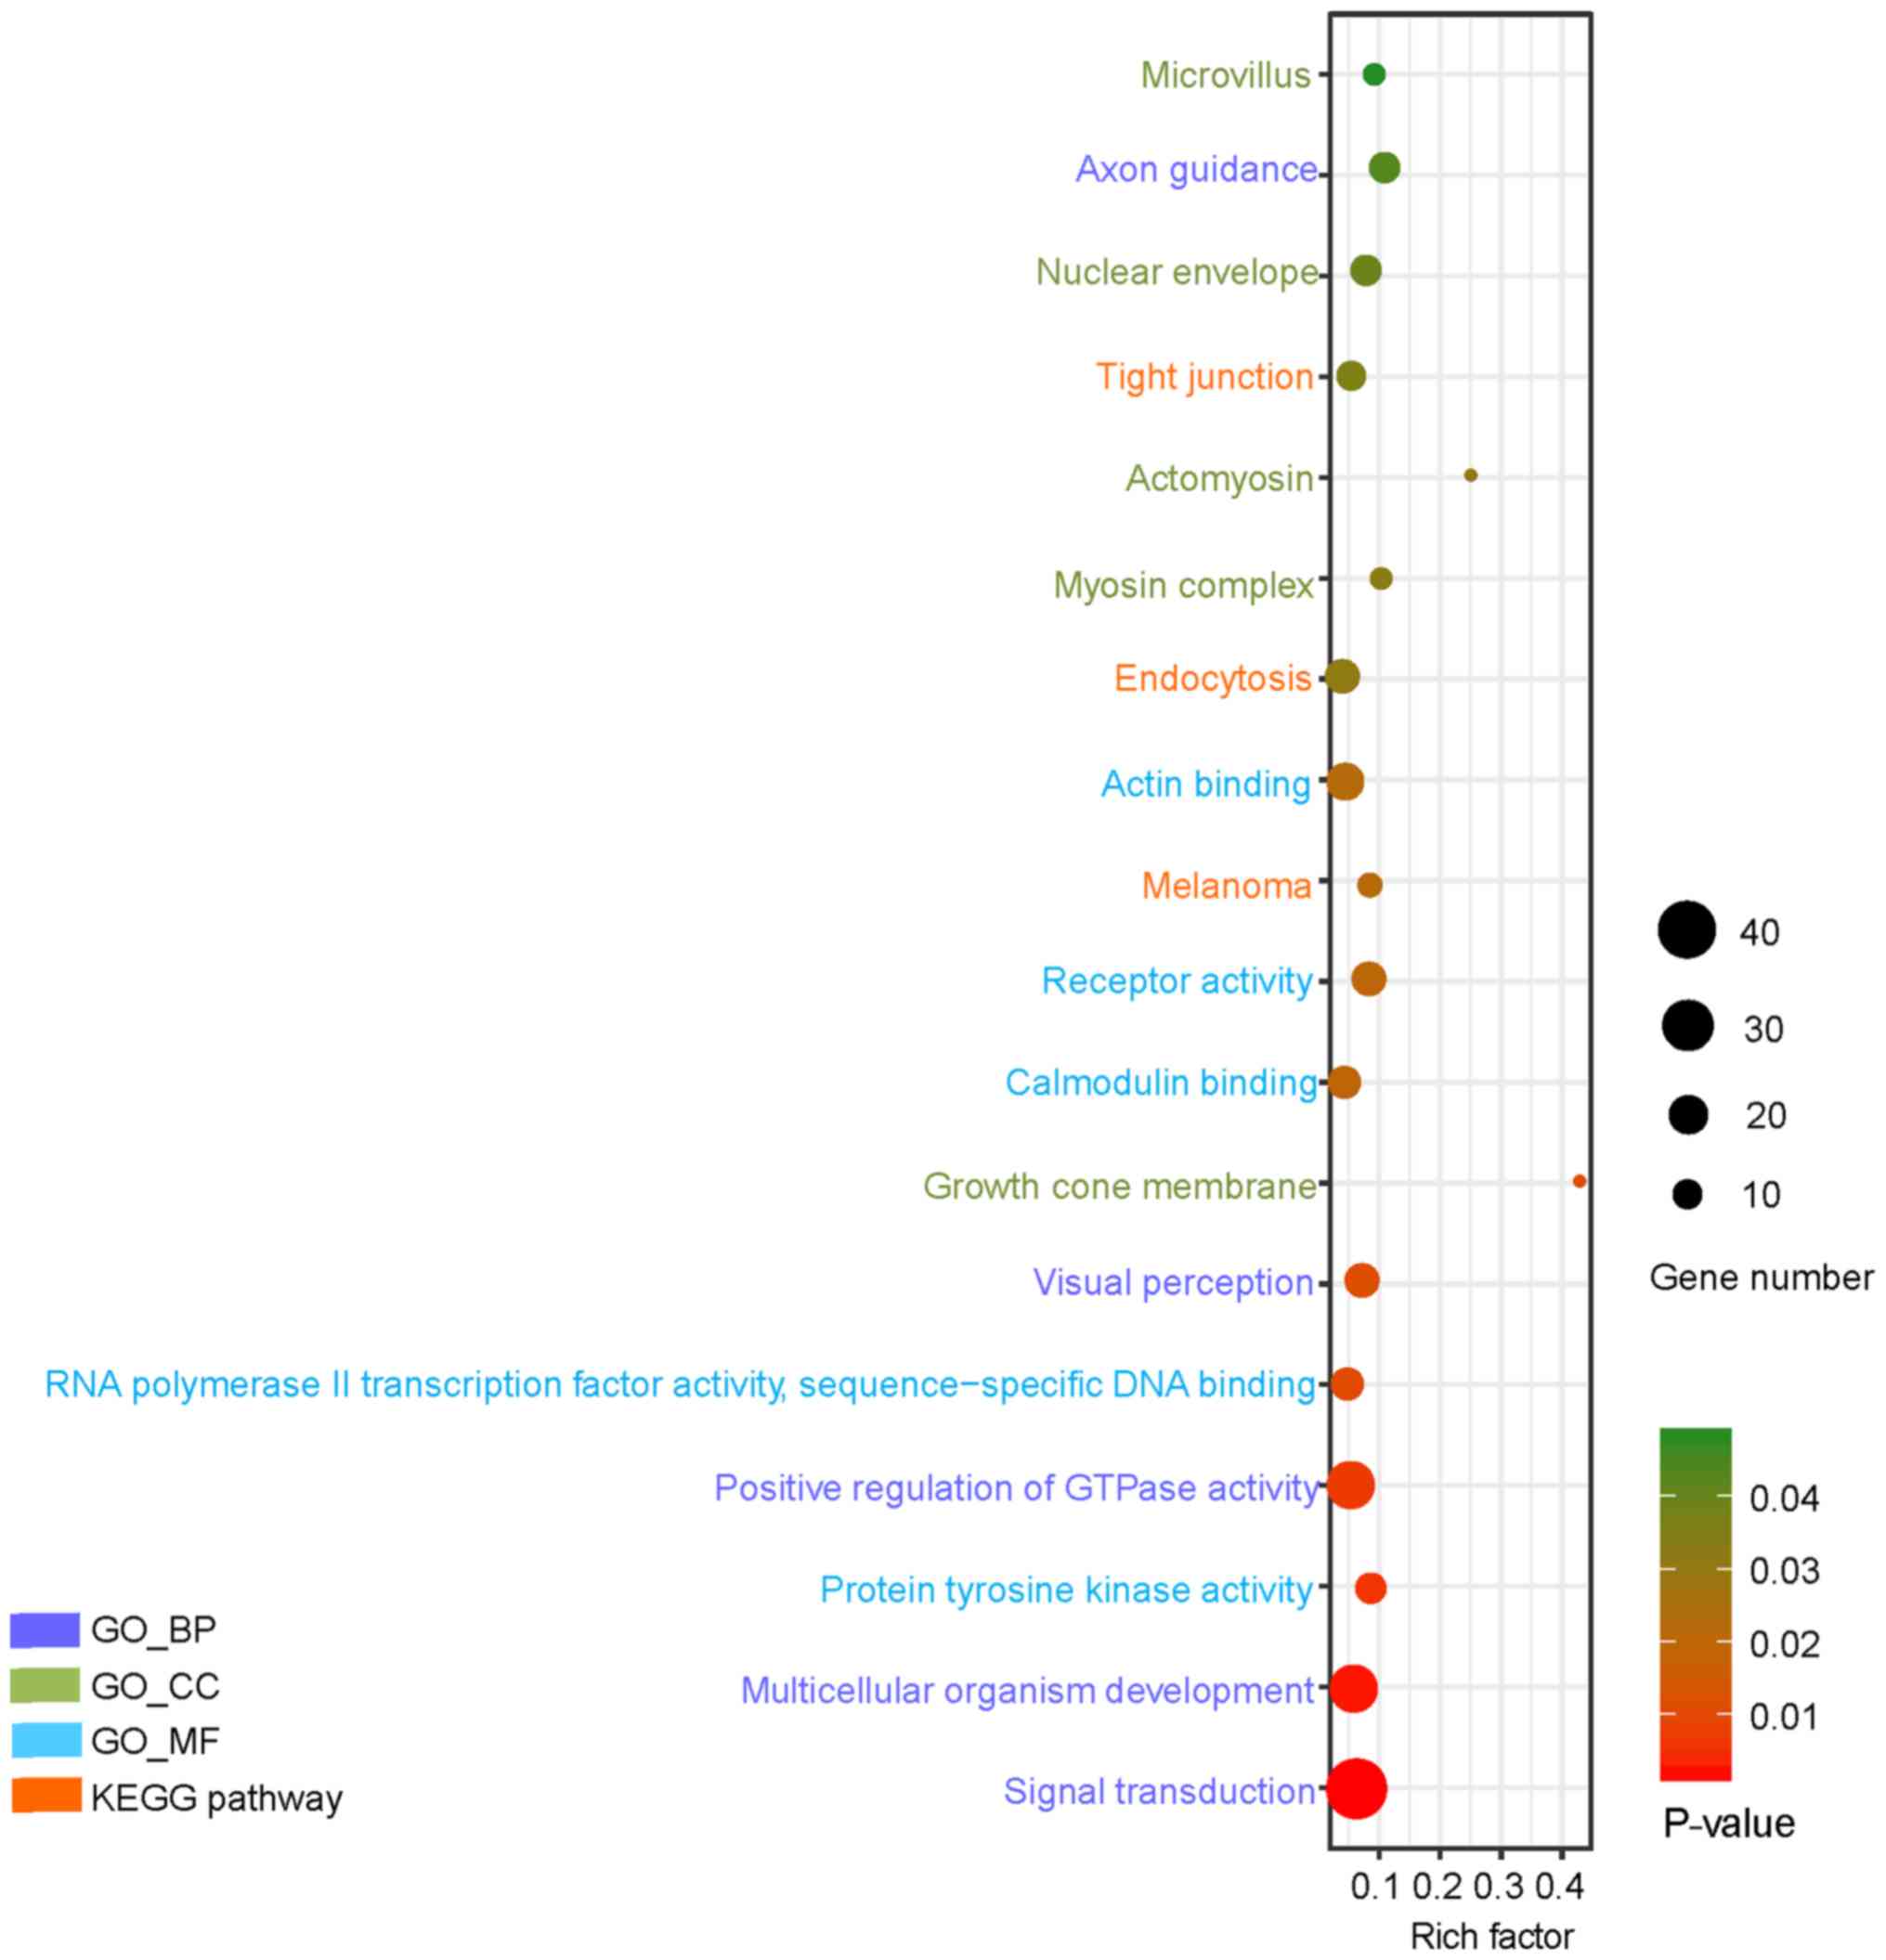 | Figure 3.GO and KEGG pathway analysis of the
top 18 downregulated genes in type 2 diabetes mellitus (P<0.05).
The Y-axis represents GO categories, including BP, MF and CC,
whereas the X-axis represents the enrichment factor. The enrichment
factor is the ratio of the number of DEGs annotated to the term to
all the genes annotated to it. In addition, the dot size represents
the number of DEGs annotated to the term, whereas the dot color
indicates the significance of gene enrichment. GO, gene ontology;
KEGG, Kyoto Encyclopedia of Genes and Genomes; DEG, differentially
expressed gene; BP, biological process; CC, cellular component; MF,
molecular function. |
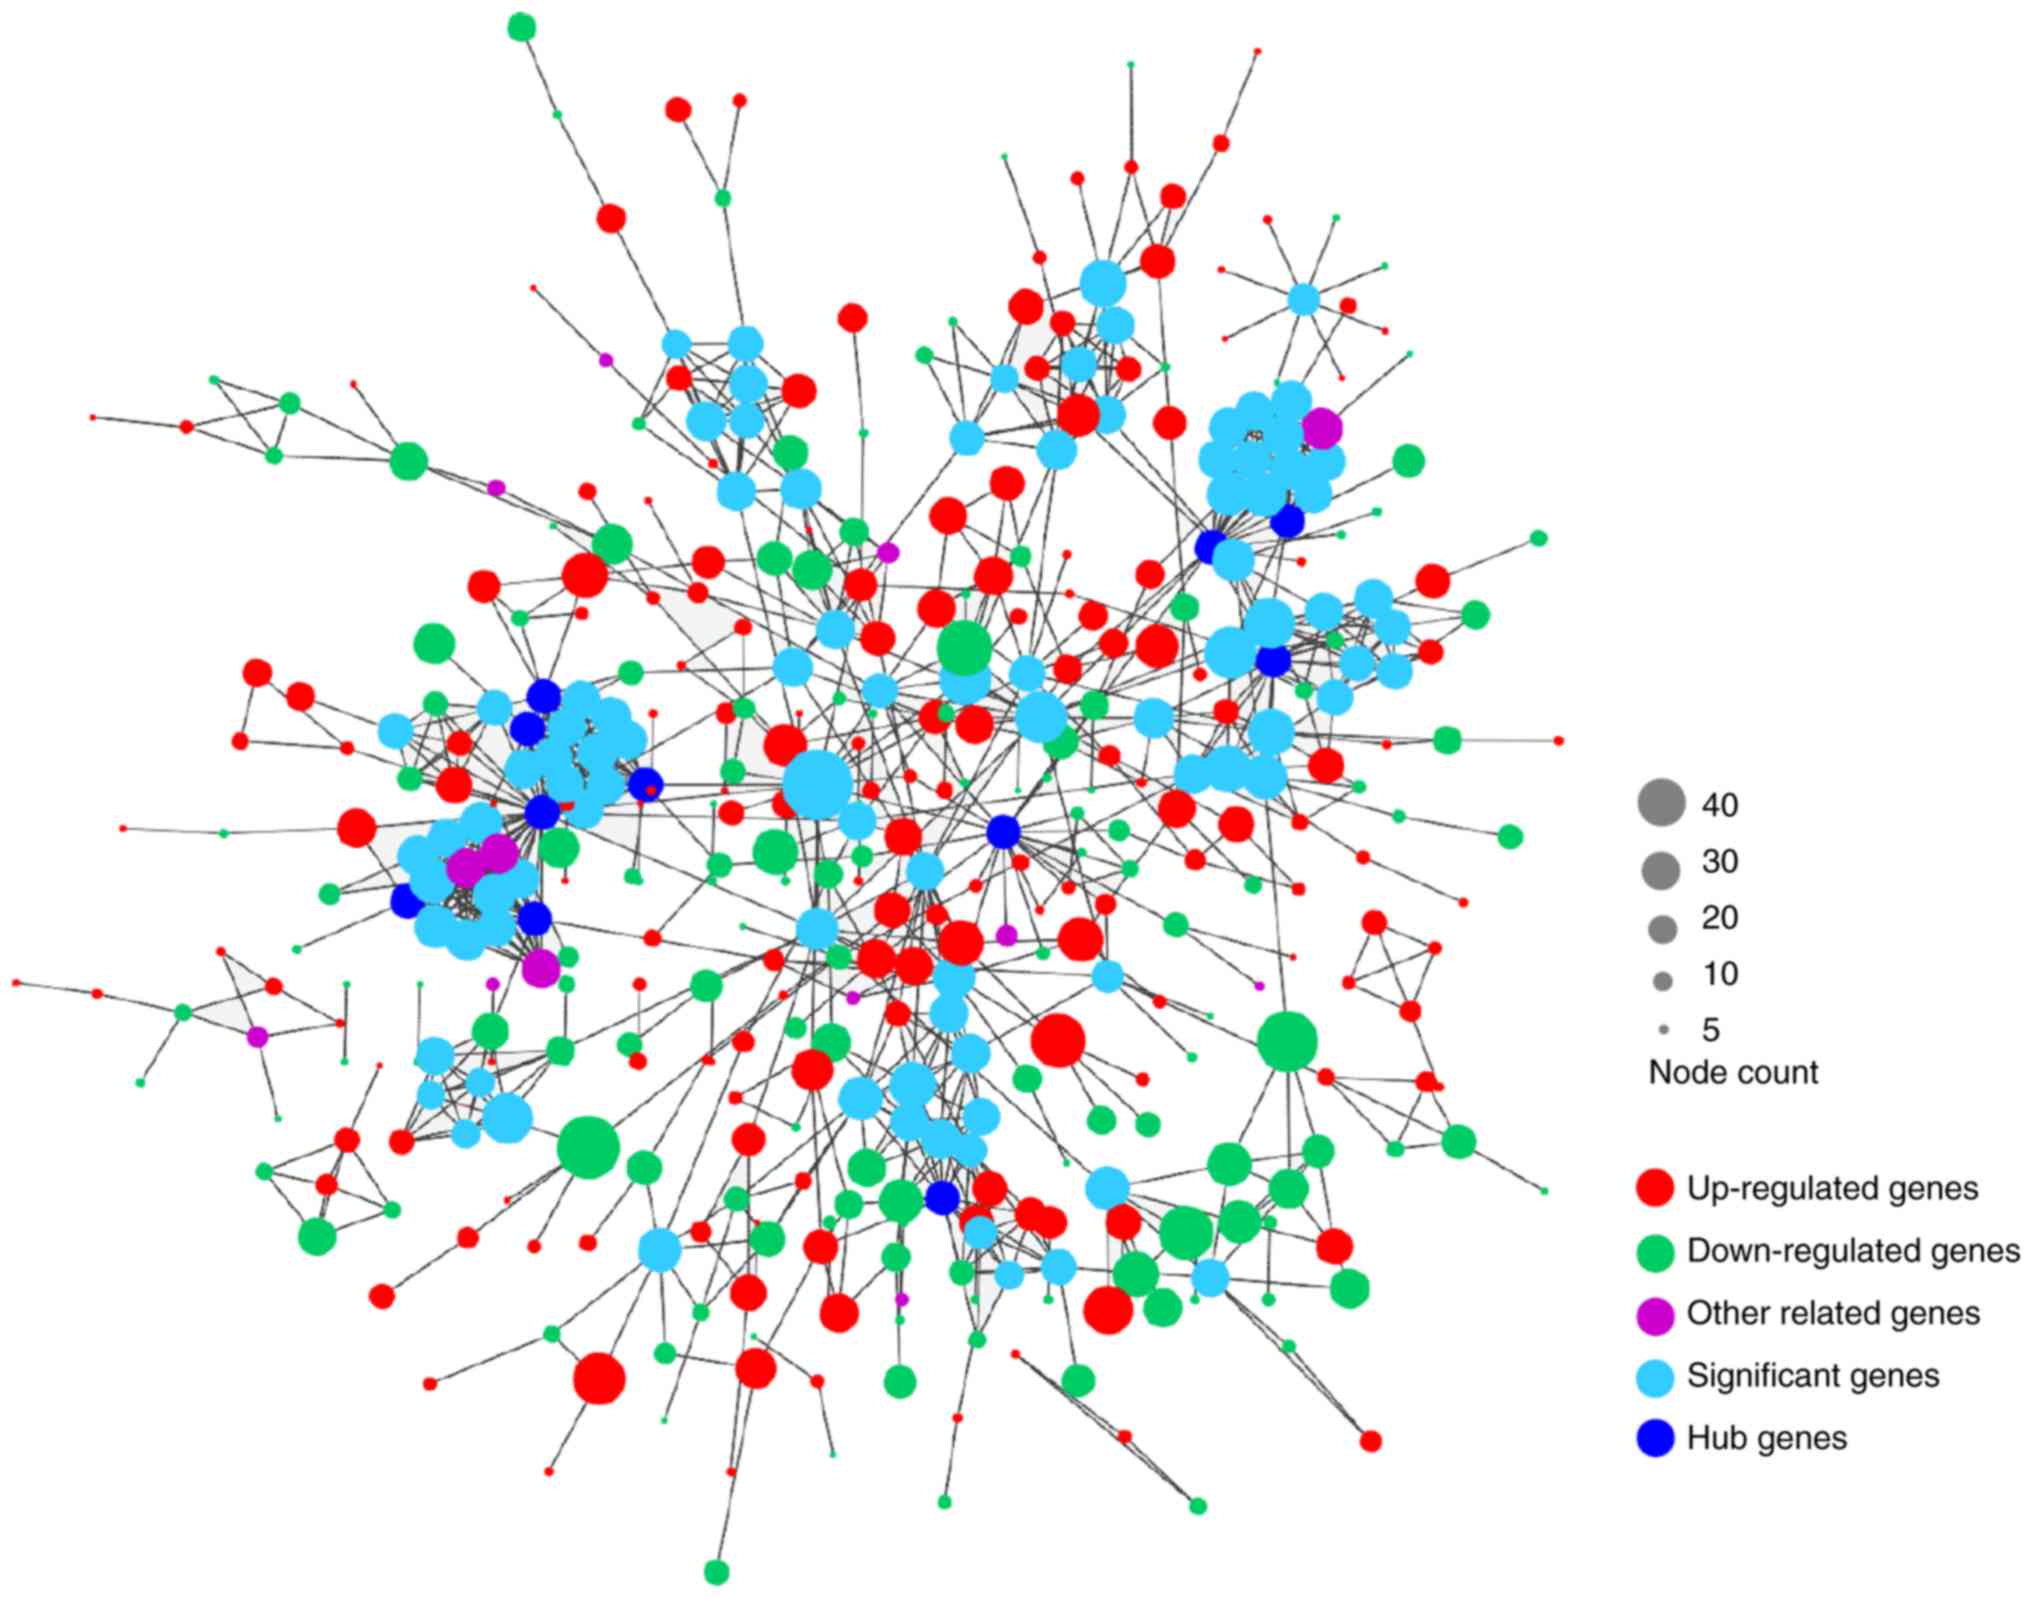
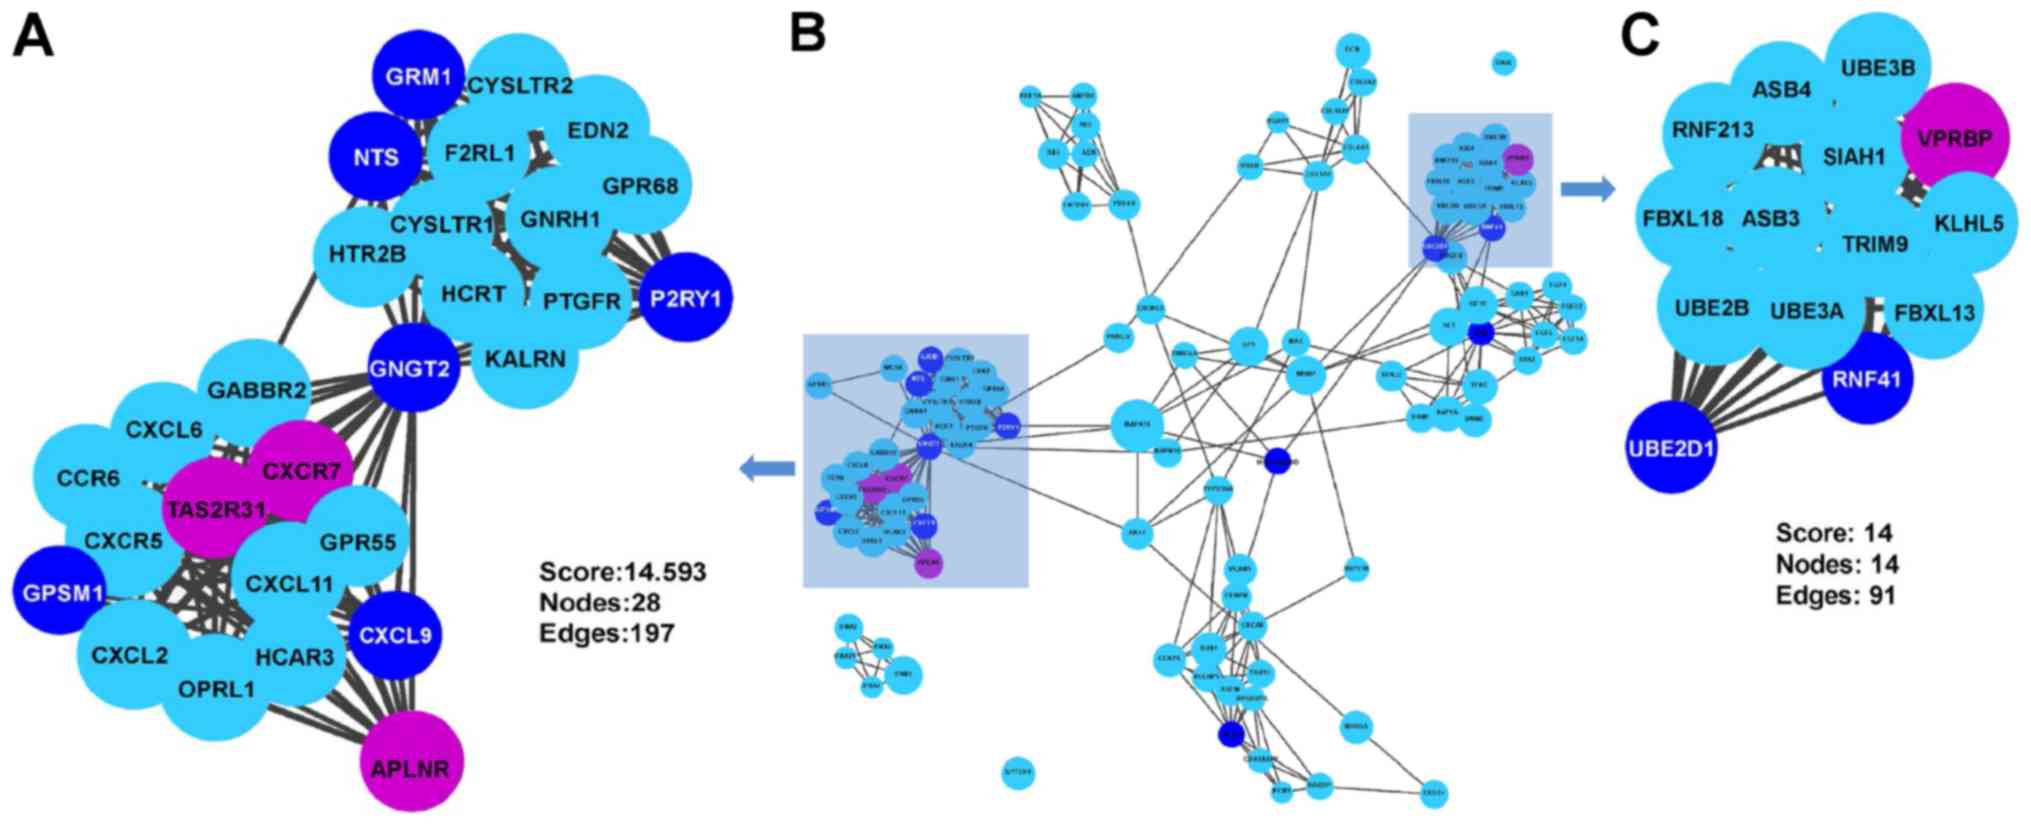
PPI network analysis
As presented in Fig.
4, the PPI network of DEGs consisted of 443 nodes and 996
edges. A total of 11 genes were selected as candidates for hub
genes. In addition, two submodules were selected, one of which had
28 nodes and 197 edges, while the other module had 14 nodes and 91
edges (Fig. 5). Finally, as
presented in Table III, eight hub
genes involved in these two submodules were identified, including
Gprotein subunit gamma transducin 2 (GNGT2), ubiquitin-conjugating
enzyme E2 D1 (UBE2D1), glutamate metabotropic receptor 1 (GRM1),
G-protein signaling modulator 1 (GPSM1), C-X-C motif chemokine
ligand 9 (CXCL9), neurotensin (NTS), purinergic receptor P2Y1
(P2RY1) and ring finger protein 41 (RNF41). However, no enrichment
was observed in these two submodules.
| Table III.Hub nodes in the network of
differentially expressed genes in type 2 diabetes mellitus. |
Table III.
Hub nodes in the network of
differentially expressed genes in type 2 diabetes mellitus.
| Hub node | Description | Degree | MCODE score | Count |
Up/downregulation |
|---|
| GNGT2 | G protein subunit
gamma transducin 2 | 39 | 14 | 41 | Up |
| UBE2D1 |
Ubiquitin-conjugating enzyme E2 D1 | 19 | 13 | 29 | Up |
| GRM1 | Glutamate
metabotropic receptor 1 | 17 | 13 | 20 | Up |
| GPSM1 | G-protein signaling
modulator 1 | 16 | 14 | 18 | Down |
| CXCL9 | C-X-C motif
chemokine ligand 9 | 16 | 14 | 24 | Up |
| NTS | Neurotensin | 16 | 13 | 38 | Up |
| P2RY1 | Purinergic receptor
P2Y1 | 16 | 13 | 17 | Up |
| RNF41 | Ring finger protein
41 | 16 | 13 | 17 | Up |
Discussion
In the present study, 698 up- and 622 downregulated
DEGs were screened from the hepatic genes of patients with T2DM and
normal subjects. GO term analysis revealed that the upregulated
DEGs were mainly associated with positive regulation of
transcription from RNAP II promoter, cell adhesion, inflammatory
response, positive regulation of apoptotic process and
extracellular matrix organization. Hepatocyte nuclear factor 4
(HNF4) regulates numerous pivotal metabolic pathways and exert
significant effects on recruiting RNAP II to synthesize gene
promoters. Abnormalities in the hepatic HNF4 transcription network
are accountable for diabetes and fatty liver (22). Alterations in cell adhesion may
disturb significant cellular processes, leading to the causation of
various diseases. Targeted inactivation of carcinoembryonic
antigen-related cell adhesion molecule 1 (CEACAM1) in the liver was
reported to cause insulin resistance and promote hepatic
adipogenesis, suggesting a critical role of CEACAM1 in regulating
insulin clearance in the liver (23). Hyperglycemiainduced oxidative stress
induces liver tissue injury and the ensuing derangement of protein,
carbohydrate and lipid metabolism leads to increased oxidative
stress, further triggering the inflammatory cascade (24). Hepatocyte inflammation significantly
downregulates insulin signaling components, including insulin
receptor substrate (IRS)-1, IRS-2, PI3K, Akt and mTOR (25). Inflammatory regulators induced by
hepatocyte apoptosis-associated damage are able to regulate the
insulin signaling pathway, and these insulin resistanceassociated
regulators may, in turn, affect hepatocyte apoptosis (5). Endoplasmic reticulum stressinduced
apoptosis of hepatocytes and adipocytes is also important in the
development of diabetes, characterized by increased insulin
resistance (26). The downregulated
DEGs were mainly involved in signal transduction, multicellular
organism development and positive regulation of GTPase activity. In
the process of metabolic alterations, cellular responses to
extracellular stimulation require signal transduction, contributing
to physiological events including increased uptake of blood glucose
(27). GTPases are also important in
signal transduction at the intracellular domain of transmembrane
receptors (28).
The KEGG pathway enrichment analysis indicated that
the upregulated DEGs were accumulated in the TLR signaling pathway,
inflammatory mediator regulation of TRP channels and protein
digestion and absorption, and that the downregulated DEGs were
enriched in endocytosis and tight junction. Diabetes frequently
occurs in combination with other metabolic diseases, including
hyperlipidemia, hypertension and non-alcoholic fatty liver disease
(29). Deposition of fatty acids in
the liver, particularly saturated fatty acids, activates the TLR
pathway, which is associated with the inflammatory response
(30). Hepatic inflammation is
closely correlated with insulin resistance (25). A previous study reported that TRP
cation channel subfamily V member 4 effectively regulates the
expression of various pro-inflammatory genes in adipose tissue, and
that these pro-inflammatory genes are closely associated with
insulin resistance (31).
Tight-junction proteins, besides their function as integral
proteins of tight junctions that form barriers in the gut and the
liver, may also be expressed outside the tight junction to regulate
signaling, trafficking and gene expression. A hallmark is their
regulation of epithelial-to-mesenchymal transition (32). A previous study demonstrated that the
endocytosis impairment of specific ligands or other macromolecules
may represent an important pathology mechanism in diabetes
(33). The biological processes and
pathways identified and discussed above may indicate an important
role of the liver in the pathology of T2DM.
In the present study, the following eight hub genes
were also selected: GNGT2, UBE2D1, GRM1, GPSM1, CXCL9, NTS, P2RY1
and RNF41. GNGT2 was reported to be involved in β-arrestin-1induced
Akt phosphorylation and NF-κB activation (34). Activation of NFκB in the liver may
result in hepatic insulin resistance (5). The low-density lipoprotein (LDL)
receptor is indispensable for the uptake of LDL cholesterol and for
regulating the levels of plasma lipoprotein (35). The E3 ubiquitin ligase inducible
degrader of LDL receptor/ubiquitin-conjugating enzyme E2D complex
is effectively responsible for determining LDL receptor activity
(36). Sirtuin 1, a type of
nicotinamide adenine dinucleotide-dependent deacetylase, also
regulates the pathogenesis of metabolic disease, aging and
tumorigenesis (37). Sirtuin
1-mediated epigenetic regulation of the expression of the
metabotropic glutamate receptor 1/5 (encoded by the GRM1/5 gene)
was reported to be involved in the development of neuropathic pain
in a rat model of T2DM (38,39). The GPSM1 locus has been demonstrated
to be associated with the insulinogenic index and with the fasting
glucose level (40,41), and GPSM1 has been identified as one
of the three novel T2DM loci in East Asian populations (42). Previous studies have also suggested
an important role of CXCL9 in diabetic neuropathy, diabetic
retinopathy and diabetic nephropathy (43–45).
Advanced glycation end products were reported to promote apoptosis
and inflammation in mouse podocytes via CXCL9-regulated activation
of the JAK2/STAT3 pathway (46). The
fasting plasma levels of pro-NTS produced in equimolar amounts with
NTS were indicated to be positively associated with the risk of
diabetes, cardiovascular disease and mortality (47). Obese and insulin-resistant patients
had higher plasma concentrations of proNTS, and NTS-deficient mice
on a highfat diet exhibited lower levels of fasting plasma glucose
and insulin compared with wildtype mice (48). Furthermore, P2Y1 receptorknockout
mice exhibited high levels of plasma insulin, plasma glucose and
increased body weight, indicating an important regulatory role of
the P2Y1 receptors in glucose homeostasis (49). Finally, RNF41, an E3 ubiquitin
ligase, was identified to be essential for activation of the type 1
interferon pathway to sustain insulin sensitivity in the muscle
tissue of obese patients (50).
Pancreatic islet β-cells require normal mitochondrial function in
terms of their high metabolic activity. Stabilization of the C-type
lectin domain-containing 16A/RFP41/ubiquitin-specific peptidase 8
mitochondrial autophagy complex is essential for cellular
respiration and insulin secretion. However, a study reported that
elevated levels of glucose and fatty acids destabilized the
complex, causing β-cell apoptosis (51).
In conclusion, a comprehensive analysis of hepatic
DEGs in T2DM was performed in the present study, revealing an
important role of the liver in the pathological mechanisms of T2DM.
However, considering the absence of clinical validation in the
present study, further investigation of these mechanisms underlying
the hepatic pathology of T2DM is required to confirm these
results.
Acknowledgements
Not applicable.
Funding
The present study was supported by the National
Natural Science Foundation of China (grant no. 81804030).
Availability of data and materials
All data can be accessed in the GEO database
(https://www.ncbi.nlm.nih.gov/geo/query/acc.cgi?acc=GSE23343).
Authors' contributions
ZC and LX designed the study. ZC, WY, TL and DH
performed the data analysis. ZC, TL and DH drafted the manuscript.
ZC, WY and LX revised the manuscript. All authors agree to be
accountable for all aspects of the work and gave approval for the
study to be published.
Ethics approval and consent to
participate
Not applicable.
Patient consent for publication
Not applicable.
Competing interests
The authors declare that they have no competing
interests.
References
|
1
|
American Diabetes Association, . Diagnosis
and Classification of Diabetes Mellitus. Diabetes Care. 32 (Suppl
1):S62–S67. 2009. View Article : Google Scholar : PubMed/NCBI
|
|
2
|
Li L, Pan Z, Yang S, Shan W and Yang Y:
Identification of key gene pathways and coexpression networks of
islets in human type 2 diabetes. Diabetes Metab Syndr Obes.
11:553–563. 2018. View Article : Google Scholar : PubMed/NCBI
|
|
3
|
Ling Q, Xu X, Wang B, Li L and Zheng S:
The origin of new-onset diabetes after liver transplantation:
Liver, Islets, or Gut? Transplantation. 100:808–813. 2016.
View Article : Google Scholar : PubMed/NCBI
|
|
4
|
DeFronzo RA: Pathogenesis of type 2
diabetes mellitus. Med Clin North Am. 88:787–835. 2004. View Article : Google Scholar : PubMed/NCBI
|
|
5
|
Schattenberg JM and Schuchmann M: Diabetes
and apoptosis: Liver. Apoptosis. 14:1459–1471. 2009. View Article : Google Scholar : PubMed/NCBI
|
|
6
|
Michael MD, Kulkarni RN, Postic C, Previs
SF, Shulman GI, Magnuson MA and Kahn CR: Loss of insulin signaling
in hepatocytes leads to severe insulin resistance and progressive
hepatic dysfunction. Mol Cell. 6:87–97. 2000. View Article : Google Scholar : PubMed/NCBI
|
|
7
|
Shimomura I, Matsuda M, Hammer RE,
Bashmakov Y, Brown MS and Goldstein JL: Decreased IRS-2 and
increased SREBP-1c lead to mixed insulin resistance and sensitivity
in livers of lipodystrophic and ob/ob Mice. Mol Cell. 6:77–86.
2000. View Article : Google Scholar : PubMed/NCBI
|
|
8
|
Lewis GF, Carpentier A, Adeli K and Giacca
A: Disordered fat storage and mobilization in the pathogenesis of
insulin resistance and type 2 diabetes. Endocr Rev. 23:201–229.
2002. View Article : Google Scholar : PubMed/NCBI
|
|
9
|
McGarry JD: Banting lecture 2001
dysregulation of fatty acid metabolism in the etiology of type 2
diabetes. Diabetes. 51:7–18. 2002. View Article : Google Scholar : PubMed/NCBI
|
|
10
|
Postic C and Girard J: Contribution of de
novo fatty acid synthesis to hepatic steatosis and insulin
resistance: Lessons from genetically engineered mice. J Clin
Invest. 118:829–838. 2008. View
Article : Google Scholar : PubMed/NCBI
|
|
11
|
Honda M, Asonuma K, Hayashida S, Suda H,
Ohya Y, Lee KJ, Yamamoto H, Takeichi T and Inomata Y: Incidence and
risk factors for new-onset diabetes in living-donor liver
transplant recipients. Clin Transplant. 27:426–435. 2013.
View Article : Google Scholar : PubMed/NCBI
|
|
12
|
Barrett T, Wilhite SE, Ledoux P,
Evangelista C, Kim IF, Tomashevsky M, Marshall KA, Phillippy KH,
Sherman PM, Holko M, et al: NCBI GEO: Archive for functional
genomics data sets-update. Nucleic Acids Res. 41((Databaseissue)):
D991–D995. 2013.PubMed/NCBI
|
|
13
|
Gaulton KJ, Ferreira T, Lee Y, Raimondo A,
Mägi R, Reschen ME, Mahajan A, Locke A, Rayner NW, Robertson N, et
al: Genetic fine mapping and genomic annotation defines causal
mechanisms at type 2 diabetes susceptibility loci. Nat Genet.
47:1415–1425. 2015. View
Article : Google Scholar : PubMed/NCBI
|
|
14
|
Lawlor N, Khetan S, Ucar D and Stitzel ML:
Genomics of Islet (Dys)function and Type 2 Diabetes. Trends Genet.
33:244–255. 2017. View Article : Google Scholar : PubMed/NCBI
|
|
15
|
Stitzel ML, Sethupathy P, Pearson DS,
Chines PS, Song L, Erdos MR, Welch R, Parker SC, Boyle AP, Scott
LJ, et al: Global epigenomic analysis of primary human pancreatic
islets provides insights into type 2 diabetes susceptibility loci.
Cell Metab. 12:443–455. 2010. View Article : Google Scholar : PubMed/NCBI
|
|
16
|
Zhang F, Xu X, Zhang Y, Zhou B, He Z and
Zhai Q: Gene expression profile analysis of type 2 diabetic mouse
liver. PLoS One. 8:e577662013. View Article : Google Scholar : PubMed/NCBI
|
|
17
|
Barrett T and Edgar R: Gene expression
omnibus: Microarray data storage, submission, retrieval, and
analysis. Methods Enzymo. 411:352–369. 2006. View Article : Google Scholar
|
|
18
|
Misu H, Takamura T, Takayama H, Hayashi H,
Matsuzawa-Nagata N, Kurita S, Ishikura K, Ando H, Takeshita Y, Ota
T, et al: A liver-derived secretory protein, selenoprotein P,
causes insulin resistance. Cell Metab. 12:483–495. 2010. View Article : Google Scholar : PubMed/NCBI
|
|
19
|
Dennis G Jr, Sherman BT, Hosack DA, Yang
J, Gao W, Lane HC and Lempicki RA: DAVID: Database for annotation,
visualization, and integrated discovery. Genome Biol. 4:P32003.
View Article : Google Scholar : PubMed/NCBI
|
|
20
|
Szklarczyk D, Franceschini A, Kuhn M,
Simonovic M, Roth A, Minguez P, Doerks T, Stark M, Muller J, Bork
P, et al: The STRING database in 2011: Functional interaction
networks of proteins, globally integrated and scored. Nucleic Acids
Res. 39((Database)): 561–568. 2011. View Article : Google Scholar
|
|
21
|
Bader GD and Hogue CW: An automated method
for finding molecular complexes in large protein interaction
networks. BMC Bioinformatics. 4:22003. View Article : Google Scholar : PubMed/NCBI
|
|
22
|
Rana R, Surapureddi S, Kam W, Ferguson S
and Goldstein JA: Med25 is required for RNA polymerase II
recruitment to specific promoters, thus regulating xenobiotic and
lipid metabolism in human liver. Mol Cell Biol. 31:466–481. 2011.
View Article : Google Scholar : PubMed/NCBI
|
|
23
|
DeAngelis AM, Heinrich G, Dai T, Bowman
TA, Patel PR, Lee SJ, Hong EG, Jung DY, Assmann A, Kulkarni RN, et
al: Carcinoembryonic antigen-related cell adhesion molecule 1: A
link between insulin and lipid metabolism. Diabetes. 57:2296–2303.
2008. View Article : Google Scholar : PubMed/NCBI
|
|
24
|
Mohamed J, Nazratun Nafizah AH, Zariyantey
AH and Budin SB: Mechanisms of diabetes-induced liver damage: The
role of oxidative stress and inflammation. Sultan Qaboos Univ Med
J. 16:e132–e141. 2016. View Article : Google Scholar : PubMed/NCBI
|
|
25
|
Sadi G, Pektaş MB, Koca HB, Tosun M and
Koca T: Resveratrol improves hepatic insulin signaling and reduces
the inflammatory response in streptozotocin-induced diabetes. Gene.
570:213–220. 2015. View Article : Google Scholar : PubMed/NCBI
|
|
26
|
van der Kallen CJ, van Greevenbroek MM,
Stehouwer CD and Schalkwijk CG: Endoplasmic reticulum
stress-induced apoptosis in the development of diabetes: Is there a
role for adipose tissue and liver? Apoptosis. 14:1424–1434. 2009.
View Article : Google Scholar : PubMed/NCBI
|
|
27
|
Rosen OM: After insulin binds. Science.
237:1452–1458. 1987. View Article : Google Scholar : PubMed/NCBI
|
|
28
|
Scheffzek K and Ahmadian MR: GTPase
activating proteins: Structural and functional insights 18 years
after discovery. Cell Mol Life Sci. 62:3014–3038. 2005. View Article : Google Scholar : PubMed/NCBI
|
|
29
|
Wang H, Zhang Q, Chai Y, Liu Y, Li F, Wang
B, Zhu C, Cui J, Qu H and Zhu M: 1,25(OH)2D3 downregulates the
Toll-like receptor 4-mediated inflammatory pathway and ameliorates
liver injury in diabetic rats. J Endocrinol Invest. 38:1083–1091.
2015. View Article : Google Scholar : PubMed/NCBI
|
|
30
|
Huang S, Rutkowsky JM, Snodgrass RG,
Ono-Moore KD, Schneider DA, Newman JW, Adams SH and Hwang DH:
Saturated fatty acids activate TLR-mediated proinflammatory
signaling pathways. J Lipid Res. 53:2002–2013. 2012. View Article : Google Scholar : PubMed/NCBI
|
|
31
|
Ye L, Kleiner S, Wu J, Sah R, Gupta RK,
Banks AS, Cohen P, Khandekar MJ, Boström P, Mepani RJ, et al: TRPV4
is a regulator of adipose oxidative metabolism, inflammation, and
energy homeostasis. Cell. 151:96–110. 2012. View Article : Google Scholar : PubMed/NCBI
|
|
32
|
Zeisel MB, Dhawan P and Baumert TF: Tight
junction proteins in gastrointestinal and liver disease. Gut.
68:547–561. 2018. View Article : Google Scholar
|
|
33
|
Krischer J, Gilbert A, Gorden P and
Carpentier JL: Endocytosis is inhibited in hepatocytes from
diabetic rats. Diabetes. 42:1303–1309. 1993. View Article : Google Scholar : PubMed/NCBI
|
|
34
|
Yang M, He RL, Benovic JL and Ye RD:
beta-Arrestin1 interacts with the Gprotein subunits beta1gamma2 and
promotes beta1gamma2-dependent Akt signalling for NF-kappaB
activation. Biochem J. 417:287–296. 2009. View Article : Google Scholar : PubMed/NCBI
|
|
35
|
Russell DW, Schneider WJ, Yamamoto T,
Luskey KL, Brown MS and Goldstein JL: Domain map of the LDL
receptor: Sequence homology with the epidermal growth factor
precursor. Cell. 37:577–585. 1984. View Article : Google Scholar : PubMed/NCBI
|
|
36
|
Zhang L, Fairall L, Goult BT, Calkin AC,
Hong C, Millard CJ, Tontonoz P and Schwabe JW: The IDOL-UBE2D
complex mediates sterol-dependent degradation of the LDL receptor.
Genes Dev. 25:1262–1274. 2011. View Article : Google Scholar : PubMed/NCBI
|
|
37
|
Bordone L and Guarente L: Calorie
restriction, SIRT1 and metabolism: Understanding longevity. Nat Rev
Mol Cell Biol. 6:298–305. 2005. View
Article : Google Scholar : PubMed/NCBI
|
|
38
|
Brooks CL and Gu W: How does SIRT1 affect
metabolism, senescence and cancer? Nat Rev Cancer. 9:123–128. 2009.
View Article : Google Scholar : PubMed/NCBI
|
|
39
|
Chang HC and Guarente L: SIRT1 and other
sirtuins in metabolism. Trends Endocrinol Metab. 25:138–145. 2014.
View Article : Google Scholar : PubMed/NCBI
|
|
40
|
Scott RA, Lagou V, Welch RP, Wheeler E,
Montasser ME, Luan J, Mägi R, Strawbridge RJ, Rehnberg E,
Gustafsson S, et al: Large-scale association analyses identify new
loci influencing glycemic traits and provide insight into the
underlying biological pathways. Nat Genet. 44:991–1005. 2012.
View Article : Google Scholar : PubMed/NCBI
|
|
41
|
Huyghe JR, Jackson AU, Fogarty MP,
Buchkovich ML, Stančáková A, Stringham HM, Sim X, Yang L,
Fuchsberger C, Cederberg H, et al: Exome array analysis identifies
new loci and low-frequency variants influencing insulin processing
and secretion. Nat Genet. 45:197–201. 2013. View Article : Google Scholar : PubMed/NCBI
|
|
42
|
Hara K, Fujita H, Johnson TA, Yamauchi T,
Yasuda K, Horikoshi M, Peng C, Hu C, Ma RC, Imamura M, et al:
Genome-wide association study identifies three novel loci for type
2 diabetes. Hum Mol Genet. 23:239–246. 2014. View Article : Google Scholar : PubMed/NCBI
|
|
43
|
Higurashi M, Ohya Y, Joh K, Muraguchi M,
Nishimura M, Terawaki H, Yagui K, Hashimoto N, Saito Y and Yamada
K: Increased urinary levels of CXCL5, CXCL8 and CXCL9 in patients
with Type 2 diabetic nephropathy. J Diabetes Complications 2009.
23:178–184. 2009. View Article : Google Scholar
|
|
44
|
Nawaz MI, Van Raemdonck K, Mohammad G,
Kangave D, Van Damme J, Abu El-Asrar AM and Struyf S: Autocrine
CCL2, CXCL4, CXCL9 and CXCL10 signal in retinal endothelial cells
and are enhanced in diabetic retinopathy. Exp Eye Res. 109:67–76.
2013. View Article : Google Scholar : PubMed/NCBI
|
|
45
|
Zychowska M, Rojewska E, Pilat D and Mika
J: The role of some chemokines from the CXC subfamily in a mouse
model of diabetic neuropathy. J Diabetes Res. 2015:7501822015.
View Article : Google Scholar : PubMed/NCBI
|
|
46
|
Yu J, Wu H, Liu ZY, Zhu Q, Shan C and
Zhang KQ: Advanced glycation end products induce the apoptosis of
and inflammation in mouse podocytes through CXCL9-mediated
JAK2/STAT3 pathway activation. Int J Mol Med. 40:1185–1193. 2017.
View Article : Google Scholar : PubMed/NCBI
|
|
47
|
Melander O, Maisel AS, Almgren P, Manjer
J, Belting M, Hedblad B, Engström G, Kilger U, Nilsson P, Bergmann
A and Orho-Melander M: Plasma proneurotensin and incidence of
diabetes, cardiovascular disease, breast cancer, and mortality.
JAMA. 308:1469–1475. 2012. View Article : Google Scholar : PubMed/NCBI
|
|
48
|
Li J, Song J, Zaytseva YY, Liu Y, Rychahou
P, Jiang K, Starr ME, Kim JT, Harris JW, Yiannikouris FB, et al: An
obligatory role for neurotensin in high fat diet-induced obesity.
Nature. 533:411–415. 2016. View Article : Google Scholar : PubMed/NCBI
|
|
49
|
Léon C, Freund M, Latchoumanin O, Farret
A, Petit P, Cazenave JP and Gachet C: The P2Y1 receptor is involved
in the maintenance of glucose homeostasis and in insulin secretion
in mice. Purinergic Signal. 2005:145–151. 2005. View Article : Google Scholar
|
|
50
|
Breuker C, Amouzou C, Fabre O, Lambert K,
Seyer P, Bourret A, Salehzada T, Mercier J, Sultan A and Bisbal C:
Decreased RNF41 expression leads to insulin resistance in skeletal
muscle of obese women. Metabolism. 83:81–91. 2018. View Article : Google Scholar : PubMed/NCBI
|
|
51
|
Pearson G and Soleimanpour SA: A
ubiquitin-dependent mitophagy complex maintains mitochondrial
function and insulin secretion in beta cells. Autophagy.
14:1160–1161. 2018. View Article : Google Scholar : PubMed/NCBI
|