Introduction
Chronic myeloid leukemia (CML) is a clonal
hematopoietic stem cell disease and its incidence among all adult
leukemia cases is 10–15% (1,2). CML is more common in middle-aged
patients, and may be associated with malnutrition, night sweats,
hematopenia and bleeding (3). CML
may be divided into the chronic, accelerated and blast phases, and
the majority of the patients are in the chronic phase at the time
of diagnosis (4,5). Imatinib mesylate (IM) was the first
tyrosine kinase inhibitor (TKI) to be used for the treatment of CML
in clinical settings, and has provided a survival benefit by
restoring normal hematopoiesis and achieving hematological,
cytogenetic and molecular remission (6). However, despite the satisfactory
efficacy of IM and second- and third-generation TKIs, a proportion
of patients display varying degrees of resistance (7). Therefore, it is crucial to further
investigate the molecular mechanism underlying the development of
drug resistance and identify new targets to overcome this
resistance.
The main components of the insulin-like growth
factor (IGF) axis include the type 1 IGF receptor and insulin
receptor, ligands (IGF-1 and IGF-2) and IGF binding proteins
(IGFBPs) (8,9). IGF is a type of multifunctional cell
proliferation regulator (10).
IGFBPs play an essential role in the proliferation and
differentiation of various cell types, and body development
(11). It was previously
demonstrated that the transmembrane tyrosine kinase receptor on the
cell surface mainly mediates the biological functions of the IGF
axis, and six IGDBPs mainly regulate its activity (12,13).
Signal dysregulation has been associated with chemoresistance and
radioresistance (14). The role of
the IGF axis in tumors, such as malignant renal tumors,
gastrointestinal cancer, breast cancer and hematological
malignancies has been extensively investigated (15,16).
However, it remains unclear whether the IGF axis plays a role in IM
resistance of CML.
In the present study, protein microarray technology
was used to assess differentially expressed proteins (DEPs) in K562
cells and K562/G (IM-resistant K562) cells. An apoptosis antibody
array was used to screen 46 proteins in the cells, among which 20
proteins, differentially expressed between K562 and K562/G cells,
were identified. Reverse transcription-quantitative (RT-q)PCR and
western blot analyses were used to detect the levels of IGFBP-1,
IGFBP-2 and IGFBP-3 in K562 and K562/G cells. In addition, the
expression levels of IGFBP-1, IGFBP-2 and IGFBP-3 were detected in
the peripheral blood (PB) of healthy individuals, patients with
optimal response and patients with treatment failure. Furthermore,
it was investigated whether there were correlations between IGFBP
levels and BCR-ABL, in order to determine whether IGFBPs may be of
value as a specific protein marker of imatinib resistance in CML.
The findings of the present study may help identify novel targets
for the treatment of CML.
Materials and methods
Cell culture and treatment
Human CML K562 cells were obtained from the Shanghai
Institute of Life Sciences. The IM-resistant clone K562/G was
obtained by constant exposure to increasing IM concentrations of up
to 15 µmol/l. The K562 and K562/G cells were grown in Iscove's
Modified Dulbecco's medium supplemented with 10% FBS (both
purchased from Gibco; Thermo Fisher Scientific, Inc.) and 1%
penicillin-streptomycin. In addition, the K562/G cells were
cultured in the continuous presence of 1 µmol/l imatinib. The
methods for the detection of cell drug resistance, were as
mentioned in an earlier study (17).
The K562/G cells exhibited significantly higher resistance to IM,
with >50-fold increase of the IC50 value, compared with K562
cells.
Human subjects and blood samples
CML patients who were treated by chemotherapy at the
Anhui Provincial Hospital between March 2018 and April 2019 were
recruited in the present study. The study protocols were approved
by the Institutional Review Board of Anhui Provincial Hospital and
informed consent was obtained from all participants, according to
the principles outlined in the Declaration of Helsinki. The
patients were divided into different groups according to the
therapeutic effect and time of treatment. A total of 19 healthy
individuals served as control subjects. The patients were newly
diagnosed and treated with IM 400 mg/day. All CML samples were
subjected to cytogenetic analysis and RT-qPCR. The response to
treatment was evaluated according to the relevant guidelines
(18). Patients whose response
lasted for at least 6 months, without discontinuing or changing
drugs, were recruited into the corresponding group (optimal
response or treatment failure). The remaining patients were divided
into four groups according to the duration of treatment. Clinical
data on all subjects are summarized in Tables I and II. PB samples were collected from the
subjects and PB mononuclear cells were isolated using gradient
centrifugation (400 × g for 20 min at room temperature) by layering
on top of Ficoll (GE Healthcare). Total RNA was extracted and
stored at −80°C until further use.
 | Table I.Clinical characteristics of patients
with optional responses and response failure. |
Table I.
Clinical characteristics of patients
with optional responses and response failure.
| Group | Optional responses
(n=21) | Response failure
(n=19) |
|---|
| Age | 44.43±13.59 | 41.95+15.77 |
| Sex |
|
|
|
Male | 12 | 9 |
|
Female | 9 | 10 |
| White blood cells
(109/ml) | 9.06±4.36 | 63.55+65.13 |
| BCR/ABL
international scale (%) | 0.03±0.08 | 19.17±17.61 |
| Table II.Clinical characteristics of patients
taking medicine for different durations. |
Table II.
Clinical characteristics of patients
taking medicine for different durations.
| Group | Untreated | <6 months | 6–12 months | >12 months |
|---|
| Age | 47.15±18.74 | 43.20±16.56 | 44.14±17.27 | 39.74±11.74 |
| Sex |
|
|
|
|
|
Male | 11 | 9 | 8 | 15 |
|
Female | 9 | 6 | 5 | 12 |
| White blood cells
(109/ml) | 75.97±80.21 | 34.37±48.45 | 24.88±54.14 | 7.48±7.57 |
| BCR/ABL
international scale (%) | 66.46±65.34 | 10.08±15.36 | 3.12±5.65 | 3.12±10.51 |
Apoptosis antibody array
processing
An apoptosis antibody array (Ray Biotech, Inc.) was
used to explore the differences in the apoptotic protein profile
between K562 and K562/G cells. First, 100 µl of blocking solution
was added to each well and incubated for 1 h at room temperature.
Second, the blocking solution was removed, 100 µl sample was added
to each well (500 µg/ml) and washed with Wellwash Versa chip
(Thermo Fisher Scientific, Inc.). Third, 300 µl blocking solution
and 70 µl biotin-labeled antibody were added to each well; after
incubating for 2 h at room temperature, 70 µl of 1,500-fold diluted
fluorescent dye-streptavidin conjugate was added to each well.
Finally, the signal was scanned by an Axon MaPix laser scanner
(Molecular Devices, LLC) and data analysis was performed with
software specific for Human Apoptosis Array G1 (AAH-APO-G1). DEPs
were defined as those with fold-change >1.2 or <0.83, and a
fluorescent value >150 according to the manufacturer's protocol
to observe more differential proteins and further verify them in
subsequent experiments. In order to analyze the related pathways
that were enriched in the DEPs, Kyoto Encyclopedia of Genes and
Genomes (KEGG) pathway (https://www.genome.jp/kegg/) with the R package
‘clusterProfiler’ (v3.0.4) (19) was
performed to link genomic information with higher-order functional
information. Specifically, the method used was Fisher's precise
inspection and the number was derived from R/Bioconductor according
to the ‘clusterProfiler’ package. The selection criteria were the
number of genes that fall on a certain term/pathway ≥5 and
P<0.05. The term/pathway obtained in the pathway is arranged in
descending order according to the count value.
RNA extraction and RT-qPCR
analysis
RNA was isolated and cDNA was prepared as described
previously (20). The Power
SYBR® Green PCR Master Mix (Applied Biosystems; Thermo
Fisher Scientific, Inc.) was used for RT-qPCR and the PCR primers
are shown in Table III. The mRNA
levels were normalized to GAPDH. The changes in mRNA expression
levels were calculated using the comparative Cq method, as follows:
Fold-change=2−ΔΔCq (21).
Healthy patients' data and untreated patients would be set to ‘1’
and the other groups' expression levels shown ‘relative’ to that.
The PCR conditions for all genes were as follows: Initial
activation at 95°C for 30 sec, followed by 40 cycles at 95°C for 3
sec and at 60°C for 30 sec. Fluorescence determination at the
melting temperature of the product for 20 sec was performed on a
QuantStudio™ 5 Real-Time PCR instrument (Applied Biosystems; Thermo
Fisher Scientific, Inc.).
| Table III.Primers for reverse
transcription-quantitative PCR. |
Table III.
Primers for reverse
transcription-quantitative PCR.
| Gene | Primer sequence
(5′-3′) |
|---|
| IGFBP-1 | F:
CACAGGGTATGGCTC |
|
| R:
CTTCTGGGTCTTGGG |
| IGFBP-2 | F:
CGATGCTGGTGCTTCTCA |
|
| R:
GGGGTCTTGGGTGGG |
| IGFBP-3 | F:
CTCTCCCAGGCTACACCA |
|
| R:
GAAGTCTGGGTGCTGTGC |
| GAPDH | F:
GAGCGAGATCCCTCCAAAAT |
|
| R:
GGCTGTTGTCATACTTCTCATGG |
Western blot analysis
Cells were prepared for protein extraction using
RIPA buffer containing a protease inhibitor cocktail (Beyotime
Institute of Biotechnology) according to the manufacturer's
protocol. The protein concentration was estimated by the Enhanced
BCA Protein Assay kit (Beyotime Institute of Biotechnology).
Protein (40 µg) samples were separated on 12% SDS-PAGE, followed by
transfer to a PVDF membrane; the membranes were then blocked in 5%
skimmed milk for 1.5 h at 37°C. The membrane was subsequently
incubated with specific antibodies: IGFBP-1 (1:1,000; cat. no.
31025T; Cell Signaling Technology, Inc.), IGFBP-2 (1:1,000; cat.
no. 3922S; Cell Signaling Technology, Inc.), IGFBP-3 (1:1,000; cat.
no. 13216S; Cell Signaling Technology, Inc.) and β-actin
(1:100,000; cat. no. AC026; ABclonal). On the following day, TBS
containing 0.1% Tween 20 was used to wash the membrane again for 15
min. Then, the membranes were incubated with horseradish peroxidase
conjugated-Goat Anti-Rabbit IgG (H+L) (1:50,000; cat. no. A21020;
Abbkine Scientific Co., Ltd.) for 1 h at 37°C before washing the
membrane for 15 min once again. Finally, the membranes were treated
with BeyoECL Moon (P0018FS; Beyotime Institute of Biotechnology)
and digitalized by scanning (Fusion Solo3 v 16.12; Fusion FX;
VilberLourmat).
Statistical analysis
Protein microarray data were statistically analyzed
with the ‘R’ programming language (R version 3.6.2) (22). After raw data were normalized by the
software, DEPs were screened by fold-change and P-value. Data are
expressed as the mean ± SD of three independent experiments. All
statistical analyses were performed with the SPSS software, version
17.0 (SPSS, Inc.). Differences between two cells lines were
determined by Student's t-test. One-way ANOVA and Bonferroni's post
hoc test were used in the analysis of the differential expression
of IGFBPs in human subjects. Non-parametric Spearman's correlation
was used to analyze the association between two indicators.
P<0.05 was considered to indicate a statistically significant
difference.
Results
Analysis of apoptosis antibody array
data
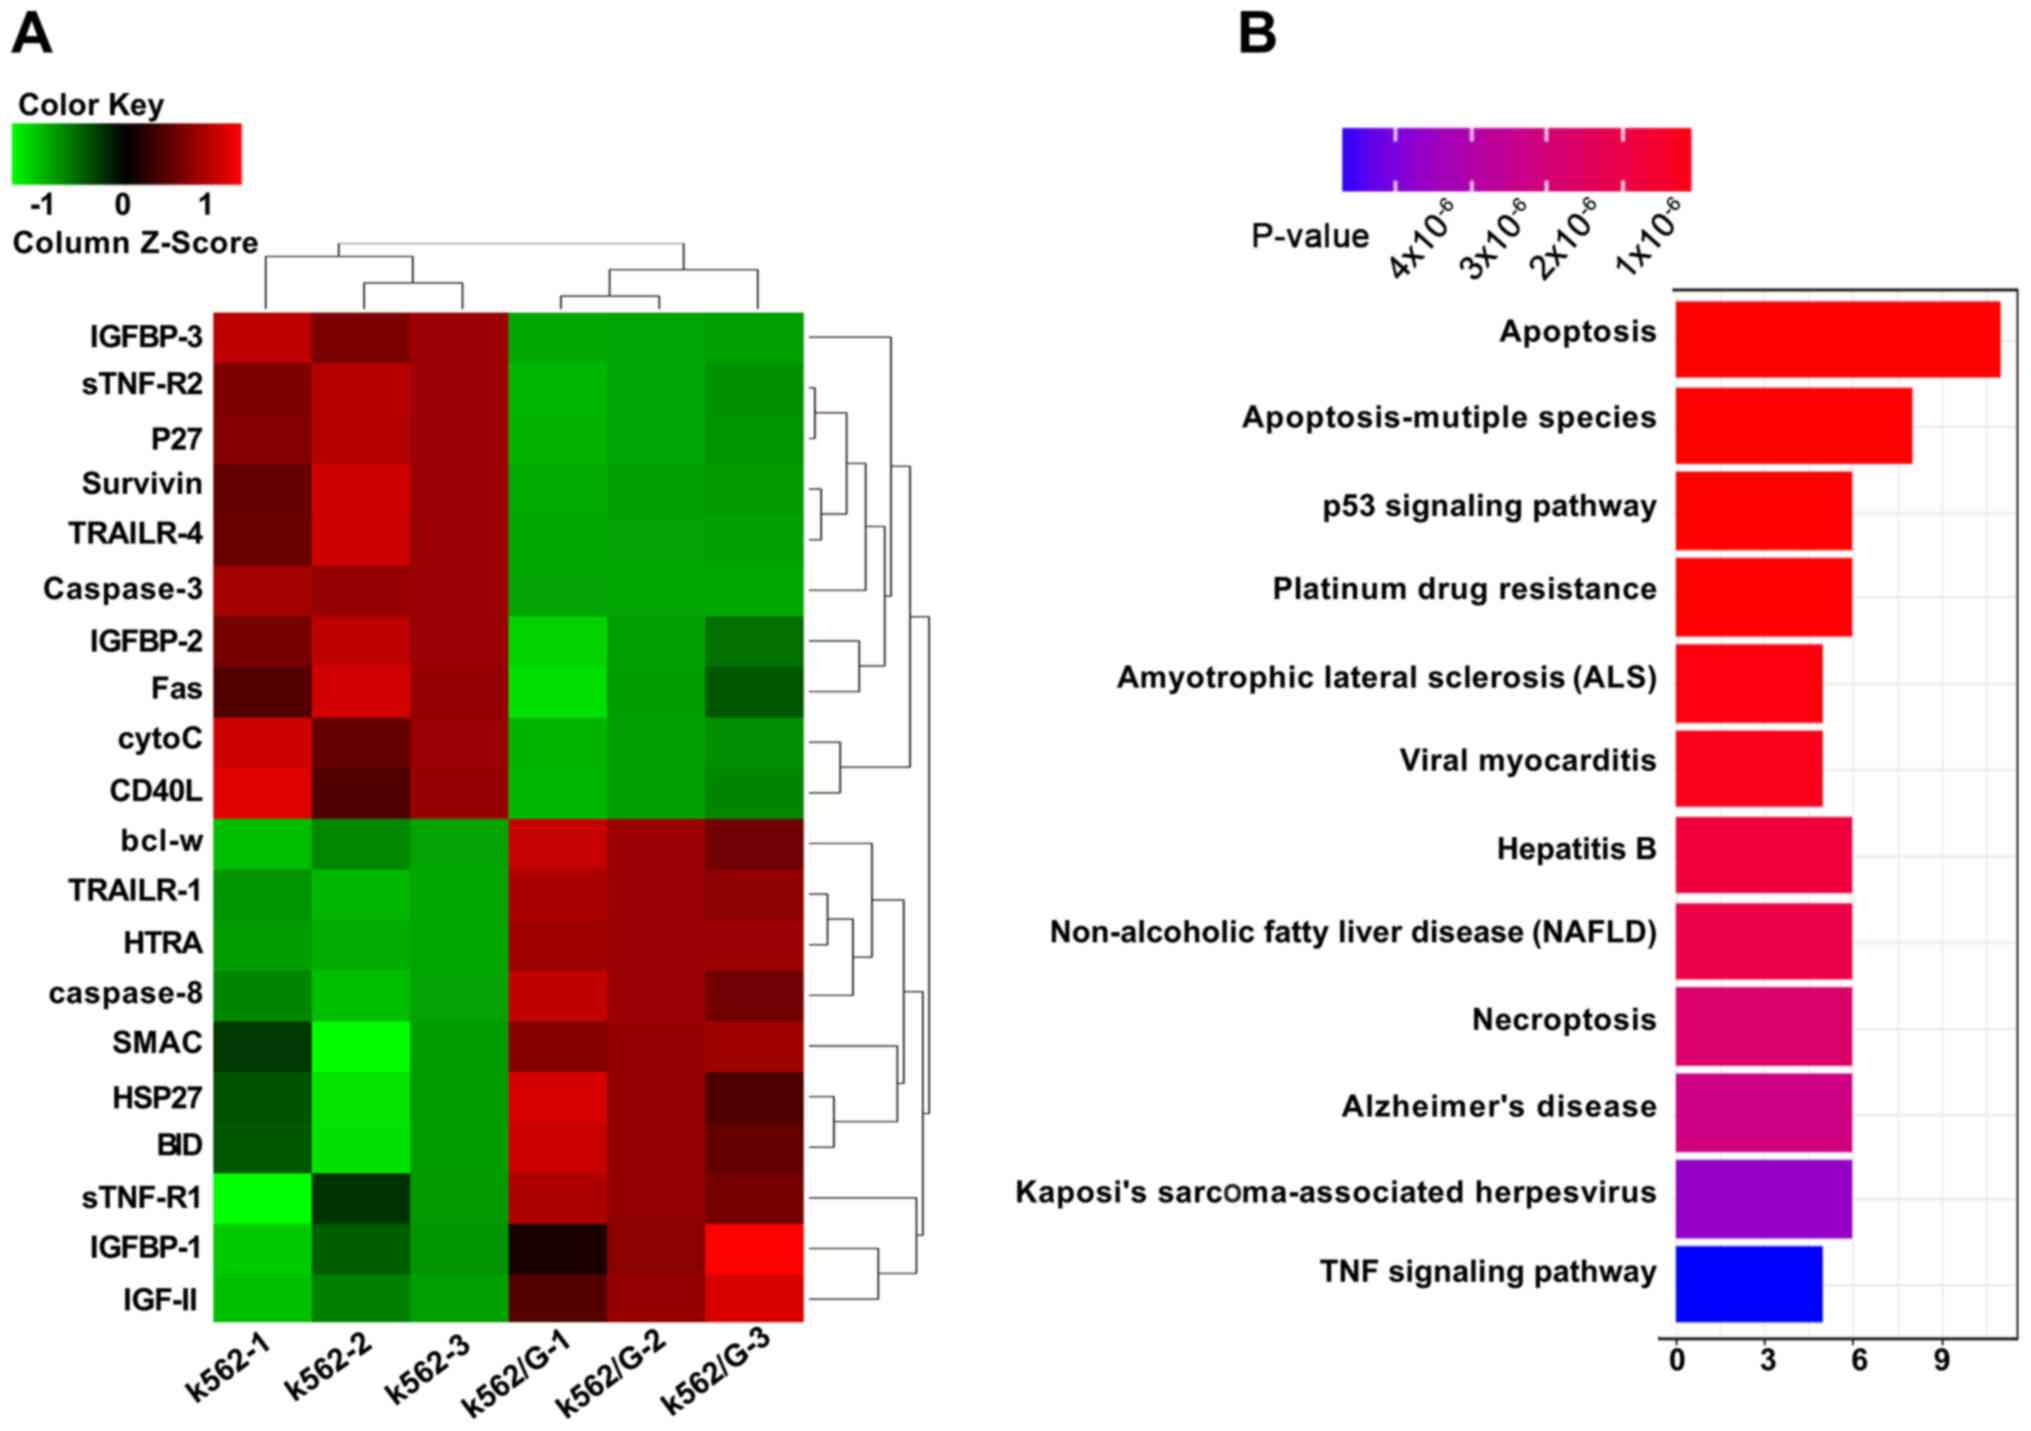
In the present study, a total of 46 proteins
associated with apoptosis were detected, 20 of which were found to
be differentially expressed between K562 and K562/G cells. To
identify DEPs, the fold-change of each protein was analyzed
individually between two groups. It was observed that the levels of
BCL-w, TRAILER-1, HTRA, caspase-8, SMAC, HSP27, BID, Stnf-R1,
IGFBP-1 and IGF-II were increased in K562/G cells, while those of
IGFBP-3, Stnf-R2, P27, Survivin, TRAILER-4, caspase-3, IGFBP-2,
FAS, cytoC and CD40L were decreased. Among these DEPs, IGFBP-1,
IGFBP-2 and IGFBP-3 were significantly different between K562 and
K562/G cells (Fig. 1A). Furthermore,
enrichment of the KEGG pathway with the R package ‘clusterProfiler’
was performed to analysis these pathways mainly enriched in the
DEPs. A total of 12 pathways were mainly enriched in the DEPs,
including apoptosis, apoptosis-multiple species and the p53
signaling pathway (Fig. 1B).
IGFBP-1, IGFBP-2 and IGFBP-3 are
differentially expressed in cells and CML patients
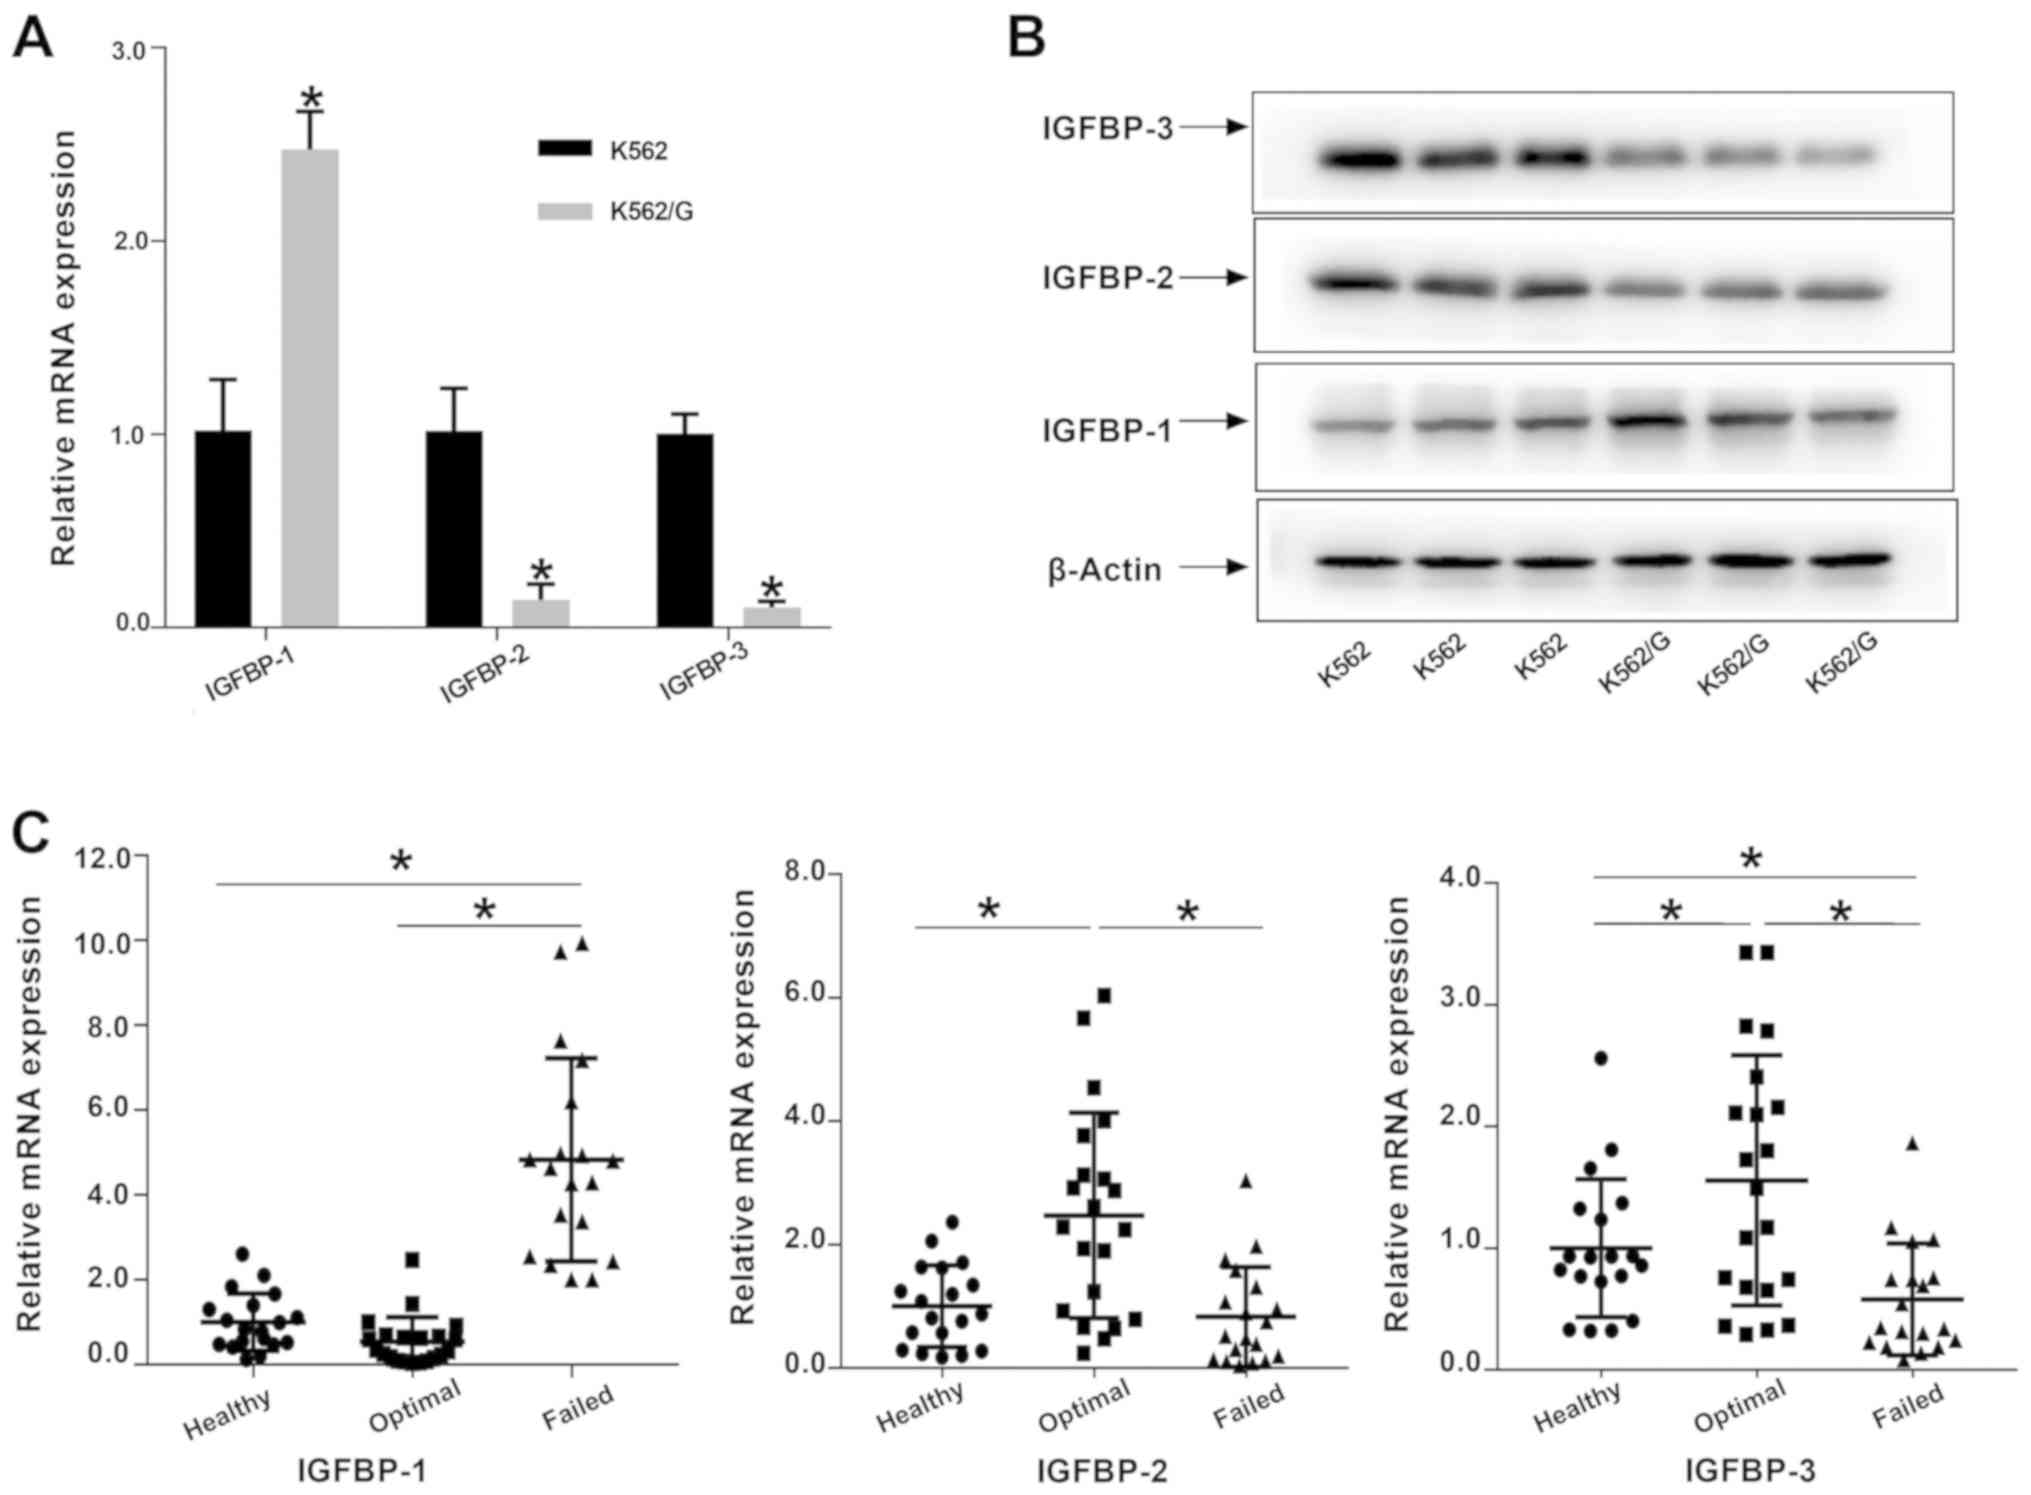
After apoptosis antibody array analysis, RT-qPCR and
western blot analyses were conducted to validate microarray data.
The results of the RT-qPCR analysis revealed that the expression
levels of the IGFBP-1 were significantly increased in K562/G cells
compared with K562 cells (P<0.05; Fig. 2A); conversely, the levels of IGFBP-2
and IGFBP-3 were lower. The results of western blotting were
consistent with those of RT-qPCR analysis (Fig. 2B). Furthermore, significantly
increased IGFBP-1 expression was observed in patients with
treatment failure, compared with that in patients with optimal
responses and healthy individuals (P<0.05). In addition, the
mRNA expression of IGFBP-2 and IGFBP-3 in the patients with optimal
response was significantly increased compared with that in healthy
individuals and patients with treatment failure (Fig. 2C).
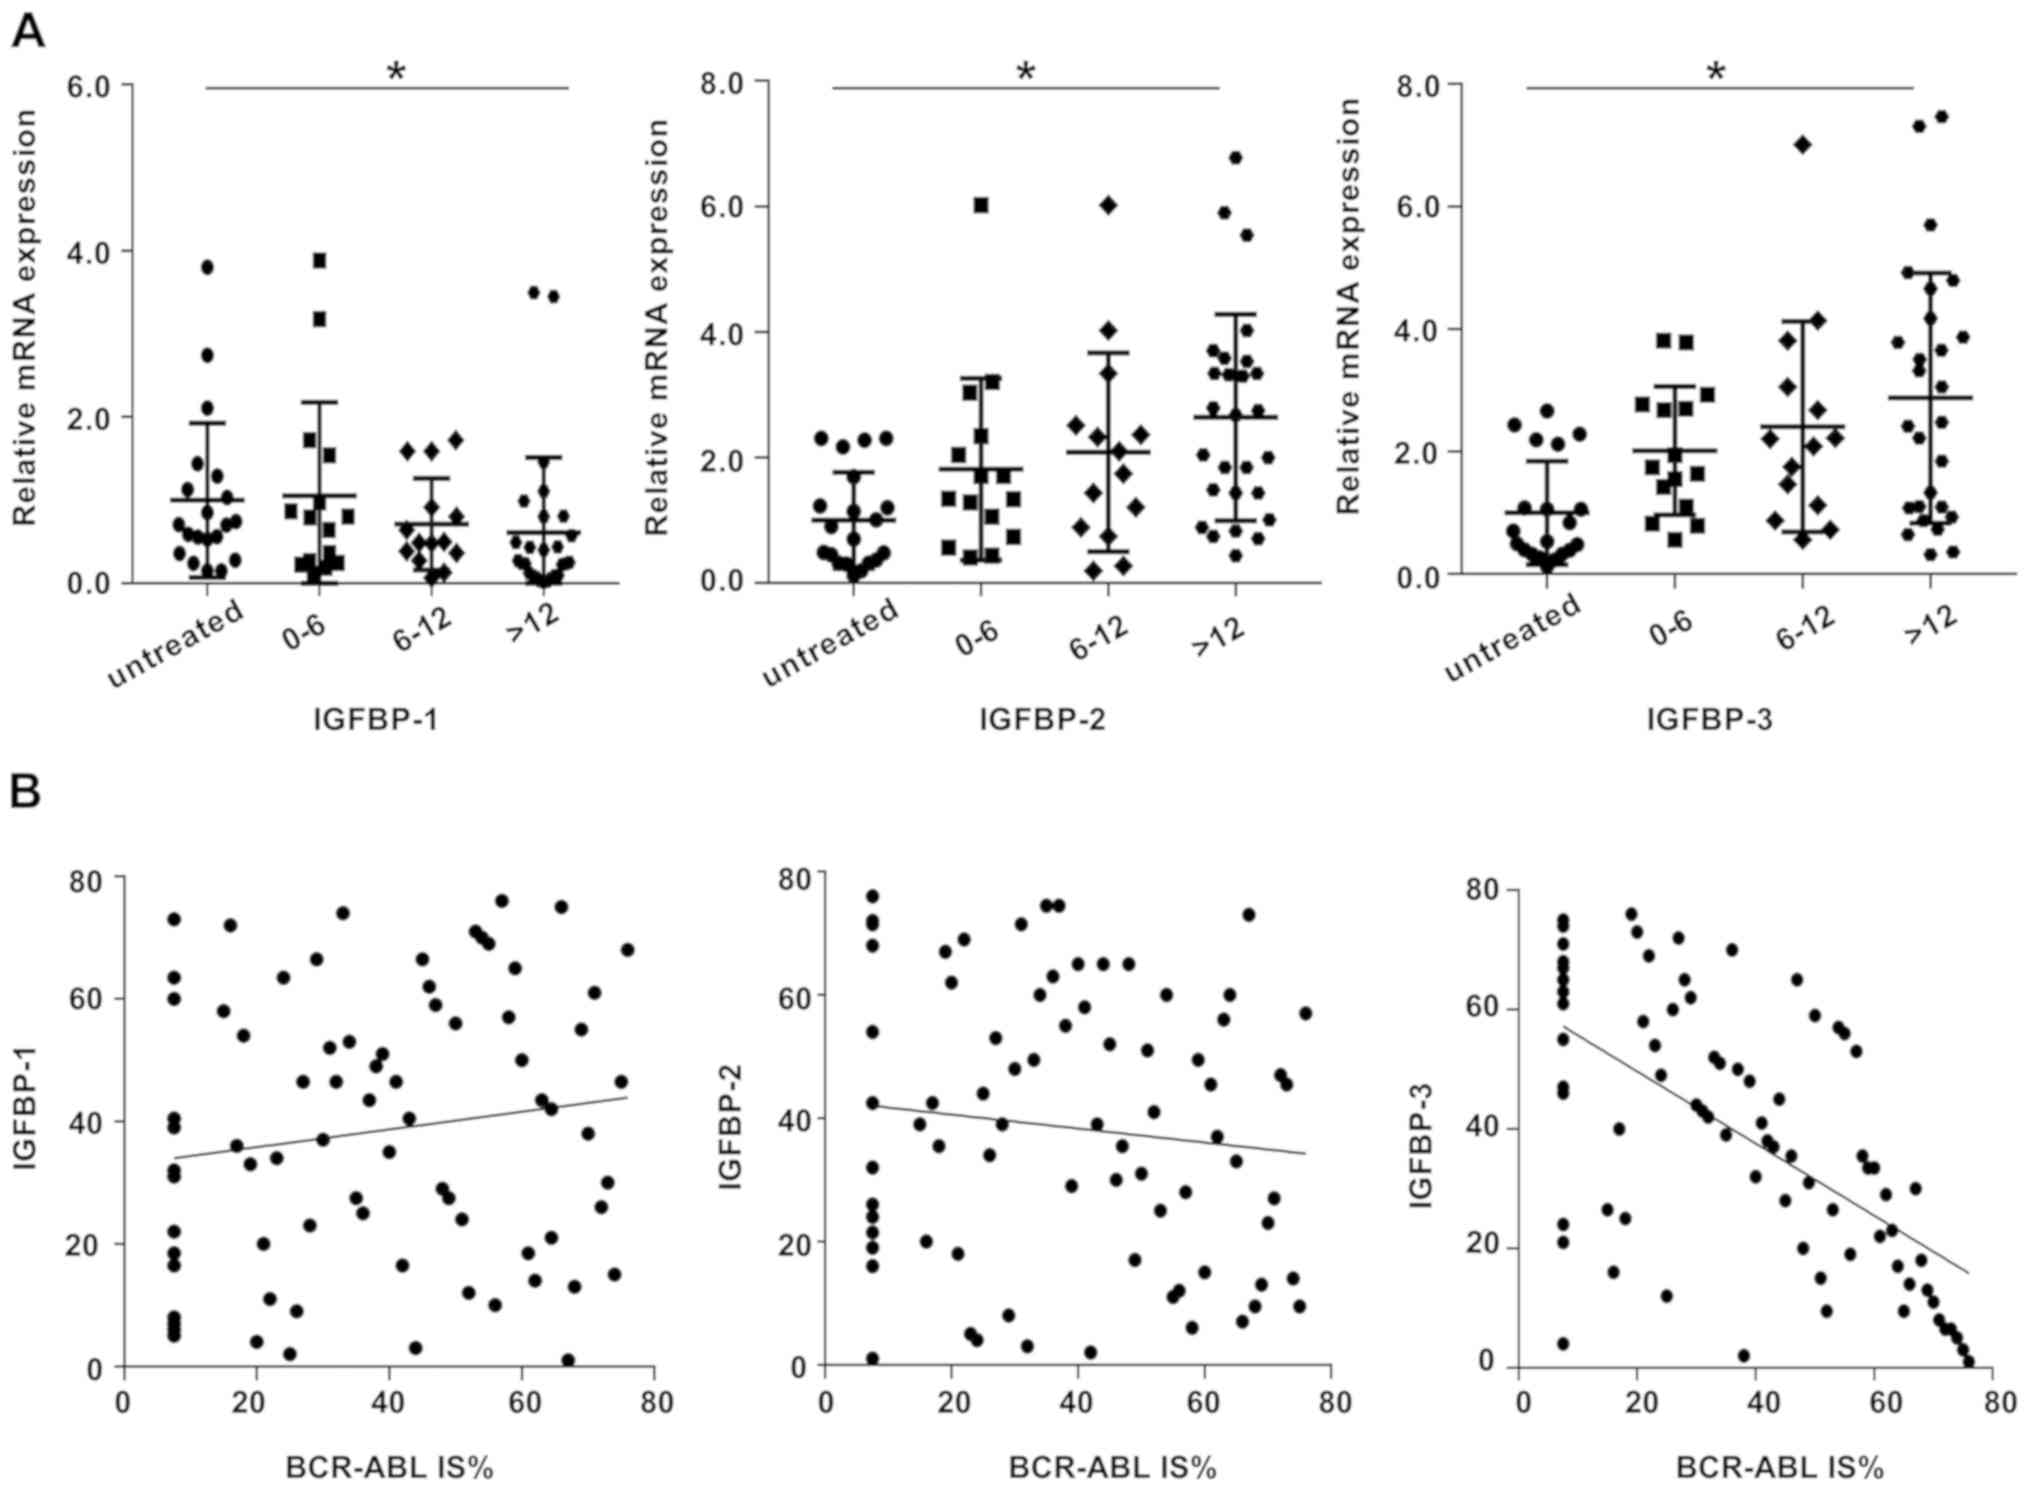
Expression of IGFBP-1, IGFBP-2 and
IGFBP-3 by medication time and association with BCR-ABL
The patients were divided into four groups to
further investigate the changes of IGFBPs in PB of CML patients
with prolonged treatment time. RT-qPCR was used to detect the
expression of IGFBP-1, IGFBP-2 and IGFBP-3 in the PB of patients in
each group. The present study compared each treatment group with
the untreated group. The results revealed that IGFBP-1 was
significantly increased in untreated patients compared with
patients who had been receiving IM for >12 months (P<0.05).
Conversely, IGFBP-2 and IGFBP-3 were decreased in the PB of
untreated patients compared with those treated (Fig. 3A). There was no significant
difference among the groups whose medication time was <12
months. No significant correlation was found between IGFBP-1 or
IGFBP-2 and the level of BCR-ABL (r=0.144, P>0.05 and r=−0.112,
P>0.05, respectively). However, a decrease in IGFBP-3 levels was
observed with increasing BCR-ABL levels (r=−0.602, P<0.0001;
Fig. 3B).
Discussion
IM is currently the main agent used for the
treatment of CML. IM can inhibit the proliferation of leukemic
cells and promote their apoptosis by targeting the BCR-ABL fusion
gene and inhibiting the activity of the BCR-ABL fusion protein
(23,24). The advent of imatinib has markedly
improved the survival rate of CML patients and certain shortcomings
were overcome by the second- and third-generation TKIs (25,26).
Unfortunately, IM resistance in CML is a frequent occurrence and
poses a major clinical challenge in the successful treatment of
CML. The most common cause of TKI resistance is gene mutations of
BCR-ABL1, which usually occur at a frequency of 40–90% (27). Other drug resistance mechanisms
include abnormal expression of Src family kinase, an epigenetic
mechanism, abnormal expression of tumor drug resistance-associated
proteins, increased telomerase activity and the presence of
leukemic stem cells (28–32). The research for targets apart from
BCR-ABL1 is crucial for the treatment of CML.
To the best of our knowledge, the present study is
the first to propose a high-throughput robust protein array method,
which has enough clinical specificity and sensitivity, for
identifying new protein targets. As an advanced new tool, protein
chip technology has developed rapidly in recent years (33,34). Its
basic principle is that all types of proteins are fixed on various
carriers in an orderly manner. The designated, labeled antibodies
can be matched by chromatin immunoprecipitation (ChIP). The
fluorescent antibody is matched to the corresponding protein and
the corresponding signal indicates the expression level of the
protein. All other antimicrobial agents that are not complementary
are washed away and the samples are evaluated by fluorescence
scanners or laser scanning techniques. By analyzing the
fluorescence intensity of each point on the chip and the
interaction between proteins, the expression level of the related
proteins can be evaluated. A total of 46 apoptosis-related proteins
were detected and 20 DEPs were screened out and enriched with KEGG,
and these proteins were found to play a role in 12 regulatory
pathways, including the apoptosis signaling pathway, the p53
signaling pathway and the tumor necrosis factor signaling
pathway.
The authors previously demonstrated that the p53
signaling pathway that regulates redox status plays an essential
role in IM resistance (17). The
study had revealed that IGFBP-1 acts as a negative regulator of
BAK-dependent apoptosis and its expression is involved in the
transcriptional and mitochondrial functions of the p53 tumor
suppressor protein (35). However,
the role of IGFBP in CML resistance is unclear. IGFBP-1, IGFBP-2
and IGFBP-3 proteins, which were significantly different in the
results of a protein chip, were selected and a follow-up study was
performed.
The expression of IGFBP-1, IGFBP-2 and IGFBP-3 in
the K562 and K562/G cell lines was detected by RT-qPCR and western
blot analyses to confirm the results of the protein ChIP analysis.
The results demonstrated that the level of IGFBP-1 in the
drug-resistant cell line K562/G was increased compared with that in
K562, while the levels of IGFBP-2 and IGFBP-3 were lower,
consistent with the results of the antibody array.
Similarly, the level of IGFBP-1 in the PB of
patients with drug resistance was increased compared with that in
IM-sensitive patients and healthy subjects, while the levels of
IGFBP-2 and IGFBP-3 were lower. Previous mechanistic investigations
revealed that IGFBP-1 plays a role via a mechanism involving the
extracellular signal regulated kinase (ERK)/c-Jun pathway (36). IGFBP2 induced the apoptosis of tumor
cells through the PI3K/protein kinase B/inhibitor of NF-κB kinase
subunit β pathway (37). However,
IGFBP3 gene silencing mediated inhibition of ERK/mitogen associated
protein kinase signaling pathway on proliferation, apoptosis,
autophagy and cell senescence (38).
In addition, the content and ratio of IGFBP-1 and IGFBP-3 play an
important role in the occurrence, development and prognosis of the
tumor (39). In the present study,
the levels of IGFBP-1 in patients who have been receiving IM for
>12 months were lower compared with those in the untreated
group, whereas IGFBP-2 and −3 exhibited the opposite results. Such
differences may arise from the change of cellular components in CML
patients receiving long-term IM treatment, which should be further
confirmed in future studies. No significant correlation between
IGFBP-1 or IGFBP-2 and the level of BCR-ABL was observed. A
decrease in the levels IGFBP-3 was observed with increasing BCR-ABL
levels. These results indicate that the role of IGFBP-3 in IM
resistance may depend on the level of BCR-ABL, which is not the
case for IGFBP-1 and IGFBP-2. This suggests that IGFBPs may play a
role in IM resistance, but it is not clear which IGFBP plays the
dominant role. However, these results indicate that the protein
array is a powerful tool for biomedical discovery. IGFBPs may play
a key role in the development of drug resistance in CML and
IGFBP-1, IGFBP-2 and IGFBP-3 may represent potential therapeutic
targets. However, the specific underlying mechanism requires
further verification.
IGFBPs are a family of proteins binding to IGFs,
including 6 high-affinity IGFBPs, namely IGFBP-1 through IGFBP-6
(40). IGFBP family members may be
useful prognostic biomarkers in various malignancies and have been
indicated to be involved in the development and progression of
tumors (41). Previous studies
validated the role of IGFBPs in the diagnosis and prognosis
prediction of certain solid tumors, including rectal, ovarian and
pancreatic (42–44). IGFBP-1 is abundantly expressed in the
liver and decidualized endometrium, and mainly functions in the
intracellular and pericellular compartments to regulate cell growth
and survival (45,46). In addition, IGFBP-1 can perform
IGF-independent functions, such as transcriptional regulation,
nuclear localization, modulation of other growth factors and
binding to non-IGF molecules involved in tumorigenesis, and tumor
growth, metastasis and progression (47,48). In
humans, IGFBP-2 is the second most abundant IGFBP in the blood
(49). High levels of IGFBP-2 have
been detected in the serum of cancer patients with a poor
prognostic outcome (50,51). In addition to its role as a secretory
protein, the intracellular oncogenic functions of IGFBP-2 promote
cancer cell proliferation, invasion, metastasis and drug resistance
(52,53). IGFBP-3 is the most abundant IGFBP and
accounts for 80% of all IGF binding (54). Moreover, low serum IGFBP-3 levels or
free IGFBP-3 levels, which are assessed by the molar difference of
IGFBP-3 and IGF-1, increase the risk of tumors (55,56). The
present study demonstrated that the IGFBP-1 level was higher in the
PB of patients with drug resistance compared with IM-sensitive
patients and healthy subjects, whereas the levels of IGFBP-2 and
IGFBP-3 were lower, suggesting that IGFBP-1, IGFBP-2 and IGFBP-3
may be novel biomarkers of IM resistance.
In summary, the present study assessed K562 and
K562/G cells by protein arrays. RT-qPCR and western blot analyses
were used to confirm the results. Of note, the results were
obtained from clinical samples and they suggest that IGFBPs may
represent novel targets for the treatment of IM resistance in
CML.
Acknowledgements
Not applicable.
Funding
The present study was supported by the Anhui
Provincial Natural Science Foundation (grant no. 1708085MH223).
Availability of data and materials
The datasets used and/or analyzed during the current
study are available from the corresponding author on reasonable
request.
Authors' contributions
YR and XX contributed to study design and
preparation for the manuscript. YR, SY and YL contributed to the
acquisition, the analysis and interpretation of data. All authors
read and approved the manuscript.
Ethics approval and consent to
participate
The study protocols were approved by the
Institutional Review Board of Anhui Provincial Hospital and
informed consent was obtained from all participants, according to
the principles outlined in the Declaration of Helsinki.
Patient consent for publication
Not applicable.
Competing interests
All the authors declare that they have no competing
interests.
References
|
1
|
Radich JP, Deininger M, Abboud CN, Altman
JK, Berman E, Bhatia R, Bhatnagar B, Curtin P, DeAngelo DJ, Gotlib
J, et al: Chronic myeloid leukemia, version 1.2019, NCCN clinical
practice guidelines in oncology. J Natl Compr Canc Netw.
16:1108–1135. 2018. View Article : Google Scholar : PubMed/NCBI
|
|
2
|
Pan P, Wang L, Wang Y, Shen L, Zheng P, Bi
C, Zhang A, Lv Y, Xue Z, Sun M, et al: Systematic review and
meta-analysis of-new-generation tyrosine kinase inhibitors versus
imatinib for newly diagnosed chronic myeloid leukemia. Acta
Haematol. 1–13. 2019.(Epub ahead of print). View Article : Google Scholar
|
|
3
|
Aladağ E and Haznedaroğlu İC: Current
perspectives for the treatment of chronic myeloid leukemia. Turk J
Med Sci. 49:1–10. 2019.PubMed/NCBI
|
|
4
|
Radich JP: The biology of CML blast
crisis. Hematology Am Soc Hematol Educ Program. 384–391. 2007.
View Article : Google Scholar : PubMed/NCBI
|
|
5
|
Sillaber C, Mayerhofer M, Agis H, Sagaster
V, Mannhalter C, Sperr WR, Geissler K and Valent P: Chronic myeloid
leukemia: Pathophysiology, diagnostic parameters, and current
treatment concepts. Wien Klin Wochenschr. 115:485–504. 2003.
View Article : Google Scholar : PubMed/NCBI
|
|
6
|
Anstrom KJ, Reed SD, Allen AS, Glendenning
GA and Schulman KA: Long-term survival estimates for imatinib
versus interferon-alpha plus low-dose cytarabine for patients with
newly diagnosed chronic-phase chronic myeloid leukemia. Cancer.
101:2584–2592. 2004. View Article : Google Scholar : PubMed/NCBI
|
|
7
|
Rossari F, Minutolo F and Orciuolo E:
Past, present, and future of Bcr-Abl inhibitors: From chemical
development to clinical efficacy. J Hematol Oncol. 11:842018.
View Article : Google Scholar : PubMed/NCBI
|
|
8
|
Puche JE and Castilla-Cortázar I: Human
conditions of insulin-like growth factor-I (IGF-I) deficiency. J
Transl Med. 10:2242012. View Article : Google Scholar : PubMed/NCBI
|
|
9
|
Yakar S and Isaksson O: Regulation of
skeletal growth and mineral acquisition by the GH/IGF-1 axis:
Lessons from mouse models. Growth Horm IGF Res. 28:26–42. 2016.
View Article : Google Scholar : PubMed/NCBI
|
|
10
|
Pais RS, Moreno-Barriuso N,
Hernández-Porras I, López IP, De Las Rivas J and Pichel JG:
Transcriptome analysis in prenatal IGF1-deficient mice identifies
molecular pathways and target genes involved in distal lung
differentiation. PLoS One. 8:e830282013. View Article : Google Scholar : PubMed/NCBI
|
|
11
|
Kelly GM, Buckley DA, Kiely PA, Adams DR
and O'Connor R: Serine phosphorylation of the insulin-like growth
factor I (IGF-1) receptor C-terminal tail restrains kinase activity
and cell growth. J Biol Chem. 287:28180–28194. 2012. View Article : Google Scholar : PubMed/NCBI
|
|
12
|
Firth SM and Baxter RC: Cellular actions
of the insulin-like growth factor binding proteins. Endocr Rev.
23:824–854. 2002. View Article : Google Scholar : PubMed/NCBI
|
|
13
|
Takahashi SI: IGF research 2016–2018.
Growth Horm IGF Res. 48-49:65–69. 2019. View Article : Google Scholar : PubMed/NCBI
|
|
14
|
Alvino CL, Ong SC, McNeil KA, Delaine C,
Booker GW, Wallace JC and Forbes BE: Understanding the mechanism of
insulin and insulin-like growth factor (IGF) receptor activation by
IGF-II. PLoS One. 6:e274882011. View Article : Google Scholar : PubMed/NCBI
|
|
15
|
Li H, Batth IS, Qu X, Xu L, Song N, Wang R
and Liu Y: IGF-IR signaling in epithelial to mesenchymal transition
and targeting IGF-IR therapy: Overview and new insights. Mol
Cancer. 16:62017. View Article : Google Scholar : PubMed/NCBI
|
|
16
|
King H, Aleksic T, Haluska P and Macaulay
VM: Can we unlock the potential of IGF-1R inhibition in cancer
therapy? Cancer Treat Rev. 40:1096–1105. 2014. View Article : Google Scholar : PubMed/NCBI
|
|
17
|
Jiang X, Cheng Y, Hu C, Zhang A, Ren Y and
Xu X: MicroRNA-221 sensitizes chronic myeloid leukemia cells to
imatinib by targeting STAT5. Leuk Lymphoma. 60:1709–1720. 2019.
View Article : Google Scholar : PubMed/NCBI
|
|
18
|
Chinese Society of Hematology, Chinese
Medical Association, . The guidelines for diagnosis and treatment
of chronic myelogenous leukemia in China (2016 edition). Zhonghua
Xue Ye Xue Za Zhi. 37:633–639. 2016.(In Chinese). PubMed/NCBI
|
|
19
|
Yu G, Wang LG, Han Y and He QY:
clusterProfiler: An R package for comparing biological themes among
gene clusters. OMICS. 16:284–287. 2012. View Article : Google Scholar : PubMed/NCBI
|
|
20
|
Cheng Y, Hao Y, Zhang A, Hu C, Jiang X, Wu
Q and Xu X: Persistent STAT5-mediated ROS production and
involvement of aberrant p53 apoptotic signaling in the resistance
of chronic myeloid leukemia to imatinib. Int J Mol Med. 41:455–463.
2018.PubMed/NCBI
|
|
21
|
Livak KJ and Schmittgen TD: Analysis of
relative gene expression data using real-time quantitative PCR and
the 2(-Delta Delta C(T)) method. Methods. 25:402–408. 2001.
View Article : Google Scholar : PubMed/NCBI
|
|
22
|
Team RC: R: A language and environment for
statistical computing. R Foundation for Statistical Computing.
(Vienna, Austria). http://www.R-project.org/2013.
|
|
23
|
Branford S and Hughes T: Detection of
BCR-ABL mutations and resistance to imatinib mesylate. Methods Mol
Med. 125:93–106. 2006.PubMed/NCBI
|
|
24
|
Yang M, Xi Q, Jia W and Wang X:
Structure-based analysis and biological characterization of
imatinib derivatives reveal insights towards the inhibition of
wild-type BCR-ABL and its mutants. Bioorg Med Chem Lett.
29:1267582019. View Article : Google Scholar : PubMed/NCBI
|
|
25
|
El Fakih R, Chaudhri N, Alfraih F, Rausch
CR, Naqvi K and Jabbour E: Complexity of chronic-phase CML
management after failing a second-generation TKI. Leuk Lymphoma.
1–12. 2019.(Epub ahead of print). View Article : Google Scholar : PubMed/NCBI
|
|
26
|
Jabbour E, Kantarjian H and Cortes J: Use
of second- and third-generation tyrosine kinase inhibitors in the
treatment of chronic myeloid leukemia: An evolving treatment
paradigm. Clin Lymphoma Myeloma Leuk. 15:323–334. 2015. View Article : Google Scholar : PubMed/NCBI
|
|
27
|
Branford S, Rudzki Z, Walsh S, Parkinson
I, Grigg A, Szer J, Taylor K, Herrmann R, Seymour JF, Arthur C, et
al: Detection of BCR-ABL mutations in patients with CML treated
with imatinib is virtually always accompanied by clinical
resistance, and mutations in the ATP phosphate-binding loop
(P-loop) are associated with a poor prognosis. Blood. 102:276–283.
2003. View Article : Google Scholar : PubMed/NCBI
|
|
28
|
Fenouille N, Puissant A, Dufies M, Robert
G, Jacquel A, Ohanna M, Deckert M, Pasquet JM, Mahon FX, Cassuto
JP, et al: Persistent activation of the Fyn/ERK kinase signaling
axis mediates imatinib resistance in chronic myelogenous leukemia
cells through upregulation of intracellular SPARC. Cancer Res.
70:9659–9670. 2010. View Article : Google Scholar : PubMed/NCBI
|
|
29
|
Elias MH, Baba AA, Husin A, Sulong S,
Hassan R, Sim GA, Abdul Wahid SF and Ankathil R: HOXA4 gene
promoter hypermethylation as an epigenetic mechanism mediating
resistance to imatinib mesylate in chronic myeloid leukemia
patients. Biomed Res Int. 2013:1297152013. View Article : Google Scholar : PubMed/NCBI
|
|
30
|
Balabanov S, Gontarewicz A, Keller G,
Raddrizzani L, Braig M, Bosotti R, Moll J, Jost E, Barett C, Rohe
I, et al: Abcg2 overexpression represents a novel mechanism for
acquired resistance to the multi-kinase inhibitor Danusertib in
BCR-ABL-positive cells in vitro. PLoS One. 6:e191642011. View Article : Google Scholar : PubMed/NCBI
|
|
31
|
Uziel O, Fenig E, Nordenberg J, Beery E,
Reshef H, Sandbank J, Birenbaum M, Bakhanashvili M, Yerushalmi R,
Luria D and Lahav M: Imatinib mesylate (Gleevec) downregulates
telomerase activity and inhibits proliferation in
telomerase-expressing cell lines. Br J Cancer. 92:1881–1891. 2005.
View Article : Google Scholar : PubMed/NCBI
|
|
32
|
Shukla S, Sauna ZE and Ambudkar SV:
Evidence for the interaction of imatinib at the transport-substrate
site(s) of the multidrug-resistance-linked ABC drug transporters
ABCB1 (P-glycoprotein) and ABCG2. Leukemia. 22:445–447. 2008.
View Article : Google Scholar : PubMed/NCBI
|
|
33
|
Duarte JG and Blackburn JM: Advances in
the development of human protein microarrays. Expert Rev
Proteomics. 14:627–641. 2017. View Article : Google Scholar : PubMed/NCBI
|
|
34
|
Huang W, Luo S, Burgess R, Yi YH, Huang GF
and Huang RP: New insights into the tumor microenvironment
utilizing protein array technology. Int J Mol Sci. 19(pii):
E5592018. View Article : Google Scholar : PubMed/NCBI
|
|
35
|
Leu JI and George DL: Hepatic IGFBP1 is a
prosurvival factor that binds to BAK, protects the liver from
apoptosis, and antagonizes the proapoptotic actions of p53 at
mitochondria. Genes Dev. 21:3095–3109. 2007. View Article : Google Scholar : PubMed/NCBI
|
|
36
|
Zhang P, Suidasari S, Hasegawa T, Yanaka N
and Kato N: High concentrations of pyridoxal stimulate the
expression of IGFBP1 in HepG2 cells through upregulation of the
ERK/c-Jun pathway. Mol Med Rep. 8:973–978. 2013. View Article : Google Scholar : PubMed/NCBI
|
|
37
|
Gao S, Sun Y, Zhang X, Hu L, Liu Y, Chua
CY, Phillips LM, Ren H, Fleming JB, Wang H, et al: IGFBP2 activates
the NF-κB pathway to drive epithelial-mesenchymal transition and
invasive character in pancreatic ductal adenocarcinoma. Cancer Res.
76:6543–6554. 2016. View Article : Google Scholar : PubMed/NCBI
|
|
38
|
Chen G, Zhou X and Xu Z: Effects of IGFBP3
gene silencing mediated inhibition of ERK/MAPK signaling pathway on
proliferation, apoptosis, autophagy, and cell senescence in rats
nucleus pulposus cells. J Cell Physiol. 234:9308–9315. 2019.
View Article : Google Scholar : PubMed/NCBI
|
|
39
|
Hawsawi Y, Humphries MP, Wright A, Berwick
A, Shires M, Al-Kharobi H, El-Gendy R, Jove M, Twelves C, Speirs V
and Beattie J: Deregulation of IGF-binding proteins −2 and −5
contributes to the development of endocrine resistant breast cancer
in vitro. Oncotarget. 7:32129–32143. 2016. View Article : Google Scholar : PubMed/NCBI
|
|
40
|
Clemmons DR: Role of IGF-binding proteins
in regulating IGF responses to changes in metabolism. J Mol
Endocrinol. 61:T139–T169. 2018. View Article : Google Scholar : PubMed/NCBI
|
|
41
|
Yu H and Rohan T: Role of the insulin-like
growth factor family in cancer development and progression. J Natl
Cancer Inst. 92:1472–1489. 2000. View Article : Google Scholar : PubMed/NCBI
|
|
42
|
Baxter RC: IGF binding proteins in cancer:
Mechanistic and clinical insights. Nat Rev Cancer. 14:329–341.
2014. View
Article : Google Scholar : PubMed/NCBI
|
|
43
|
Kasprzak A and Adamek A: Insulin-like
growth factor 2 (IGF2) signaling in colorectal cancer-from basic
research to potential clinical applications. Int J Mol Sci.
20(pii): E49152019. View Article : Google Scholar : PubMed/NCBI
|
|
44
|
Mohd Nafi SN, Siti Azrin AH, Mat Zin AA,
Othman NH and Che Jalil NA: Expression of IGFBP-rP1 in ovarian and
breast cancers in association with diabetes mellitus status. Malays
J Pathol. 41:33–39. 2019.PubMed/NCBI
|
|
45
|
Uhlén M, Fagerberg L, Hallström BM,
Lindskog C, Oksvold P, Mardinoglu A, Sivertsson Å, Kampf C,
Sjöstedt E, Asplund A, et al: Proteomics. Tissue-based map of the
human proteome. Science. 347:12604192015. View Article : Google Scholar : PubMed/NCBI
|
|
46
|
Philip S, Taylor AH, Konje JC and Habiba
M: The levonorgestrel-releasing intrauterine device induces
endometrial decidualisation in women on tamoxifen. J Obstet
Gynaecol. 39:1117–1122. 2019. View Article : Google Scholar : PubMed/NCBI
|
|
47
|
Kashyap MK: Role of insulin-like growth
factor-binding proteins in the pathophysiology and tumorigenesis of
gastroesophageal cancers. Tumour Biol. 36:8247–8257. 2015.
View Article : Google Scholar : PubMed/NCBI
|
|
48
|
Kim JC, Ha YJ, Tak KH, Roh SA, Kim CW, Kim
TW, Kim SK, Kim SY, Cho DH and Kim YS: Complex behavior of ALDH1A1
and IGFBP1 in liver metastasis from a colorectal cancer. PLoS One.
11:e01551602016. View Article : Google Scholar : PubMed/NCBI
|
|
49
|
Wetterau LA, Moore MG, Lee KW, Shim ML and
Cohen P: Novel aspects of the insulin-like growth factor binding
proteins. Mol Genet Metab. 68:161–181. 1999. View Article : Google Scholar : PubMed/NCBI
|
|
50
|
Russell MR, Graham C, D'Amato A,
Gentry-Maharaj A, Ryan A, Kalsi JK, Ainley C, Whetton AD, Menon U,
Jacobs I and Graham RLJ: A combined biomarker panel shows improved
sensitivity for the early detection of ovarian cancer allowing the
identification of the most aggressive type II tumours. Br J Cancer.
117:666–674. 2017. View Article : Google Scholar : PubMed/NCBI
|
|
51
|
Hur H, Yu EJ, Ham IH, Jin HJ and Lee D:
Preoperative serum levels of insulin-like growth factor-binding
protein 2 predict prognosis of gastric cancer patients. Oncotarget.
8:10994–11003. 2017. View Article : Google Scholar : PubMed/NCBI
|
|
52
|
Zhang L, Huang W, Chen J, Zhou X, Lu Z and
Zhou H: Expression of IGFBP2 in gastric carcinoma and relationship
with clinicopathologic parameters and cell proliferation. Dig Dis
Sci. 52:248–253. 2007. View Article : Google Scholar : PubMed/NCBI
|
|
53
|
Tang D, Yao R, Zhao D, Zhou L, Wu Y, Yang
Y, Sun Y, Lu L and Gao W: Trichostatin A reverses the
chemoresistance of lung cancer with high IGFBP2 expression through
enhancing autophagy. Sci Rep. 8:39172018. View Article : Google Scholar : PubMed/NCBI
|
|
54
|
Adachi Y, Nojima M, Mori M, Kubo T, Yamano
HO, Lin Y, Wakai K and Tamakoshi A; for JACC Study, : Circulating
insulin-like growth factor binding protein-3 and risk of
gastrointestinal malignant tumors. J Gastroenterol Hepatol. Jun
3–2019.(Epub ahead of print). View Article : Google Scholar
|
|
55
|
Adachi Y, Nojima M, Mori M, Matsunaga Y,
Akutsu N, Sasaki S, Endo T, Kurozawa Y, Wakai K and Tamakoshi A;
for JACC Study, : Insulin-like growth factor-related components and
the risk of liver cancer in a nested case-control study. Tumour
Biol. 37:15125–15132. 2016. View Article : Google Scholar : PubMed/NCBI
|
|
56
|
Adachi Y, Nojima M, Mori M, Yamashita K,
Yamano HO, Nakase H, Endo T, Wakai K, Sakata K and Tamakoshi A:
Insulin-like growth factor-1, IGF binding protein-3, and the risk
of esophageal cancer in a nested case-control study. World J
Gastroenterol. 23:3488–3495. 2017. View Article : Google Scholar : PubMed/NCBI
|