Introduction
Hepatocellular carcinoma (HCC) is the third leading
cause of cancer-associated mortality globally and ranks as the 5th
and 7th most common cancer type occurring in men and women,
respectively (1,2). It is mainly attributed to hepatitis B
virus (HBV) or hepatitis C virus (HCV) infections and patients with
cirrhosis are more likely to develop HCC when compared with those
without (3,4). The exact molecular mechanism underlying
HCC has not yet been fully elucidated. However, liver
transplantation remains the most effective treatment due to the
poor prognosis and ineffective therapy for the disease (5,6).
Recurrence rates following liver transplantation remain high and
result in patient mortality in a majority of cases, despite a
united therapeutic approach being utilized (7,8). The
research and development of effective drugs for HCC therapy remains
excessive and time-intensive. Therefore, novel treatments of HCC
are urgently required.
Although a number of studies have investigated the
molecular mechanisms of HCC (9–11), the
effective molecular targets of drugs and biomarkers, in addition to
the biological processes and signaling pathways of the disease,
remain obscure. Therefore, the present study selected 480 chip
datasets of HBV- and HCV-associated HCC tumor tissues and liver
cirrhosis non-tumor tissues (samples without cirrhosis) from the
Gene Expression Omnibus (GEO) database for bioinformatics
analysis.
The limma package was used to filter the
differentially expressed genes (DEGs), which were assessed via Gene
Ontology (GO) and Kyoto Encyclopedia of Genes and Genomes (KEGG)
enrichment analyses for significantly expressed biological
processes and signaling pathways. Furthermore, Gene Set Enrichment
Analysis (GSEA) was applied to evaluate the statistically
significant results at the transcriptome level. DEGs were also used
to construct a protein-protein interaction (PPI) network via the
STRING database to identify hub genes. The weighted gene
correlation network analysis (WGCNA) algorithm was utilized to
adjust the PPI network to model the dynamics of proteome changes.
Finally, the clinical outcomes of hub genes that are involved in
HCC progression were assessed via The Cancer Genome Atlas (TCGA)
survival analysis and experiments. Overall, the present study was
designed to develop a new method to find the biomarkers of HCC,
which serve important functions in cancer detection and
treatment.
Materials and methods
Microarray data source and
pre-processing
The gene expression profiles of HCC were constructed
by collecting the following three data sets, which were based on
the Affymetrix HT HG-U133A and HG-U133A 2.0 Array (National Center
for Biotechnology Information GEO database): GSE14323 (12), GSE14520 (13) and GSE17967 (14,15). A
total of 480 biochips obtained from patients with resected HCC were
analyzed and included 237 HCC tumor samples and 243 non-tumor
samples. The raw data of three sets were downloaded from GEO and
read via Simpleaffy, which is used as an R package for Affymetrix
quality control and data analysis (16). Annotations were made using gene
symbols and their platform annotations, following which a united
gene expression matrix, including all 480 samples, was compiled.
The mean value of gene expression was used in multiple probe sets
with one gene symbol allocated. Normalization and batch
rectification were performed prior to analysis.
Differential expression and functional
analysis
DEGs were screened out using the limma package with
the Bayesian method in R (17), and
Log fold change (FC)>1 and an adjusted P-value of
P<10−5 were considered to indicate a statistically
significant difference. GO (18,19) and
KEGG (20) analyses were performed
using the Database for Annotation, Visualization and Integrated
Discovery (DAVID) to investigate the significant biological
processes and signaling pathways associated with DEGs (21,22). The
enriched results of DAVID were presented using GOPlot, a package
that visualizes the functional analysis of omics data (23).
GSEA
GSEA calculates whether a priori defined gene set is
statistically significant, and determines concordant differences
among biological processes (24). In
the present study, GSEA was used to evaluate the differences
between HCC tissues and adjacent non-tumor tissues in the whole
transcriptome, beyond the DEGs, to avoid individual bias.
Permutations of 105 were serviced in the progress.
Leading edge analysis was performed for the enriched core genes of
HCC.
Co-expression and PPI network
analysis
To cluster the functional genes of DEGs, a PPI
network was constructed from the STRING database (25), and WGCNA (26) was also performed using the dynamic
tree cut package (27) at a minimum
height of 0.2 for each module. A topological overlapping matrix
(28) was utilized to screen
networks. Pearson's correlation coefficient was used to collect the
eigengene and interactors of DEGs. Finally, the annotations of each
module were completed using clusterProfiler (29) and visualized in Cytoscape V_3.6.0
software (National Institute of General Medical Sciences, Bethesda,
MD, USA) (30).
TCGA survival analysis
It is important to validate biomarkers for clinical
outcomes in cancer prognosis. To perform survival analysis and risk
assessment, the clinical data and expression profiles of HCC were
downloaded from TCGA database via TCGAbiolinks (31).
Prediction of candidate gene
transcription factors (TFs) and microRNAs (miRNAs)
The transcription factors of six candidate genes
were determined using ENCODE Chip-seq data using human
transcription factor information included in NetworkAnalyst
(32,33).
The miRNA of five target genes were predicted using
miRWalk 3.0 (http://mirwalk.umm.uni-heidelberg.de/) (34). The filter criterion for miRNA were
confirmed using >3 of the following databases: miRwalk, miRanda
(35), RNA22 (36) and TargetScan (37). The TF-gene and miRNA-gene network
were visualized in Cytoscape software separately.
Patients and sample collection
A total of 47 HCC samples and their paired adjacent
normal tissues were collected between February 2014 and May 2017 at
the People's Hospital of Liaoning Province (Liaoning, China).
Following surgical resection, the tissues were stored at −80°C. All
specimens were subsequently evaluated by two independent
pathologists via hematoxylin and eosin staining. The present study
was approved by the Ethics Committee of the People's Hospital of
Liaoning Province, and all patients provided written informed
consent.
Reverse transcription-quantitative PCR
(RT-qPCR)
Total RNA was extracted from 47 HCC and adjacent
samples using TRIzol® (Invitrogen; Thermo Fisher
Scientific, Inc.). RT was performed at 50°C for 3 min to synthesize
cDNA. The six hub genes identified via bioinformatics were analyzed
via RT-qPCR using a One-Step qPCR kit (cat. no. 11746100;
Invitrogen; Thermo Fisher Scientific, Inc.) and a CFX Connect™
Real-Time System (Bio-Rad Laboratories, Inc.). The following
thermocycling conditions were used for qPCR: Initial denaturation
at 95°C for 15 min; 40 cycles of denaturation at 95°C for 10 sec,
annealing at 60°C for 30 sec, and extension at 72°C for 20 sec;
with 2X SYBR®-Green reaction mix (Invitrogen; Thermo
Fisher Scientific, Inc.) RT-qPCR data were analyzed using the
2−ΔΔCq method (38), with
β-actin used as a reference gene. The following primers were used
in the current study: CCNB2 forward, 5′-CCGACGGTGTCCAGTGATTT-3′ and
reverse, 5′-TGTTGTTTTGGTGGGTTGAACT-3′; CDC20 forward,
5′-GCACAGTTCGCGTTCGAGA-3′ and reverse, 5′-CTGGATTTGCCAGGAGTTCGG-3′;
MAD2L1 forward, 5′-GTTCTTCTCATTCGGCATCAACA-3′ and reverse,
5′-GAGTCCGTATTTCTGCACTCG-3′; MCM2 forward,
5′-ATGGCGGAATCATCGGAATCC-3′ and reverse, 5′-GGTGAGGGCATCAGTACGC-3′;
CENPF forward, 5′-CTCTCCCGTCAACAGCGTTC-3′ and reverse,
5′-GTTGTGCATATTCTTGGCTTGC-3′; BUB1B forward,
5′-AAATGACCCTCTGGATGTTTGG-3′ and reverse,
5′-GCATAAACGCCCTAATTTAAGCC-3′); and β-actin forward,
5′-CATGTACGTTGCTATCCAGGC-3′ and reverse,
5′-CTCCTTAATGTCACGCACGAT-3′.
Western blotting
HCC tissue samples were lysed using Tissue
Extraction Reagent I (Invitrogen; Thermo Fisher Scientific, Inc.)
with protease and phosphatase inhibitors. Protein concentrations
were determined using a bicinchoninic acid assay kit (Thermo Fisher
Scientific, Inc.). A total of 20 µg lysate proteins of every sample
were separated using 6% (for CENPF) and 12% (for others) SDS-PAGE
and transferred onto polyvinylidene difluoride membranes
(Invitrogen; Thermo Fisher Scientific, Inc.). The membranes were
blocked by 5% nonfat dry milk (Thermo Fisher Scientific, Inc.) for
30 min at room temperature. All antibodies were diluted at 1:1,000
in 5% nonfat dry milk (Thermo Fisher Scientific, Inc.), 1X TBS and
0.1% Tween-20 (Thermo Fisher Scientific, Inc.) at 4°C with gentle
shaking, overnight. The following antibodies were used: CCNB2 (cat.
no. ab10839; Abcam), CDC20 (cat. no. 4823; Cell Signaling
Technology, Inc.), MAD2L1 (cat. no. 4636; Cell Signaling
Technology, Inc.), MCM2 (cat. no. 4007; Cell Signaling Technology,
Inc.), CENPF (cat. no. 58982; Cell Signaling Technology, Inc.),
BUB1B (cat. no. 4116; Cell Signaling Technology, Inc.) and β-actin
(cat. no. 4970; Cell Signaling Technology, Inc.). The membranes
were subsequently incubated with horseradish peroxidase-conjugated
secondary antibodies (cat. no. 7074S; anti-rabbit IgG; species
cross-reactivity: Human, mouse, rat; and cat. no. 7076S; anti-mouse
IgG; species cross-reactivity: Human, mouse, rat; Cell Signaling
Technology, Inc.) at room temperature for 1 h. The immunoblots were
visualized with an enhanced chemiluminescence detection reagent
(EMD Millipore). Band intensities were quantified using the Image
Lab 2.0 software (Bio-Rad Laboratories, Inc.).
Statistical analysis
An paired Student's t-test was utilized for
comparisons between two groups (tumor tissue and its adjacent
tissue). Data are presented as the mean ± standard deviation,
except when indicated otherwise. The Kaplan-Meier method was used
to perform survival analysis, and two subgroups were compared with
Breslow. P<0.05 was considered to indicate a statistically
significant difference. All analyses in the present study were
performed with R software (version 3.5.0, http://www.R-project.org).
Results
Microarray data source and
pre-processing
The raw data of three data sets were downloaded from
GEO and read into R using the Simpleaffy package for quality
control and normalization (16). The
combat method was used to eliminate the batch effects (39). A total of 480 gene expression
profiles, obtained from HCC and non-tumor tissues, were analyzed in
the present study.
HCC DEGs and functional analysis
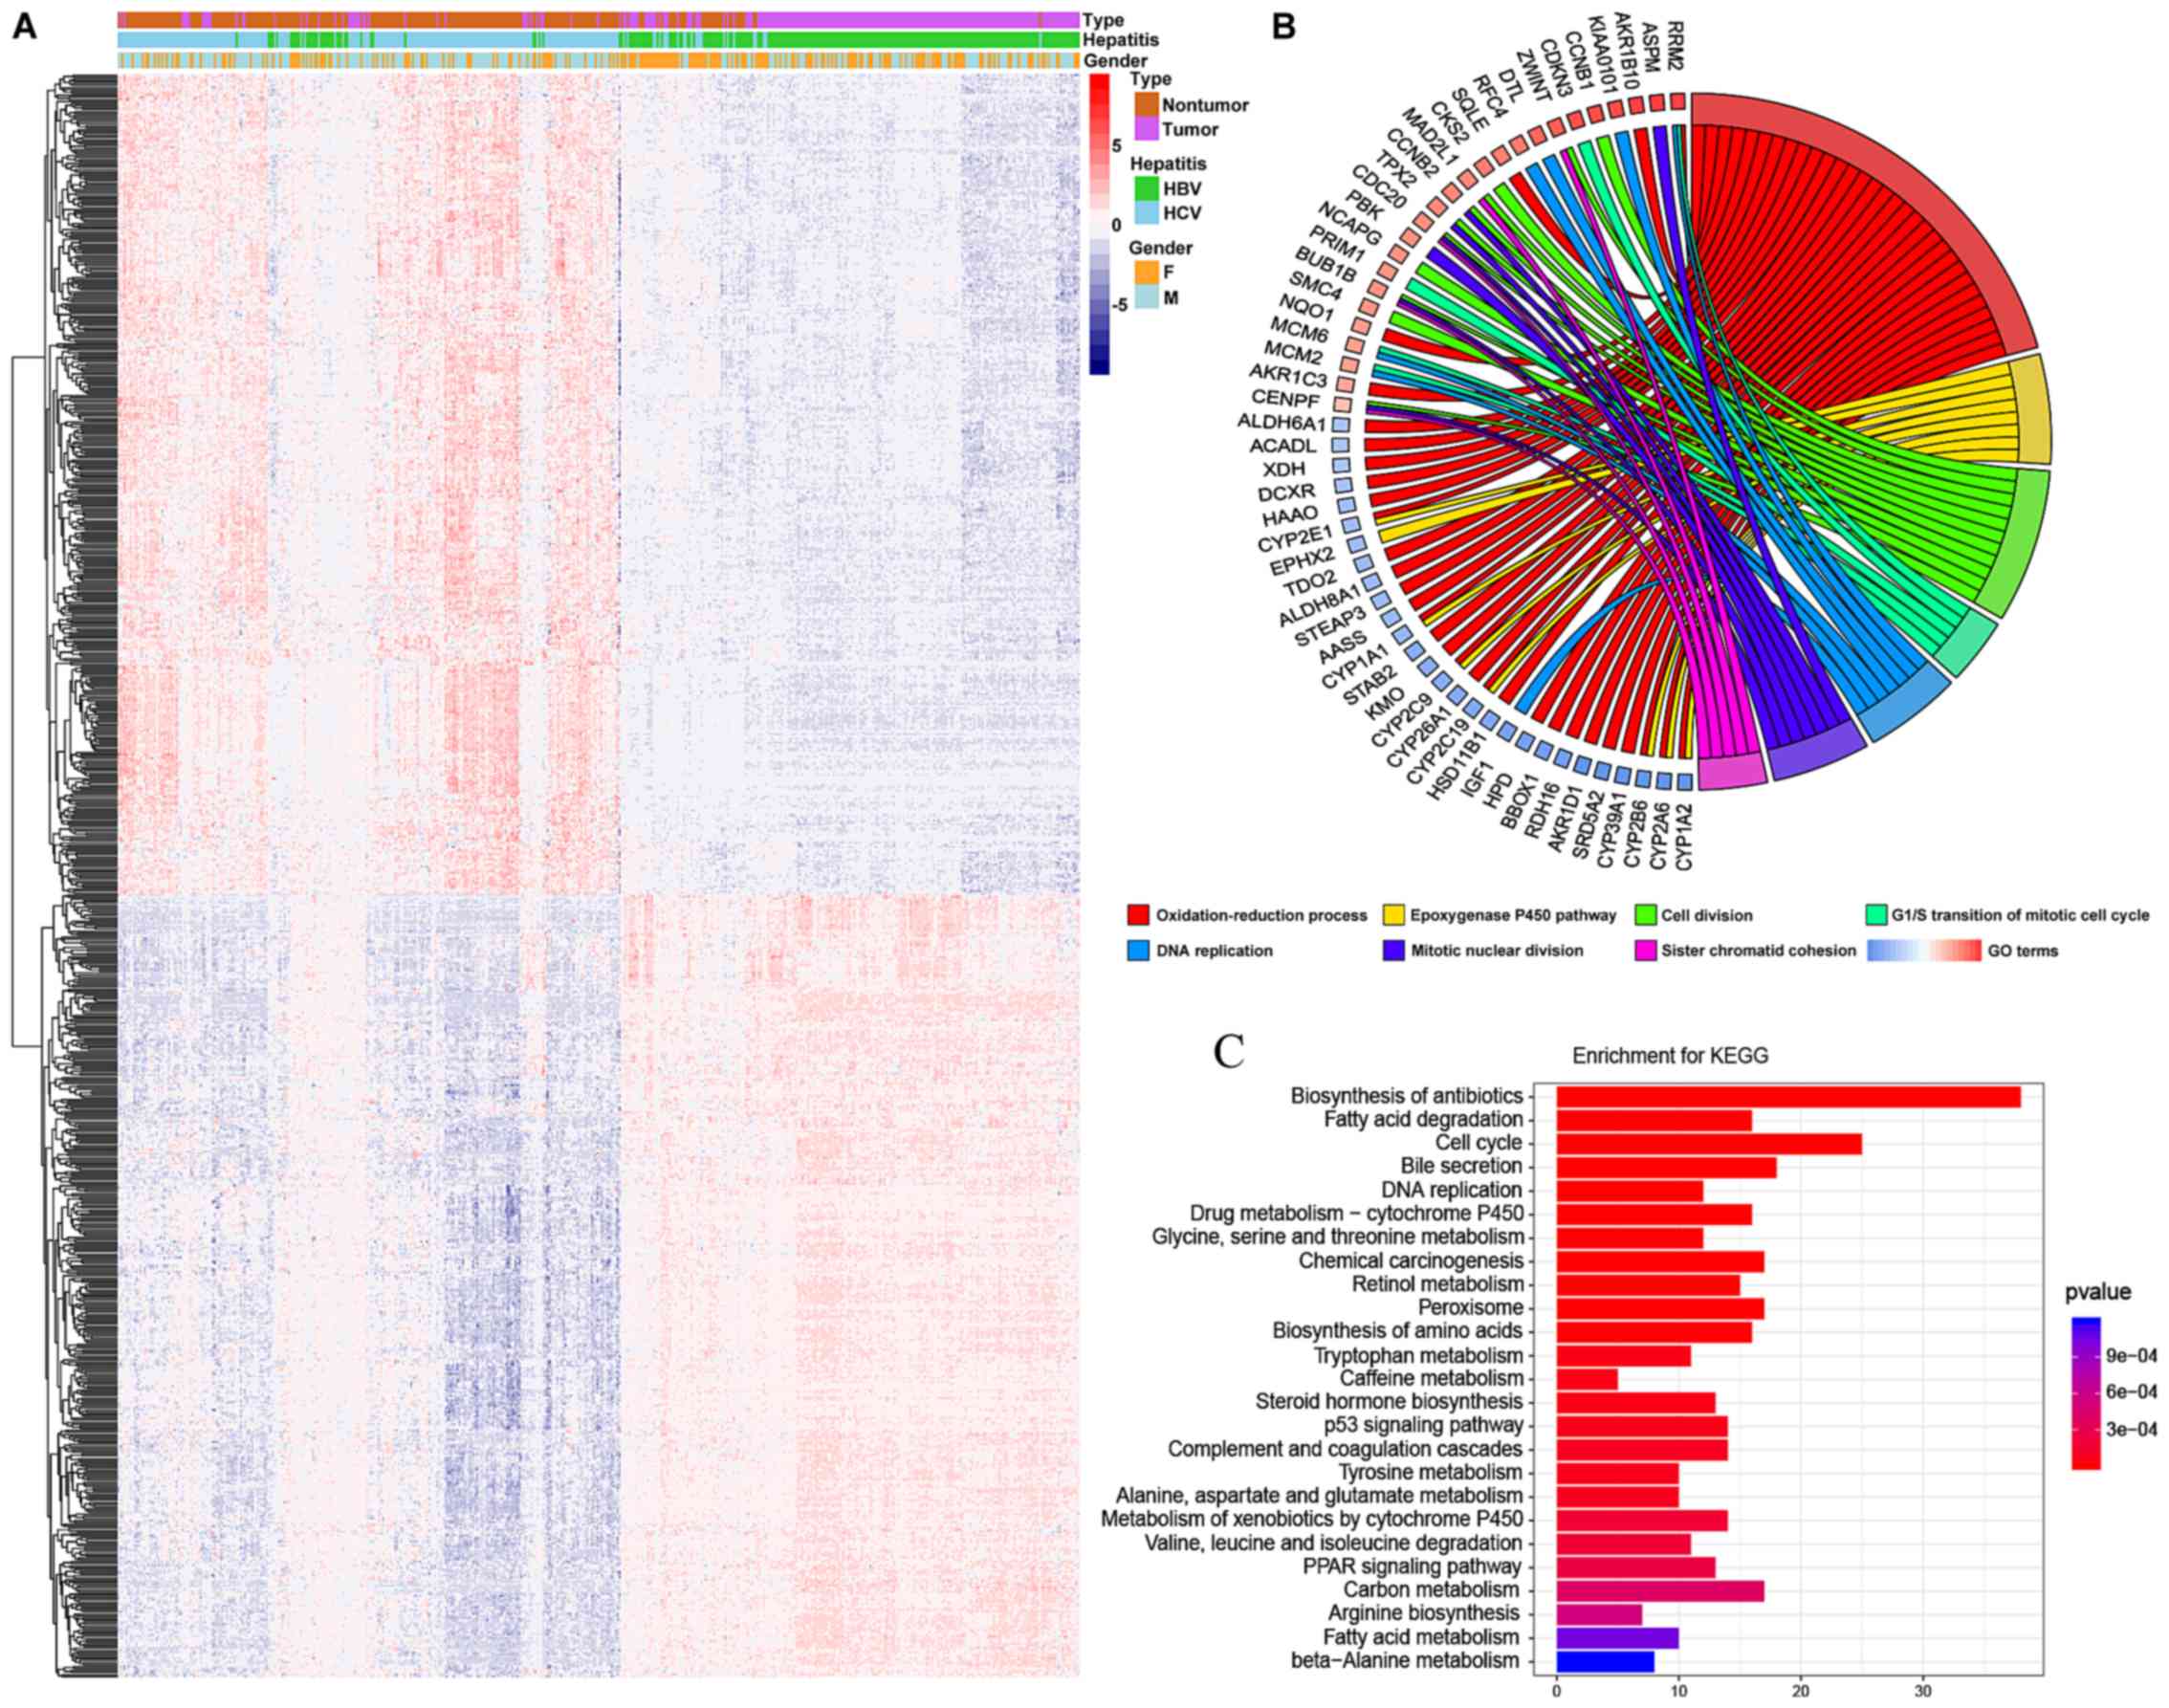
A heatmap and volcano plot were constructed to
present the variation in DEGs between HCC and non-tumor tissues
(Fig. 1A). In total, 657 genes,
including 386 upregulated genes and 271 downregulated genes, were
differentially expressed in HCC, with a log2FC>2 and
an adjusted P-value of P<10−5.
The molecular mechanism underlying HCC progression
is yet to be fully elucidated. Therefore, the present study aimed
to determine the functions of hub genes in HCC by analyzing
associated DEGs. GO and KEGG pathway analyses were also performed
to understand this process. The results of GO revealed that the
most enriched GO targets were those involved in oxidation-reduction
processes, the epoxygenase P450 pathway and cell cycle associated
processes (Fig. 1B). Additionally,
it was determined that a number of the genes involved in
oxidation-reduction processes were downregulated. KEGG analysis
demonstrated that enrichments were associated with the biosynthesis
of antibiotics, fatty acid degradation, the cell cycle and DNA
replication (Fig. 1C).
GSEA
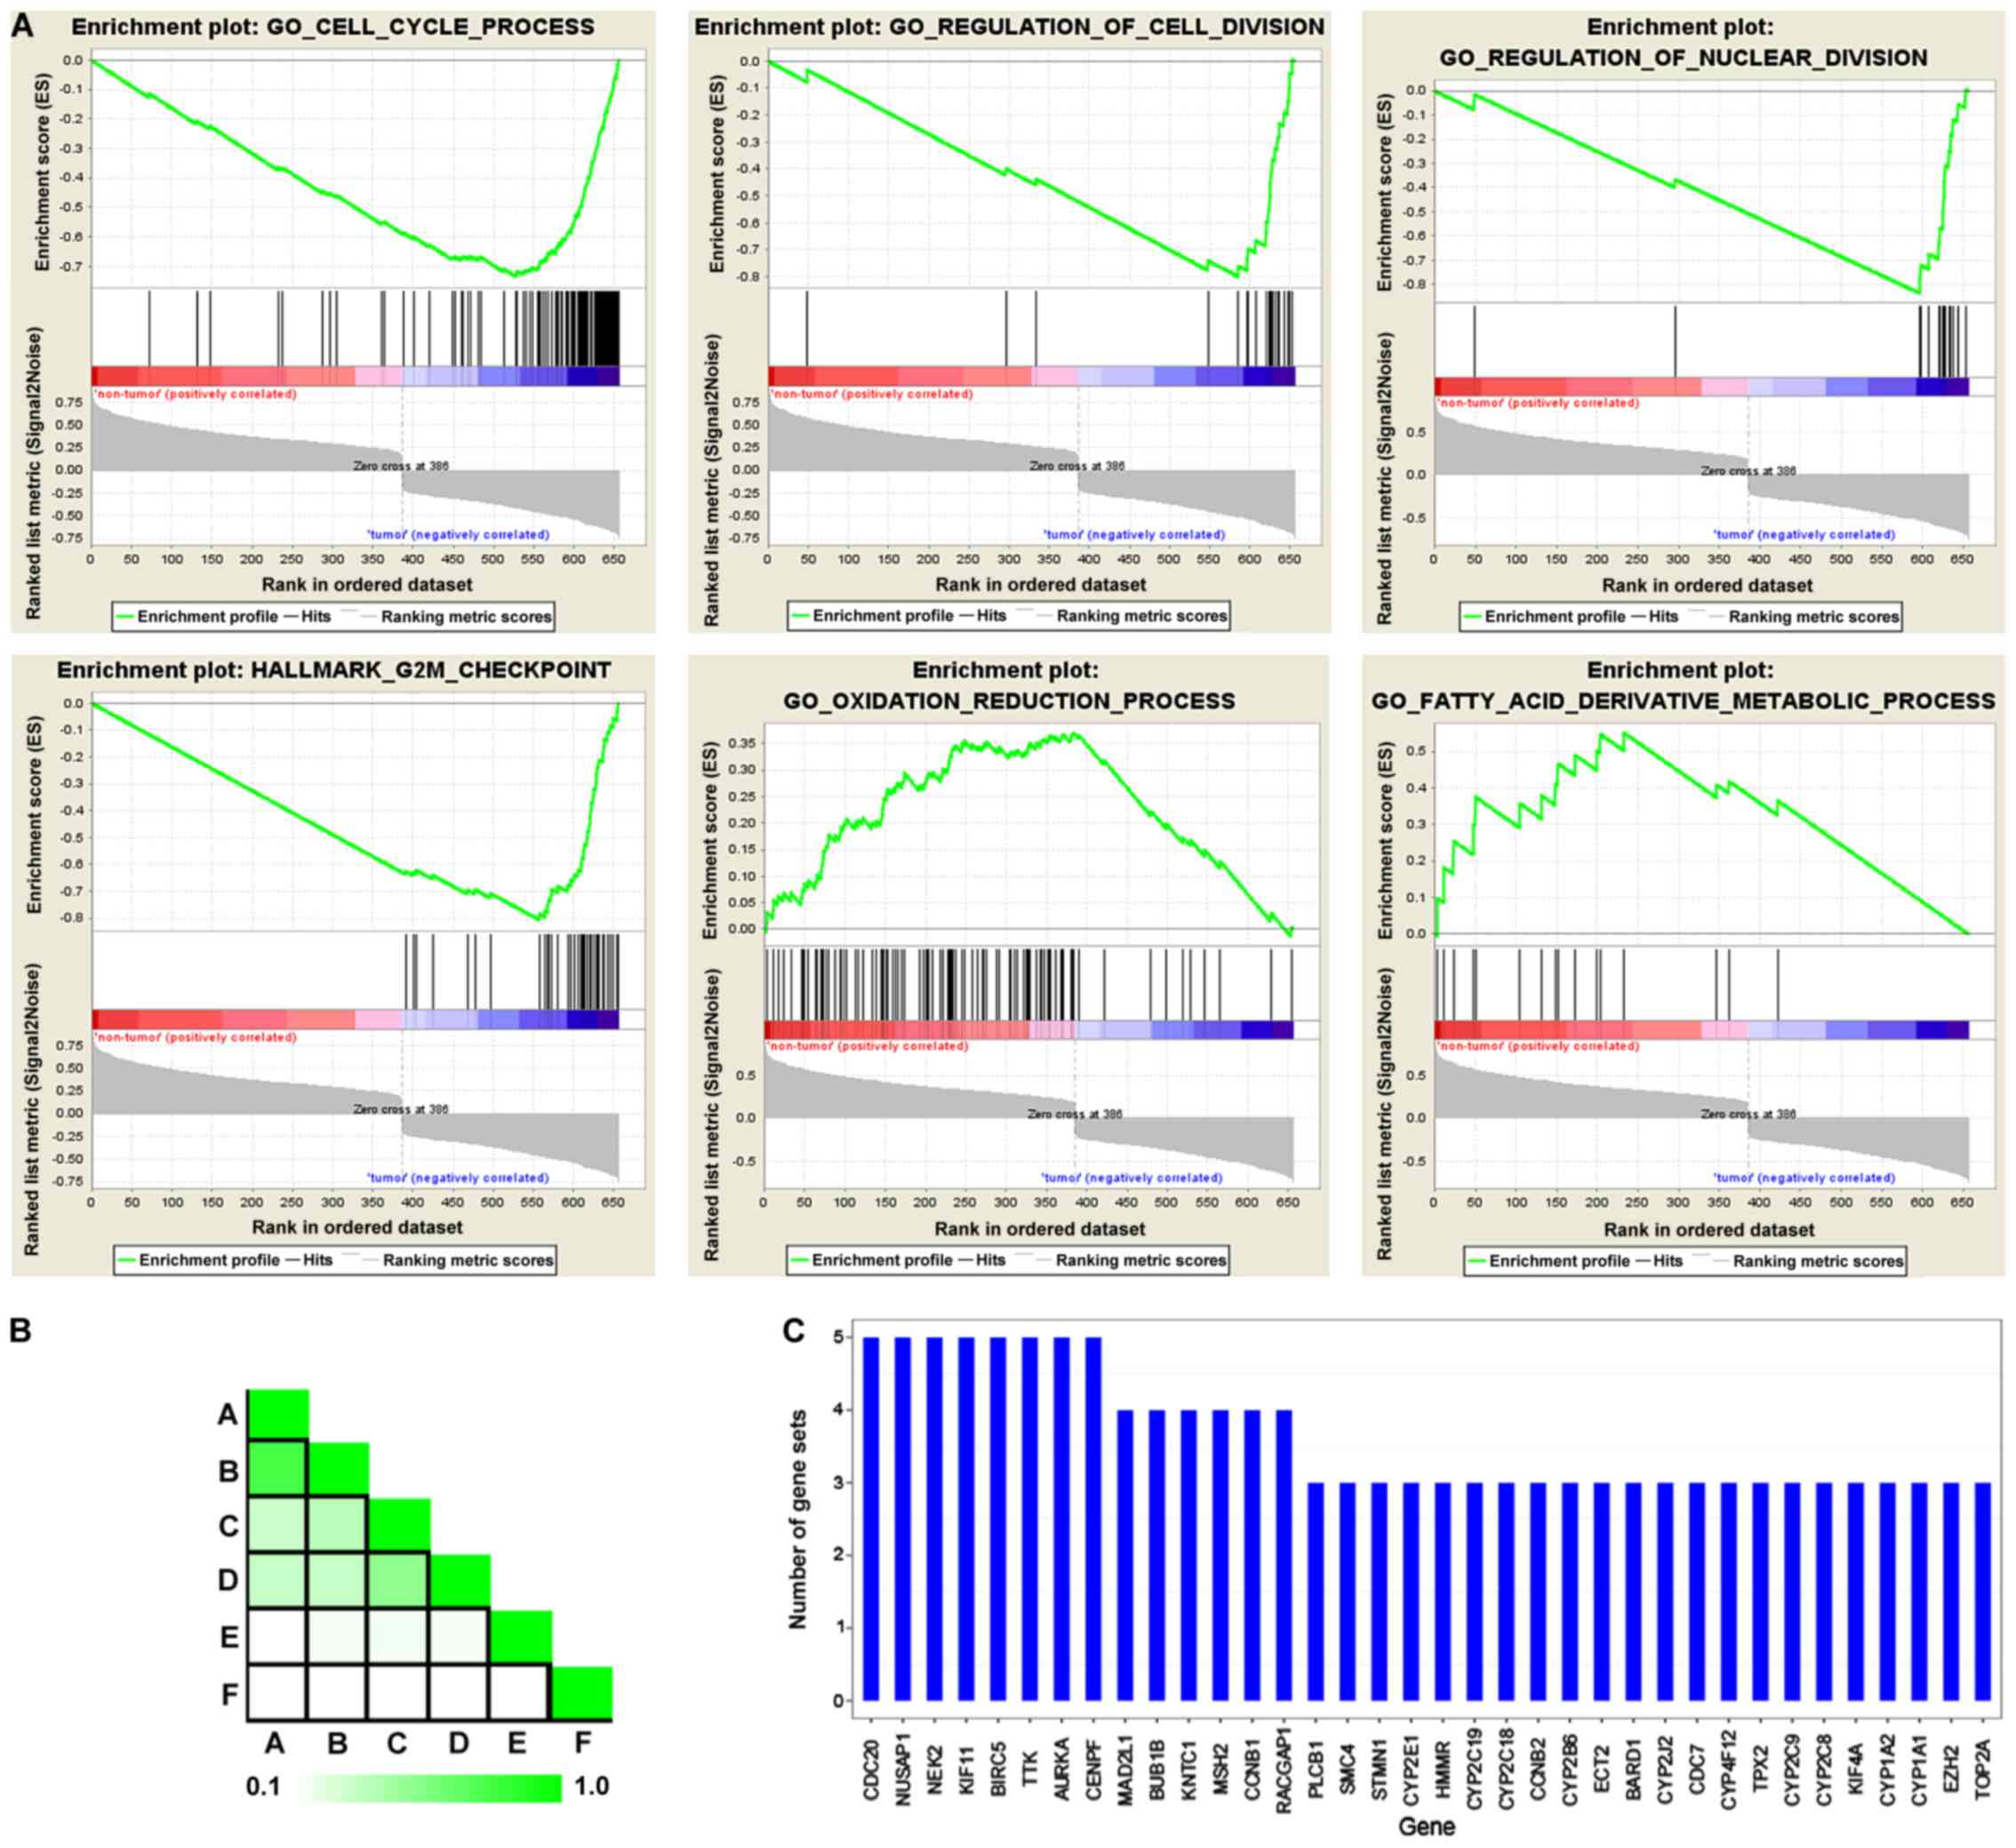
To confirm the functional associated genes in the
whole transcriptome, as opposed to DEGs alone, GSEA was performed
using the expression matrix between HCC tissue and their adjacent
non-tumor types. HCC was singularly associated with downregulated
genes associated with the oxidation-reduction process and fatty
acid derivative metabolic processes. Furthermore, numerous
upregulated genes were enriched in the cell cycle process, the
regulation of cell division and the G2M checkpoint, which is
concordant with the data obtained from DEG GO and KEGG enrichment
analysis (Fig. 2A). GSEA leading
edge analysis also determined that CDC20, nucleolar and spindle
associated protein 1, NIMA related kinase 2, kinesin family member
11, baculoviral IAP repeat containing 5, TTK protein kinase and
CENPF were exhibited in five gene sets, with a further six genes
appearing in four gene sets (Fig. 2B and
C).
Integrative analysis elucidates the
advanced functional modules of HCC
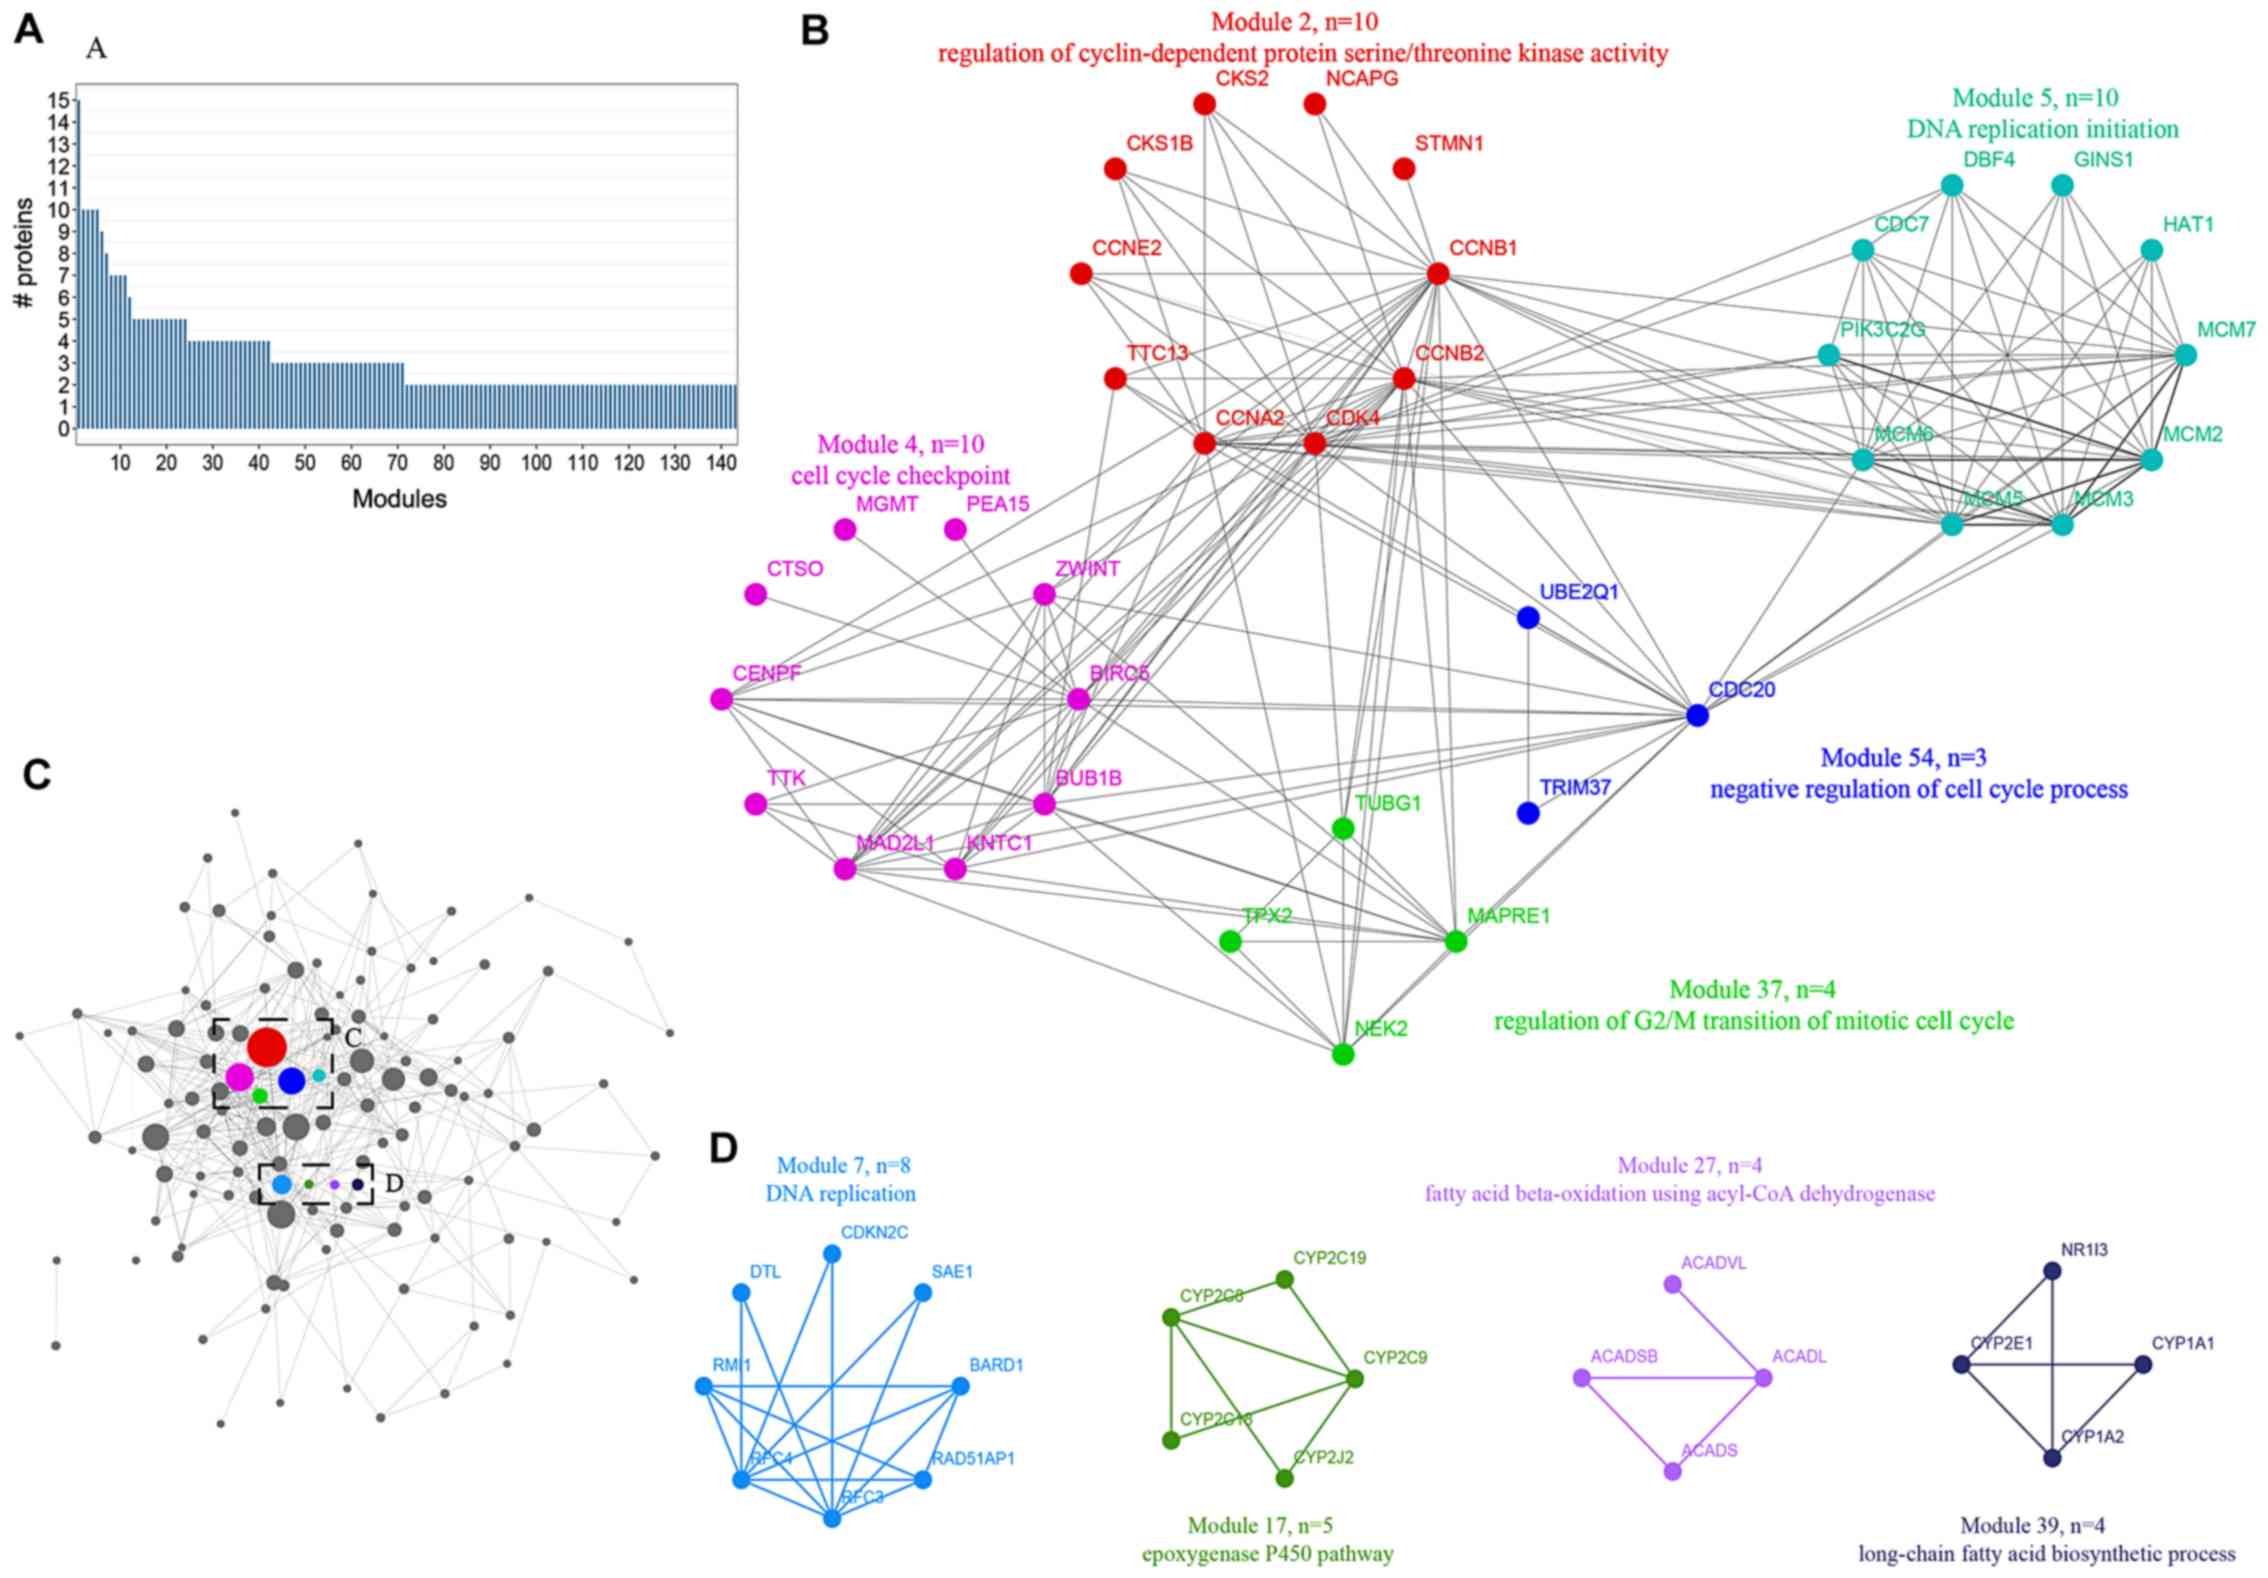
A novel method was utilized to simulate the dynamics
of proteome alterations during the cancerous progression of HCC,
which included a hierarchical cluster tree, topological overlapping
matrix, weighted gene correlation network analysis and PPI network
analysis. The present study simplified networks by modulating the
correlative proteins to functional modules, which were involved in
similar biological processes. As a result, 121 modules were
established with members ranging from 20 to 2 (Fig. 3A). The majority of modules were
extremely interconnected through their core nodes, which were
considered to be candidate hub genes (Fig. 3C). Modules were annotated using
clusterProfiler with GO terms and KEGG pathways. The results
revealed that numerous modules were markedly enriched in cell
cycle-associated progression, including module 2, 4, 5, 37 and 54
(Fig. 3B). In addition, module 17
was involved in the epoxygenase P450 pathway, module 27 was
involved in fatty acid beta-oxidation using acyl-CoA dehydrogenase
and module 37 was involved in the long-chain fatty acid
biosynthetic process (Fig. 3D). In
summary, the progression of HCC may occur via the rebalanced
regulation and extensive reprogramming of mutually connected
functional modules.
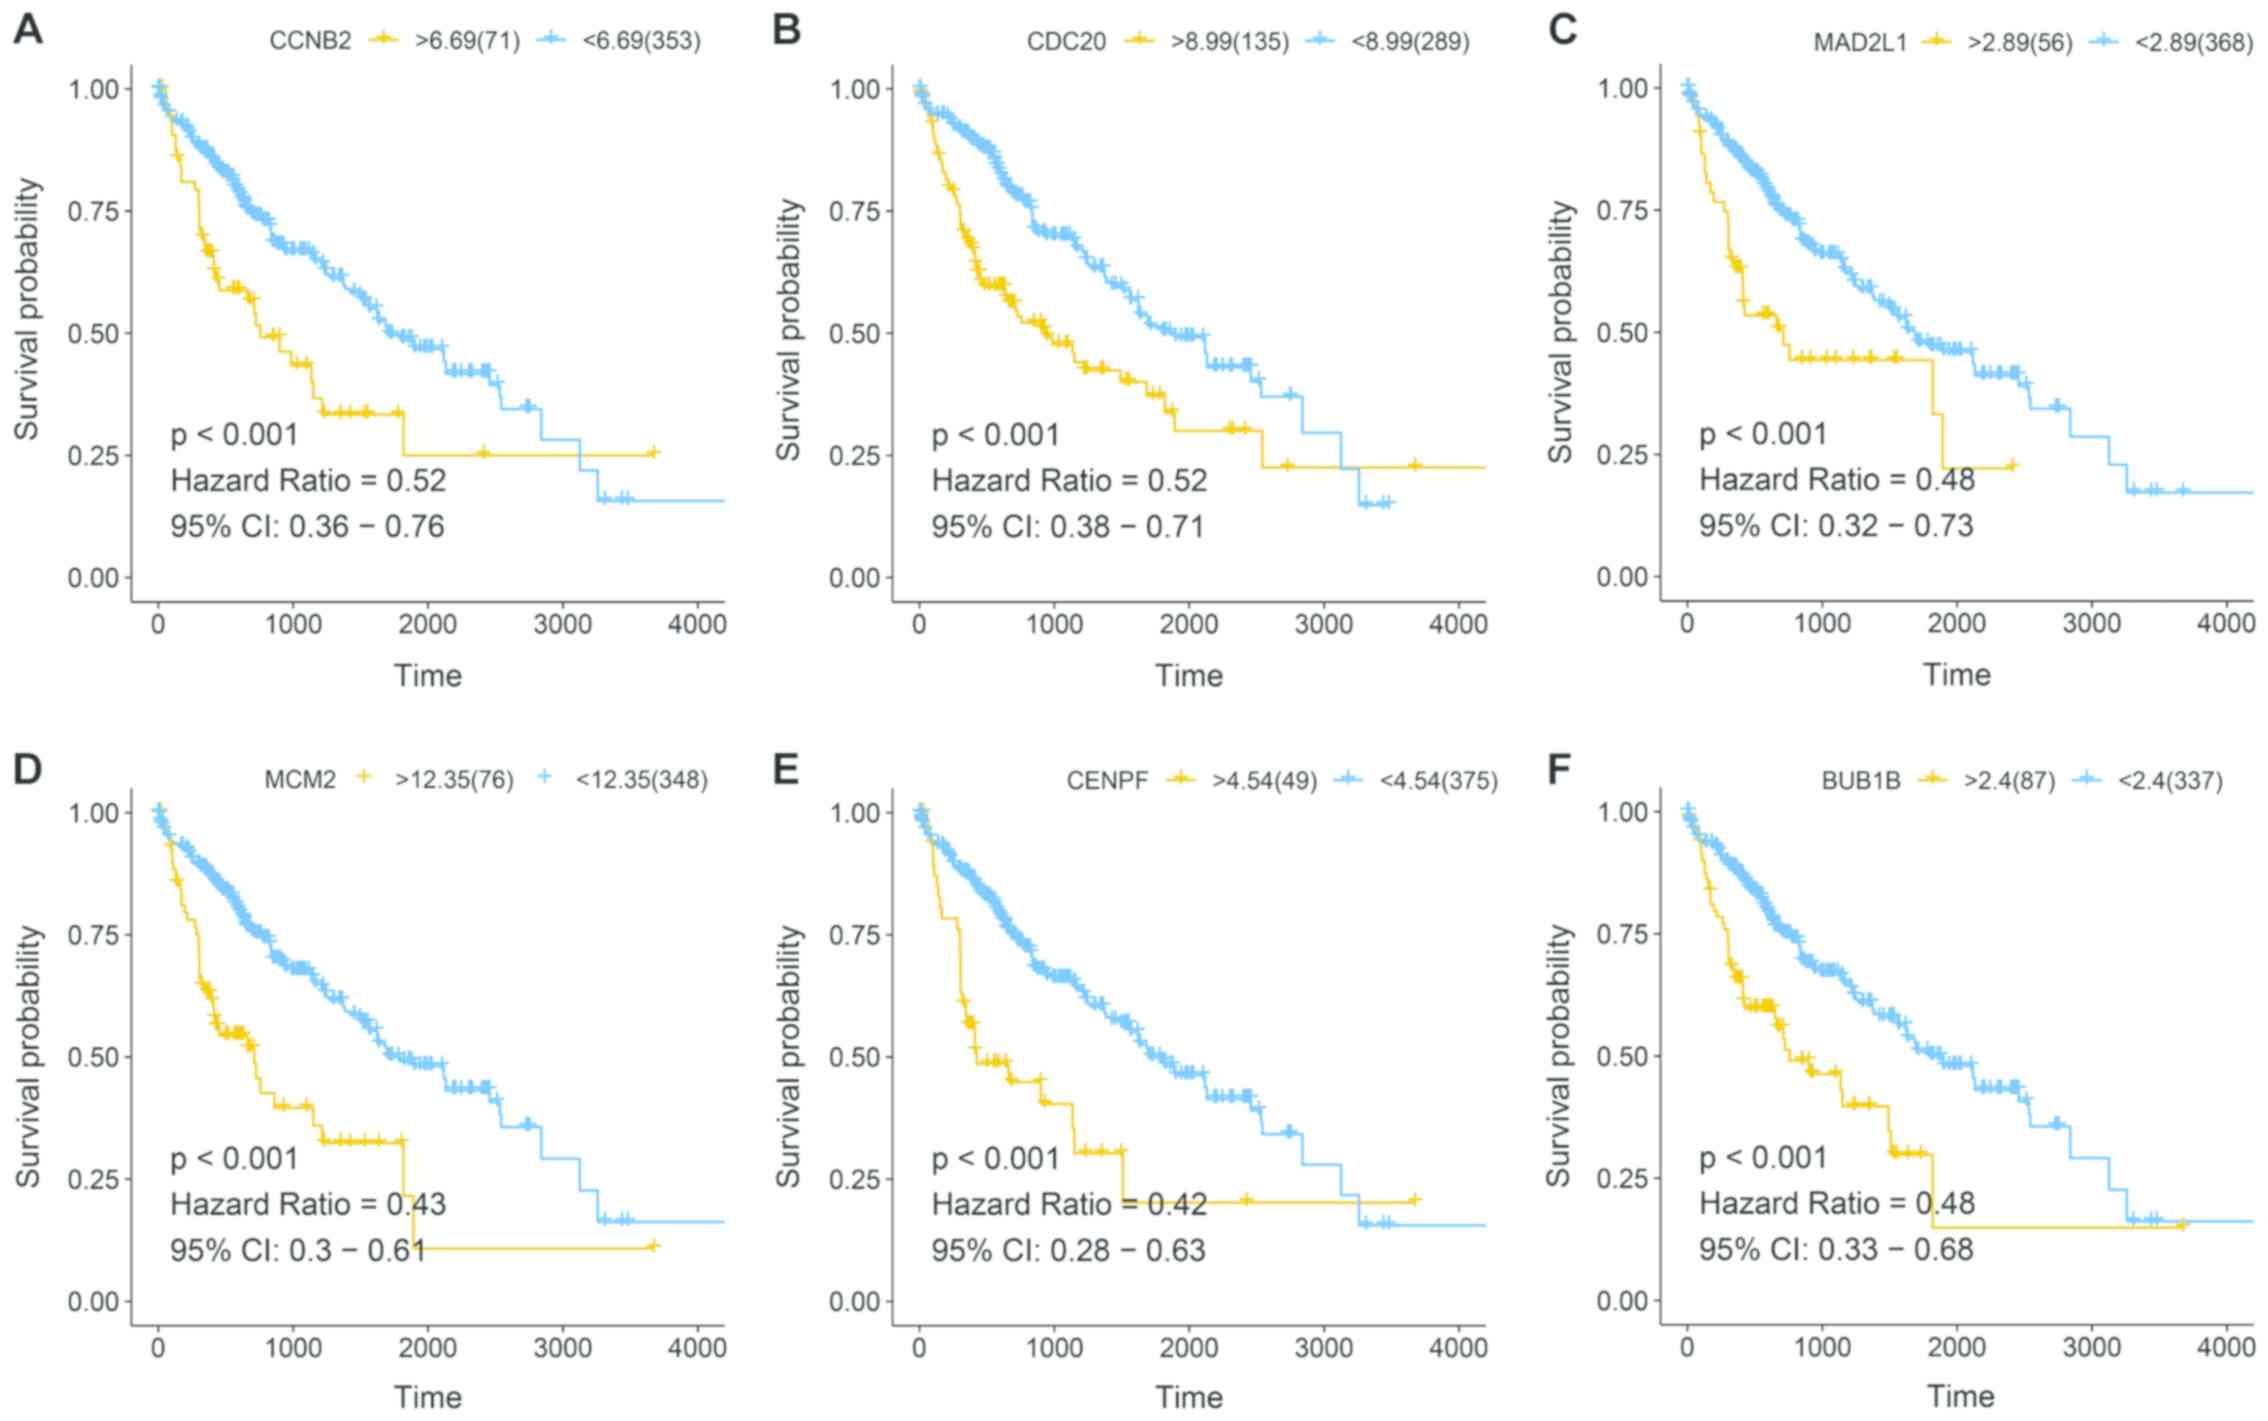
TCGA survival analysis
To validate the hub genes of HCC, 360 HCC clinical
and expression data were downloaded from TCGA database. Six hub
genes were notable in the survival analysis from 36 candidate
genes, which were significantly associated with patient prognosis.
The aforementioned hub genes included: CCNB2, CDC20, MAD2L1, MCM2,
CENPF and BUB1B (Fig. 4).
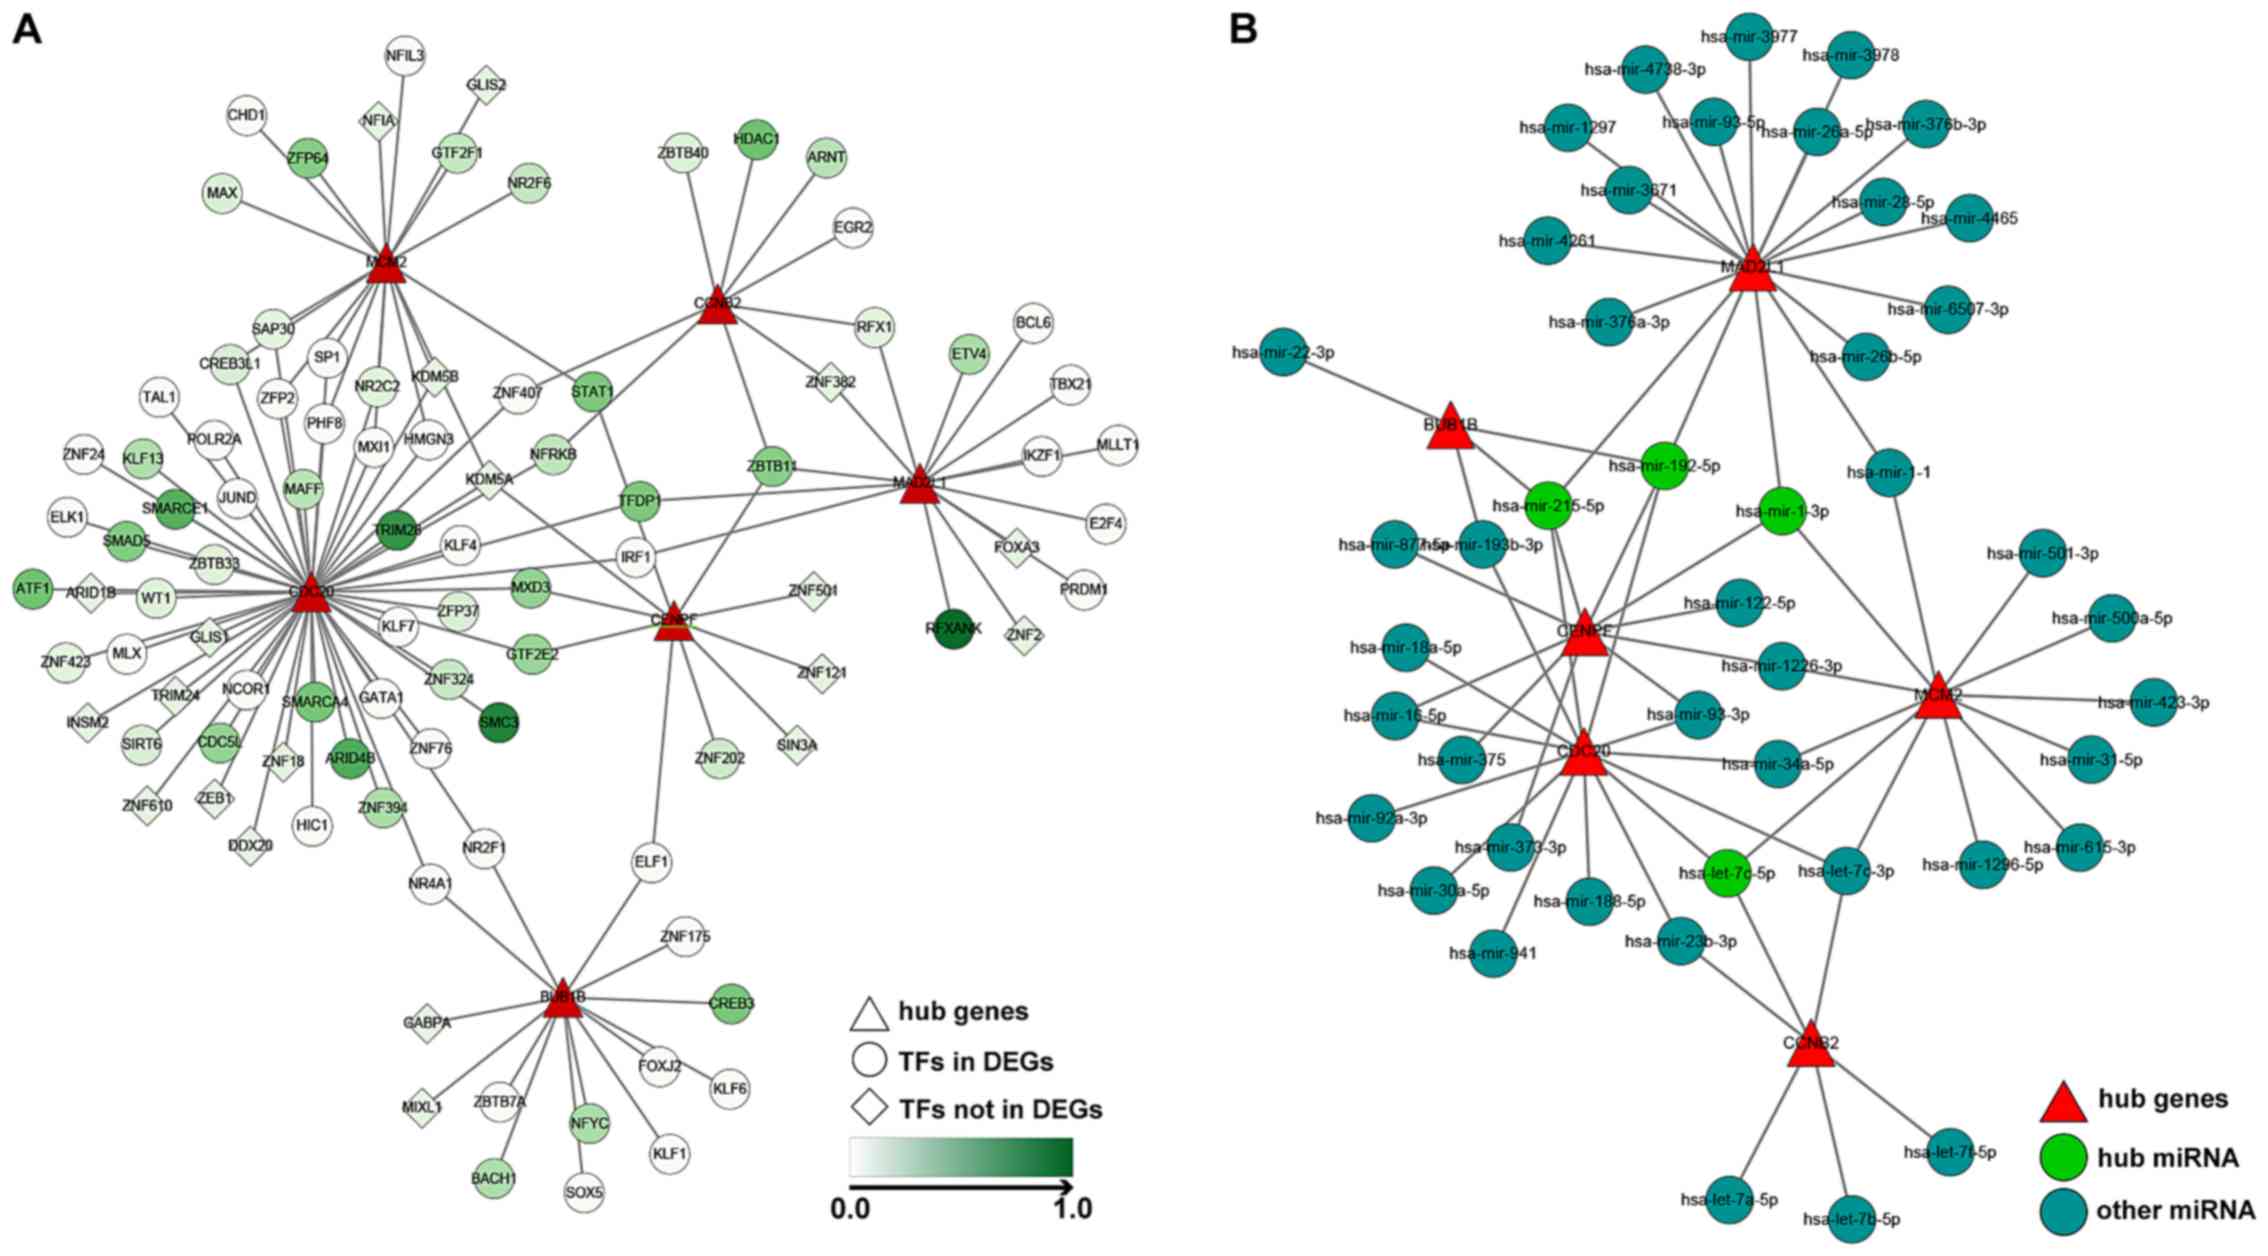
TF and miRNA-gene network
construction
Based on the former analyses, the present study
aimed to determine the TFs and miRNAs associated with the
identified hub genes. The ENCODE Chip-seq database was used to
identify the TFs of the six hub genes. The results revealed
structural maintenance of chromosomes 3 and tripartite motif
containing 28 targeting CDC20, histone deacetylase 1 targeting
CCNB2, regulatory factor X associated ankyrin containing protein
targeting MAD2L, ZFP64 zinc finger protein targeting MCM2 and cAMP
responsive element binding protein 3 targeting BUB1B were
significantly upregulated in HCC (Fig.
5A). Furthermore, NetworkAnalyst and three other miRNA
databases identified four hub miRNAs in HCC. Among them,
hsa-mir-215-5p and hsa-mir-192-5p interacted with MAD2L1, CDC20,
CENPF and BUB1B. Additionally, hsa-mir-1-3p interacted with MAD2L1,
MCM2 and CENPF. Hsa-let-7c-5p interacted with CDC20, MCM2 and CCNB2
(Fig. 5B).
Validation of hub genes via RT-qPCR
and western blotting
To confirm the hub genes identified using the
aforementioned analyses and to determine the variations of
expression at the mRNA and protein level, RT-qPCR and western
blotting were performed (Fig. 6).
The results revealed that the six hub genes were significantly
upregulated in HCC when compared with the control group
(P<0.001), which was concordant with the results obtained from
the bioinformatics analysis.
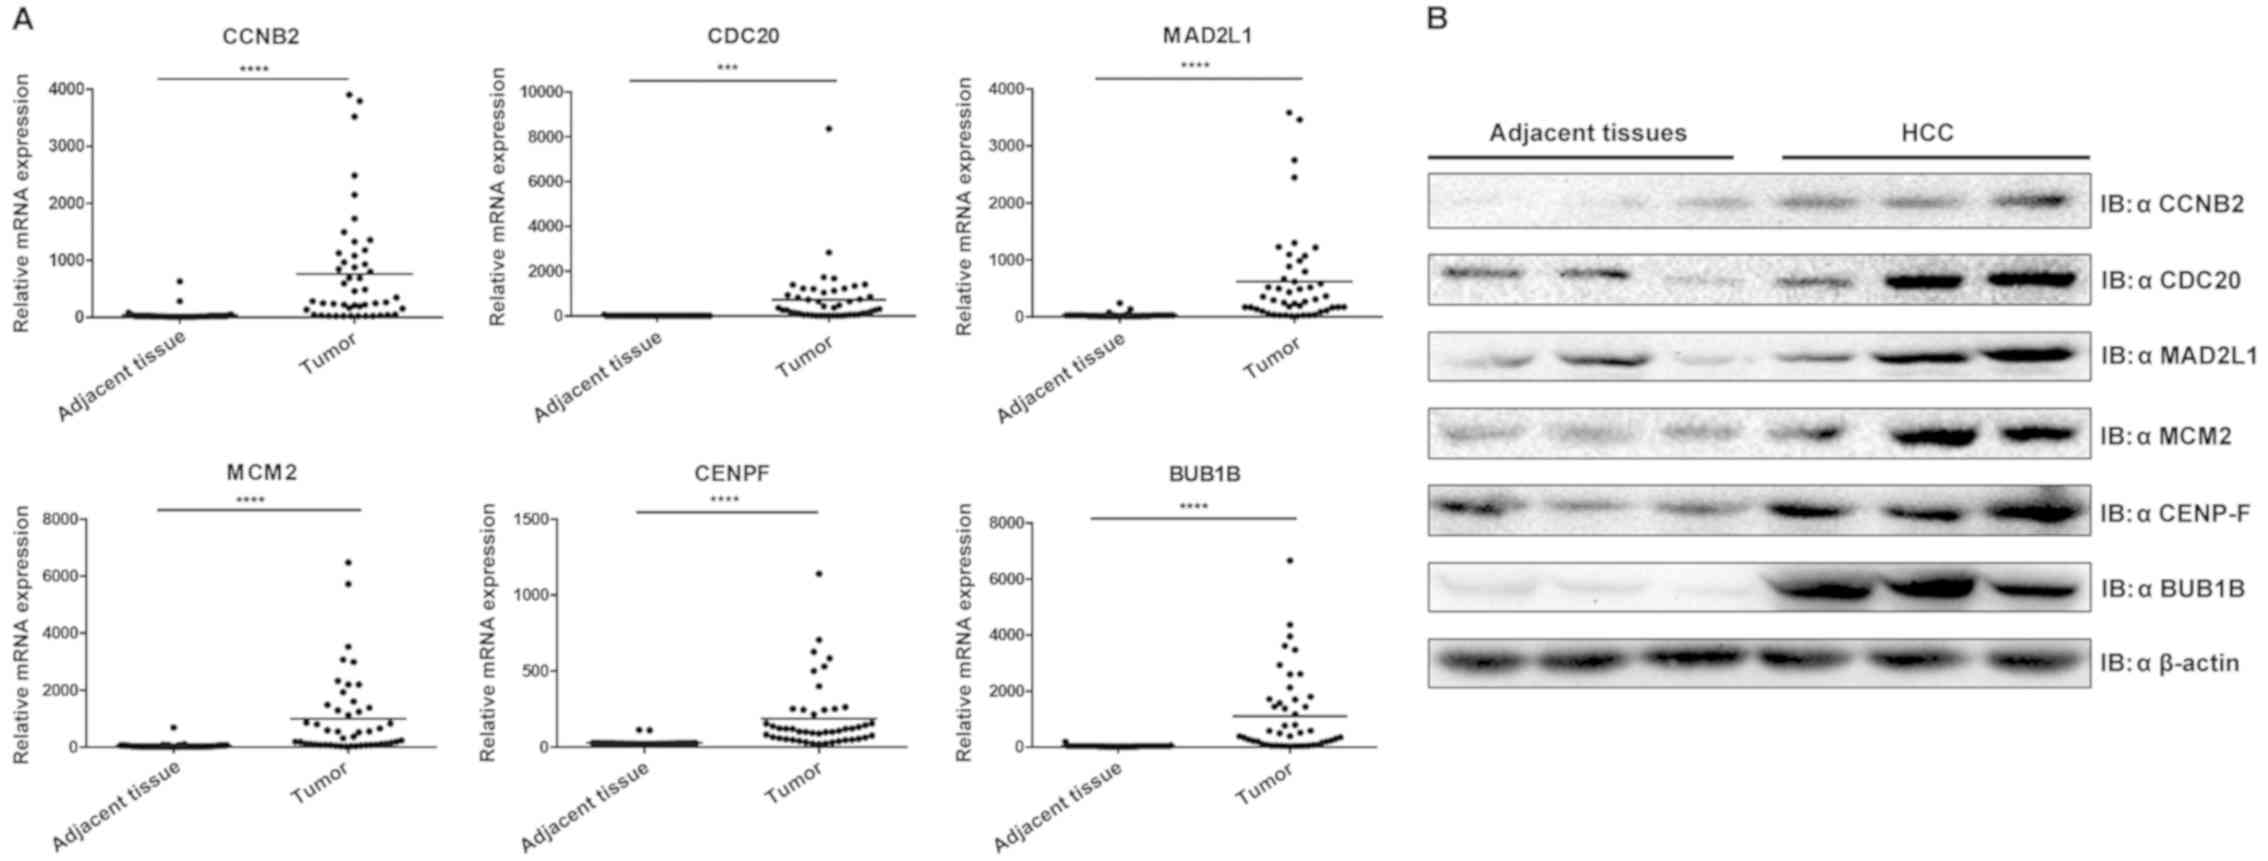 | Figure 6.Validation of six hub genes through
experiments. (A) Validation of hub genes by reverse
transcription-quantitative PCR. Boxplots indicate the medians and
dispersions of 47 HCC and their adjacent tissue samples. P-values
were determined using a Student' t-test. ***P<0.001 and
****P<0.0001 with comparisons shown by lines. (B) Western
blotting detection of hub genes. Lysates from 3 pairs of HCC and
adjacent tissues were subjected to western blotting with antibodies
against CCNB2, CDC20, MAD2L1, MCM2, CENPF and BUB1B. β-actin was
used as the reference gene. HCC, hepatocellular carcinoma; CCNB2,
cyclin B2; CDC20, cell division cycle 20; MAD2L1, mitotic arrest
deficient 2 like 1; MCM2 minichromosome maintenance complex
component 2; CENPF, centromere protein F; BUB1B, BUB mitotic
checkpoint serine/threonine kinase B. |
Discussion
It is well known that HCC is a prevalent primary
cancer of the liver that occurs in numerous countries (40). However, there is a lack of consensus
about its therapeutic practice, which is primarily due to the
insufficient elucidation of the molecular mechanism underlying HCC
(41). For clinical treatment, the
detection of HCC in its early stage is important and providing
treatment based on the molecular mechanism of HCC would be ideal.
The present study comprehensively analyzed the gene expression
profiles of HCC to determine the hub genes that may serve an
indispensable function in HCC gene therapy.
In the present study, three data sets from the GEO
database, GSE14323, GSE14520 and GSE17967, were used due to their
large sample size to satisfy this analysis, and which all use the
Affymetrix HG-U133A series annotation set to avoid losing numerous
genes when merging the data. In addition, approximately
three-quarters of HCCs are attributed to chronic HBV and HCV
infections (42). The present study
considered this factor when selecting the data, and thus these
three data sets contain patients with HCC infected with these two
viruses. By performing routine analysis, the present study
identified 657 DEGs in HCC tissues when compared with their
adjacent non-tumor tissues. Among them, 386 genes were upregulated
and 271 genes were downregulated. The results of GO and KEGG
analyses revealed that biological processes and pathways were
enriched in cell cycle-associated processes, which is congruent to
the results obtained in previous studies (9,43). The
present study also demonstrated that the oxidation-reduction
process was the most significant in HCC. A previous study
determined that the reduction of fatty acid oxidation is associated
with HCC progression (44). However,
the traditional analysis of gene expression microarray data tends
to identify individual genes that exhibit different expressions
between two groups (40). This may
be insufficient, as certain biological processes may be influenced
by a slight change of individual genes or an entire gene network
(43). GSEA represents a good tool
to combat this problem. Therefore, to validate the results DEG
analysis, the present study used GSEA to interpret the gene
expression matrix at the whole transcriptome level. The results of
GSEA were similar to those obtained via GO and KEGG DEG enrichment
analysis. To further analyze co-expression and PPI networks, the
WGCNA algorithm was superimposed onto the PPI STRING database.
Cluster modules were screened out using the hierarchical cluster
tree and topological overlapping matrix, and annotated via GO and
KEGG. The resulting intricate network was predigested into modules,
which were used to analyze core connections or hub genes. Survival
analyses in 36 candidate hub genes were performed in the present
study. A total of six genes were determined to be significantly
associated with clinical prognosis. In addition, the transcription
factors and miRNAs of six hub genes were predicted. Each are
involved in the transcriptional and post-transcriptional regulation
of gene expression. They may serve important regulatory functions
in numerous biological processes, including differentiation,
metabolism, development and cellular signaling (45). Thus, the identification of gene
targets is important for the functional characterization of
transcription factors and miRNAs and gives novel insights into the
biological processes that may produce biomarkers and predictors of
drug response for the disease.
The results of the present study demonstrated that
CCNB2, CDC20, MAD2L1, MCM2, CENPF and BUB1B were important to HCC
and may directly or indirectly regulate its progression. These
results were partially congruent with a previous study, which
indicated that CENPF and BUB1B were good predictors of HCC therapy
(9). In addition, CCNB2 is key
protein of the cyclin family and regulates the progression of the
G2/M transition during the cell cycle (46). Furthermore, CCNB2, MAD2L1 and MCM2
are mitotic checkpoint associated proteins that are overexpressed
in numerous types of human cancer (47–49). The
dysregulation of mitotic checkpoints may also result in aneuploidy
and the promotion of tumorigenesis (50). Next, the two genes CCNB2 and CDC20
are discussed. It was reported that CCNB2 was upregulated and was
associated with degree of differentiation, tumor size, lymph node
metastasis, distant metastasis and clinical stage, which
represented a poor prognosis in patients with non-small cell lung
carcinoma by survival analysis (51). The invasion and metastasis of bladder
cancer was also inhibited by decreasing CCNB2, which prolonged the
survival time of mice (52,53). On the contrary, CCNB2 overexpression
promoted the cell proliferation and tumor growth of gastric cancer
(46). Shubbar et al
(54) reported that CCNB2
overexpression is an independent prognostic marker for breast
cancer disease-specific survival time, as the c-index of CCNB2
alone is 0.662 and the prediction accuracy is improved with the
passage of time. In the BEL-7404 HCC cell line, the downregulation
of CCNB2 promotes apoptosis and may explain why the overexpression
of CCNB2 results in the malignant potential of HCC (55). Another previous study also confirmed
that CCNB2 knockdown inhibits tumor metastasis and prolongs the
survival time of tumor-bearing nude mice (52). Based on these results, it was
concluded that CCNB2 may be a key oncogenic target and is
associated with HCC prognosis. CDC20 is one of the anaphase
promoting complex (APC) activators and performs its functions via
the ubiquitination and degradation of downstream substrates
(56). Mounting evidence has
determined that CDC20 is an accelerator of tumorigenesis and is
overexpressed in numerous types of human cancer (57,58). For
example, CDC20 expression is higher in pancreatic carcinoma
compared with normal pancreatic tissue or chronic pancreatitis
tissue (59). The depletion of CDC20
has also been demonstrated to contain cell growth and promote G2/M
arrest (60,61). The expression of CDC20 has also been
positively correlated with Tumor-Node-Metastasis stage and HCC
differentiation (61). Considering
the crucial function of CDC20 in tumorigenesis, an inhibitor of
CDC20 may afford a medicinal window in a number of different human
malignancies. To this end, the discovery and development of small
molecule inhibitors that specifically target CDC20 oncoproteins may
be a novel strategy for the treatment of a variety of human cancer
types. For example, Zeng et al (62) proved that a small molecule, known as
tosyl-L-arginine methyl ester, may weaken the interaction between
APC and CDC20 and subsequent inhibit APC E3 ligase activity.
Withaferin A is extracted from Withania somnifera, which has been
identified to possess anti-tumor properties (56). It was reported that Withaferin A may
gave rise to G2/M phase arrest and apoptosis in colorectal cancer
(63). Furthermore, withaferin A may
result in mitotic delay by degrading CDC20 and MAD2L1, indicating
that inhibiting CDC20 may be a mechanism underlying the anti-cancer
character of withaferin A (63).
Other small molecules, including N-alkylated amino acid-derived
sulfonamide hydroxamate (64),
Ganodermanontriol (65), CFM-4 and
BCHHD (66) were also proven to be
anti-tumor drugs by targeting CDC20. Given the evident function of
CDC20 in tumorigenesis, CDC20 may serve as a biomarker or drug
target of HCC gene therapy.
The present study reported the biomarkers of HCC,
which serve important functions in cancer detection and treatment.
Cancer biomarkers are designed from tumor tissues, serum, DNA,
enzymes, transcription factors and other proteins that may be
measured, estimated and utilized as indicators of important
biological process, pathways or pharmacological responses (67). Altogether, the integrated analysis of
microarray data revealed six hub genes involved in cell cycle
associated processes, which may be good indicators for HCC
detection or therapy. Despite the oxidation-reduction process being
notably involved in HCC, the present study failed to screen the hub
genes as biomarkers for clinical prognosis. Future confirmatory
experiments are therefore required to validate the results of the
present study.
Acknowledgements
Not applicable.
Funding
No funding was received.
Availability of data and materials
The datasets used and/or analyzed during the current
study are available from the corresponding author on reasonable
request.
Authors' contributions
LH conceived and designed the study. HL, NW and YM
collected analyzed the data. HL wrote the manuscript. HL, XW, ZZ,
SZ XY and SL collected the samples and revised the manuscript. All
authors read and approved the manuscript.
Ethics approval and consent to
participate
The present study was performed in accordance with
the recommendations of the Council for International Organization
of Medical Sciences. The protocol was ethically approved by the
institutional review boards of the People's Hospital of Liaoning
Province (Liaoning, China). All subjects provided written informed
consent in accordance with the Declaration of Helsinki.
Patient consent for publication
Not applicable.
Competing interests
The authors declare that they have no competing
interests.
References
|
1
|
Ferlay J, Shin HR, Bray F, Forman D,
Mathers C and Parkin DM: Estimates of worldwide burden of cancer in
2008: GLOBOCAN 2008. Int J Cancer. 127:2893–2917. 2010. View Article : Google Scholar : PubMed/NCBI
|
|
2
|
Mittal S and El-Serag HB: Epidemiology of
hepatocellular carcinoma: Consider the population. J Clin
Gastroenterol. 47 (Suppl):S2–S6. 2013. View Article : Google Scholar : PubMed/NCBI
|
|
3
|
El-Serag HB: Hepatocellular carcinoma: An
epidemiologic view. J Clin Gastroenterol. 35 (Suppl 2):S72–S78.
2002. View Article : Google Scholar : PubMed/NCBI
|
|
4
|
Yang JD and Roberts LR: Hepatocellular
carcinoma: A global view. Nat Rev Gastroenterol Hepatol. 7:448–458.
2010. View Article : Google Scholar : PubMed/NCBI
|
|
5
|
Ho DW, Kai AK and Ng IO: TCGA
whole-transcriptome sequencing data reveals significantly
dysregulated genes and signaling pathways in hepatocellular
carcinoma. Front Med. 9:322–330. 2015. View Article : Google Scholar : PubMed/NCBI
|
|
6
|
Ho DW, Yang ZF, Yi K, Lam CT, Ng MN, Yu
WC, Lau J, Wan T, Wang X, Yan Z, et al: Gene expression profiling
of liver cancer stem cells by RNA-sequencing. PLos One.
7:e371592012. View Article : Google Scholar : PubMed/NCBI
|
|
7
|
Mazzola A, Costantino A, Petta S,
Bartolotta TV, Raineri M, Sacco R, Brancatelli G, Cammà C and
Cabibbo G: Recurrence of hepatocellular carcinoma after liver
transplantation: An update. Future Oncol. 11:2923–2936. 2015.
View Article : Google Scholar : PubMed/NCBI
|
|
8
|
Regalia E, Fassati LR, Valente U,
Pulvirenti A, Damilano I, Dardano G, Montalto F, Coppa J and
Mazzaferro V: Pattern and management of recurrent hepatocellular
carcinoma after liver transplantation. J Hepatobiliary Pancreat
Surg. 5:29–34. 1998. View Article : Google Scholar : PubMed/NCBI
|
|
9
|
Sun B, Lin G, Ji D, Li S, Chi G and Jin X:
Dysfunction of sister chromatids separation promotes progression of
hepatocellular carcinoma according to analysis of gene expression
profiling. Front Physiol. 9:10192018. View Article : Google Scholar : PubMed/NCBI
|
|
10
|
Chaisaingmongkol J, Budhu A, Dang H,
Rabibhadana S, Pupacdi B, Kwon SM, Forgues M, Pomyen Y,
Bhudhisawasdi V, Lertprasertsuke N, et al: Common molecular
subtypes among asian hepatocellular carcinoma and
cholangiocarcinoma. Cancer Cell. 32:57–70.e3. 2017. View Article : Google Scholar : PubMed/NCBI
|
|
11
|
Lin KT, Shann YJ, Chau GY, Hsu CN and
Huang CY: Identification of latent biomarkers in hepatocellular
carcinoma by ultra-deep whole-transcriptome sequencing. Oncogene.
33:4786–4794. 2014. View Article : Google Scholar : PubMed/NCBI
|
|
12
|
Mas VR, Maluf DG, Archer KJ, Yanek K, Kong
X, Kulik L, Freise CE, Olthoff KM, Ghobrial RM, McIver P and Fisher
R: Genes involved in viral carcinogenesis and tumor initiation in
hepatitis C virus-induced hepatocellular carcinoma. Mol Med.
15:85–94. 2009. View Article : Google Scholar : PubMed/NCBI
|
|
13
|
Roessler S, Jia HL, Budhu A, Forgues M, Ye
QH, Lee JS, Thorgeirsson SS, Sun Z, Tang ZY, Qin LX and Wang XW: A
unique metastasis gene signature enables prediction of tumor
relapse in early-stage hepatocellular carcinoma patients. Cancer
Res. 70:10202–10212. 2010. View Article : Google Scholar : PubMed/NCBI
|
|
14
|
Edgar R, Domrachev M and Lash AE: Gene
Expression Omnibus: NCBI gene expression and hybridization array
data repository. Nucleic Acids Res. 30:207–210. 2002. View Article : Google Scholar : PubMed/NCBI
|
|
15
|
Archer KJ, Mas VR, David K, Maluf DG,
Bornstein K and Fisher RA: Identifying genes for establishing a
multigenic test for hepatocellular carcinoma surveillance in
hepatitis C virus-positive cirrhotic patients. Cancer Epidemiol
Biomarkers Prev. 18:2929–2932. 2009. View Article : Google Scholar : PubMed/NCBI
|
|
16
|
Wilson C and Miller C: Simpleaffy: A
BioConductor package for Affymetrix quality control and data
analysis. Bioinformatics. 21:3683–3685. 2005. View Article : Google Scholar : PubMed/NCBI
|
|
17
|
Ritchie ME, Phipson B, Wu D, Hu Y, Law CW,
Shi W and Smyth GK: Limma powers differential expression analyses
for RNA-sequencing and microarray studies. Nucleic Acids Res.
43:e472015. View Article : Google Scholar : PubMed/NCBI
|
|
18
|
Ashburner M, Ball CA, Blake JA, Botstein
D, Butler H, Cherry JM, Davis AP, Dolinski K, Dwight SS, Eppig JT,
et al: Gene ontology: Tool for the unification of biology. The Gene
Ontology Consortium. Nat Genet. 25:25–29. 2000. View Article : Google Scholar : PubMed/NCBI
|
|
19
|
The Gene Ontology Consortium: The Gene
Ontology Resource: 20 years and still GOing strong. Nucleic Acids
Res. 47:D330–D338. 2019. View Article : Google Scholar : PubMed/NCBI
|
|
20
|
Kanehisa M, Sato Y, Kawashima M, Furumichi
M and Tanabe M: KEGG as a reference resource for gene and protein
annotation. Nucleic Acids Res. 44:D457–D462. 2016. View Article : Google Scholar : PubMed/NCBI
|
|
21
|
Huang da W, Sherman BT and Lempicki RA:
Bioinformatics enrichment tools: Paths toward the comprehensive
functional analysis of large gene lists. Nucleic Acids Res.
37:1–13. 2009. View Article : Google Scholar : PubMed/NCBI
|
|
22
|
Huang da W, Sherman BT and Lempicki RA:
Systematic and integrative analysis of large gene lists using DAVID
bioinformatics resources. Nat Protoc. 4:44–57. 2009. View Article : Google Scholar : PubMed/NCBI
|
|
23
|
Walter W, Sánchez-Cabo F and Ricote M:
GOplot: An R package for visually combining expression data with
functional analysis. Bioinformatics. 31:2912–2914. 2015. View Article : Google Scholar : PubMed/NCBI
|
|
24
|
Subramanian A, Kuehn H, Gould J, Tamayo P
and Mesirov JP: GSEA-P: A desktop application for Gene Set
Enrichment Analysis. Bioinformatics. 23:3251–3253. 2007. View Article : Google Scholar : PubMed/NCBI
|
|
25
|
Szklarczyk D, Franceschini A, Wyder S,
Forslund K, Heller D, Huerta-Cepas J, Simonovic M, Roth A, Santos
A, Tsafou KP, et al: STRING v10: Protein-protein interaction
networks, integrated over the tree of life. Nucleic Acids Res.
43((Database Issue)): D447–D452. 2015. View Article : Google Scholar : PubMed/NCBI
|
|
26
|
Langfelder P and Horvath S: WGCNA: An R
package for weighted correlation network analysis. BMC
Bioinformatics. 9:5592008. View Article : Google Scholar : PubMed/NCBI
|
|
27
|
Langfelder P, Zhang B and Horvath S:
Defining clusters from a hierarchical cluster tree: The Dynamic
Tree Cut package for R. Bioinformatics. 24:719–720. 2008.
View Article : Google Scholar : PubMed/NCBI
|
|
28
|
Ravasz E, Somera AL, Mongru DA, Oltvai ZN
and Barabasi AL: Hierarchical organization of modularity in
metabolic networks. Science. 297:1551–1555. 2002. View Article : Google Scholar : PubMed/NCBI
|
|
29
|
Yu G, Wang LG, Han Y and He QY:
clusterProfiler: An R package for comparing biological themes among
gene clusters. OMICS. 16:284–287. 2012. View Article : Google Scholar : PubMed/NCBI
|
|
30
|
Shannon P, Markiel A, Ozier O, Baliga NS,
Wang JT, Ramage D, Amin N, Schwikowski B and Ideker T: Cytoscape: A
software environment for integrated models of biomolecular
interaction networks. Genome Res. 13:2498–2504. 2003. View Article : Google Scholar : PubMed/NCBI
|
|
31
|
Colaprico A, Silva TC, Olsen C, Garofano
L, Cava C, Garolini D, Sabedot TS, Malta TM, Pagnotta SM,
Castiglioni I, et al: TCGAbiolinks: An R/Bioconductor package for
integrative analysis of TCGA data. Nucleic Acids Res. 44:e712016.
View Article : Google Scholar : PubMed/NCBI
|
|
32
|
Zhou G, Soufan O, Ewald J, Hancock REW,
Basu N and Xia J: NetworkAnalyst 3.0: A visual analytics platform
for comprehensive gene expression profiling and meta-analysis.
Nucleic Acids Res. 47:W234–W241. 2019. View Article : Google Scholar : PubMed/NCBI
|
|
33
|
Davis CA, Hitz BC, Sloan CA, Chan ET,
Davidson JM, Gabdank I, Hilton JA, Jain K, Baymuradov UK, Narayanan
AK, et al: The Encyclopedia of DNA elements (ENCODE): Data portal
update. Nucleic Acids Res. 46:D794–D801. 2018. View Article : Google Scholar : PubMed/NCBI
|
|
34
|
Sticht C, De La Torre C, Parveen A and
Gretz N: miRWalk: An online resource for prediction of microRNA
binding sites. PLoS One. 13:e02062392018. View Article : Google Scholar : PubMed/NCBI
|
|
35
|
John B, Enright AJ, Aravin A, Tuschl T,
Sander C and Marks DS: Human MicroRNA targets. PLoS Biol.
2:e3632004. View Article : Google Scholar : PubMed/NCBI
|
|
36
|
Miranda KC, Huynh T, Tay Y, Ang YS, Tam
WL, Thomson AM, Lim B and Rigoutsos I: A pattern-based method for
the identification of MicroRNA binding sites and their
corresponding heteroduplexes. Cell. 126:1203–1217. 2006. View Article : Google Scholar : PubMed/NCBI
|
|
37
|
Agarwal V, Bell GW, Nam JW and Bartel DP:
Predicting effective microRNA target sites in mammalian mRNAs.
Elife. 4:2015. View Article : Google Scholar
|
|
38
|
Livak KJ and Schmittgen TD: Analysis of
relative gene expression data using real-time quantitative PCR and
the 2(-Delta Delta C(T)) method. Methods. 25:402–408. 2001.
View Article : Google Scholar : PubMed/NCBI
|
|
39
|
Johnson WE, Li C and Rabinovic A:
Adjusting batch effects in microarray expression data using
empirical Bayes methods. Biostatistics. 8:118–127. 2007. View Article : Google Scholar : PubMed/NCBI
|
|
40
|
Blum HE: Treatment of hepatocellular
carcinoma. Best Pract Res Clin Gastroenterol. 19:129–145. 2005.
View Article : Google Scholar : PubMed/NCBI
|
|
41
|
Raza A and Sood GK: Hepatocellular
carcinoma review: Current treatment, and evidence-based medicine.
World J Gastroenterol. 20:4115–4127. 2014. View Article : Google Scholar : PubMed/NCBI
|
|
42
|
Oishi N, Kumar MR, Roessler S, Ji J,
Forgues M, Budhu A, Zhao X, Andersen JB, Ye QH, Jia HL, et al:
Transcriptomic profiling reveals hepatic stem-like gene signatures
and interplay of miR-200c and epithelial-mesenchymal transition in
intrahepatic cholangiocarcinoma. Hepatology. 56:1792–1803. 2012.
View Article : Google Scholar : PubMed/NCBI
|
|
43
|
Yin L, Chang C and Xu C: G2/M checkpoint
plays a vital role at the early stage of HCC by analysis of key
pathways and genes. Oncotarget. 8:76305–76317. 2017. View Article : Google Scholar : PubMed/NCBI
|
|
44
|
Tanaka M, Masaki Y, Tanaka K, Miyazaki M,
Kato M, Sugimoto R, Nakamura K, Aishima S, Shirabe K, Nakamuta M,
et al: Reduction of fatty acid oxidation and responses to hypoxia
correlate with the progression of de-differentiation in HCC. Mol
Med Rep. 7:365–370. 2013. View Article : Google Scholar : PubMed/NCBI
|
|
45
|
Jinawath N, Chamgramol Y, Furukawa Y,
Obama K, Tsunoda T, Sripa B, Pairojkul C and Nakamura Y: Comparison
of gene expression profiles between Opisthorchis viverrini
and non-Opisthorchis viverrini associated human intrahepatic
cholangiocarcinoma. Hepatology. 44:1025–1038. 2006. View Article : Google Scholar : PubMed/NCBI
|
|
46
|
Shi Q, Wang W, Jia Z, Chen P, Ma K and
Zhou C: ISL1, a novel regulator of CCNB1, CCNB2 and c-MYC genes,
promotes gastric cancer cell proliferation and tumor growth.
Oncotarget. 7:36489–36500. 2016. View Article : Google Scholar : PubMed/NCBI
|
|
47
|
Zhang X, Teng Y, Yang F, Wang M, Hong X,
Ye LG, Gao YN and Chen GY: MCM2 is a therapeutic target of
lovastatin in human non-small cell lung carcinomas. Oncol Rep.
33:2599–2605. 2015. View Article : Google Scholar : PubMed/NCBI
|
|
48
|
Shi YX, Zhu T, Zou T, Zhuo W, Chen YX,
Huang MS, Zheng W, Wang CJ, Li X, Mao XY, et al: Prognostic and
predictive values of CDK1 and MAD2L1 in lung adenocarcinoma.
Oncotarget. 7:85235–85243. 2016. View Article : Google Scholar : PubMed/NCBI
|
|
49
|
Jin B, Wang W, Du G, Huang GZ, Han LT,
Tang ZY, Fan DG, Li J and Zhang SZ: Identifying hub genes and
dysregulated pathways in hepatocellular carcinoma. Eur Rev Med
Pharmacol Sci. 19:592–601. 2015.PubMed/NCBI
|
|
50
|
Hanna MO, Zayed NA, Darwish H and Girgis
SI: Asynchronous DNA replication and aneuploidy in lymphocytes of
hepatocellular carcinoma patients. Cancer Genetics. 205:636–643.
2012. View Article : Google Scholar : PubMed/NCBI
|
|
51
|
Qian X, Song X, He Y, Yang Z, Sun T, Wang
J, Zhu G, Xing W and You C: CCNB2 overexpression is a poor
prognostic biomarker in Chinese NSCLC patients. Biomed
Pharmacother. 74:222–227. 2015. View Article : Google Scholar : PubMed/NCBI
|
|
52
|
Lei CY, Wang W, Zhu YT, Fang WY and Tan
WL: The decrease of cyclin B2 expression inhibits invasion and
metastasis of bladder cancer. Urol Oncol. 34:237.e1–e10. 2016.
View Article : Google Scholar
|
|
53
|
Mo ML, Chen Z, Li J, Li HL, Sheng Q, Ma
HY, Zhang FX, Hua YW, Zhang X, Sun DQ, et al: Use of serum
circulating CCNB2 in cancer surveillance. Int J Biol Markers.
25:236–242. 2010. View Article : Google Scholar : PubMed/NCBI
|
|
54
|
Shubbar E, Kovács A, Hajizadeh S, Parris
TZ, Nemes S, Gunnarsdóttir K, Einbeigi Z, Karlsson P and Helou K:
Elevated cyclin B2 expression in invasive breast carcinoma is
associated with unfavorable clinical outcome. BMC Cancer. 13:12013.
View Article : Google Scholar : PubMed/NCBI
|
|
55
|
Li R, Jiang X, Zhang Y, Wang S, Chen X, Yu
X, Ma J and Huang X: Cyclin B2 overexpression in human
hepatocellular carcinoma is associated with poor prognosis. Arch
Med Res. 50:10–17. 2019. View Article : Google Scholar : PubMed/NCBI
|
|
56
|
Wang L, Zhang J, Wan L, Zhou X, Wang Z and
Wei W: Targeting Cdc20 as a novel cancer therapeutic strategy.
Pharmacol Ther. 151:141–151. 2015. View Article : Google Scholar : PubMed/NCBI
|
|
57
|
Yuan B, Xu Y, Woo JH, Wang Y, Bae YK, Yoon
DS, Wersto RP, Tully E, Wilsbach K and Gabrielson E: Increased
expression of mitotic checkpoint genes in breast cancer cells with
chromosomal instability. Clin Cancer Res. 12:405–410. 2006.
View Article : Google Scholar : PubMed/NCBI
|
|
58
|
Wu WJ, Hu KS, Wang DS, Zeng ZL, Zhang DS,
Chen DL, Bai L and Xu RH: CDC20 overexpression predicts a poor
prognosis for patients with colorectal cancer. J Transl Med.
11:1422013. View Article : Google Scholar : PubMed/NCBI
|
|
59
|
Chang DZ, Ma Y, Ji B, Liu Y, Hwu P,
Abbruzzese JL, Logsdon C and Wang H: Increased CDC20 expression is
associated with pancreatic ductal adenocarcinoma differentiation
and progression. J Hematol Oncol. 5:152012. View Article : Google Scholar : PubMed/NCBI
|
|
60
|
Taniguchi K, Momiyama N, Ueda M, Matsuyama
R, Mori R, Fujii Y, Ichikawa Y, Endo I, Togo S and Shimada H:
Targeting of CDC20 via small interfering RNA causes enhancement of
the cytotoxicity of chemoradiation. Anticancer Res. 28:1559–1563.
2008.PubMed/NCBI
|
|
61
|
Li J, Gao JZ, Du JL, Huang ZX and Wei LX:
Increased CDC20 expression is associated with development and
progression of hepatocellular carcinoma. Int J Oncol. 45:1547–1555.
2014. View Article : Google Scholar : PubMed/NCBI
|
|
62
|
Zeng X, Sigoillot F, Gaur S, Choi S, Pfaff
KL, Oh DC, Hathaway N, Dimova N, Cuny GD and King RW: Pharmacologic
inhibition of the anaphase-promoting complex induces a spindle
checkpoint-dependent mitotic arrest in the absence of spindle
damage. Cancer Cell. 18:382–395. 2010. View Article : Google Scholar : PubMed/NCBI
|
|
63
|
Das T, Roy KS, Chakrabarti T, Mukhopadhyay
S and Roychoudhury S: Withaferin A modulates the Spindle assembly
checkpoint by degradation of Mad2-Cdc20 complex in colorectal
cancer cell lines. Biochem Pharmacol. 91:31–39. 2014. View Article : Google Scholar : PubMed/NCBI
|
|
64
|
Jiang J, Thyagarajan-Sahu A, Krchňák V,
Jedinak A, Sandusky GE and Sliva D: NAHA, a novel hydroxamic
acid-derivative, inhibits growth and angiogenesis of breast cancer
in vitro and in vivo. PLoS One. 7:e342832012. View Article : Google Scholar : PubMed/NCBI
|
|
65
|
Regenbrecht CR, Jung M, Lehrach H and
Adjaye J: The molecular basis of genistein-induced mitotic arrest
and exit of self-renewal in embryonal carcinoma and primary cancer
cell lines. BMC Med Genomics. 1:492008. View Article : Google Scholar : PubMed/NCBI
|
|
66
|
Nasr T, Bondock S and Youns M: Anticancer
activity of new coumarin substituted hydrazide-hydrazone
derivatives. Eur J Med Chem. 76:539–548. 2014. View Article : Google Scholar : PubMed/NCBI
|
|
67
|
Golubnitschaja O and Flammer J: What are
the biomarkers for glaucoma? Survey Ophthalmol. 52
(Suppl):S155–S161. 2007. View Article : Google Scholar
|